Fine-tuning citrate synthase flux potentiates and refines metabolic innovation in the Lenski evolution experiment
- The University of Texas at Austin, United States
- Michigan State University, United States
Figures
Figure 1
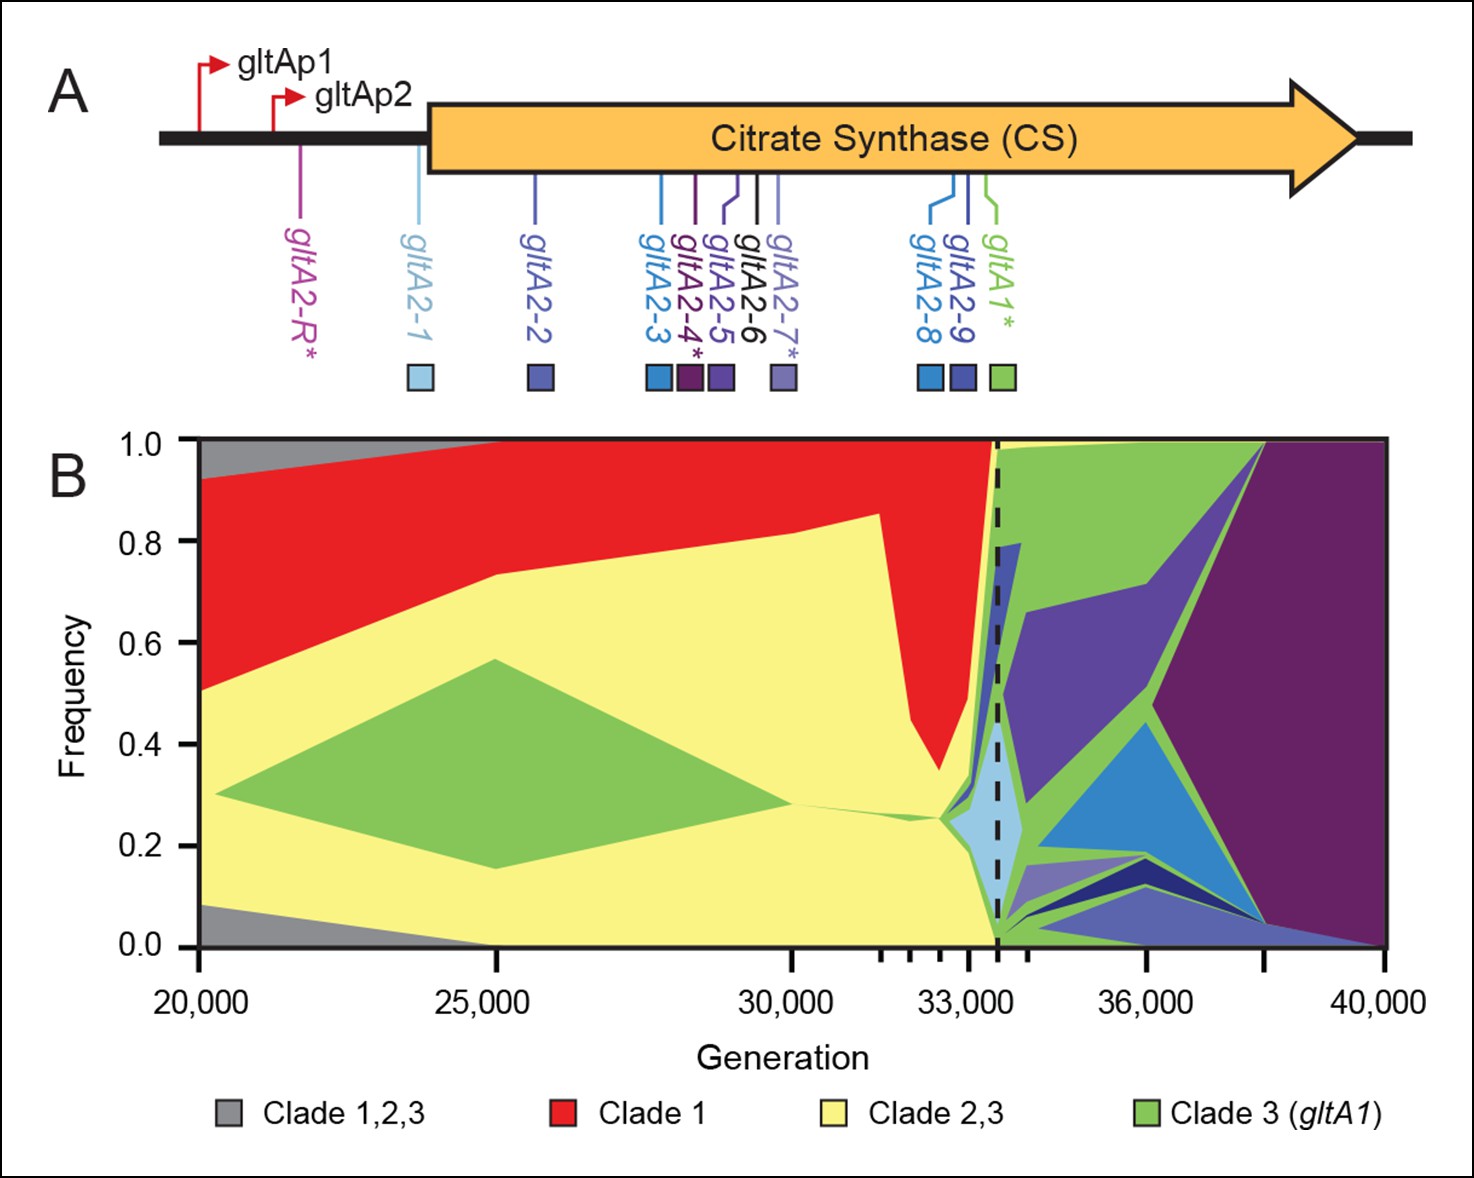
Diversity and dynamics of gltA mutations in the E. coli population that evolved citrate utilization during the Lenski long-term experiment (LTEE).
(A) Mutations observed in the citrate synthase protein-coding sequence or upstream intergenic region. The gltA1 mutation evolved first in the LTEE. Many secondary gltA mutations later evolved independently in the LTEE (numbered gltA2 alleles) or in a previous genetic study (gltA2-R). All gltA2 mutations occurred in genetic backgrounds that included gltA1 and the citT and dctA* mutations that confer robust citrate utilization (Quandt et al., 2014). The effects of starred gltA mutations on citrate synthase activity were experimentally characterized in this study. Transcription start sites are labeled gltAp1 and gltAp2 (Wilde and Guest, 1986). See Figure 1—source data 1 for the DNA and protein sequence changes caused by each gltA mutation. (B) Muller plot of evolved allele frequencies over time constructed by using metagenomic DNA sequencing to profile archived samples of the LTEE population. Shaded regions correspond to the frequencies of genetically diverged subpopulations distinguished by different evolved alleles. When a colored sector arises within another region, it is a descendant of that genotype with at least this one new mutation and all of the mutations present in the earlier genotype because these populations are strictly asexual. Clades 1–3 correspond to a phylogenetic tree previously constructed by sequencing the genomes of clonal isolates (Blount et al., 2012), which also constrains the order of certain mutations (e.g., gltA1 < citT < dctA* < any gltA2). Each of the gltA2 alleles (shaded as in panel A) evolved independently and defines a separate evolved genotype and all of its descendants. Sequencing was performed on population samples from the times indicated with tick marks, and allele dynamics are shown as linearly interpolated between these points. The cell density of the entire LTEE population increased just prior to the dashed line at 33,500 generations (Blount et al., 2008) when refined Clade 3 Cit++ genotypes containing the citT and dctA* mutations evolved (Blount et al., 2012). Figure 1—source data 2 shows the mutations used to track the different clades.
-
Figure 1—source data 1
Details for all gltA alleles in this study.
- https://doi.org/10.7554/eLife.09696.004
-
Figure 1—source data 2
Mutations used to track clade dynamics in the LTEE.
- https://doi.org/10.7554/eLife.09696.005
Figure 2
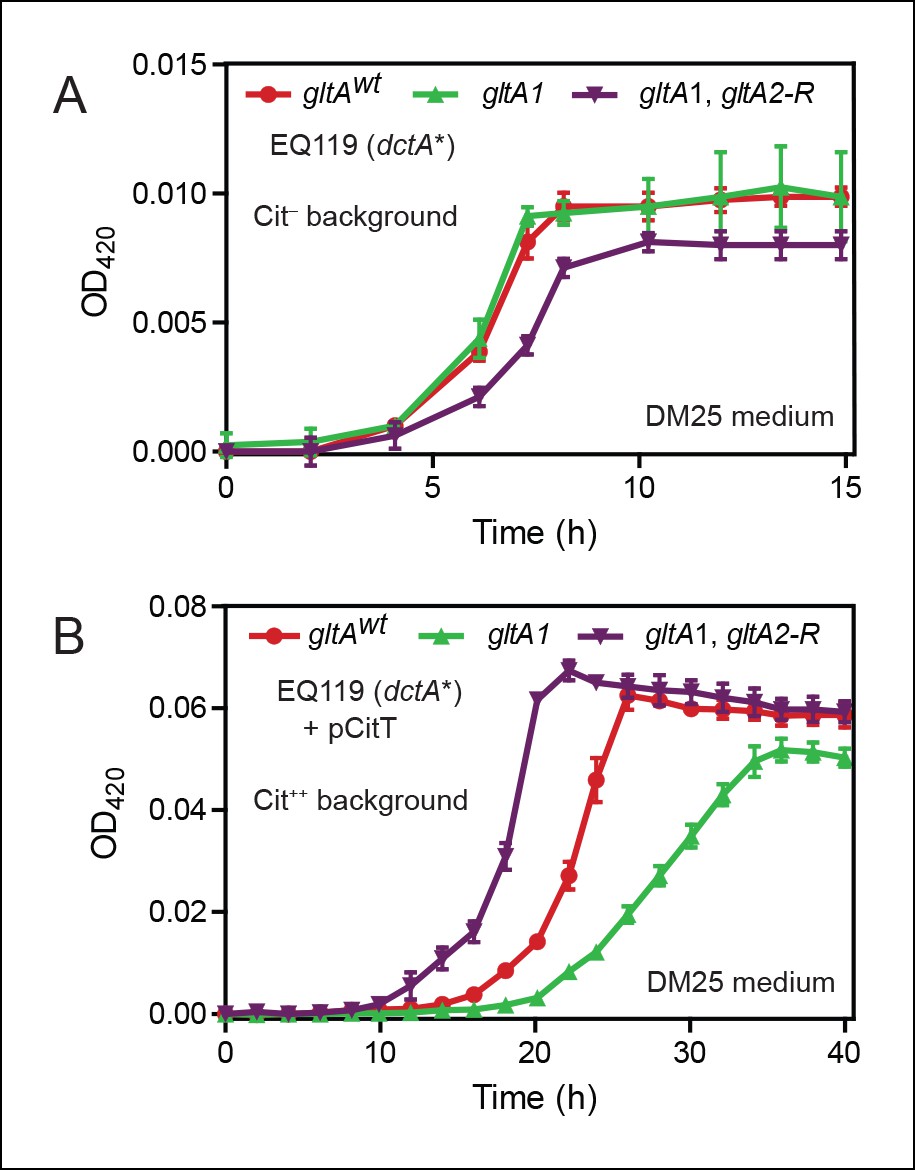
Effects of gltA alleles on growth depend on the nutrient utilization niche.
(A) Growth curves of Cit– strain EQ119 containing just the evolved dctA* mutation and EQ119-derived strains reconstructed with evolved gltA alleles. Growth was measured in the DM25 medium used in the LTEE, which contains 0.0025% glucose (w/v) and 0.032% citrate (w/v). These results show that gltA1 allele has no significant effect on growth when placed into a Cit– genetic background. Further addition of the gltA2-R mutation that evolved in a Cit++ genetic background greatly inhibits growth in this genetic background that cannot utilize citrate. Error bars are the S. D. of at least three replicates. (B) Growth curves of the same EQ119-derived strains transformed with plasmid pCitT in DM25 medium. pCitT contains the activated rnk-citT promoter configuration that evolved in the LTEE; it enables strains like EQ119 with the dctA* mutation to fully utilize citrate (Cit++ phenotype) (Quandt et al., 2014). In the Cit++ genetic context, the gltA1 allele that evolved in a Cit– genetic background in the LTEE is very deleterious to growth. However, adding the gltA2 allele to this genetic background suppresses the deleterious effect of the gltA1 allele and results in further improved growth characteristics compared to the strain containing the gltAwt allele. Error bars are the S. D. of at least three replicates.
Figure 3
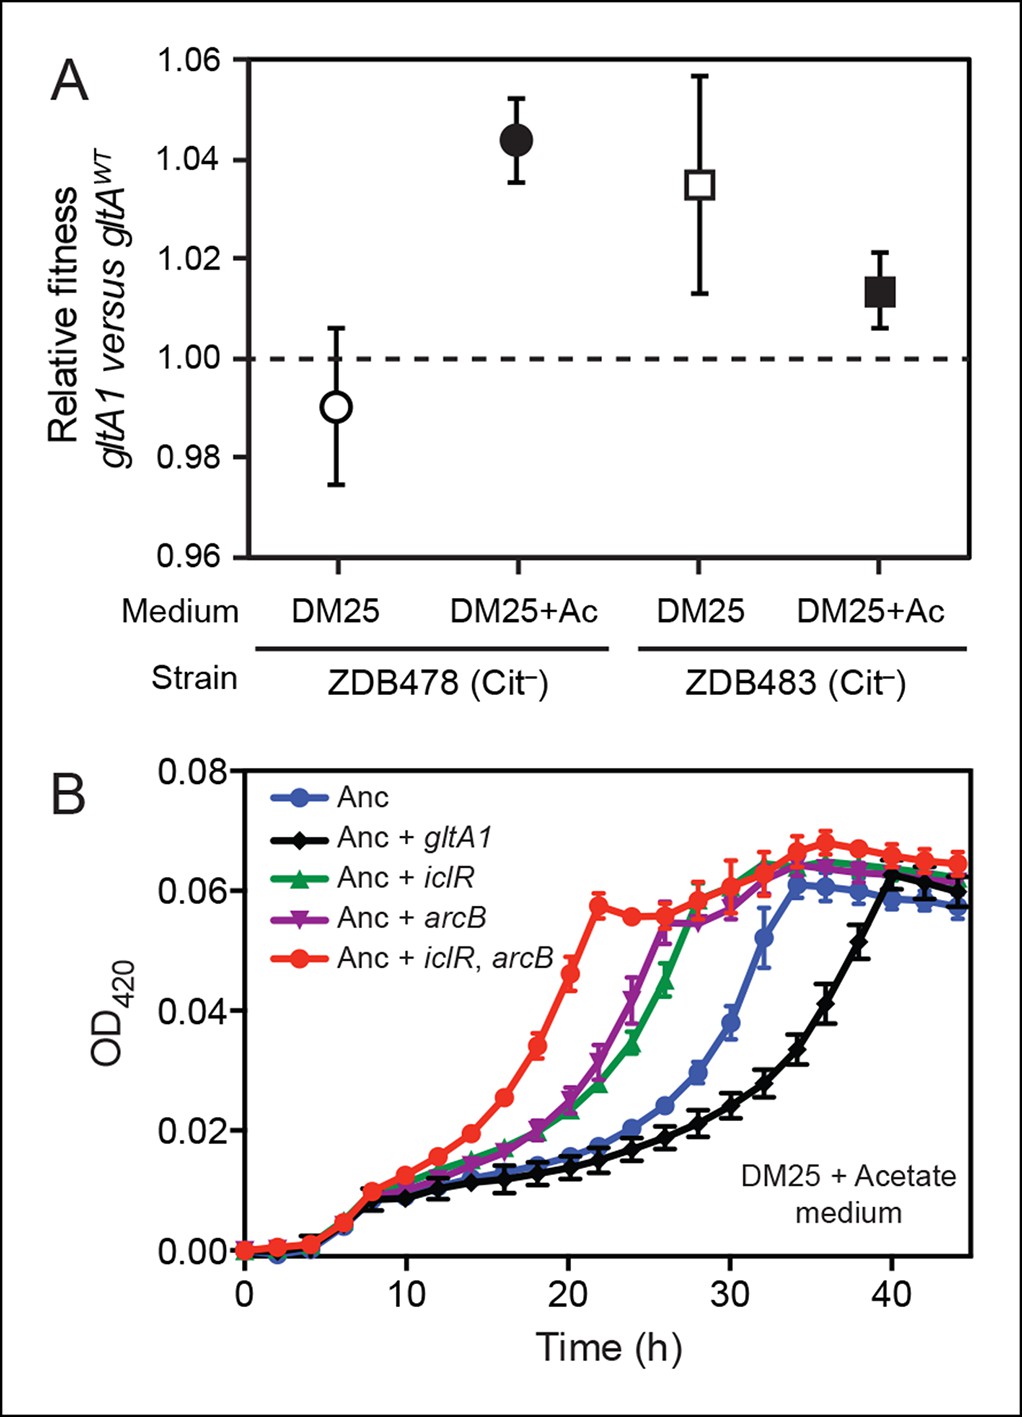
Evolved gltA1, iclR, and arcB alleles improve acetate utilization.
(A) Fitness measurements for two Cit– strains (ZDB478 and ZDB483) isolated from the LTEE population at 25,000 generations with the gltA1 mutation relative to isogenic strains with this mutation reverted to the wild-type sequence (gltAwt). The first set of co-culture competition assays was performed in DM25 under normal LTEE conditions. The second set was performed in DM25 supplemented with 0.0025% acetate (Ac) (w/v) to test whether gltA1 affected the component of fitness related to utilization of this overflow product of metabolism that transiently accumulates during E. coli growth on glucose. The presence of the gltA1 mutation is beneficial to fitness in DM25 in one of these two strains, each of which contains other mutations that evolved before and after gltA1 during the LTEE. With added acetate the evolved gltA1 allele is beneficial in both strains, suggesting that this mutation in citrate synthase is important for improving acetate utilization. Error bars are 95% confidence limits from six replicate assays. (B) Growth curves of the ancestral REL607 strain (Anc) and derivative strains constructed to contain evolved gltA1, iclR, and arcB alleles. Strains were grown in DM25 media supplemented with 0.05% (w/v) acetate. The iclR and arcB genes encode transcriptional regulators of the glyoxylate and TCA cycles. These metabolic pathways are required for acetate assimilation in E. coli. The evolved gltA1 mutation is deleterious on its own in the ancestral strain background under these conditions, showing that its beneficial effect on acetate utilization in (A) is dependent on other mutations present in ZDB478 and ZDB483. In contrast, mutations in iclR and arcB improve growth on acetate individually and in combination with one another in the ancestral genetic background. Thus, all three of these mutations likely evolved in the LTEE population because they specifically improved utilization of the acetate byproduct of glucose metabolism. Error bars are the S. D. of at least three replicates.
Figure 4
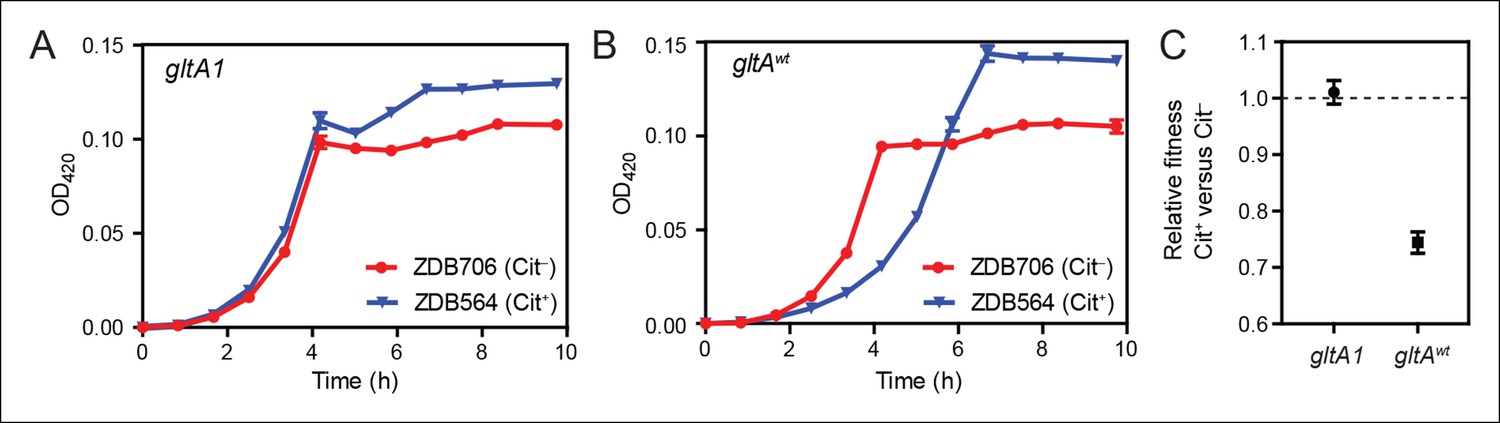
Evolution of citrate utilization was potentiated by the gltA1 mutation.
(A) Growth curves for an early Cit+ clone (ZDB564) from the LTEE which contains the gltA1 mutation and an isogenic Cit– revertant of this strain (ZDB706) without the citT amplification, grown in DM250 medium. The presence of the citT mutation, which is sufficient for the rudimentary Cit+ trait on its own, slightly improves the growth dynamics and final cell density in this genetic background that includes gltA1 and other evolved alleles. Error bars are the S. D. of at least three replicates. (B) Growth curves of isogenic derivatives of strains ZDB564 and ZDB706 in which the gltA1 mutation has been reverted to the wild-type sequence, performed in DM250 medium. Addition of the citT amplification in this gltAwt genetic background now causes a large lag in growth dynamics although the final cell density achieved is still higher in the Cit+ strain. Error bars are the S. D. of at least three replicates. (C) Relative fitness values as determined by competition assays between Cit+ (ZDB564) and Cit– (ZDB706) isogenic strain pairs which contain either the gltA1 or gltAwt allele. Competitions were performed in DM25 medium, which was used throughout the LTEE. In accordance with the growth curves, these competitions show that the citT mutation would be highly deleterious to fitness if it evolved in a genetic background without the gltA1 mutation. In contrast, the citT mutation is neutral or possibly slightly beneficial to fitness when the gltA1 mutation is present. Thus, the gltA1 mutation potentiated the eventual evolution of robust citrate utilization (Cit++) by preventing the citT mutation from having deleterious effects when it first appeared. Error bars are 95% confidence limits from six replicate assays.
Figure 5

gltA mutations alter gene expression and allosteric regulation by NADH.
(A) gltA mRNA expression levels as determined by qRT-PCR of EQ119-derived cells containing the specified ancestral or evolved alleles. Expression levels are shown relative to that of strain EQ119 which contains the gltAwt gene sequence. Error bars are 95% confidence intervals of biological triplicate samples. (B) NADH-mediated inhibition citrate synthase activity for the wild-type enzyme and evolved variants with combinations of gltA mutations. Fits to the hyperbolic model used to extract the binding and inhibition parameters in Table 1 are shown. Error bars are the S. E. M. of three replicates. (C) Molecular modeling predicts that the observed changes in allosteric regulation in evolved CS sequences are primarily caused by how mutations affect the orientation of histidine-110 in the NADH binding pocket. The gltA1 mutation is predicted to redirect this side chain into the binding pocket creating a steric clash with NADH (red surface). The two characterized variants of citrate synthase with an additional gltA2 mutation are predicted to reorient histidine-110 back toward the wild-type conformation. The degree of this predicted structural change correlates with the relative levels of NADH inhibition experimentally measured for these CS variants (Table 1).
Figure 6
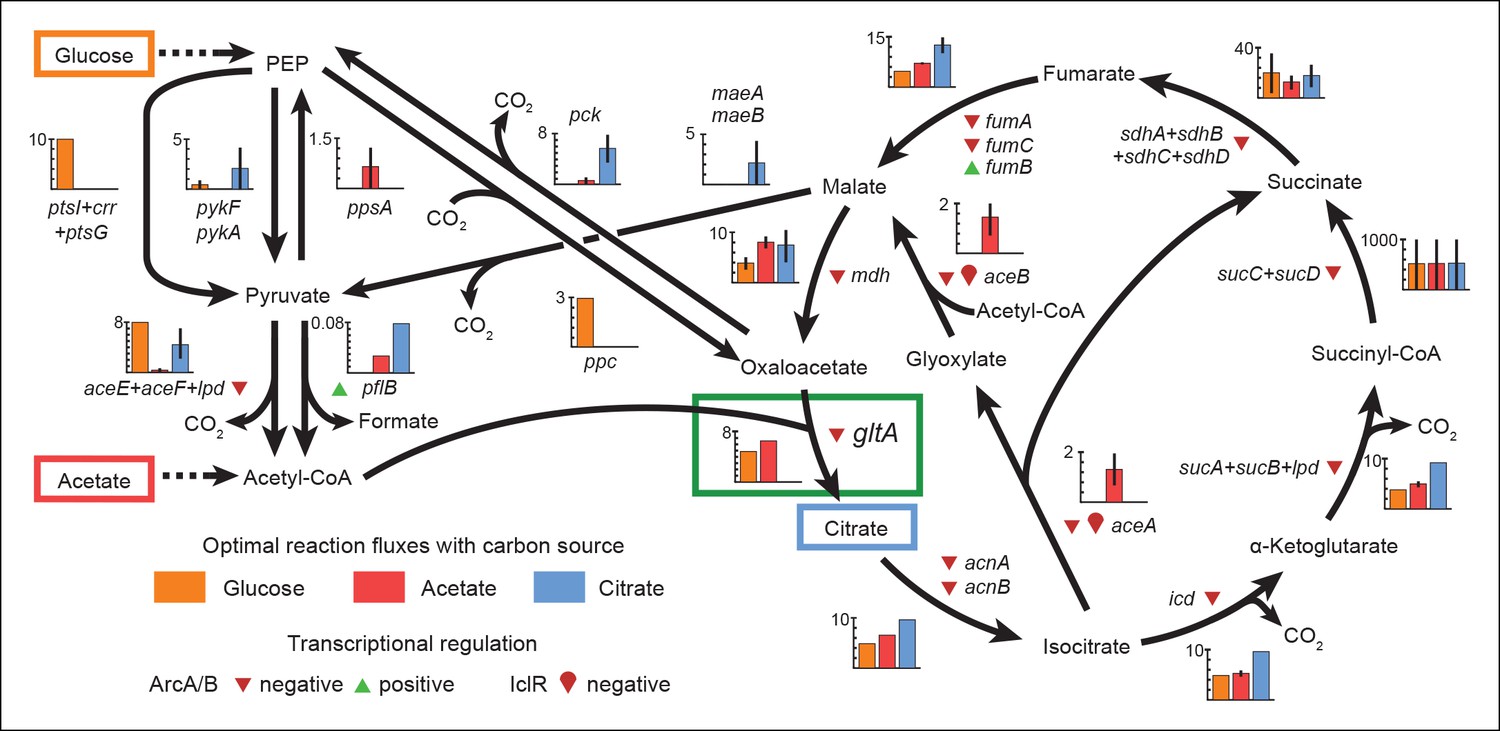
Optimal reaction fluxes on carbon sources present in the E. coli LTEE.
Flux balance analysis (FBA) was used to predict the reaction fluxes in the E. coli B REL606 ancestral strain of the LTEE that optimize the rate of biomass accumulation when utilizing a single carbon source: either glucose, acetate, or citrate. Glucose is the primary carbon source for cells grown under LTEE conditions, while acetate, a metabolic overflow product excreted during E. coli growth on glucose, can also be utilized by the ancestral strain (Yoon et al., 2012). Citrate can only be utilized under the aerobic conditions of the LTEE after the Cit+ innovation (Blount et al., 2008, 2012). Flux values derived from FBA for key reactions in central metabolism are shown for modeling growth on each carbon source: glucose (orange bars), acetate (red bars), and citrate (blue bars). Error bars show the full range of possible fluxes for each reaction that are consistent with globally optimal FBA solutions, as predicted by flux variability analysis, and the colored bars show an intermediate value in each range. Gene names for all enzymes that contribute to each reaction flux are displayed. Genes whose expression is controlled by IclR and ArcAB are marked with symbols indicating the direction of transcriptional regulation, and the key citrate synthase (CS) reaction catalyzed by GltA is boxed in green. The results of the FBA modeling agree with our experimental observations that the combined effects of derepressing the IclR and ArcAB regulons via the iclR and arcB mutations and alleviating NADH-mediated allosteric inhibition of CS via the gltA1 mutation are beneficial for growth on acetate because they increase flux values for these reactions toward levels that are optimal for this substrate. This metabolic program is thought to potentiate the evolution of Cit+ by increasing the production of C4-dicarboxylates (succinate, fumarate, and malate) which can be exported in exchange for citrate uptake by the CitT antiporter. Under Cit++ conditions in which citrate is the primary carbon source FBA predicts that drastically reducing flux through the CS reaction is required to achieve an optimal growth rate which also agrees with our finding that beneficial gltA2 mutations that decrease CS activity evolved at this point in the LTEE.
Figure 7
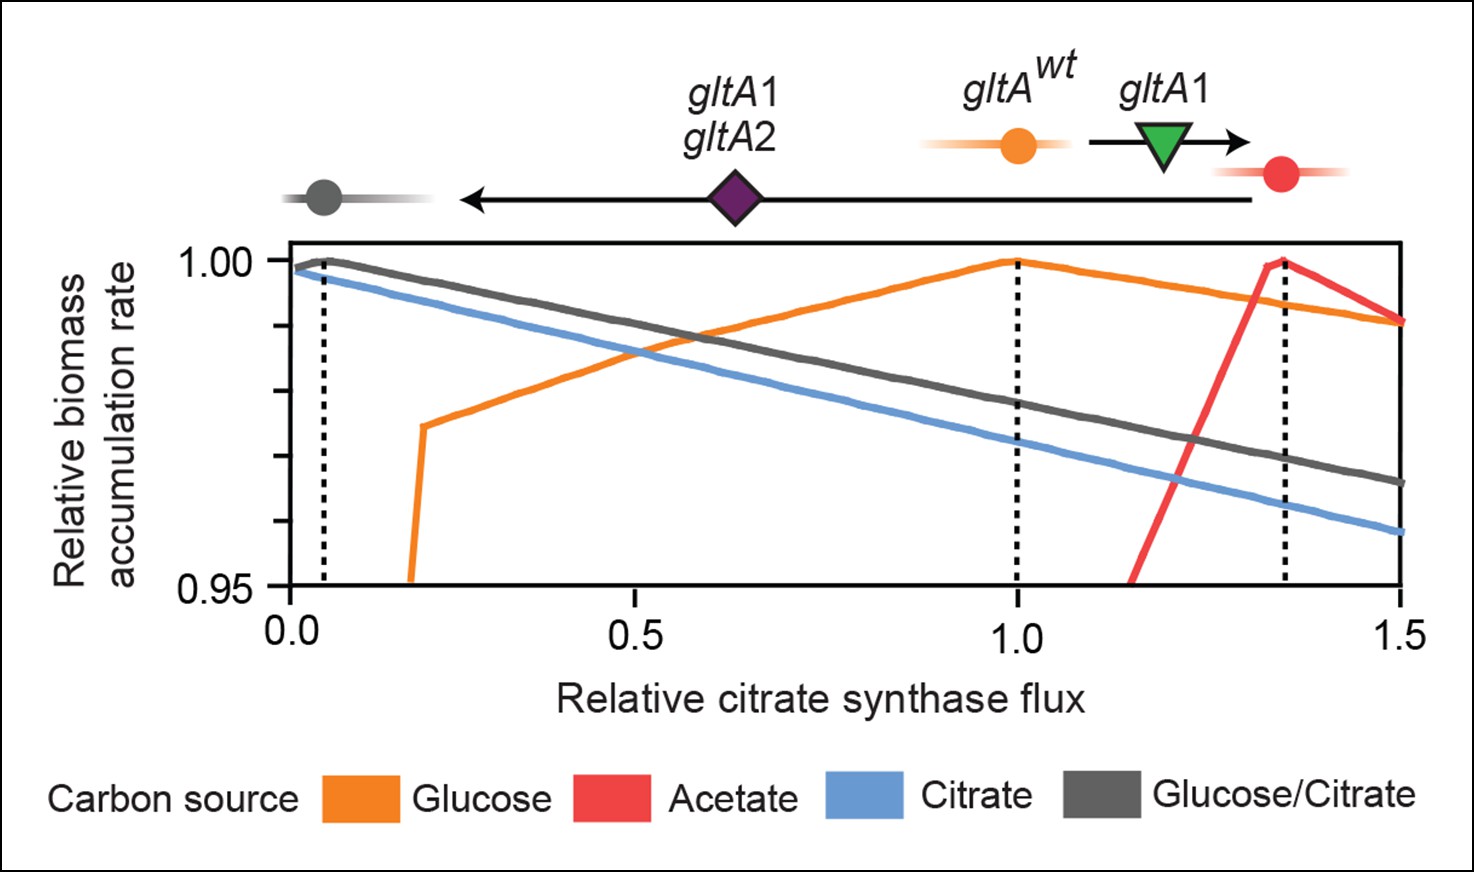
Effects of constrained citrate synthase flux on utilizing different carbon sources available during the LTEE.
Rates of biomass accumulation on different substrates were calculated by using FBA to optimize metabolic fluxes subject to a defined constraint on citrate synthase flux. Glucose/citrate represents a growth condition with the molar ratio of those two nutrients that is present in the DM25 medium used in the LTEE. Curves for other carbon sources are colored as in Figure 7. Relative biomass accumulation rates were normalized within each curve to the maximum value achieved on the specified substrate or substrate mixture. Relative citrate synthase flux was normalized to the value that resulted in maximum biomass accumulation rate for glucose growth. Optimal relative flux values for each carbon source are indicated with dashed lines. Arrows above each graph indicate the changes in CS activity expected from each successive mutation in gltA that evolved in the LTEE. This analysis shows how mutations in gltA appear to have arisen because they enable flux through CS to achieve values that are more optimal for growth, first on the acetate byproduct of glucose metabolism (gltA1) and then on the glucose/citrate mixture that can be metabolized once robust aerobic citrate utilization has evolved (gltA1 + gltA2).
Figure 8
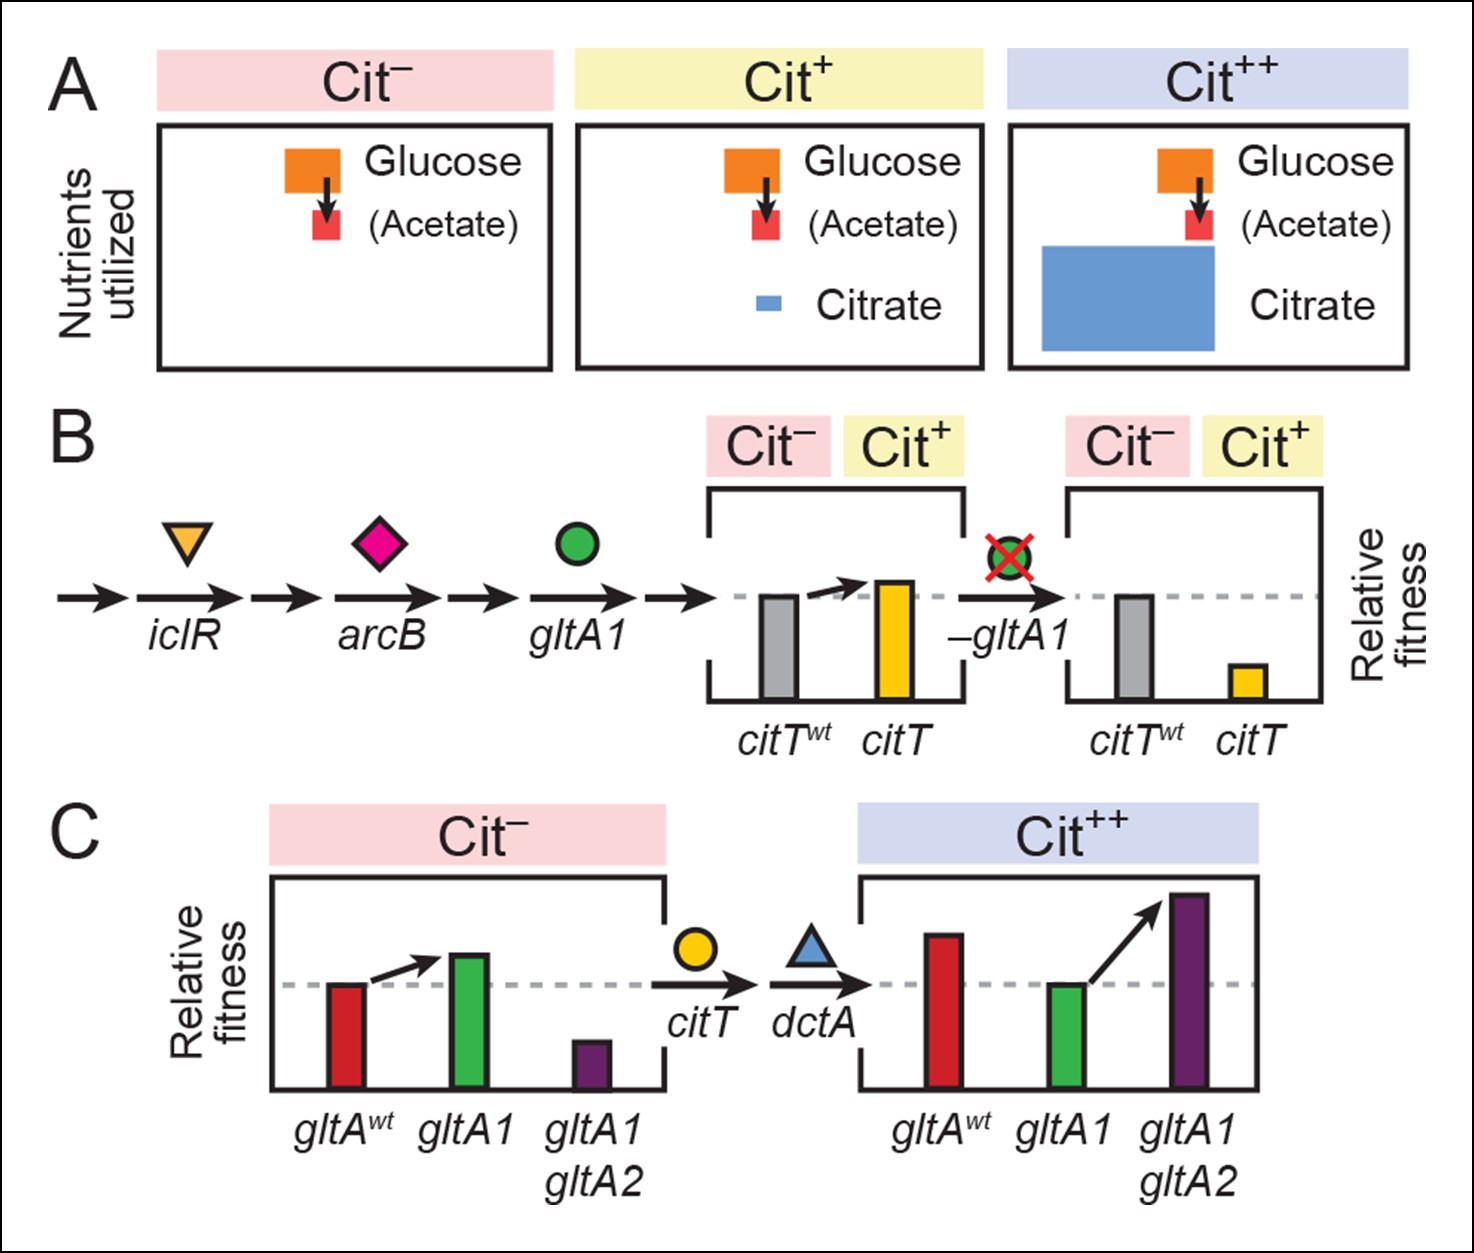
Model for how successive mutations in gltA are important for first potentiating the evolution of citrate utilization and then for refining this new trait.
(A) Different carbon sources can be utilized by E. coli during each stage in the evolution of aerobic citrate utilization in the Lenski LTEE. Initially only glucose and acetate, a byproduct of glucose metabolism, are accessible to Cit– cells. The rudimentary Cit+ trait enabled very limited utilization of some of the abundant citrate present in the growth medium. Once this ability was refined to the Cit++ phenotype by further mutations, all of the citrate present was fully exploited. The areas of each box roughly reflect the relative amounts of each of the three carbon sources. (B) The initial gltA1 mutation potentiated the evolution of Cit+. This mutation and additional mutations in iclR and arcB all improve acetate utilization in Cit– cells by increasing flux through the TCA and glyxolyate cycles. The order of accumulation of these mutations, interspersed with many other mutations during the LTEE, is represented by arrows on the left side of the figure. These mutations may potentiate the evolution of the weak Cit+ phenotype because they create a potentiated version of central metabolism that is capable of replenishing succinate and/or other C4-dicarboxylates that must be exported in exchange for citrate import by the CitT antiporter. In accordance with this model, the addition of the CitT-activating mutation (citT) to an evolved genetic background that crucially contains the gltA1 mutation results in a rudimentary Cit+ phenotype that is neutral or slightly beneficial to fitness and thus represents a path accessible to evolution, denoted by an arrow to mark the transition as shown in left bar graph. In contrast, adding the citT mutation to the same genetic background but without the gltA1 mutation is highly deleterious to fitness, rendering this path inaccessible to evolution within the LTEE population, as shown in right bar graph. (C) Fitness effects of gltA alleles show sign epistasis with nutrient utilization niche. The gltA1 mutation that increased citrate synthase activity was beneficial to fitness when it evolved prior to the Cit+ innovation when only glucose and acetate could be utilized, as shown in the bar graph on the left. While necessary for the evolution of the rudimentary Cit+ phenotype by citT activation, the effect of gltA1 mutation is suboptimal for fitness once the dctA* mutation evolves and the citrate utilization niche can be fully exploited. Under this condition, the gltA1 mutation was deleterious to fitness and gltA2 mutations evolved that reversed the effect of the gltA1 mutation and even further reduced citrate synthase activity below the ancestral level to improve fitness in this niche, as shown in bar graph on the right. Note that relative fitness is on a different scale in each of the fitness diagrams, as all Cit++ strains are considerably more fit than any Cit– strain due to the abundant citrate in the growth medium.
Figure 9
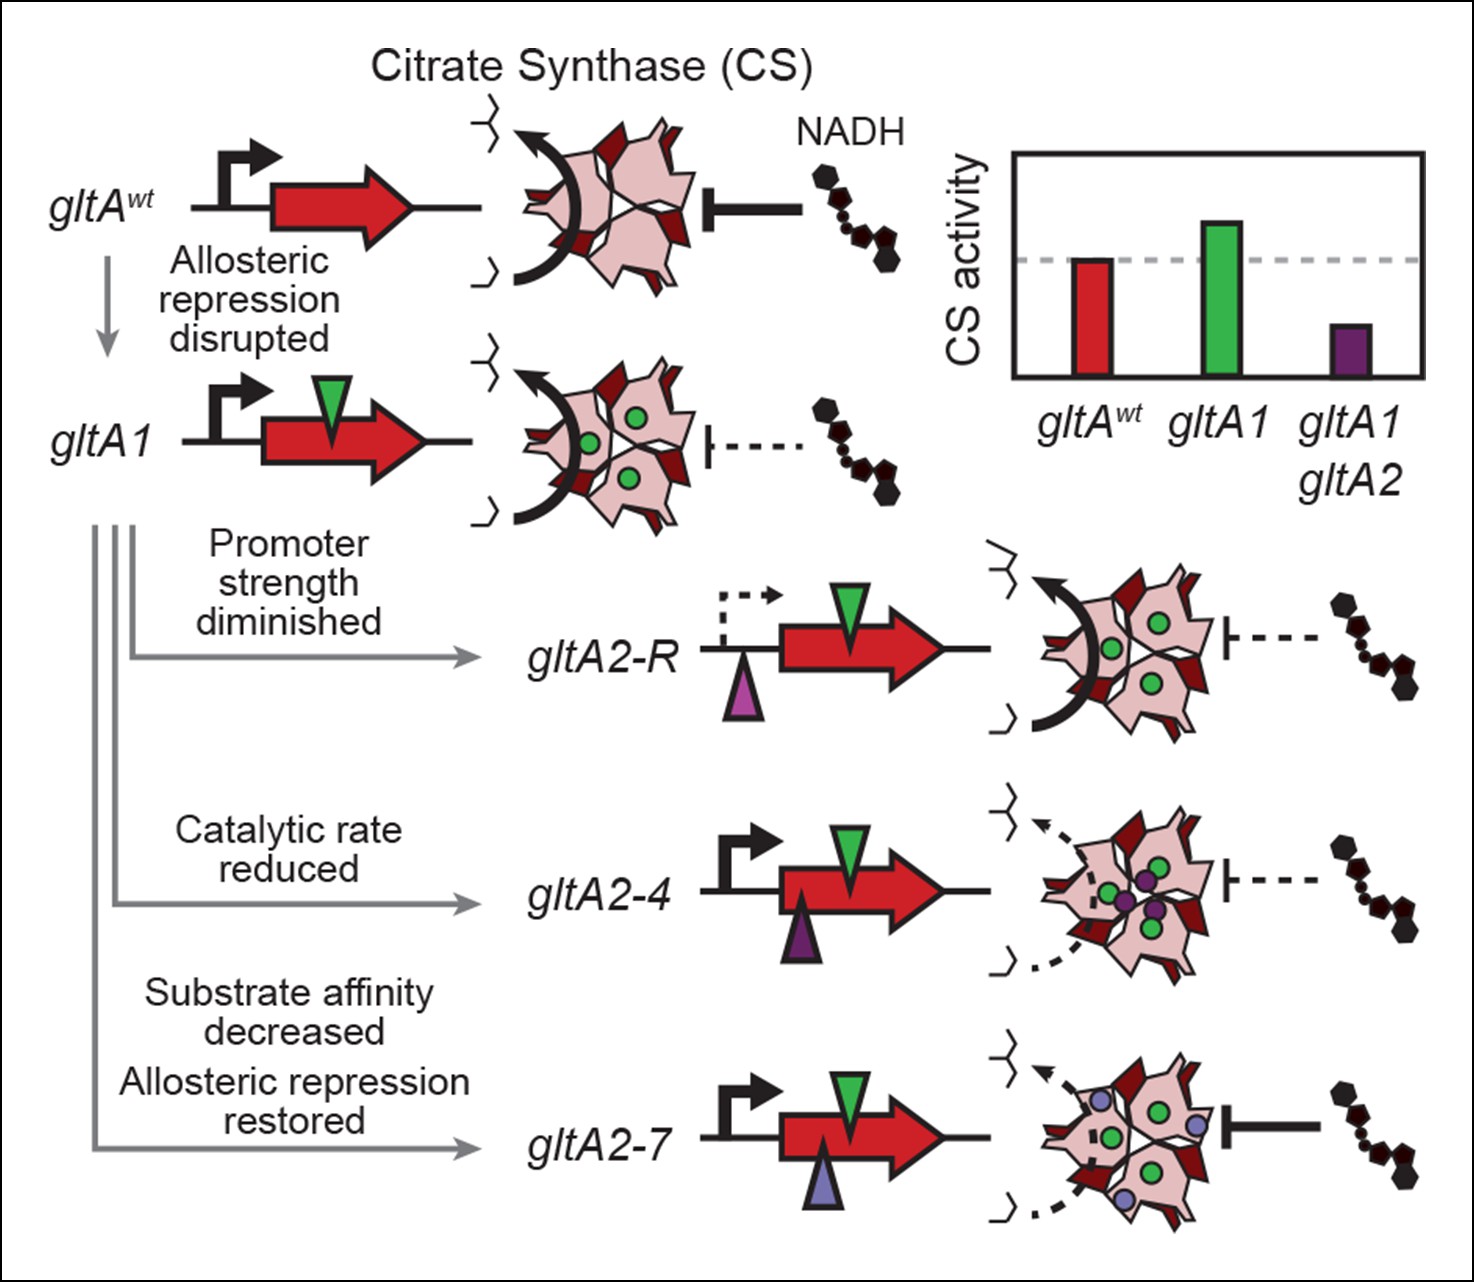
Summary of the molecular effects of evolved gltA mutations.
The molecular effects of the initial gltA1 mutation and of the various gltA2 mutations were characterized and the mechanisms by which they produce changes in cellular citrate synthase activity are depicted in the series of gene and protein structure diagrams. Approximate locations of mutations in the gltA gene are shown as shaded triangles in the series of gene diagrams and likewise the locations of the resulting amino acid changes are shown as similarly shaded circles on the CS structure diagrams. Reduced transcription, enzyme activity, and allosteric inhibition as compared to wild-type are indicated with dashed lines. The inset shows the approximate relative levels of citrate synthase activity representative of each gltA allelic state.
Tables
Table 1
Kinetic and regulatory properties of evolved citrate synthase variants.
| Evolved alleles | Substitutions | kcat(s-1) | Km OAA (μM) | Km AcCoA (μM) | Kd NADH (μM) | Ki NADH (μM) | Maximum% inhibition | Docking energy (kcal/mol) |
|---|---|---|---|---|---|---|---|---|
| gltAwt | none | 51.1 ± 2.5 | 84.2 ± 10.4 | 138.6 ± 17.6 | 1.2 ± 0.1 | 1.7 ± 0.1 | 80.5 ± 1.0 | –80.3 |
| gltA1 | A258T | 49.1 ± 5.3 | 90.3 ± 22.5 | 148.0 ± 41.1 | N. D. | 30.2 ± 4.6* | 83.2 ± 3.1 | –28.8 |
| gltA1 gltA2-7 | A258T, A162V | 55.0 ± 3.0 | 143.4 ± 11.1* | 374.1 ± 41.2* | 1.5 ± 0.4 | 1.9 ± 0.1 | 68.7 ± 0.7* | –63.8 |
| gltA1 gltA2-4 | A258T, A124T | 33.9 ± 2.7* | 88.1 ± 12.8 | 295.1 ± 52.6* | 9.5 ± 1.7* | 17.1 ± 6.2* | 64.6 ± 5.1* | –47.8 |
-
Data are represented as fit mean ± S. E. Significant differences from the wild-type enzyme are marked with an asterisk (two-tailed t-test, p-value < 0.05). N. D. indicates no detectable binding.
Additional files
-
Supplementary file 1
E. coli strains and plasmids used in this study.
- https://doi.org/10.7554/eLife.09696.015
Download links
A two-part list of links to download the article, or parts of the article, in various formats.
Downloads (link to download the article as PDF)
Open citations (links to open the citations from this article in various online reference manager services)
Cite this article (links to download the citations from this article in formats compatible with various reference manager tools)
Fine-tuning citrate synthase flux potentiates and refines metabolic innovation in the Lenski evolution experiment
eLife 4:e09696.
https://doi.org/10.7554/eLife.09696


