Opposing roles of nuclear receptor HNF4α isoforms in colitis and colitis-associated colon cancer
- University of California, Riverside, United States
- Harvard Medical School, United States
Figures
Figure 1
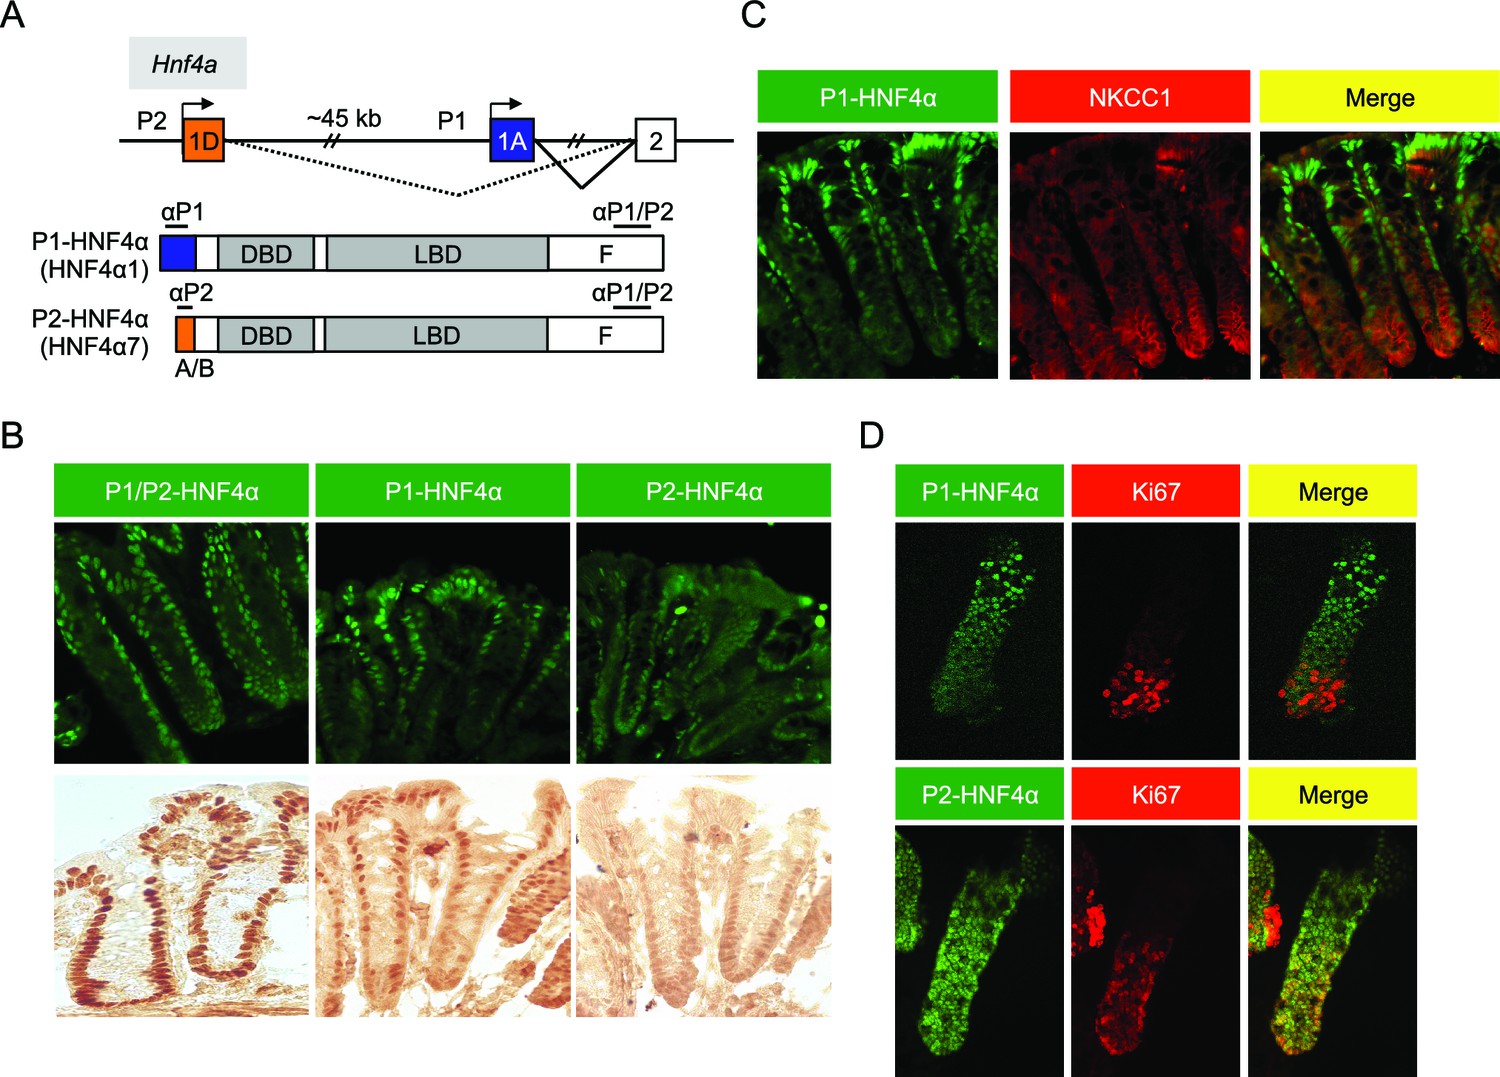
Differential localization of HNF4α isoforms in mouse colonic crypts.
(A) Schematic of the mouse (and human) Hnf4a gene showing the two promoters (P1 and P2) (top) and the P1- and P2-driven HNF4α isoforms that they express (bottom). The differential N-terminal A/B domain (indicated in blue and orange) as well as epitopes to isoform-specific (αP1 and αP2) and common (αP1/P2) antibodies are indicated. DBD, DNA binding domain; LBD, ligand binding domain; F, F domain. (B–D) IF and immunohistochemistry of distal colon (B,C) or isolated colonic crypts (D) stained for the indicated proteins using the antibodies in (A) (B: 40X magnification; C,D: 25X magnification with digital zoom). NKCC1 (Slc12a2) (C) and Ki67 (D) mark the proliferative compartment of the crypt. Representative images from two independent experiments (n=2–4 mice per genotype) are shown.
Figure 2
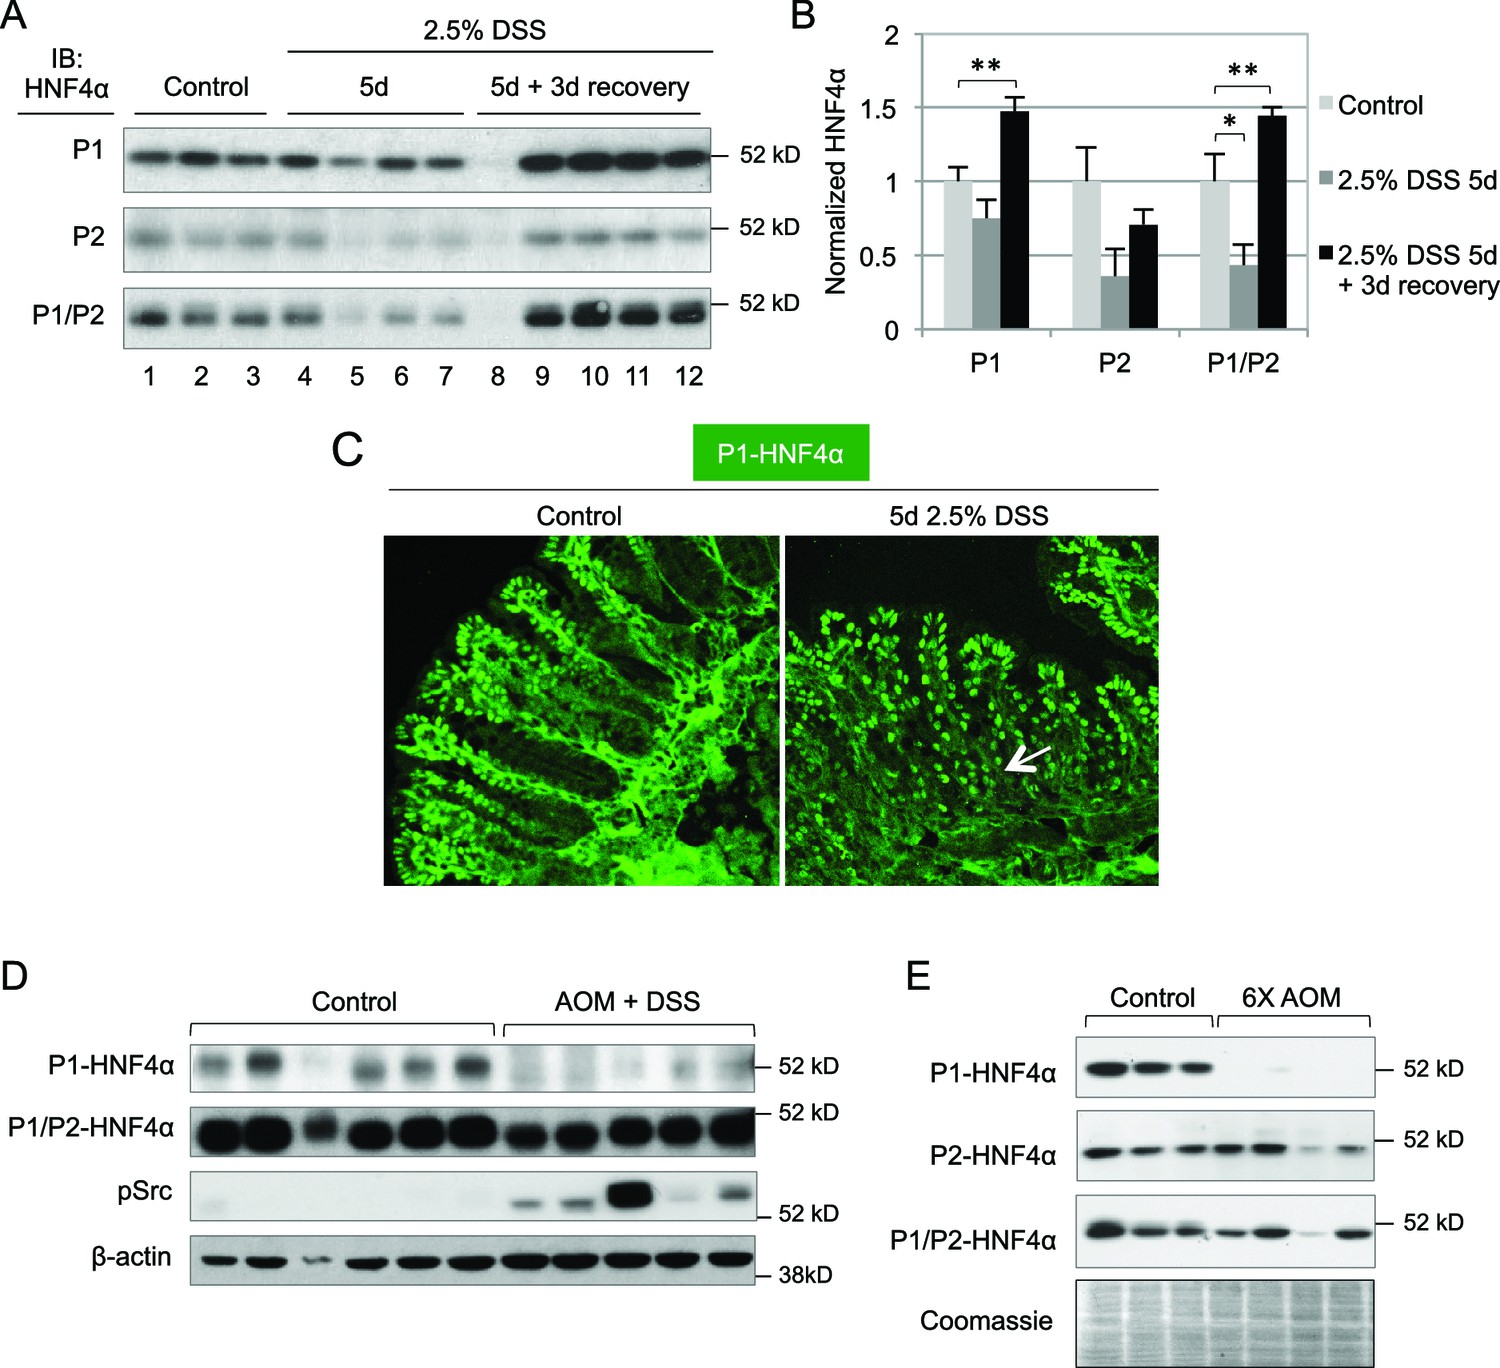
Dysregulation of P1- and P2-HNF4α in mouse models of colitis and colon cancer.
(A) IB of WCE from the distal colon of WT mice treated with 2.5% DSS for 5 days followed by 0 or 3 days recovery, and an analogous region of untreated (Control) mice. Each lane is from a different mouse. The position of the molecular weight marker (52 kD) is shown. (B) Quantification of the HNF4α signal in (A) normalized to total protein, as determined by Coomassie staining of the same blot. For the purposes of quantification the outlier in lane 8 was omitted. *P<0.05, **P<0.005. (C) Representative IF of distal colon from untreated and DSS-treated WT mice (n=3–4 per condition) stained with P1-HNF4α antibody (40X magnification). Arrow indicates P1-HNF4α expressing cells near the bottom of the crypt in the DSS-treated mice. (D) IB as in (A) but from the tumor area of WT mice treated with 10 mg/kg AOM and three cycles of a 7-day DSS treatment and harvested at ~95 days. Three gels were run in parallel with the same extracts; one representative β-actin stain is shown. (E) IB analysis as in (D) but from mice injected six times with 10 mg/kg AOM and harvested at ~150 days. Shown is one representative of the three Coomassie stains performed for loading verification.
Figure 3 with 1 supplement
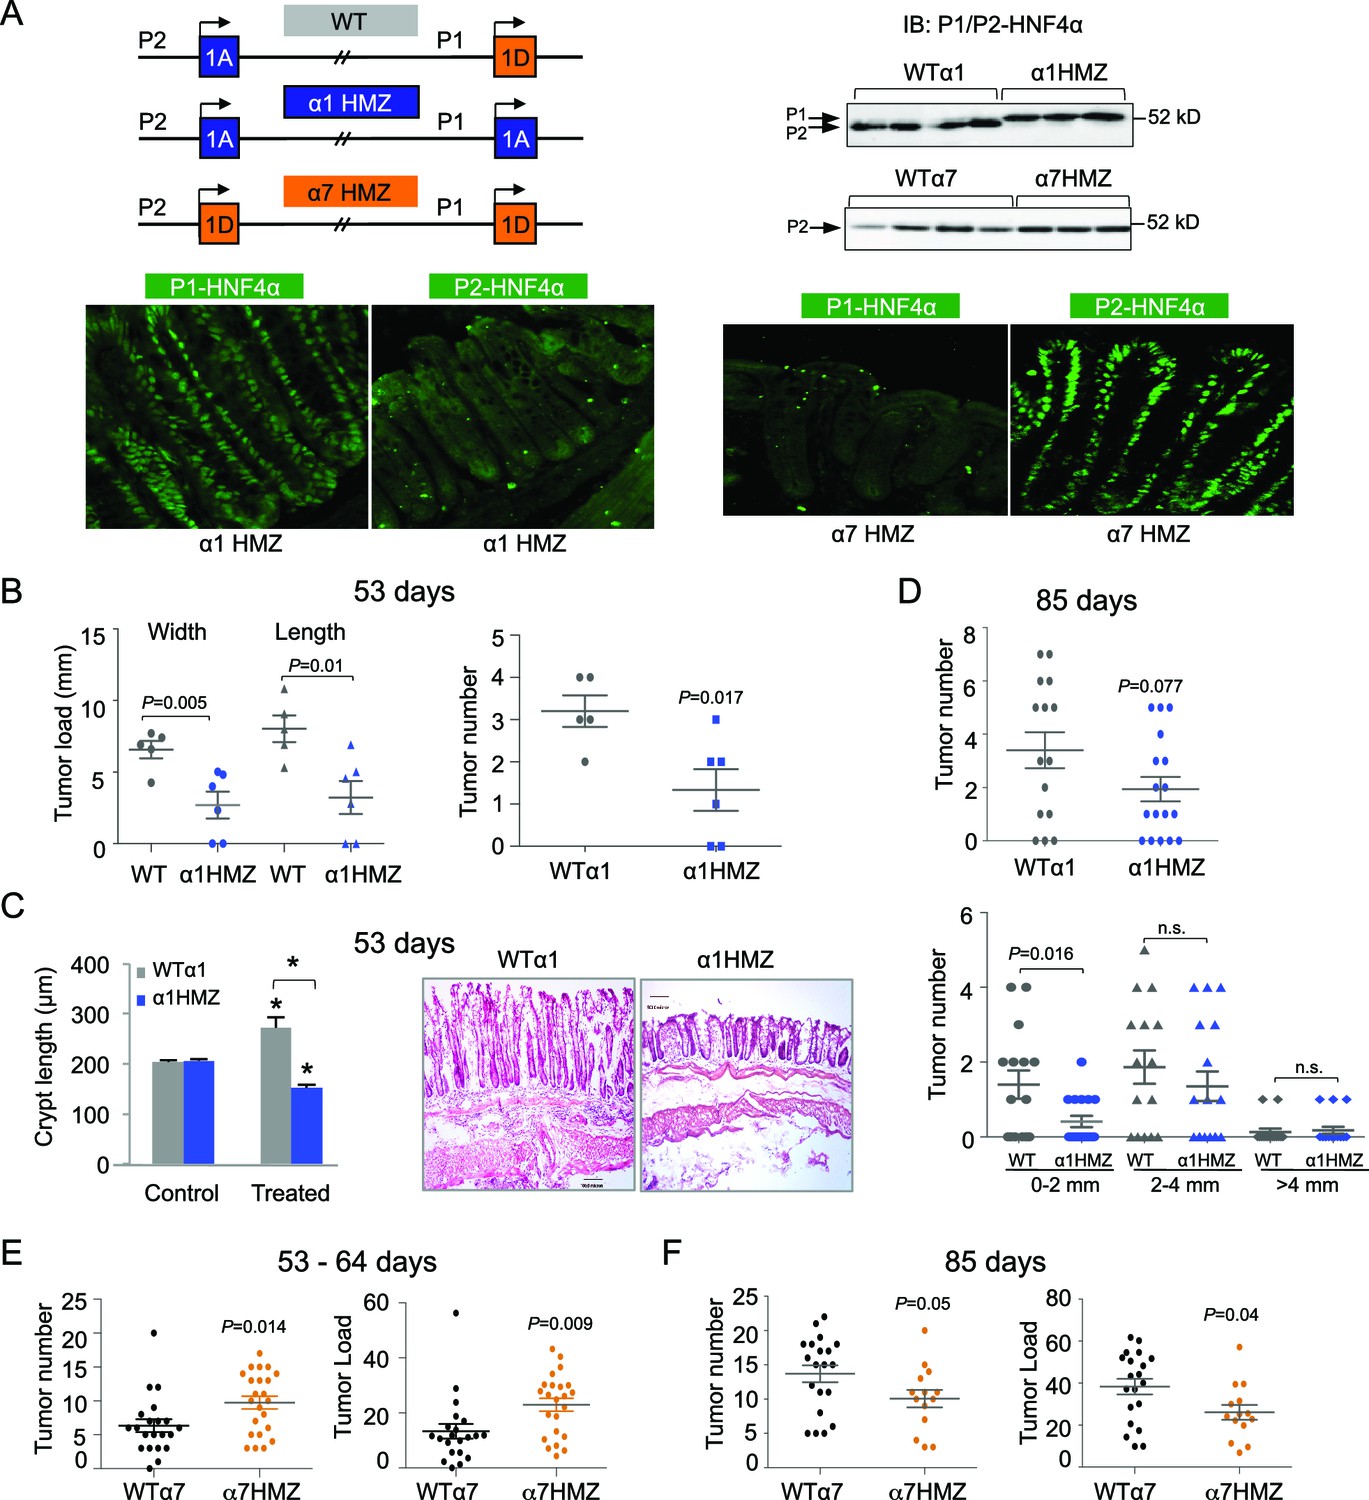
Differential susceptibility of HNF4α isoform-specific mice to colitis-associated colon cancer.
(A) Top left, Schematic of Hnf4a exon-swap (i.e., isoform-specific) mice. Top right, IB as in Figure 2A of WCE from the distal colon of the exon-swap mice and their WT controls, probed with the common αP1/P2 antibody. See Figure 3—figure supplement 1E for verification of protein loading. Bottom, representative IF of distal colons from untreated α1HMZ and α7HMZ mice stained with either P1- or P2-driven HNF4α specific antibodies (40X magnification). N=3–4 mice per genotype examined. Scale for P1-HNF4α α1HMZ is 0.22 x 0.22 microns; all others are 0.36 x 0.36 microns. (B) Tumor growth in WTα1 (n = 5) and α1HMZ (n = 6) mice treated with 10 mg/kg AOM and two cycles of DSS (5 days per cycle) and harvested at ~53 days. Right, number of tumors per mouse colon. Left, tumor load (sum of the width or length of all macroscopic lesions in a given mouse). Each symbol represents results from one mouse. (C) Left, average length of crypt in WTα1 and α1HMZ mice, untreated (Control) or treated as in (B) N = 2–3 mice per condition; 26–56 crypts per mouse were measured. *P<0.0005 between treated and control within a genotype and across genotypes in the treated condition. Right, Representative H&E stain (10X magnification) of mice treated as in (B) Scale bar is 100 microns. (D) Tumor number in WTα1 (n = 15) and α1HMZ (n = 17) male mice treated as in (B) but with three cycles of DSS (two cycles of 5 days and one cycle of 4-days) and harvested at ~85 days. Top, total number of tumors per mouse. Bottom, number of tumors per mouse based on the tumor width. n.s., non-significant. (E) As in (B) but for WTα7 (n = 21) and α7HMZ (n = 23) mice treated with 10 mg/kg AOM and 2–3 cycles of DSS (4–5 days per cycle) and harvested at ~53–64 days. P-values between α7HMZ and WTα7 mice are indicated. Tumor data were pooled from three independent experiments. (F) Tumor number and load in WTα7 (n = 20) and α7HMZ (n = 14) mice as in (E) but harvested at ~85 days. The following figure supplement is available for Figure 3:
Figure 3—figure supplement 1
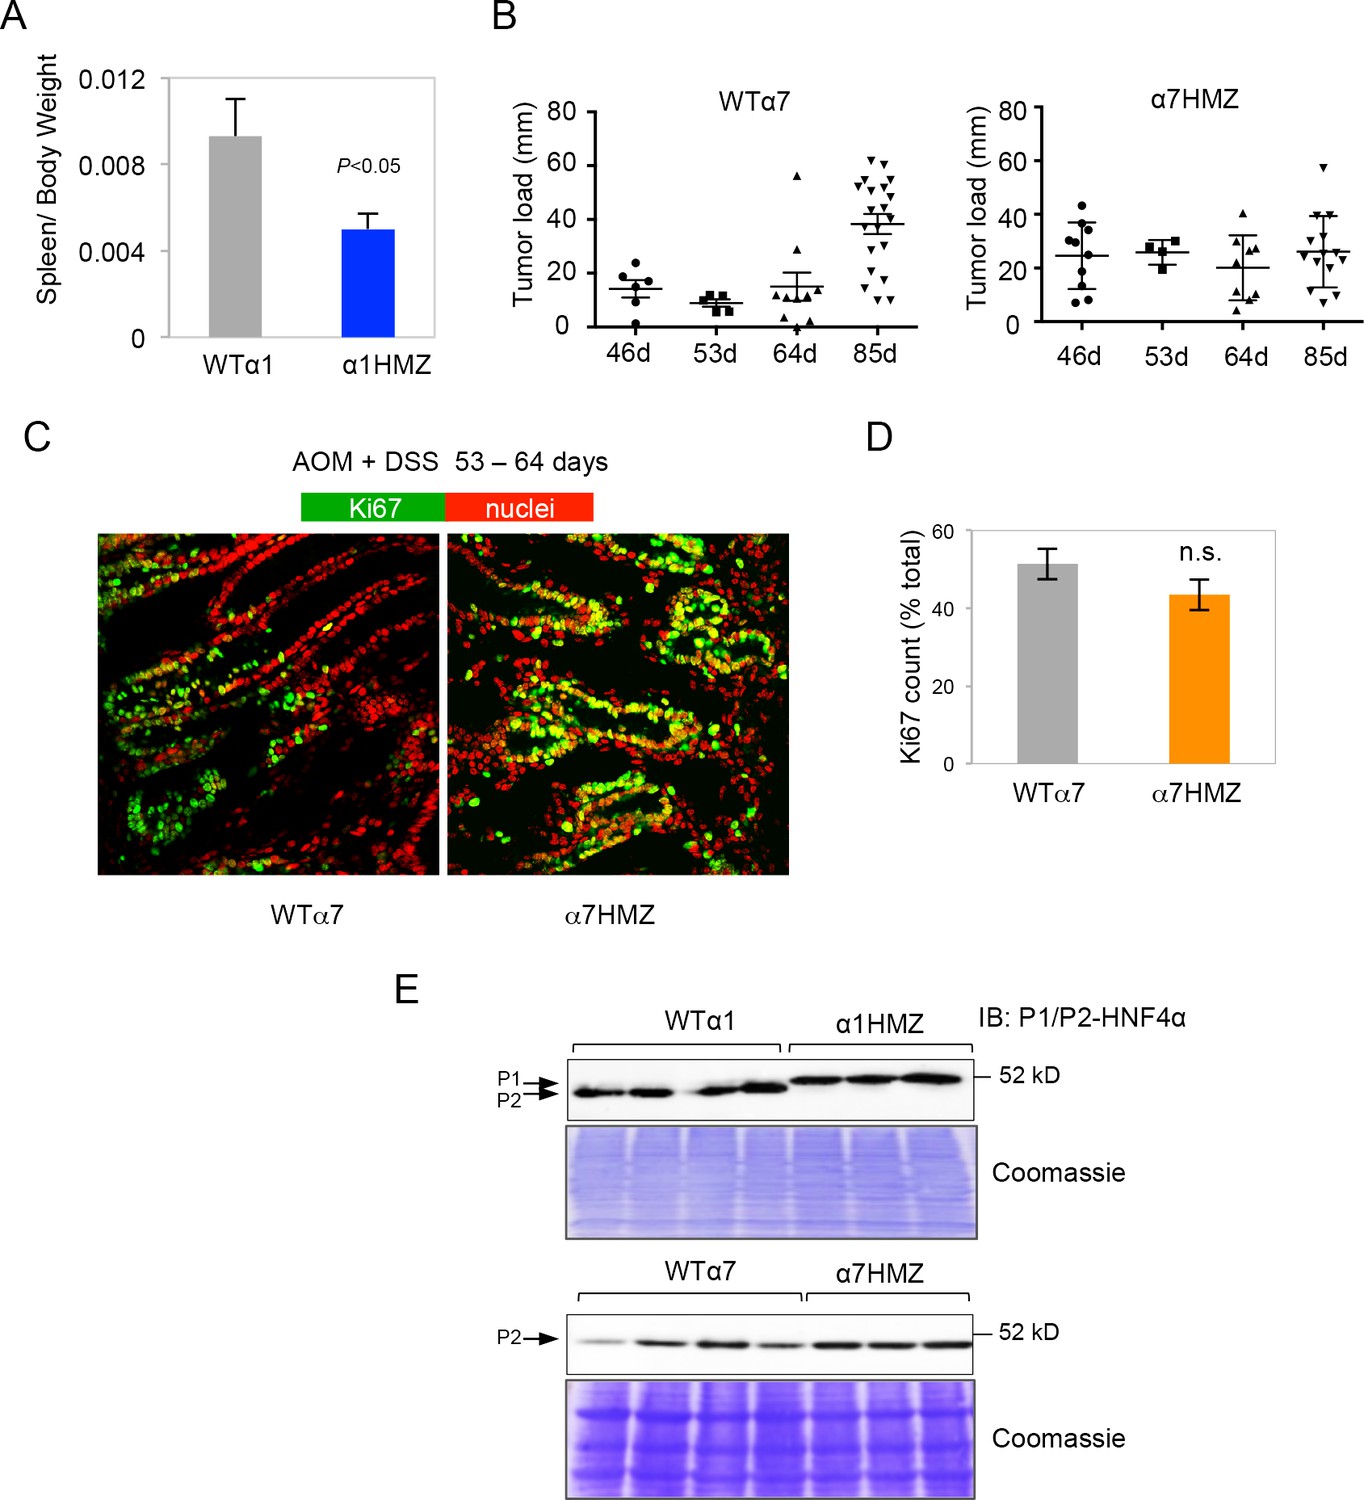
HNF4α isoform-specific mice subjected to AOM+DSS to induce colitis-associated colon cancer.
(A) Spleen-to-body weight ratio of WTα1 (n=5) and α1HMZ (n=6) mice treated with 10 mg/kg AOM and two cycles of DSS (5 days per cycle) and harvested at ~54 days. (B) Tumor load in WTα7 and α7HMZ male mice treated with 10 mg/kg AOM and 2–3 cycles of DSS (4–5 days per cycle) and harvested after different time points as indicated. Each symbol represents results from one mouse. (C) IF of Ki67 (green) and nuclear (red) staining in the distal colon of treated (10 mg/kg AOM and 2 cycles of DSS, 5 days) WTα7 and α7HMZ male mice harvested at 53–64 days. (D) Average percent of Ki67-positive cells counted in two to three fields in (C) from mice (n=2-4) per condition (~2300 to 3000 total cells per genotype scored). n.s., not statistically significant. (E) IB from Figure 3A in main text with Coomassie stain to show equal loading.
Figure 4 with 2 supplements
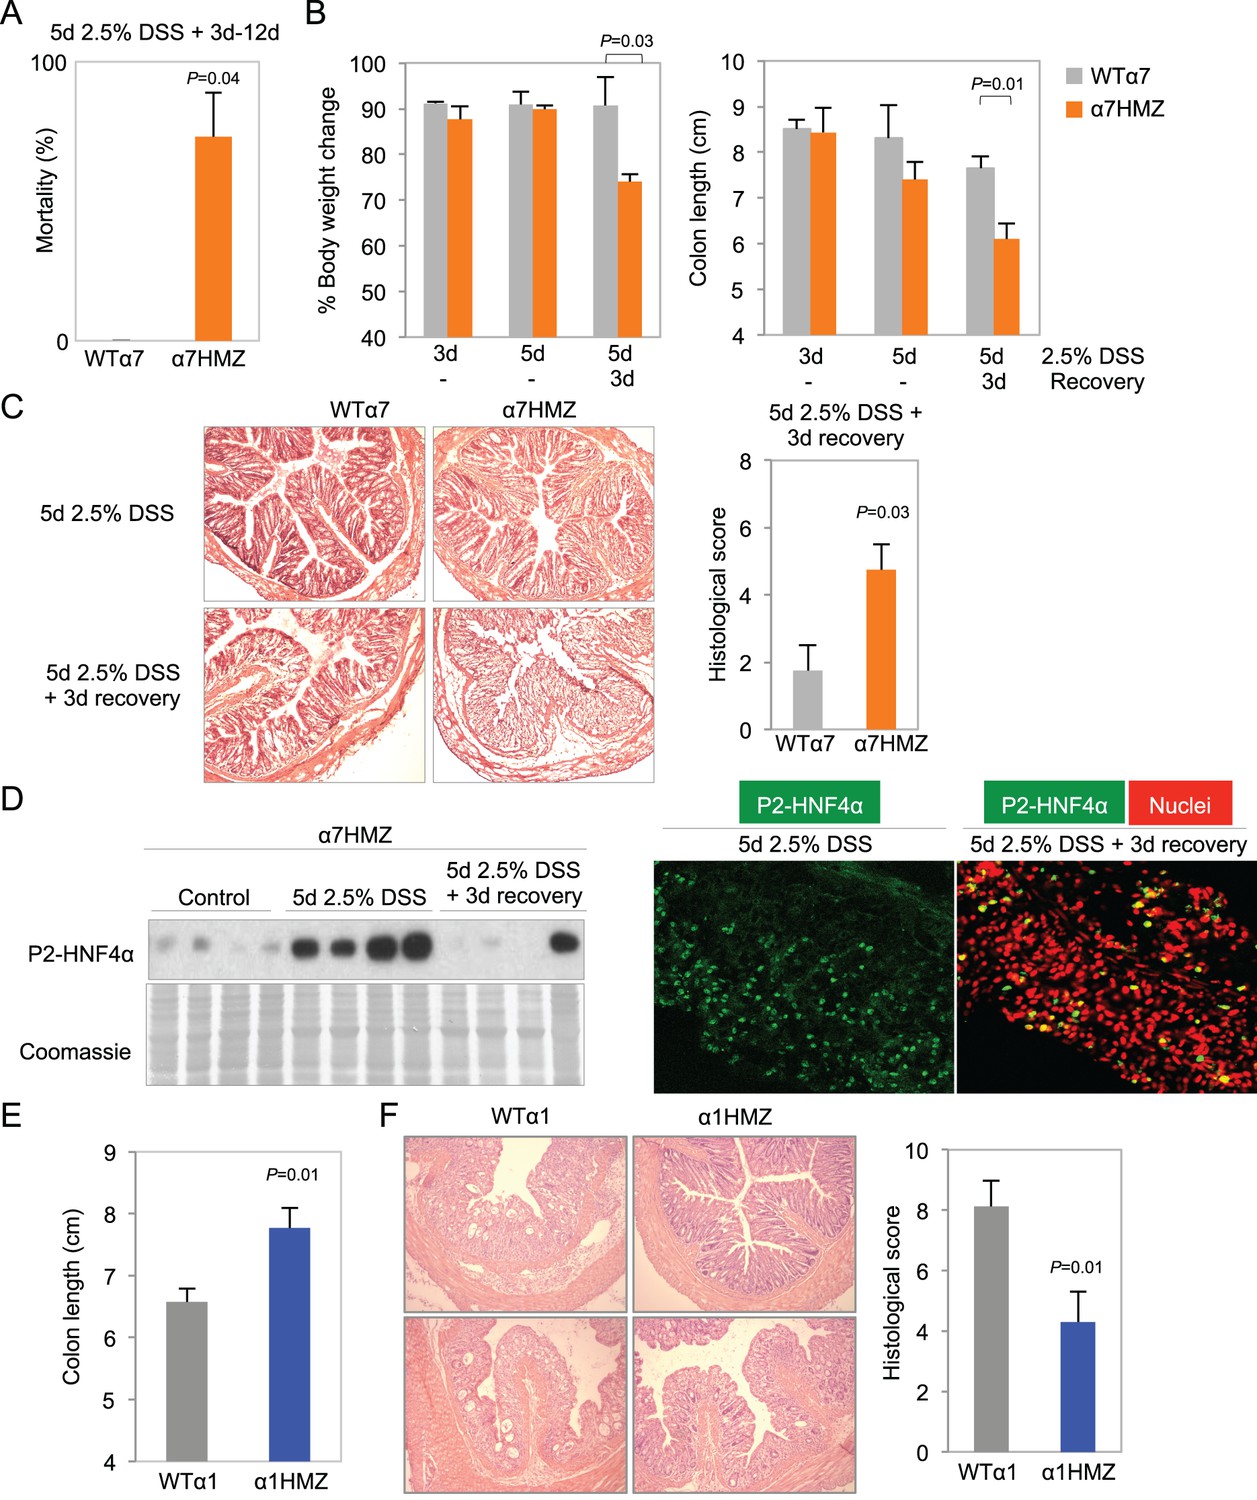
Differential susceptibility of HNF4α isoform-specific mice to DSS-induced colitis.
(A) Percent mortality of WTα7 (n = 28) and α7HMZ (n = 16) mice treated with 2.5% DSS for 5 days. α7HMZ mice typically died during day 3 to 12 of recovery following DSS treatment. Data pooled from two independent experiments. Not shown is a third experiment with older mice (21–23 weeks) with similar results (WT: 1 of 5 mice died; α7HMZ: 3 of 6 mice died). (B) Change in bodyweight (represented as% initial body weight) (left) and colon length (right) of WT (n = 4) and α7HMZ (n = 4) mice treated as indicated. Significant comparisons are indicated with a P-value. (C) Left, representative H&E stain of WT and α7HMZ mice treated with 2.5% DSS for 5 days followed by 0 or 3 days of recovery. Right, histological scores of colitis in WTα7 (n = 4) and α7HMZ (n = 4) mice. (D) Left, IB for HNF4α (P1/P2 antibody) of WCE from the distal colon of α7HMZ mice treated as indicated. Right, representative IF of distal colon from α7HMZ mice treated with 2.5% DSS for 5 days -/+ recovery as indicated and stained with P1/P2-HNF4α antibody (green) and TO-PRO3 (red) for nuclei (40X magnification). Extracts from four mice per genotype (out of n = 5–7) were randomly chosen for IB analysis on a single gel/blot; sections from 3 mice per genotype were examined. (E) Colon length of WT (n = 8) and α1HMZ (n = 10) male mice treated with 2.5% DSS for 5 days followed by 3 days of recovery. Results from two independent experiments were pooled. (F) Representative H&E stain (left) and histological scores (right) of colitis in WTα1 (n = 8) and α1HMZ (n = 10) mice treated as in (E). The following figure supplements are available for Figure 4:
Figure 4—figure supplement 1

Increased susceptibility of α7HMZ mice to DSS-induced colitis.
Results from an independent DSS experiment from that shown in Figure 4 A-C. Mice from this experiment were analyzed by IB and IF in Figure 4D. (A) Colon length of WTα7 and α7HMZ mice treated with 2.5% DSS for 5 days followed by 0 or 3 days of recovery. *P<0.001, between WTα7 and α7HMZ at 3 days of recovery. N=4–7 per genotype per treatment. (B) Representative H&E stain of distal colon of WTα7 and 7HMZ mice treated in (A). (C) Spleen-to-body weight ratio of WT7 (n=7) andα7HMZ (n=5) mice treated with 2.5% DSS for 5 days and sacrificed the following day. (D) Representative H&E stain of distal colon from WTα7 and α7HMZ mice treated with 2.5% DSS for 5 days followed by 12 days of recovery. N=5 per genotype treated, 2–3 mice sectioned.
Figure 4—figure supplement 2

Increased inflammation in α7HMZ mice in DSS-induced colitis.
(A) Spleen-to-body weight ratio of α7HMZ (n=7) and α1HMZ (n=7) mice treated for 4 days with 2.5% DSS followed by 18 days of recovery. (B) Crypt length of α7HMZ (n=3) and α1HMZ (n=3) mice treated as in (A): 26-37 crypts analyzed per genotype. (C) Representative photographs of colons from α7HMZ and α1HMZ mice treated with 2.5% DSS for 4 days and allowed to recover for 18 days. (D) Representative H&E stain (10X magnification) of α7HMZ and α1HMZ male mice treated as in (A) along with histological score from three mice per genotype.
Figure 5 with 1 supplement

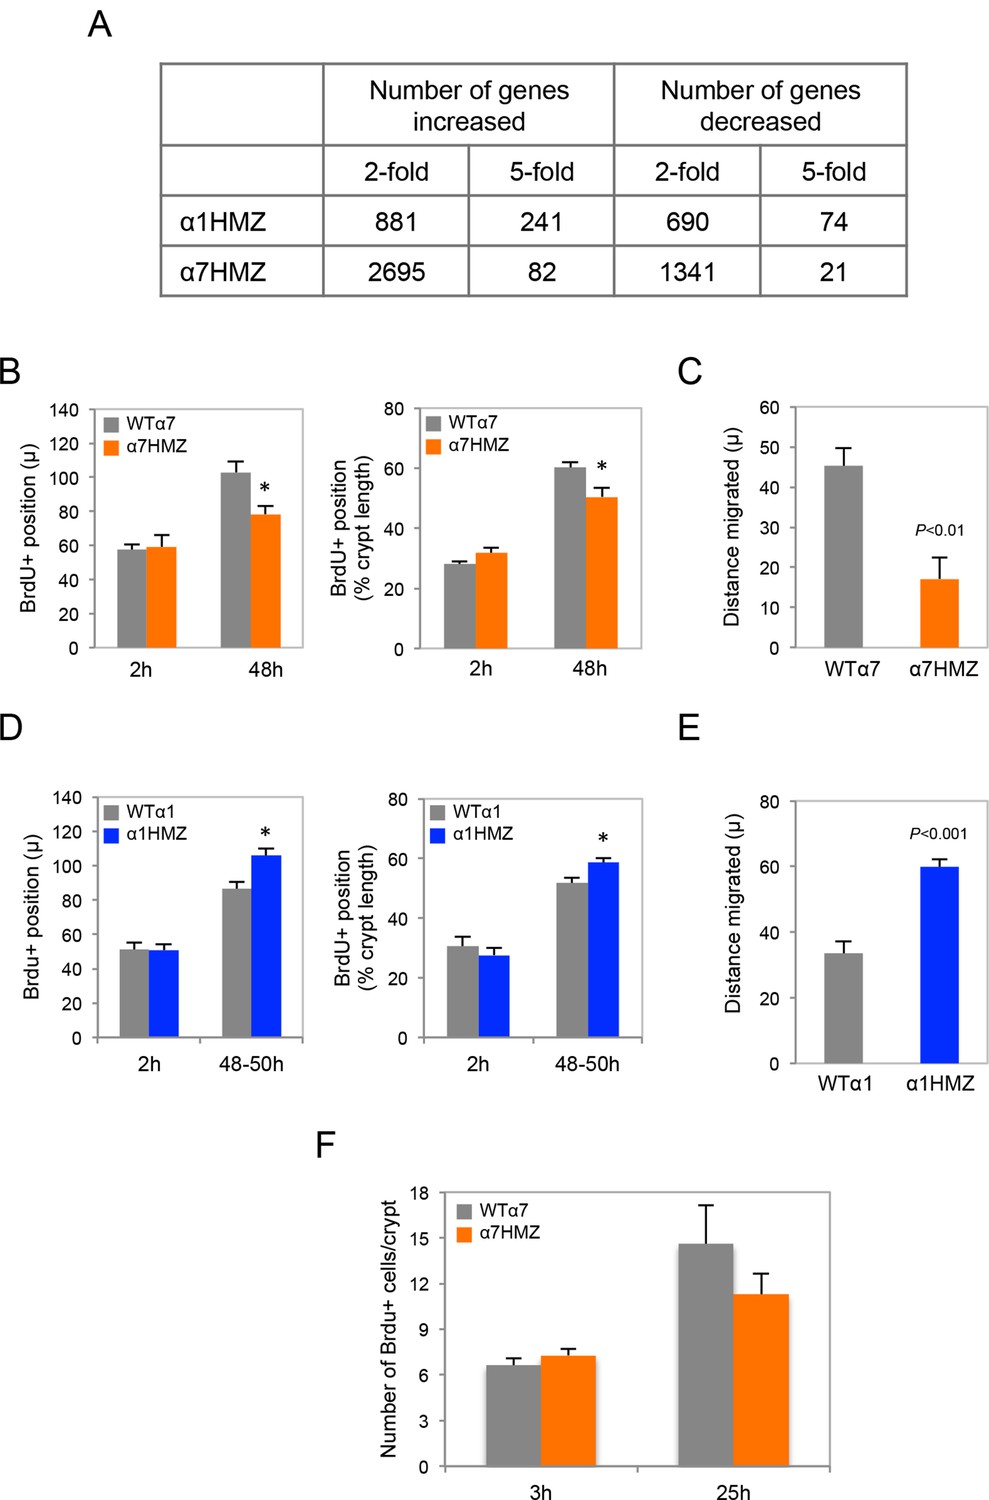
Altered gene expression, interacting proteins, migration and ion transport in HNF4α isoform-specific mice.
(A,B) Comparative Gene Ontology (GO) of genes differentially regulated (≥two-fold) in the distal colon of untreated α1HMZ (A) and α7HMZ (B) mice. (C) Top, Venn diagram of total number of HNF4α-interacting proteins from RIME analysis found in α7HMZ only, α1HMZ only or both α7HMZ and α1HMZ colons, as described in Material and methods. Indicated are nuclear proteins that have been implicated in regulating gene expression and associated with human or mouse colon cancer, IBD, Crohn’s disease and/or ulcerative colitis, as well as other pro-proliferative proteins found only in α7HMZ colons. Shown also are transcription factors that interact with HNF4α in both genotypes. Bold, proteins mentioned in text. Bottom, Total number of proteins in the indicated categories that show a significant interaction with HNF4α in the exon swap mice. TF, transcription factor; RNA binding proteins; kinase and phosphatase categories include only protein kinases and phosphatases, as well as relevant scaffolding proteins b. (D) Untreated HNF4α isoform-specific mice and their WT littermates (n = 3–4 per genotype) were injected with BrdU (75 mg/kg) and sacrificed at 2 hr or 48–50 hr. The distance migrated by the BrdU+ cells from the bottom of the crypt between 2 hr and 48–50 hr is plotted as% crypt length; 5–38 crypts per mouse were scored. (E) Intestinal chloride secretion in response to 10 µM forskolin and 100 µM carbachol represented as change in short-circuit current (ΔIsc). Left, WTα1 (n = 6) and α1HMZ (n = 5–8) mice. *P<0.02 between α1HMZ and WTα1. Right, WTα7 (n = 4) and α7HMZ (n = 3) mice. *P<0.05 versus WTα7. Results from one experiment per genotype are shown: a second independent experiment for α7HMZ yielded similar results (not shown). (F) Left, RELMβ mRNA expression in the distal colon of untreated α1HMZ, α7HMZ and their WT controls from microarrays in (A,B), represented as an average of the three Retnlb probes. P<0.008 versus WTα7. Right, RELMβ protein level quantified by ELISA in the mid colon homogenate of untreated WTα7 (n = 5) and α7HMZ (n = 3) mice. Shown are means of technical triplicates. The following supplementary figure and source data are available for Figure 5:
-
Figure 5—source data 1
Transcriptomic analysis of HNF4α isoform-specific mice.
(A) Top 100 genes DOWN in distal colon of α1HMZ male mice compared to WT controls. (B) Top 100 genes UP in distal colon of α1HMZ male mice compared to WT controls. (C) Top 100 genes DOWN in distal colon of α7HMZ male mice compared to WT controls. (D) Top 100 genes UP in distal colon of α7HMZ male mice compared to WT controls. (E) Up-regulated genes involved in wound healing and immune function enriched in α1HMZ mice. (F) Up-regulated genes involved in cell cycle and DNA repair in α7HMZ mice. (G) Down-regulated genes involved in cell adhesion and ion transport in α7HMZ mice.
- https://doi.org/10.7554/eLife.10903.011
-
Figure 5—source data 2
Proteomic analysis of HNF4α isoform-specific mice.
(A) List of proteins that interact with HNF4α in α1HMZ and α7HMZ colons from RIME analysis meeting the criteria described in Figure 5C. (B) Select proteins that interact with HNF4α in α1HMZ and α7HMZ colons from RIME analysis used to prepare the graph in Figure 5C. (C) All peptides that interact with HNF4α in both α7HMZ and α1HMZ colons from RIME analysis in which there are at least 2 positives for each genotype. (D) All peptides that interact with HNF4α preferentially in α7HMZ colons in which there are 2 or more positives for α7HMZ compared to α1HMZ. (E) All peptides that interact with HNF4α preferentially in α1HMZ colons in which there are 2 or more positives for α1HMZ compared to α7HMZ. Figure 5C.
- https://doi.org/10.7554/eLife.10903.012
Figure 5—figure supplement 1
Transcriptomic and BrdU analysis of HNF4α isoform-specific mice.
(A) Total number of genes up- or down-regulated (non log fold change) in α1HMZ and α7HMZ untreated young adult male mice compared to their respective WT controls as determined by Affymetrix Exon arrays. (B) Position of BrdU+ cells in the distal colon of WTα7 and α7HMZ mice at 2 hr and 48–50 hr after injection. Left, distance in microns. Right, distance as percent of crypt length from the crypt bottom. *P<0.02 for α7HMZ (n=4 mice) versus WTα7 (n=3 mice) at 48 hr. Data pooled from two independent experiments: 5–37 crypts counted per mouse. (C) Distance migrated in microns by Brdu+ cells between 2 hr and 48 hr from mice treated in (B). (D) As in (B) but for WTα1 (n=4) and α1HMZ (n=4) mice. *P<0.005 between genotypes at 48–50 hr. Data are from one experiment. (E) As in (C) but for WTα1 and α1HMZ mice. (F) Total number of BrdU+ cells per crypt (5–38 crypts counted per mouse) in the distal colon of WTα7 and α7HMZ mice at 3 hr (n=7 per genotype) and 25 hr (n=3–4 per genotype) after BrdU injection.
Figure 6 with 1 supplement
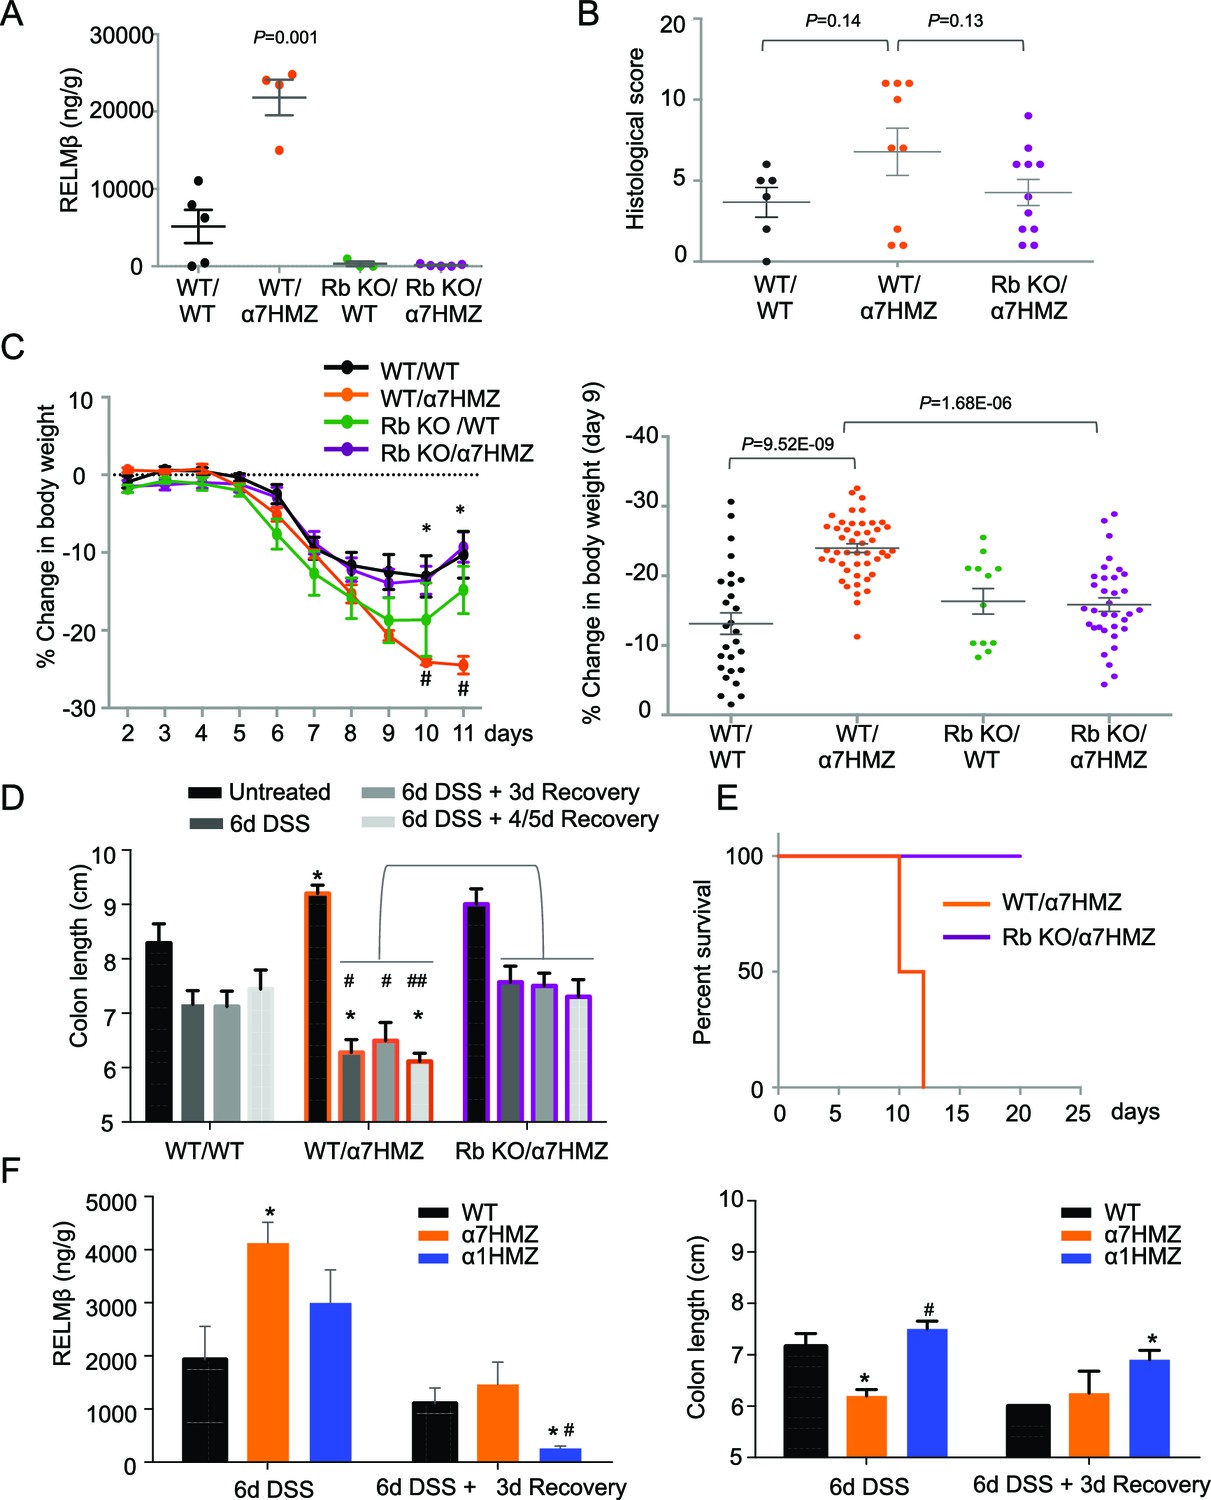
RELMβ knockout decreases susceptibility of α7HMZ mice to colitis.
(A) RELMβ protein level quantified by ELISA in the midcolon homogenate of mice with the indicated genotype treated with 2.5% DSS for 6 days. Genotypes are indicated as Retnlb/Hnf4a. N = 3–5 mice per genotype as indicated by each dot. (B) Histological scores of colitis in WT/WT (n = 6), WT/α7HMZ (n = 9) and Rb KO/ α7HMZ (n = 11) male mice treated with 2.5% DSS for 5 days followed by 3 days of recovery. Multiple sections per mouse were scored. (C) Percent change in body weight during and following DSS treatment (2.5% for 6 days). Day 0 is the start of treatment. Left, graph over time from one experiment. N = 3–5 mice per genotype. # Indicates P<0.05 on day 10 and 11 between WT/WT and α7HMZ/WT; * indicates P<0.01 on day 10 and 11 between α7HMZ/WT and α7HMZ/Rb KO. Right, meta-analysis of percent weight loss at 3 days of recovery after 6 days of treatment with 2.5% DSS from nine independent experiments. N = 12–47 mice per genotype. The WT/α7HMZ data include both the α7HMZ C57BL/6N parent as well as the α7HMZ C57BL/6N+J generated from the Retnlb-/- cross. See Figure 6—figure supplement 1 for a comparison of the two α7HMZ lines. (Data from one experiment in which all mice, including the WT/WT controls, had lower than normal body weight loss were excluded from the analysis.) (D) Colon length from mice treated with 2.5% DSS for 6 days followed by different recovery periods. N = 3–14 mice per genotype per treatment. *P<0.05 versus WT/WT at different time points. #P<0.01 or ##P<0.002 versus RbKO/α7HMZ at different time points. Data are pooled from 12 independent experiments. (E) Kaplan-Meier survival curve of WT/α7HMZ (n = 4) and KO/α7HMZ (n = 9) mice after 6 days 2.5% DSS in one experiment. Meta-analysis of several independent experiments also showed that out of a total of 24 KO/α7HMZ mice allowed to go past 3 days of recovery, only one mouse died (3.6% mortality). In contrast, 13 out of 29 WT/α7HMZ mice (44.8%) either died or had to be sacrificed due to severe distress. Data for WT/α7HMZ mice in both the C57BL/6N and C57BL/6N+J lines were combined: no difference in mortality was noted between the lines. (F) WT, α7HMZ and α1HMZ mice (all in C57BL/6N background, n = 3–63-6 per genotype per treatment) were treated with 2.5% DSS for 6 days alone or followed by 3 days of recovery. Left, RELMβ protein quantified by ELISA in the midcolon homogenate: shown are means of technical triplicates from one experiment. Right, colon length. RELMβ ELISA: *P<0.03 versus WT; #P<0.01 versus α7HMZ. Colon length: *P<0.01 versus WT; #P<0.0002 versus α7HMZ. The following figure supplement is available for Figure 6::
Figure 6—figure supplement 1
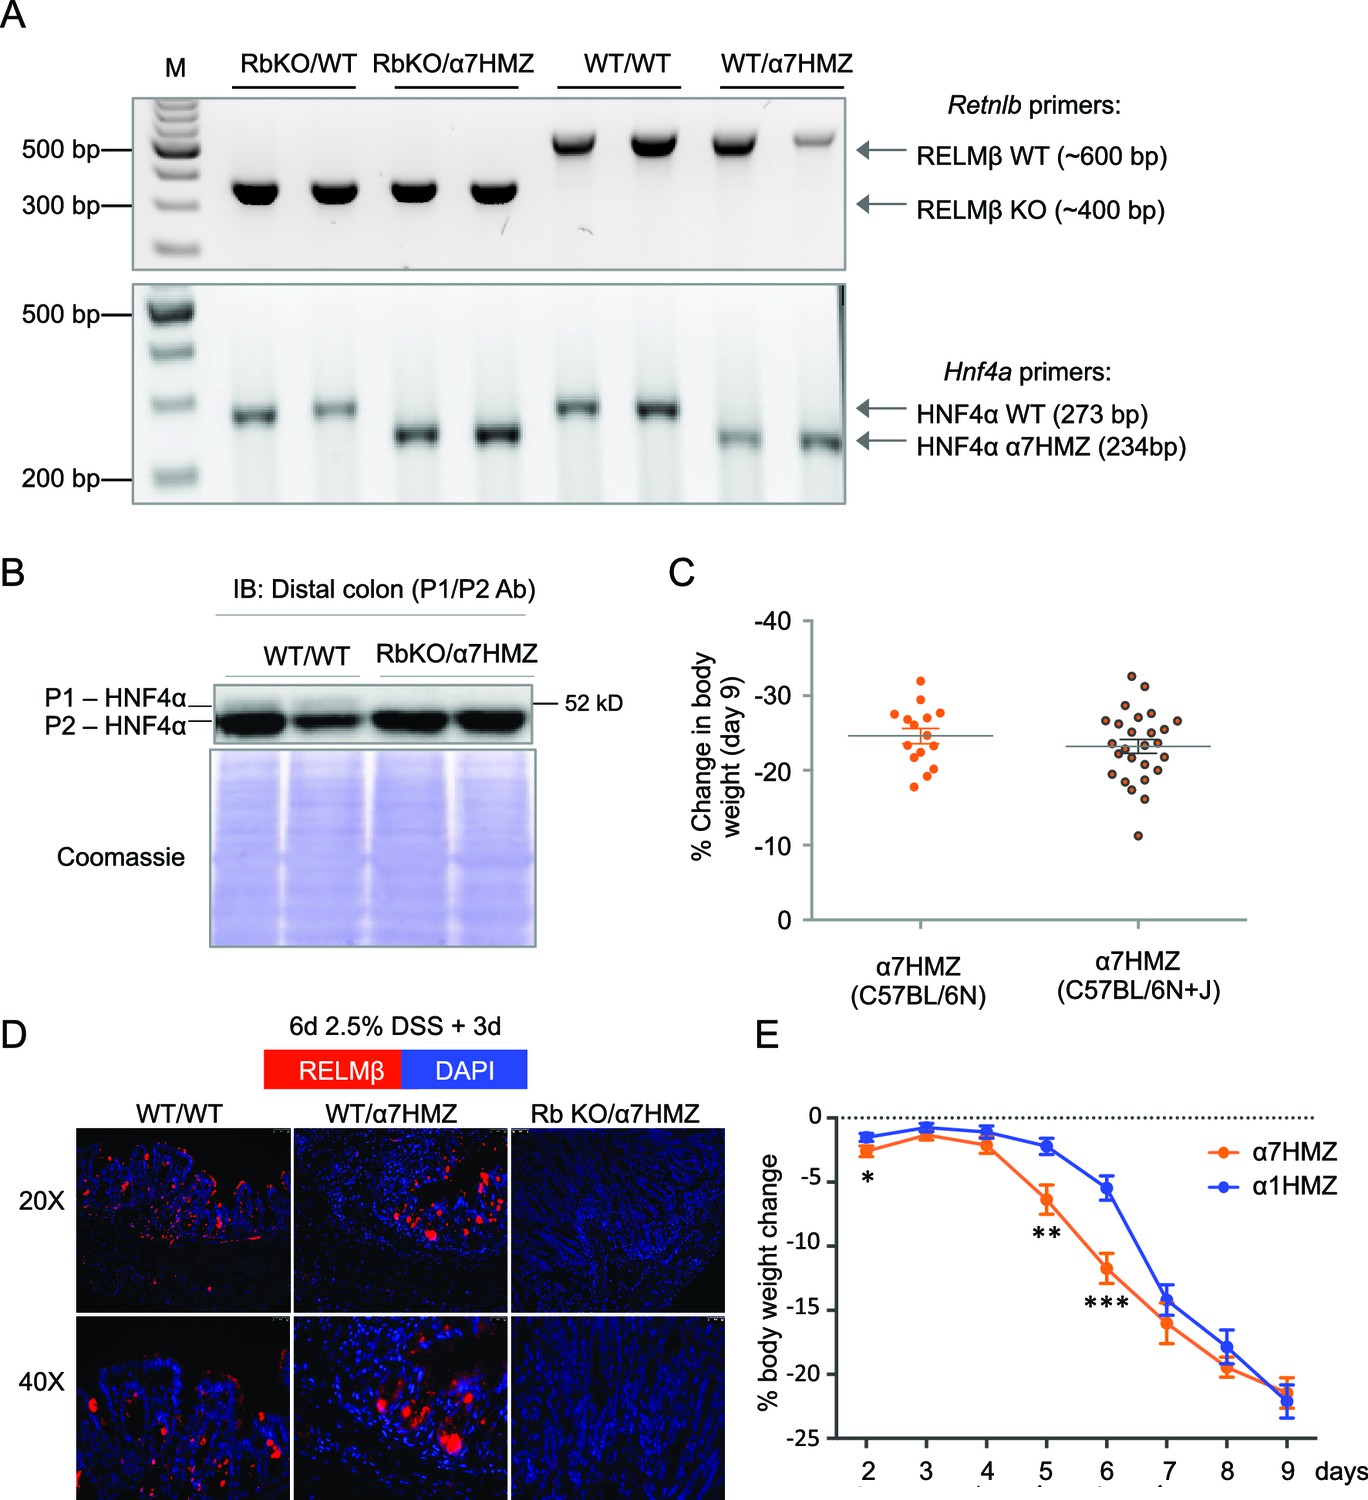
Verification of RELMβKO/α7HMZ mice.
(A) Verification of genotype of RELMβ KO mice crossed into α7HMZ mice. Shown is a representative DNA agarose gel of PCR products generated with primers for the Retnlb and Hnf4a loci for 2 mice per genotype out of hundreds analyzed. Genotypes are written as Retnlb/Hnf4a loci. (B) IB of distal colon WCE using the HNF4α P1/P2 antibody showing roughly equivalent amounts of HNF4α protein in WT/WT and RbKO/α7HMZ mice. Extracts from one mouse are loaded per lane. (C) Percent change in body weight of α7HMZ mice from the two different lines -- the parental α7HMZ line in C57BL/6N and the progeny from the cross with the RELMβ KO (C57BL/6N+J) -- after 6 days of 2.5% DSS followed by 3 days of recovery from 4 (C57BL/6N) to 6 (C57BL/6N+J) independent experiments. N=15-26 mice per genetic background. One experiment was excluded in which the WT/WT mice serving as controls lost less than the usual amount of body weight, suggesting insufficient DSS treatment. (D) Representative IF from one of two mice stained per genotype for RELMβ in the distal colon of the indicated genotypes treated for 6 days with 2.5% DSS followed by 3 days recovery. Red, RELMβ. Blue, DAPI. (E) Percent change in body weight during and following DSS treatment (2.5% for 6 days). Day 0 is the start of treatment. Both α1HMZ (n=13 up to Day 6; n=8 up to Day 9) and α7HMZ (n=9 up to Day 6; n=4 up to Day 9) are in the C57BL/6N background. Data are pooled from two independent experiments except that α7HMZ Days 7–9 is from one experiment. *P<0.05, **P<0.005, ***P<0.0005.
Figure 7 with 1 supplement
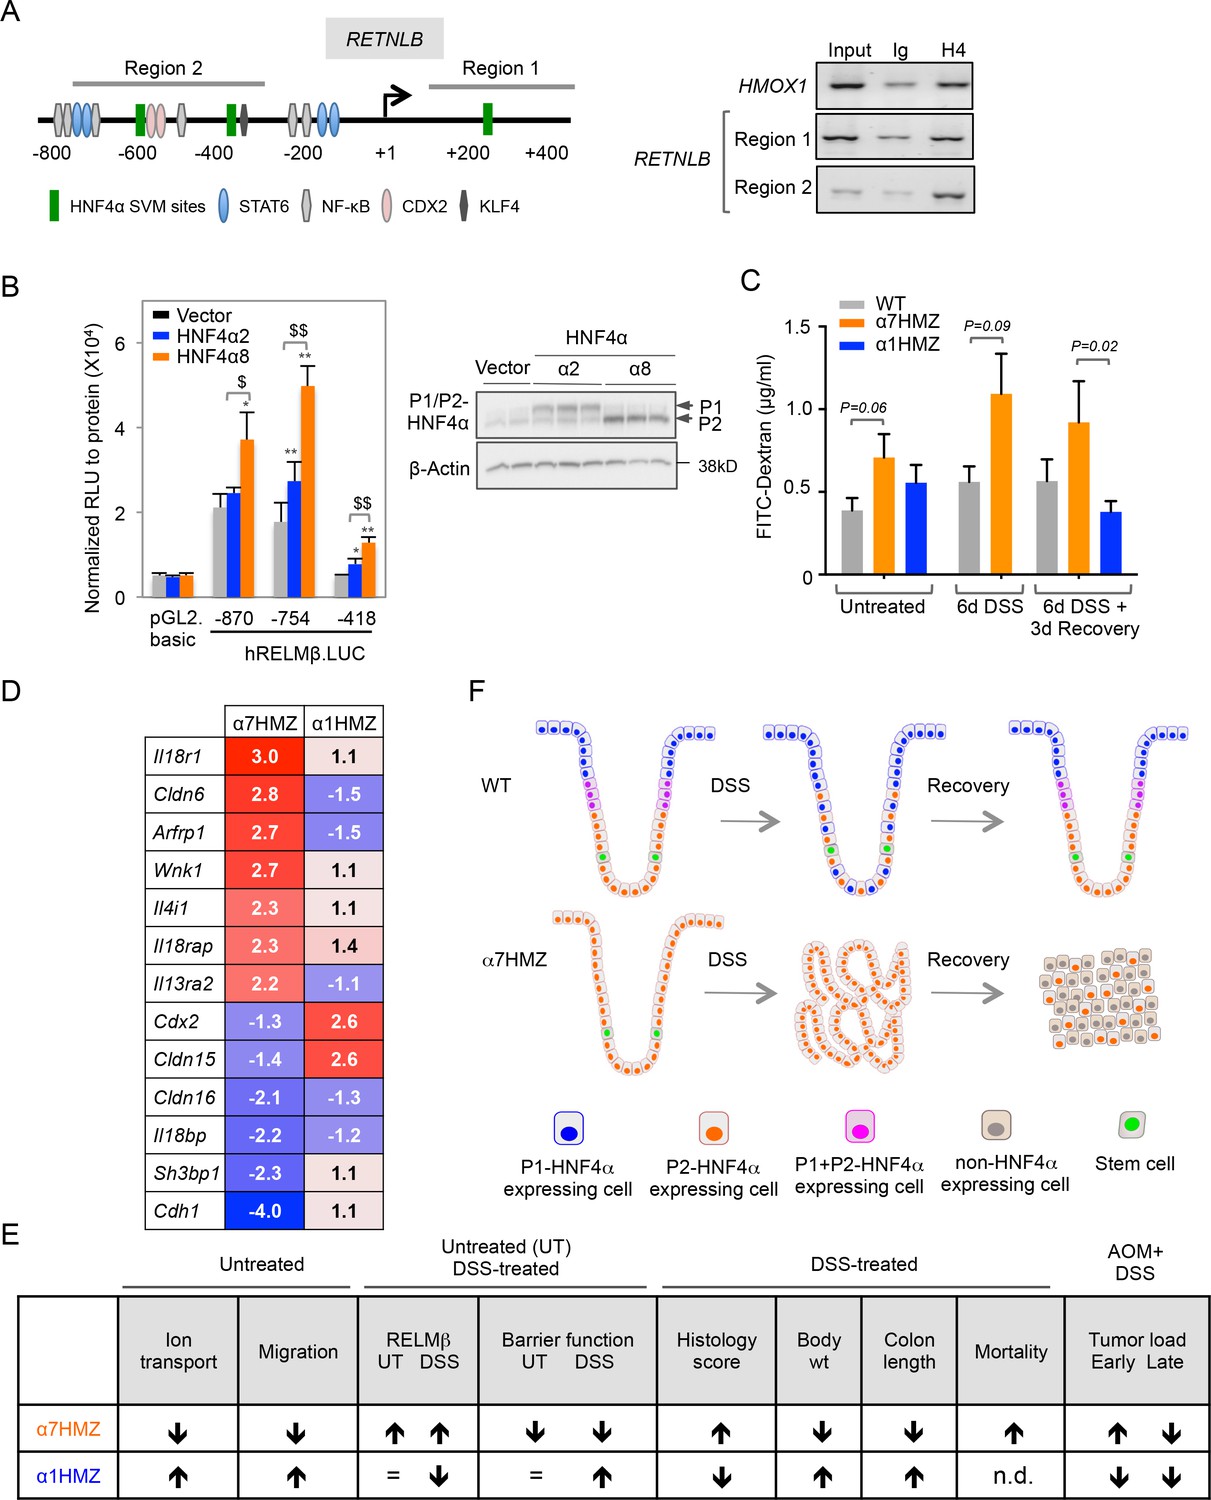
Direct and indirect mechanisms of regulation of RELMβ expression by HNF4α isoforms: impact on DSS sensitivity and recovery.
(A) P2-HNF4α binds the promoter of the RETNLB gene in colonic epithelial cells. Left, schematic of the human RETNLB promoter showing predicted SVM binding sites for HNF4α, as well as sites for NFκB, KLF4, STAT6 and CDX2 (He et al., 2003). Right, ChIP results for endogenous HNF4α in Caco2 cells at RELMβ Region 1 and Region 2, as well as an HMOX1 control. In, input (1/10 dilution); Ig, IgG; H4, anti-HNF4α. (B) Left, uciferase activity of pGL2.basic and RELMβ reporter constructs in LS174T cells cotransfected with vector (pcDNA3.1), human HNF4α2 or HNF4α8. Shown is the RLU normalized to protein concentration. Data are represented as mean of triplicates + SD of one independent experiment. *P<0.05, **P<0.005 between vector control and HNF4α2 or HNF4α8. $P<0.05, $$P<0.005 HNF4α2 versus HNF4α8. Right, IB of extracts from LS174T cell line cotransfected with -870.hRELMβ reporter and HNF4α isoforms. (C) Gut permeability measured by appearance of FITC dextran (4 kDa) in serum of WT, α7HMZ and α1HMZ mice either untreated, treated with 2.5% DSS for 6 days alone or followed by 3 days of recovery. (n = 7–10 for all groups except α7HMZ 6d DSS + 3d recovery where n = 4). P-values were determined by Student’s T-test. (D) List of genes related to barrier function altered in the distal colon of α7HMZ and α1HMZ mice compared to their WT controls. Shown is nonlog fold change from the microarray experiment in Figure 5. (E) Summary of various phenotypes of HNFα isoform-specific mice (α7HMZ and α1HMZ) relative to WT mice in untreated, DSS and AOM+DSS treated animals as indicated. n.d., not done. =, no change. (F) Distribution of HNF4α isoforms in colonic crypts and their effect on crypt structure in DSS-induced colitis. See text for details. The following figure supplement is available for Figure 7:
Figure 7—figure supplement 1
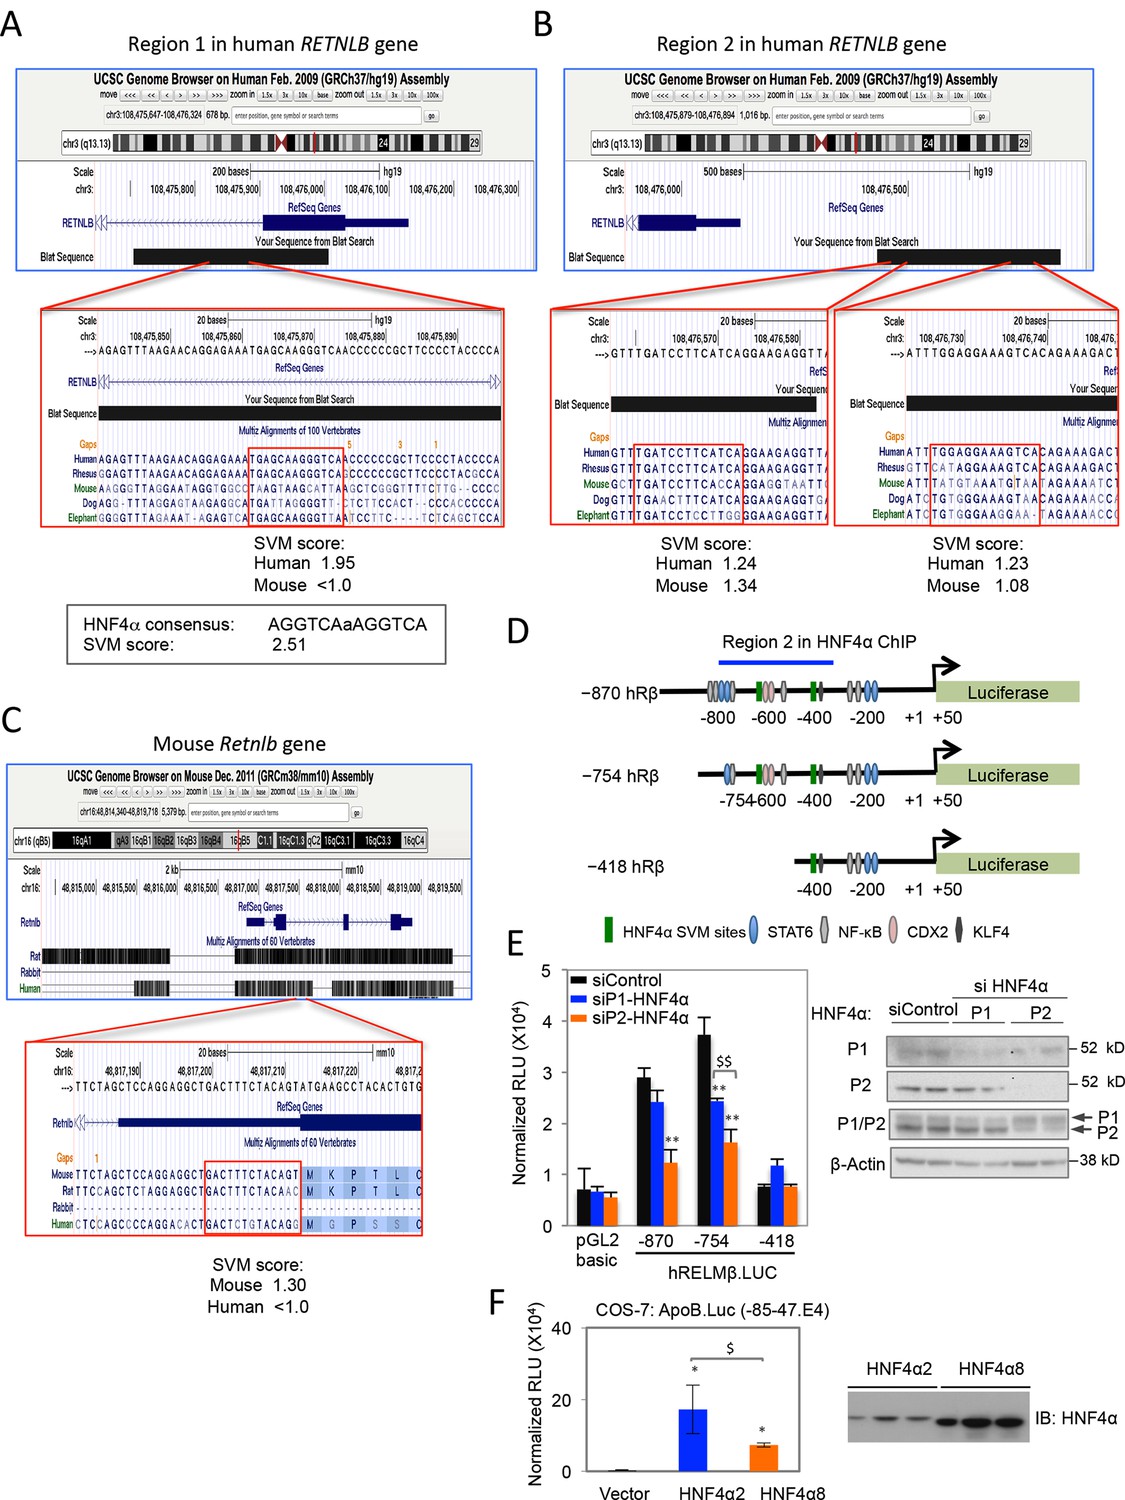
Predicted HNF4α binding sites in the human and mouse RELMβ gene and RELMβ reporter assays.
(A–C). Screenshots of UCSC Genome Browser shows putative HNF4α binding sites in human (AB) and mouse (C) RELMβ genes as well as the fragments amplified by the primers for Region 1 (A) and Region 2 (B). The SVM score from HNF4 Binding Site Scanner is given for the predicted sites in the RELMβ gene as well as the canonical HNF4α motif, AGGTCAaAGGTCA (A). Sites with scores above 1.0 are potential binders; sites with scores >1.5 are predicted to be excellent binders. (D) Schematic of human RELMβ luciferase constructs used in (E) and Figure 7B with transcription factor binding sites and Region 2 bound by HNF4α in ChIP indicated. (E) Left, luciferase activity of pGL2.basic and RELMβ reporter constructs in LS174T cells transfected with siControl, siP1-HNF4α or siP2-HNF4α. Shown is the RLU normalized to β-gal activity. Data are mean of triplicates + SD of one independent experiment. **P<0.005 between siControl and siP1-HNF4α or siP2-HNF4α. $$P<0.005 siP1-HNF4α versus siP2-HNF4α. Right, IB of WCE from LS174T cells transfected with the indicated siRNAs performed in parallel to the luciferase experiment. (F) Left, luciferase activity of ApoB (-85–47.E4) promoter construct co-transfected with HNF4α2 or HNF4α8 expression vector (500 ng) in COS-7 cells. Bar graphs represent mean ± SD of triplicate samples from one independent experiment. *HNF4α2/8 vector compared to empty vector, $HNF4α2 vector compared to HNF4α8 vector, P<0.05. Right, IB analysis of HNF4α protein level in COS-7 cells. COS-7 cells do not express endogenous HNF4α protein.
Additional files
-
Repoarting Standard
NC3Rs ARRIVE guidelines checklist.
- https://doi.org/10.7554/eLife.10903.018
Download links
A two-part list of links to download the article, or parts of the article, in various formats.
Downloads (link to download the article as PDF)
Open citations (links to open the citations from this article in various online reference manager services)
Cite this article (links to download the citations from this article in formats compatible with various reference manager tools)
Opposing roles of nuclear receptor HNF4α isoforms in colitis and colitis-associated colon cancer
eLife 5:e10903.
https://doi.org/10.7554/eLife.10903


