Mapping replication dynamics in Trypanosoma brucei reveals a link with telomere transcription and antigenic variation
- University of Glasgow, United Kingdom
Figures
Figure 1 with 1 supplement

T. brucei RECQ2 is non-essential and acts in genome repair.
(A) Representation of predicted protein domains in TbRECQ2. Approximate position (in amino acids, aa, from the N-terminus, N) of predicted functional domains (boxed) is shown underneath the diagram (not to scale). (B) The cell density of wild type (WT) cells and recq2 +/- and -/- mutants cultures was counted every 24 hr up to a maximum of 96 hr, starting from a cell density of 1 x 10⁴ cells.mL1. The mean cell density from three independent experiments is shown on a Log10 Y-axis graph; error bars depict standard error of the mean. (C) Cell cycle analysis of WT cells and recq2 +/- and -/- mutants. DNA content was evaluated after DAPI staining of fixed cells and the number of cells with one nucleus and one kinetoplast (1N1K, white box), one nucleus and two kinetoplasts (1N2K, hatched box), two nuclei and two kinetoplasts (2N2K, black box) and cells that did not fit into any of these categories (other, grey box) were counted. The proportion of each cell type is represented as a percentage of the total cells counted (N).(D) Western blotting of whole cell extracts from WT and recq2-/- mutants grown in the absence (-) of methyl methane sulphonate (MMS), or for 18 hr in media containing 0.0003% MMS (+). Blots were probed with peptide antiserum recognizing Thr130 phosphorylated T. brucei histone H2A (γ-H2A) and, as loading control, polyclonal antiserum recognizing T. brucei EF1α. (E) Clonal survival ofwild type (wt) cells and recq2 heterozygous (+/-) or homozygous (recq2-/-) mutants is shown in the presence of varying concentrations of MMS, phleomycin or hydroxyurea (HU). Mean survival (%) is plotted of the treated cells relative to untreated from three independent experiments, with vertical lines representing standard error of the mean.
Figure 1—figure supplement 1

Generation of recq2 null mutants in bloodstream form T. brucei.
(A) PCR was used to amplify a 5’ and a 3’ region (blue arrows) of the RECQ2 ORF (orange arrow). These PCR products were the ‘targeting regions’ cloned into the constructs shown below,which weremade to generate heterozygous (+/-) and knockout (-/-) mutants by replacing the ORF with resistance cassettes. Generalised representation of the linearised blasticidin and neomycin (G418) resistance constructs relative to the RECQ2 ORF (orange) and the targeting flanking regions (UTR; grey), which allow HR-mediated exchange (crosses). β/α tub, β/ α tubulin intergenic region; actin IR, actin intergenic region; BSD, blasticidin resistance; NEO, neomycin (G418) resistance. Not to scale. (B) The upper diagram shows diagnostic PCRs to confirm replacement of RECQ2 with the knockout constructs (positions of primers are indicted by arrows): a region of the ORF was amplified (“ORF PCR”) and, in addition, a region was amplified using a forward primer lying upstream of the 5’ UTR region in the knockout construct and a reverse primer specific to the BSD or NEO genes (“BSD PCR” and “NEO PCR”, respectively). The lower diagram shows agarose gels of PCR products generated from genomic DNA from wild type (WT) cells and heterozygote (+/-) and knockout (-/-) clones using primers described above. Distilled water was used as a negative control (-). Broken lines indicate different images aligned in this figure; size markers are shown (bp). (C). RT-PCR confirmation of recq2 mutants. A region of the PIF6 ORF and a region of the RECQ2 ORF was PCR-amplified using cDNA (+RT) synthesised from RNA extracted from wild type (wt) cells and from recq2+/- and recq2-/- mutants; control samples in which no reverse transcriptase had been added (-RT) are shown, as are controls using distilled water rather than substrate (-); size markers on the agarose gels are shown (bp).
Figure 2
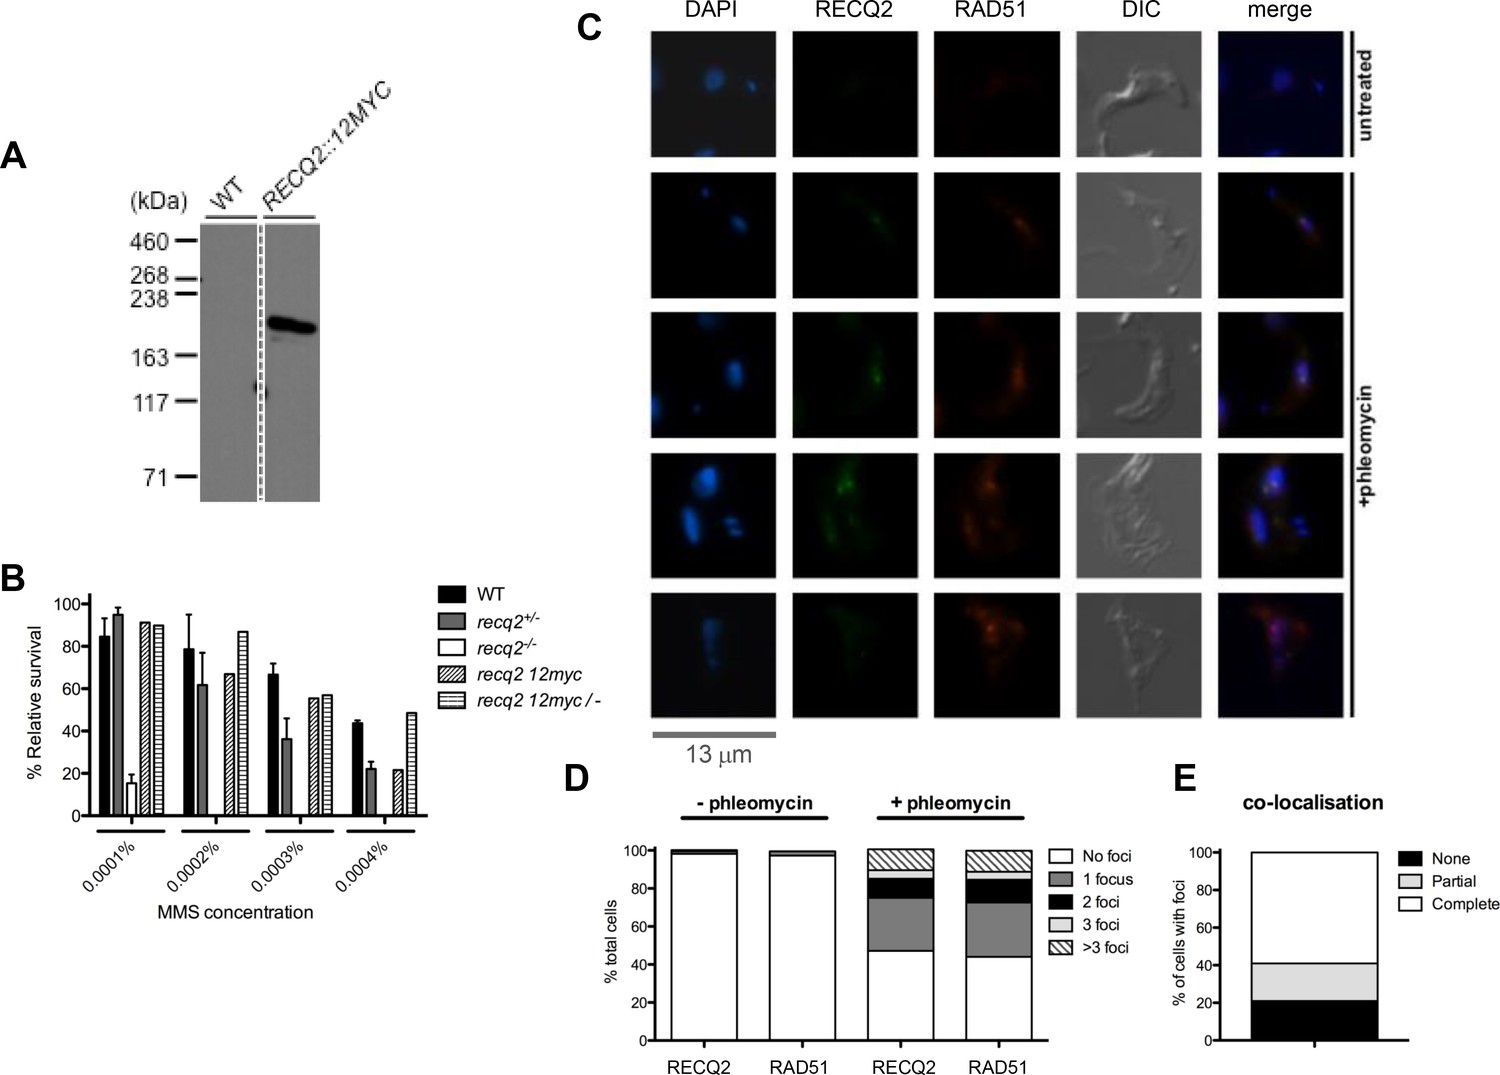
TbRECQ2 is a nuclear factor that relocalises to foci in the presence of DNA damage, when it colocalises with RAD51.
(A) Western blot analysis of WT cells relative to cells expressing 12myc-tagged RECQ2 from the endogenous locus; size markers are shown (kDa). (B) Clonal survival of cells expressing myc-tagged RECQ2 (12myc and 12myc/-) is shown relative to WT, recq2+/- and recq2-/- cells in the presence of varying concentrations of MMS. Mean survival (%) is plotted of the treated cells relative to untreated from three independent experiments, with vertical lines representing standard error of the mean. (C) Representative examples of 12myc-RECQ2 and RAD51 cellular localisation in fixed cells, including after 18 hr growth in the presence or absence of phleomycin (1 μg.mL-1); bar: 13 μm. The tagged protein was detected by direct immunofluorescence using an anti-myc antiserum coupled with the Alexa Fluor 488 flurophore (myc, green), while RAD51 was localised by indirect immunofluorescence using a rabbit anti-RAD51 antisera and an Alexa Fluor 594 goat anti-rabbit IgG antiserum; DNA was visualized with DAPI, and differential interference contrast (DIC) was used to visualise whole cells. (D) Percentage of cells containing 12myc-TbRECQ2 and RAD51 foci, as well as the number of detectable foci either in the absence (- phleomycin) or presence (+ phleomycin) of phleomycin is shown. (E) Cells containing 12myc-RECQ2 and RAD51 foci following phleomycin treatment were categorised according to the degree of foci co-localisation, represented as percentage of cells that contained foci.
Figure 3 with 1 supplement
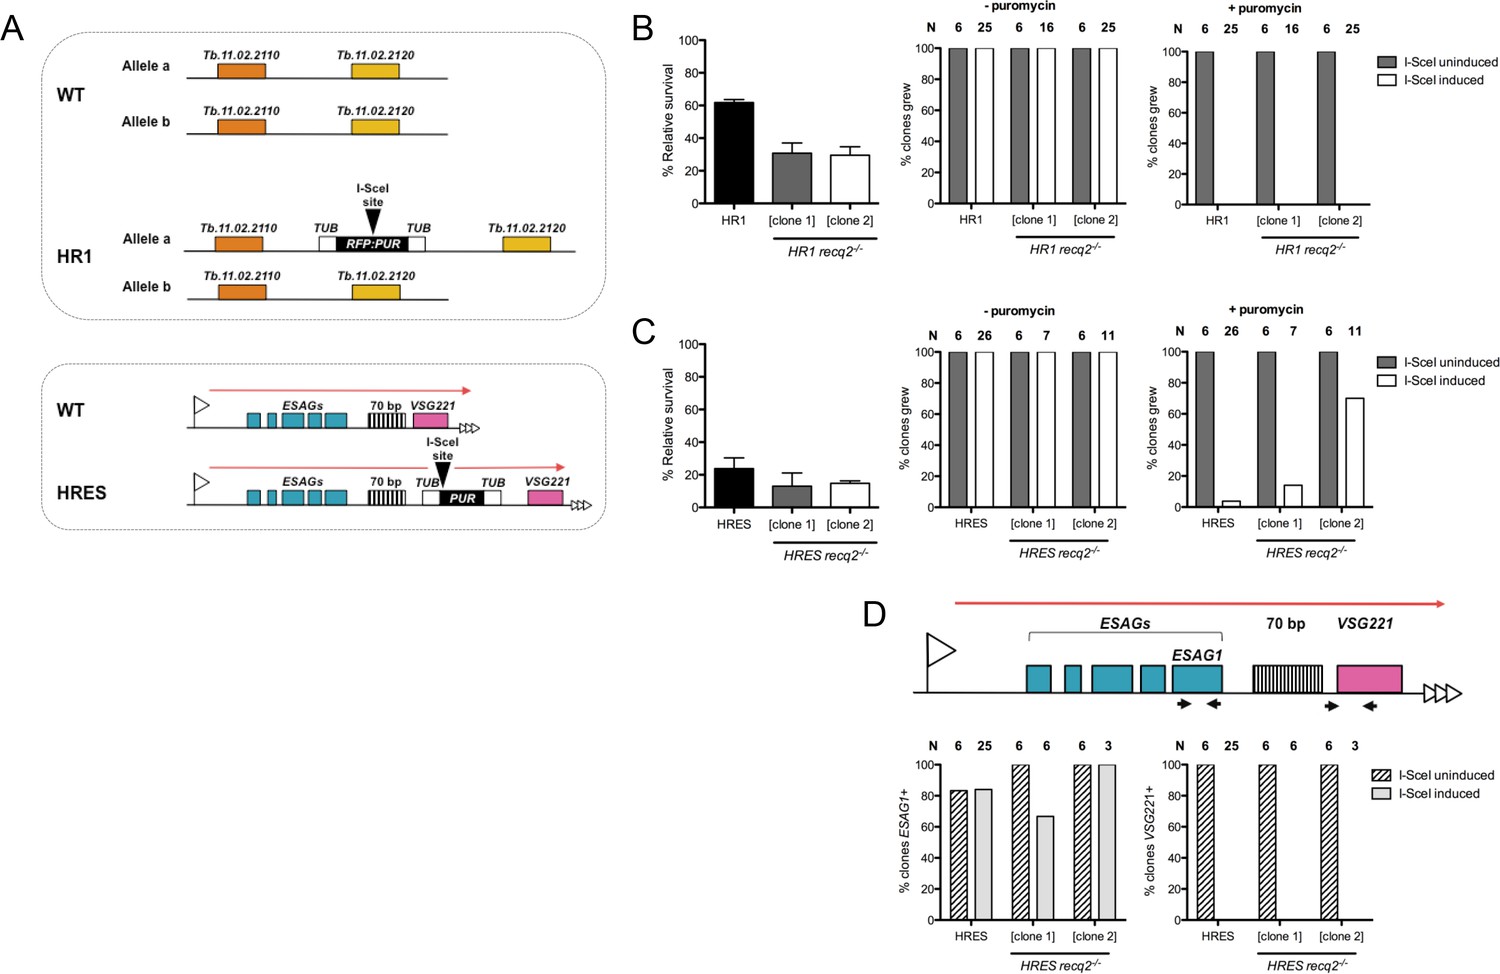
Mutation of TbRECQ2 impairs survival of T. brucei after induction of a DNA double strand break, either in the active telomeric VSG expression site or in the core of a chromosome.
(A) I-SceI target sequences in HR1 and HRES cells. HR1 cells contain an I-SceI recognition site embedded within an RFP:PUR fusion gene (black), flanked by tubulin sequences (white), located between genes Tb.11.02.2110 and Tb.11.02.2020 on one copy of chromosome 11; HRES cells contain an I-SceI recognition site upstream of a PUR gene, flanked by tubulin sequences, located downstream of the 70 bp repeats of the active VSG221 expression site on chromosome 6. B and C show clonal survival following I-SceI induction in HR1 and HRES cells, respectively. In both cases, wild type and two recq2-/- clones were distributed in three 96 well plates at a concentration of 0.26 cells per well either in the absence (I-SceI uninduced) or presence (I-SceI induced) of 2 μg.mL-1 tetracycline. The number of wells with surviving cells after 7–10 days growth is depicted as percentage of survivors following I-SceI induction relative to survivors without I-SceI induction; error bars represent standard error of the mean between three experimental repeats. Puromycin sensitivity of surviving I-SceI induced and uninduced clones was then tested, and is represented as the percentage of tested clones that grew in the presence (+) or absence (-) of 1 μg.mL-1 puromycin (N: number of clones analysed). (D) Clones from (C), excluding those that were puromycin resistant, were assayed for ESAG1 and VSG221 presence by PCR; data are shown as the percentage that were PCR positive (N: number of clones analysed).
Figure 3—figure supplement 1
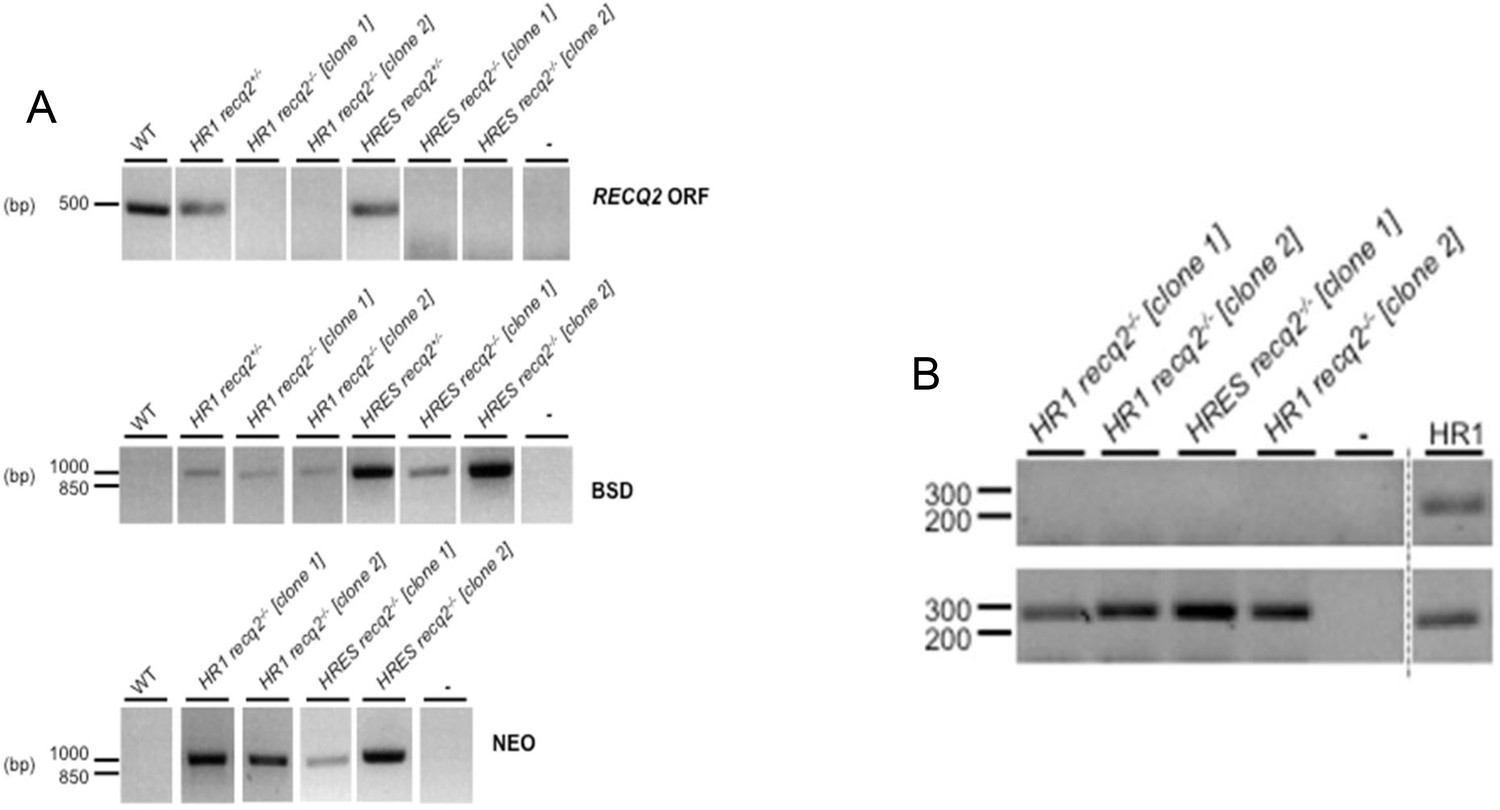
Generation of TbRECQ2 mutants in T. brucei HR1 and HRES cells.
(A) Agarose gels of PCR products generated from genomic DNA from HRES or HR1 wild type (WT) cells and RECQ2 heterozygote (+/-) and knockout (-/-) clones using primers described in the Figure S1B. Gaps indicate that lanes have been aligned in this figure after excision from multiple gels or from disparate parts of the same gel; size markers are shown (bp). (B) Confirmation by PCR of RECQ2 knockout in HR1 and HRES cell lines. Agarose gels showing products generated when PCR was performed on a region of the PIF6 ORF or the RECQ2 ORF using cDNA (+RT) synthesised from RNA extracted from recq2-/- mutants; control reactions in which no substrate was added (-), or where cDNA from HR1 WT cells was used, are shown. Gaps indicate that lanes have been aligned in this figure after excision from multiple gels or from disparate parts of the same gel; size markers are shown (bp).
Figure 4 with 2 supplements
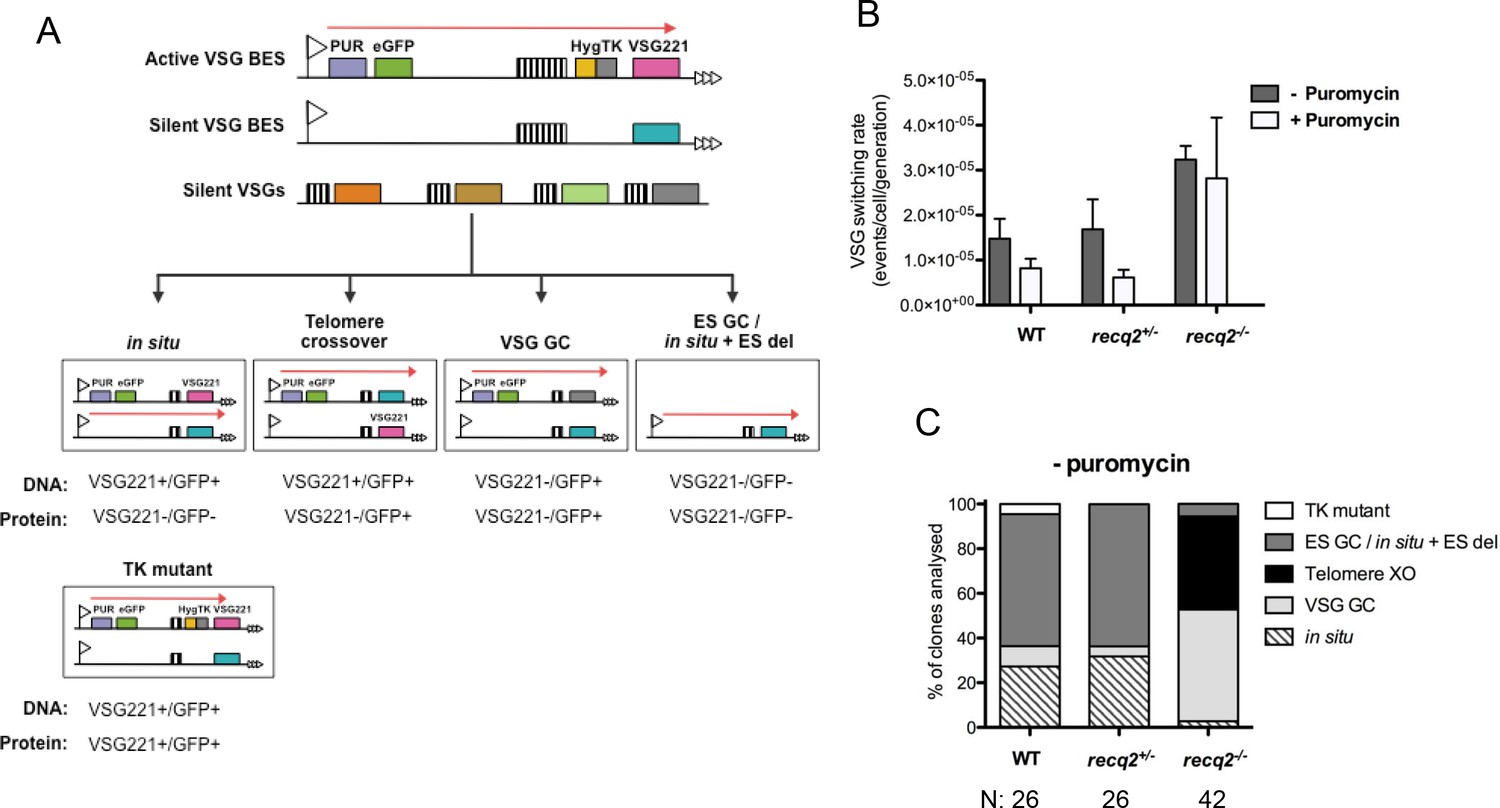
Mutation of TbRECQ2 leads to elevated VSG switching and increased recombination.
(A) Strategy for determining VSG switching mechanisms; adapted from Povelones et al. (2012). The active VSG BES of GFP221hygTK cells is shown, within which the PUR, eGFP, HYG-TK and VSG221 genes are represented as coloured boxes. In addition, one of the ~14 silent BES containing a distinct VSG (turquoise box) is shown, as are multiple silent VSGs elsewhere in the genome (various colours; for convenience these are shown as a single array, but could also be at the telomere of silent mini-chromosomes). 70 bp repeats upstream of the VSGs are denoted by hatched boxes. Different switching strategies allow survival after ganciclovir treatment and can be distinguished by analysis of VSG221 and GFP presence by PCR, and expression of the proteins by western blot (profiles detailed under each mechanism). Switchers that arise by in situ switching, telomere crossover (XO) or VSG gene conversion (VSG GC) can be detected unambiguously, while events that occur by BES gene conversion or in situ switching coupled with BES deletion (ES GC/ in situ+ES del) are indistinguishable. Note, only in situ+ES del reaction is shown, and not ES GC (where all sequence of a silent BES is duplicated and replaces the VSG221 BES); in addition, for VSG GC the silent grey array donor VSG gene is shown as being copied, but the reaction could also use a BES VSG gene. Non-switcher TK mutants can also allow ganciclovir survival. (B) The mean switching rate of GFP221hygTK WT and recq2 mutants (+/- and -/-) was inferred from the mean number of survivors from two experiments, each with three replicates, following treatment with ganciclovir and after culture with (+) or without (-) puromycin; error bars represent standard error of the mean. (C) Profiles of WT and recq2 mutants (+/- and -/-) survivors in the non-puromycin experiments, represented as a percentage of total surviving clones analysed from the two datasets; number of clones (N) analysed is indicated.
Figure 4—figure supplement 1

Generation of TbRECQ2 mutants in T. brucei GFP221hygTK cells.
(A) Confirmation of the generation of GFP221hygTK cells by PCR and western blot. The upper diagram shows PCR performed on genomic DNA extracted from GFP221hygTK transformants or wild type (WT) cells, testing for integration of the 221GP1 and HYG-TK constructs. Size markers (bp) are shown. The lower diagram shows westerns blots of total protein extract of GFP221hygTK cells probed with rabbit anti-VSG221 antisera or with rabbit anti-GFP antiserum; size markers (kDa) are shown. (B) PCR and western blot analysis of GFP221hygTK recq2 mutants. The upper diagrams show PCR performed on genomic DNA extracted from GFP221hygTK recq2+/- and GFP221hygTK recq2-/- cells, testing for the RECQ2 ORF, integration of the BSD or NEO resistance cassettes, and retention of the 221GP1 and HYG-TK constructs; size markers are shown (bp). The lower diagram shows westerns blots of total protein extract of GFP221hygTK recq2+/- and GFP221hygTK recq2-/- cells cells probed with rabbit anti-VSG221 antisera or with rabbit anti-GFP antiserum; size markers (kDa) are shown. In all gels, gaps indicate that lanes have been aligned in this figure after excision from multiple gels/membranes, or from disparate parts of the same gel/membrane.
Figure 4—figure supplement 2
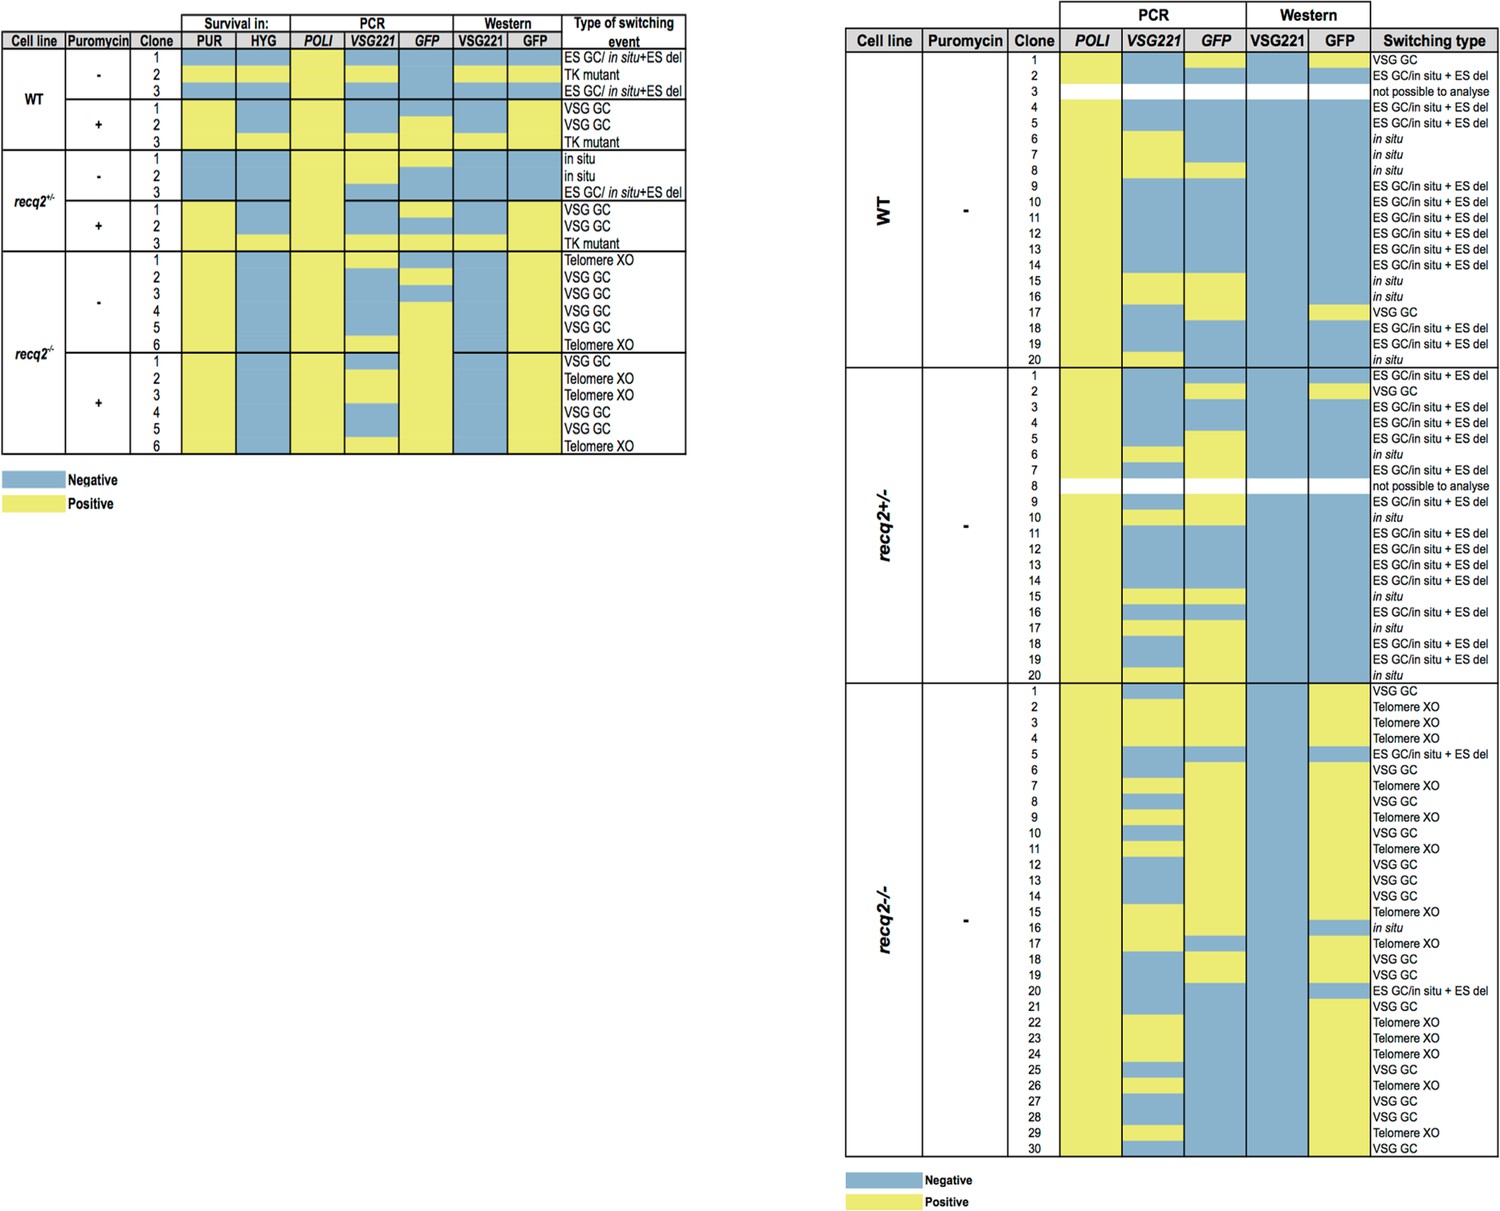
Summary table of ganciclovir survival mechanisms.
Summary of PCR and western analysis of clones from the first (left) and second (right) ganciclovir survival experiments. GFP221hygTK wildtype (WT), GFP221hygTK recq2+/- and GFP221hygTK recq2-/- cells are shown, as are whether or not clonal survival in ganciclovir was conducted in the presence (+) or absence (-) of puromycin. ‘Survival in’ denotes whether or not the clones that were recovered could grow in the presence of puromycin (PUR; 1 μg.mL-1) or hygromycin (HYG; 10 μg.mL-1). The following columns summarise the results of PCR to assay for the presence or absence of RNA POLI, GFP and VSG221 genes, and westerns to detect expression of GFP or VSG221; blue indicates a negative result and yellow indicates a positive result, while completely white rows indicate clones that could not be analysed, either due to absence of detectable genomic DNA or of protein in the cell lysate. The final column summarises the inferred strategy for survival, as detailed in Figure 5.
Figure 5 with 1 supplement

Analysis of cell cycle progression, DNA repair kinetics and VSG expression after I-SceI-mediated DNA double strand break formation.
Cell cycle analysis of HRES (A) and HR1 (B) cells following I-SceI induction. DNA content is shown 12 and 24 hr post I-SceI induction (+T) after visualisation by DAPI staining of fixed cells; uninduced cells (-T) were analysed as a control. The number of cells with one nucleus and one kinetoplast (1N1K), one nucleus and two kinetoplasts (1N2K), two nuclei and two kinetoplasts (2N2K) and cells that did not fit into any of these categories (other) were counted. The proportion of each cell type is represented as a percentage of the total cells counted (N). (C) Relative efficiency of PCR amplification of the I-SceI target sequence is shown at various time points after induction of I-SceI in HR1 and HRES cells; values are shown at each post-induction time point as a percentage of the amount of PCR product generated at 0 hr; values are the mean of three experimental repeats and vertical lines denote standard deviation. (D) Relative PCR amplification of the VSG221 gene downstream of the I-SceI target is shown after I-SceI induction in HRES cells; values were determined and are represented as in C. (E) VSG221 expression in HRES cells 24 hr post I-SceI induction was visualised by indirect immunofluorescence of fixed cells with anti-VSG221 antiserum (+), and are compared with control cells in which only secondary antiserum was used (-). The graphs below show the proportion of cells expressing VSG221 on their surface 24 hr post I-SceI induction (+T), or without I-SceI induction (-T); data are represented as the percentage of total cells counted (N).
Figure 5—figure supplement 1
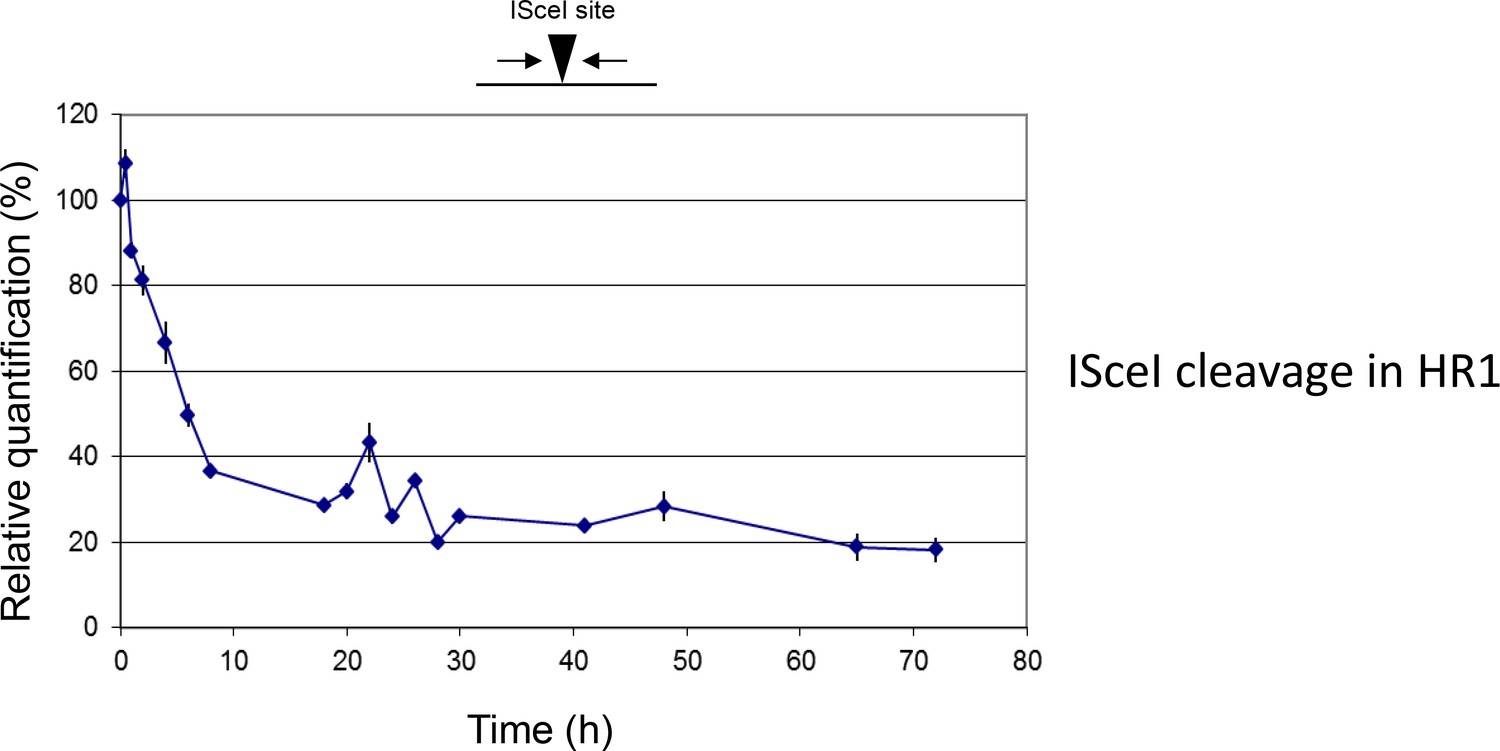
Break formation over 72 hr after ISceI induction in T. brucei HR1 cells.
Relative efficiency of PCR amplification of the ISceI target sequence is shown at various time points up to 72 hr after induction of ISceI in HR1 cells: values are shown at each post-induction time point as a percentage of the amount of PCR product generated at 0 hr; values are the mean of three experimental repeats and vertical lines denote standard deviation.
Figure 6
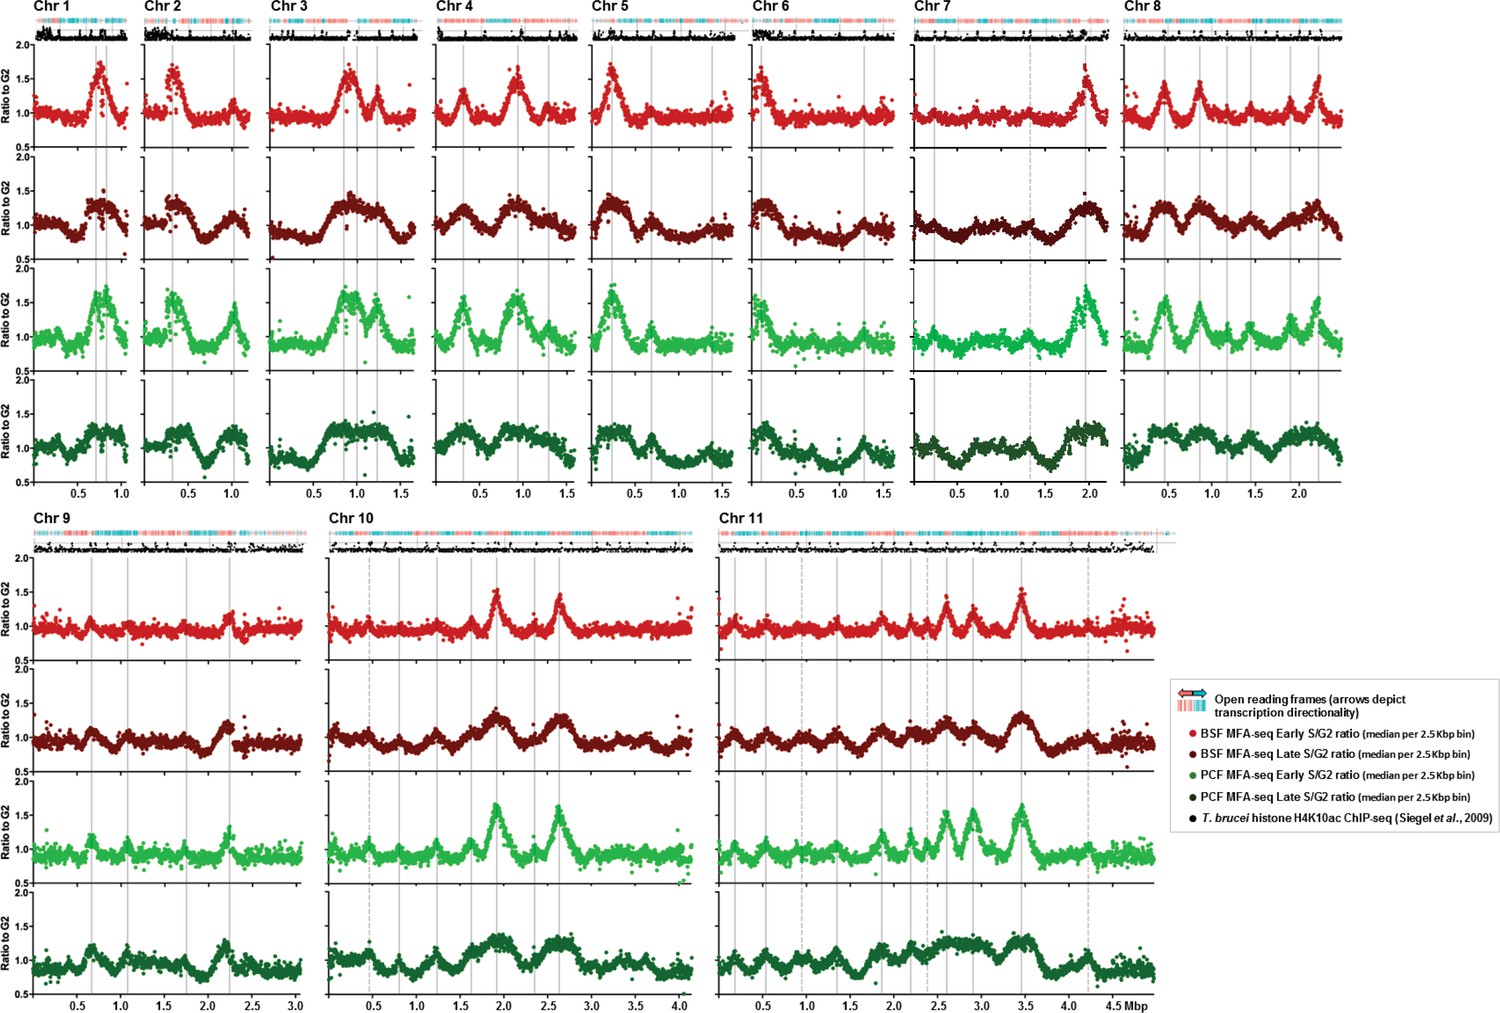
Replication timing throughout the core genome is stringently conserved between BSF and PCF T. brucei cells.
Each set of four graphs shows the distribution of replication origins in the 11 megabase chromosomes (depicted as Chr1 to Chr11), assessed by MFAseq (Tiengwe et al., 2012). At the top of each set of graphs is a track representing the genes in the chromosome: in blue the open reading frames (ORFs) are transcribed from the left to the right, and in red they are transcribed from right to left. Below each set of graphs is a track depicting histone H4K10ac-enriched sites (Siegel et al., 2009). The four graphs in each case show the ratio between the coverage (read-depth) of DNA derived from Illumina sequencing of early S phase and G2 phase cells, or late S phase and G2 phase cells, where each point represents the median S/G2 ratio (y-axis) in 2.5 Kbp bins across the chromosome (x-axis; bars indicate 500 Kbp intervals). All graphs are scaled according to chromosome size. The light red graph shows MFAseq for BSF early S cells, while dark red represents the data from late S phase. PCF MFAseq data is shown for early S cells in light green, and in dark green for late S. Vertical, solid grey lines represent the origins identified previously (Tiengwe et al., 2012), while dashed lines highlight replication origins only observed in this study.
Figure 7

The active VSG expression site in bloodstream form T. brucei cells is the only telomeric site that is early replicating.
(A) Immunofluorescence of PCF or BSF Lister 427 cells and BSF strain Lister 427 with anti-VSG 221 antiserum or with anti-EP procyclin antiserum; top panels show the cells stained with DAPI, while the bottom panel shows the cells’ outline by DIC. Images were acquired with the Axioskop 2 imaging system and the scale bar represents 5 μm. (B) The Lister 427 bloodstream VSG expression site (BES) TAR clones sequenced by (Hertz-Fowler et al., 2008) were used to map the MFAseq data from BSF and PCF cells; note that two BES are represented by duplicate TAR clones: BES 7 (ϕ – TAR 65; ϕϕ – TAR 153), and BES 17 (ϕ – TAR 51; ϕϕ – TAR 59). The ratio between sequence coverage (read-depth) in early S phase and G2 phase cells, or late S phase and G2 phase samples, is plotted, where each point represents the median S/G2 ratio (y-axis) per 2.5 Kbp bin across the BES (x-axis). The size of each BES is shown on each x-axis in 10 Kbp intervals, and all graphs are scaled according to BES size. The y-axis scale is the same for all graphs, but the legend is only shown on the ones at the far left. BSF early S data is represented as light red, BSF late S as dark red, PCF early S as light green, and PCF late S as dark green. The red dashed box highlights BES 1. (C) The S/G2 values used to generate the graphs in (B) are shown plotted per sample (BSF early S – light red, BSF late S – dark red, PCF early S – light green, and PCF late S – dark green), rather than by genomic location, for each BES (numbered as before). Horizontal bars (black) represent the median of the S/G2 values, and error bars the interquartile range. In order to infer statistical significance, the values were analysed with the non-parametric, unmatched, Kruskal-Wallis test; statistical significance is only shown for differences between the BSF and PCF samples: (**) p-value <0.01; (***) p-value <0.001; (****) p-value <0.0001.
Figure 8
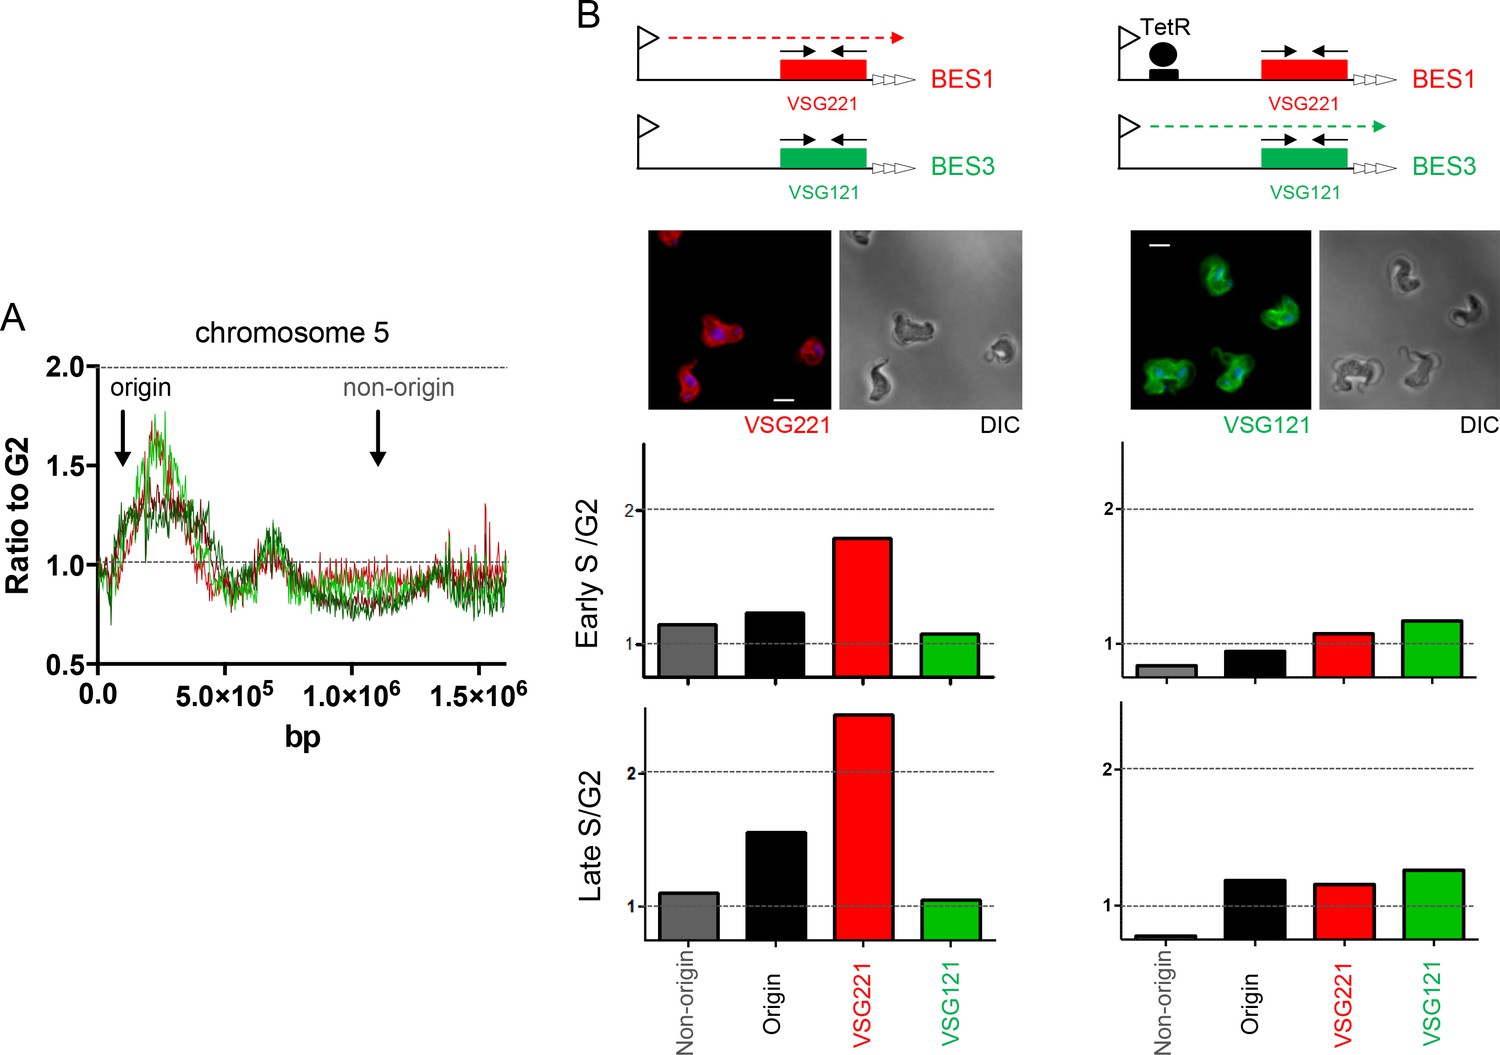
Determination of telomere replication timing in T. brucei cells expressing distinct bloodstream VSG expression sites.
(A) MFAseq of chromosome 5, as shown in Figure 6, comparing S/G2 read depth ratios in 2.5 kbp bins in bloodstream form (early S – light red; late S – dark red) and procyclic form (early S – light green; late S – dark green) cells. Arrows highlight the locations of an early replicating (origin) locus and a late replicating (non-origin) locus, which were used in real-time quantitative (q)PCR validation. (B) qPCR to determine replication timing of VSG221, VSG121 and chromosome 5 origin and non-origin loci in cells in which BES1 (containing VSG221, red box) is actively transcribed (left), or in which (left) elongation of BES1 transcription in blocked by Tet repressor (TetR, black circle) binding to a Tet operator (black box) adjacent to the BES promoter (arrow), leading to transcription (dotted arrow) of BES3 (containing VSG121, green box). In each representation of the BES only the VSG genes are shown and black arrows denote the approximate location of primers used in qPCR; below each diagram immunoflouresence microscopy with anti-VSG221 (left, red) and anti-VSG121 antiserum (right, green) is shown (cells are shown by differential interference contrast, DIC). Graphs depict the relative abundance of PCR product from VSG221, VSG121, origin and non-origin loci in the two cell types shown above; in each case qPCR was used to determine the amount of the PCR products in DNA from early S phase cells relative to G2 (upper graph), or in late S phase cells relative to G2 (lower graph). S/G2 ratios are the mean of three qPCR repeats.
Figure 9
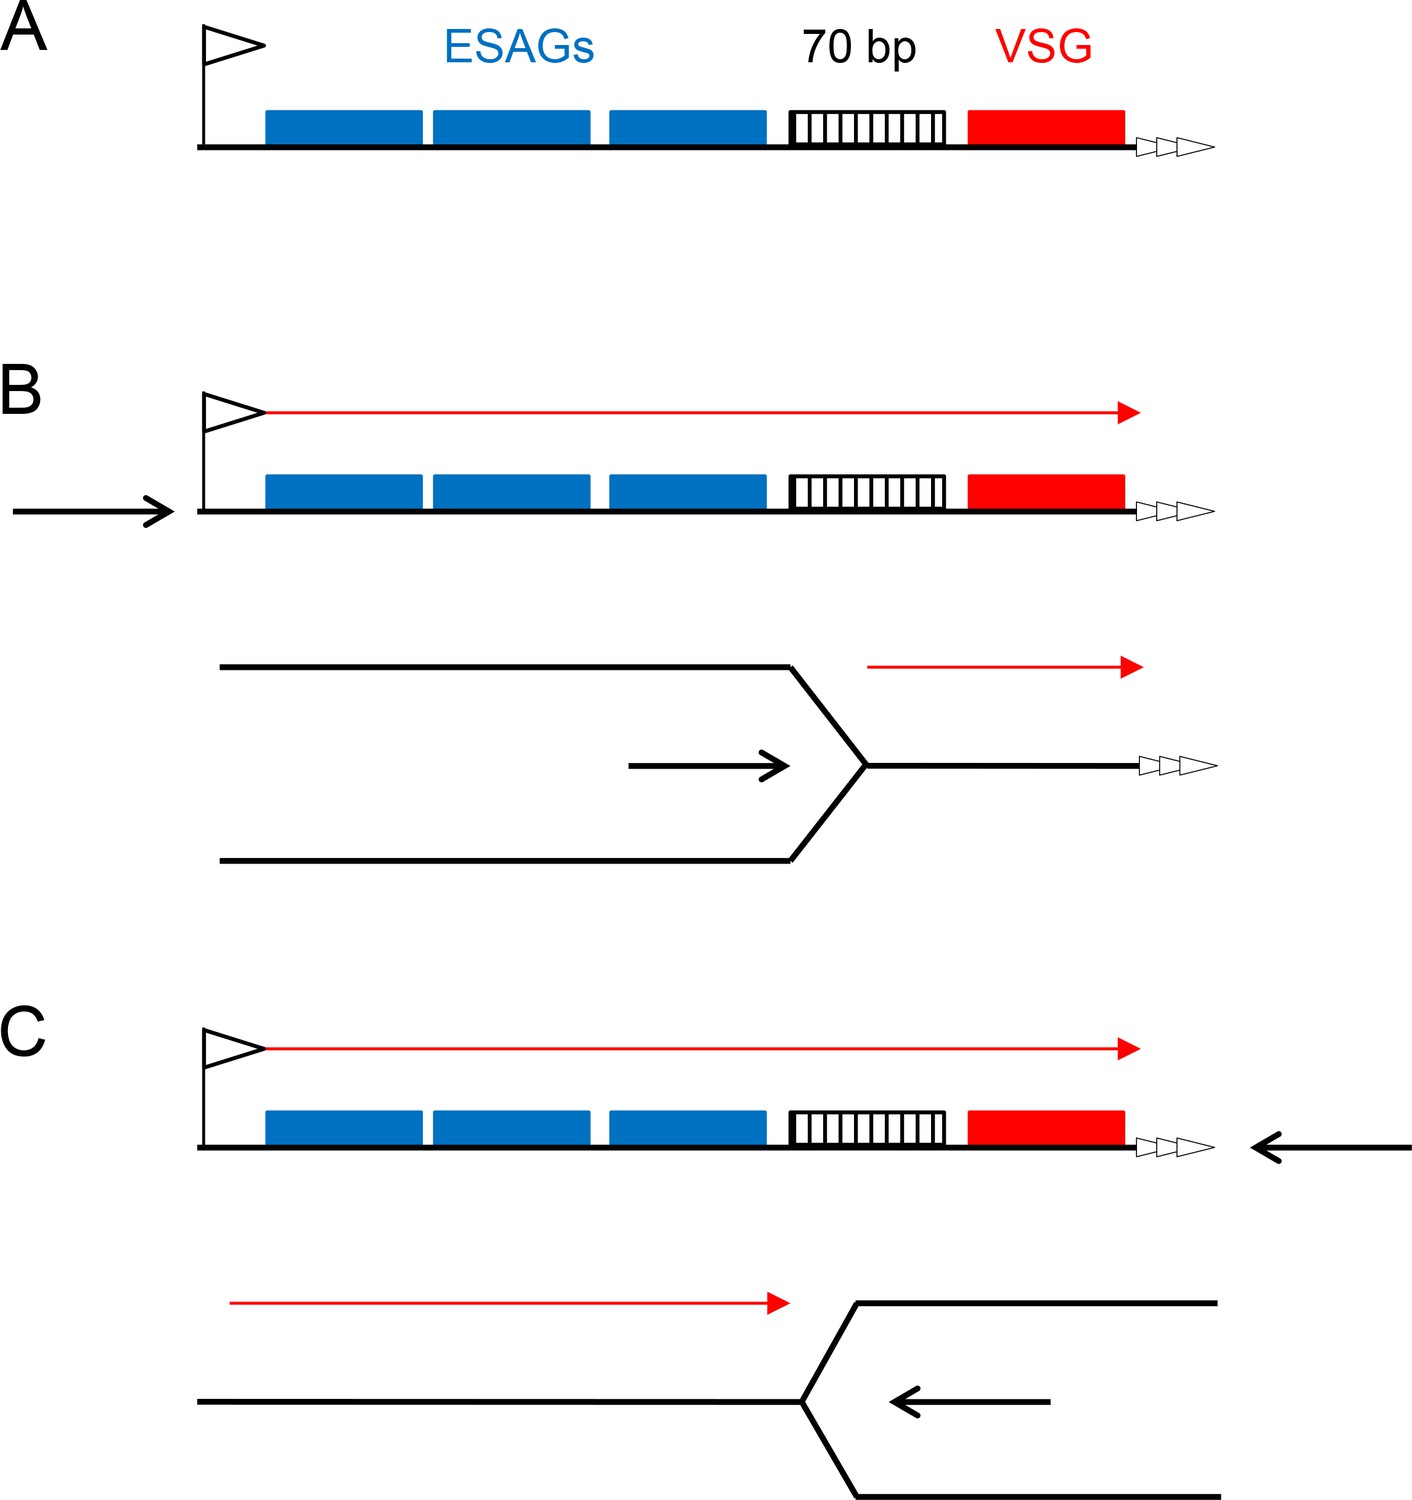
Two models for replication-directed VSG switching.
A schematic of a bloodstream VSGexpression site is shown (A; not to scale), detailing key features (left to right): the promoter (flag), a number of expression site-asscociated genes (ESAGs; blue boxes), 70 bp repeats (hatched box), the VSG gene (red box) and the telomere repeats (white arrows). Transcription direction is detailed in B and C (red arrow), which compare the effects of replication initating (black arrow) at the promoter or at the telomere, with replication fork movement proceeding left to right, or right to left, respectively.
Download links
A two-part list of links to download the article, or parts of the article, in various formats.
Downloads (link to download the article as PDF)
Open citations (links to open the citations from this article in various online reference manager services)
Cite this article (links to download the citations from this article in formats compatible with various reference manager tools)
Mapping replication dynamics in Trypanosoma brucei reveals a link with telomere transcription and antigenic variation
eLife 5:e12765.
https://doi.org/10.7554/eLife.12765


