Hedgehog signaling is a potent regulator of liver lipid metabolism and reveals a GLI-code associated with steatosis
- Leipzig University, Germany
- Leibniz Institute for Natural Product Research and Infection Biology – Hans Knöll Institute, Germany
- Regensburg University Hospital, Germany
Figures
Figure 1 with 1 supplement
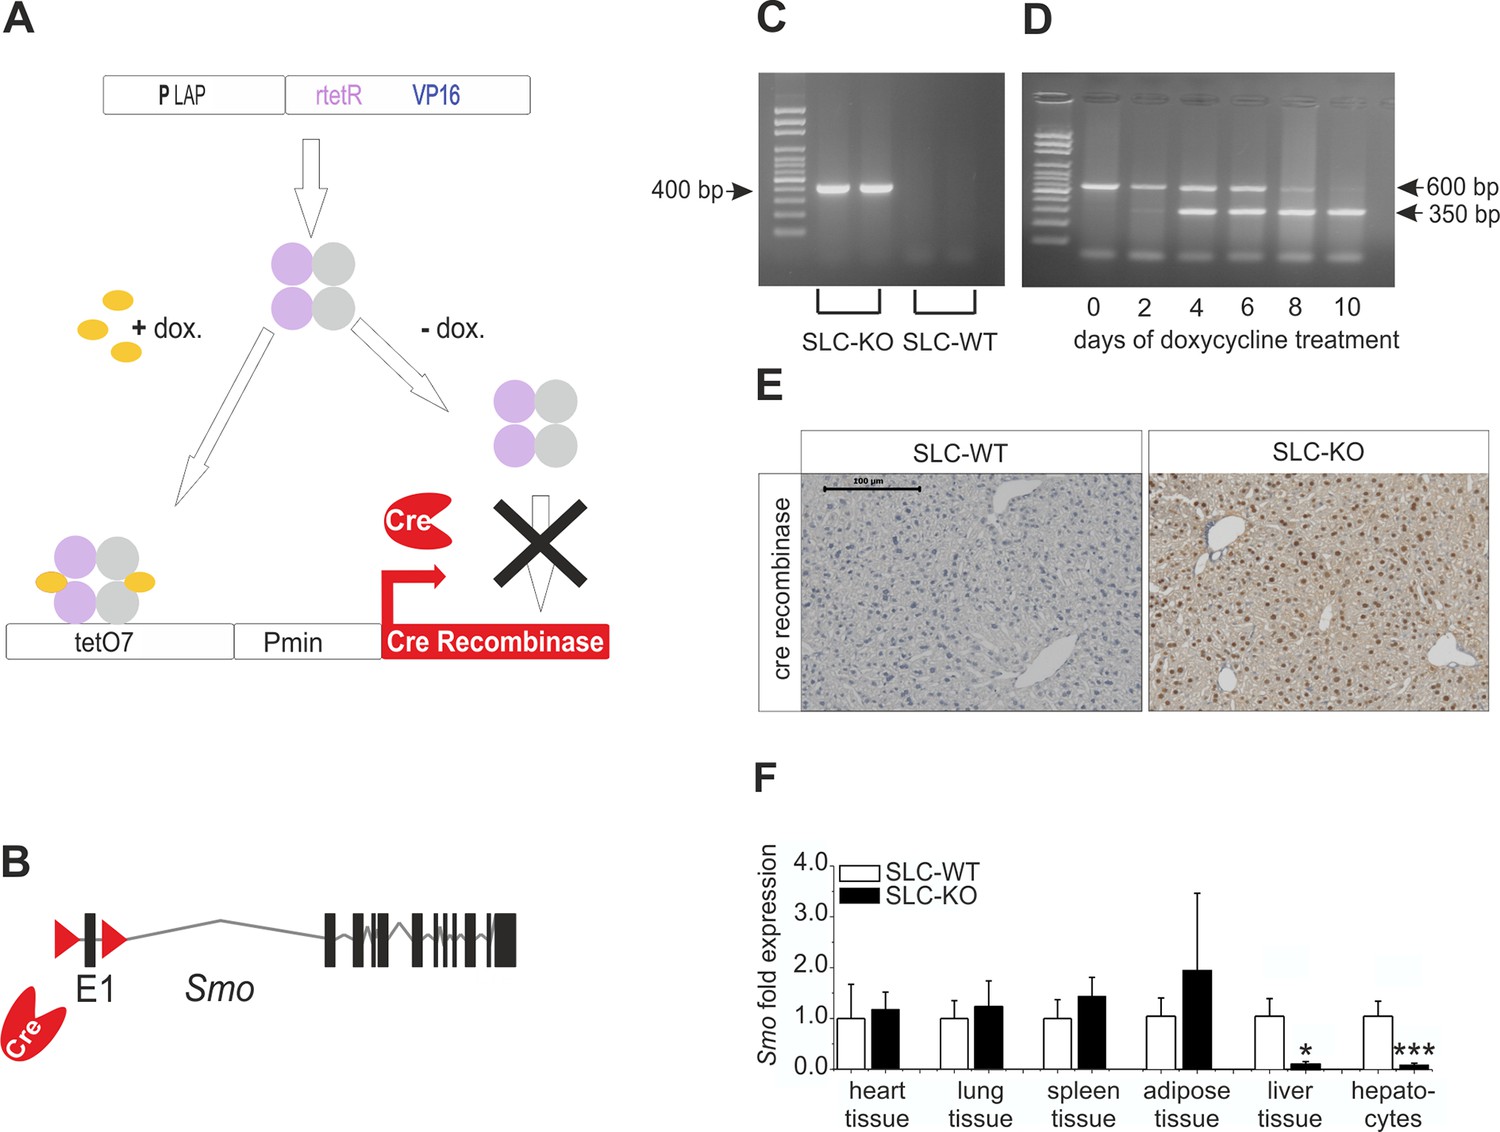
Strategy for conditional and hepatocyte-specific deletion of Smo.
(A) Scheme of the tet-on system in the LC-1/rTALAP-1 mice. (B) Structure of Smo with loxP sites. (C) PCR, for Cre recombinase, yielded a 400 bp fragment in SLC-KO mice only. (D) PCR from liver tissue during treatment with doxycycline, yielding a 600 bp amplicon for SLC-WT alleles and a 350 bp amplicon for the recombinant Smo alleles in the SLC-KO mice. (E) Immunohistochemical staining of Cre recombinase in liver sections of the SLC-WT and the SLC-KO mice. Bar: 100 µm. (F) qRT-PCR of Smo in different tissues and isolated hepatocytes of the SLC-WT (n=6–10) and the SLC-KO (n=6–10) mice. Source files of all data used for the quantitative analysis are available in the Figure 1—source data 1.
-
Figure 1—source data 1
Source data of qRT-PCR of Smo in different tissues and isolated hepatocytes of the SLC-WT and the SLC-KO mice (Figure 1F).
- https://doi.org/10.7554/eLife.13308.004
Figure 1—figure supplement 1
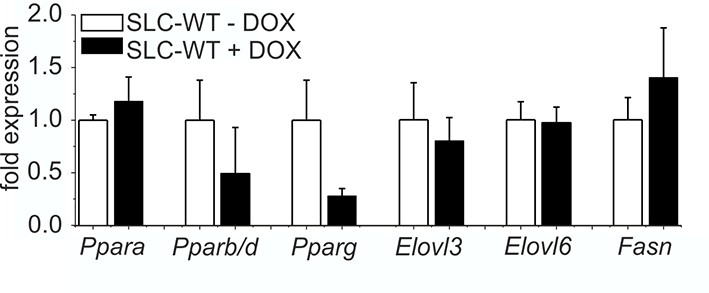
Influence of doxycycline on lipogenic gene expression qRT-PCR of Ppara, Pparb/d, Pparg, Elovl3, Elovl6 and Fasn in isolated hepatocytes of the male SLC-WT mice treated with doxycycline (n=3–4) for 10 days compared to male SLC-WT mice without doxycycline (n=3–4) at the same age.
https://doi.org/10.7554/eLife.13308.005
Figure 2 with 3 supplements
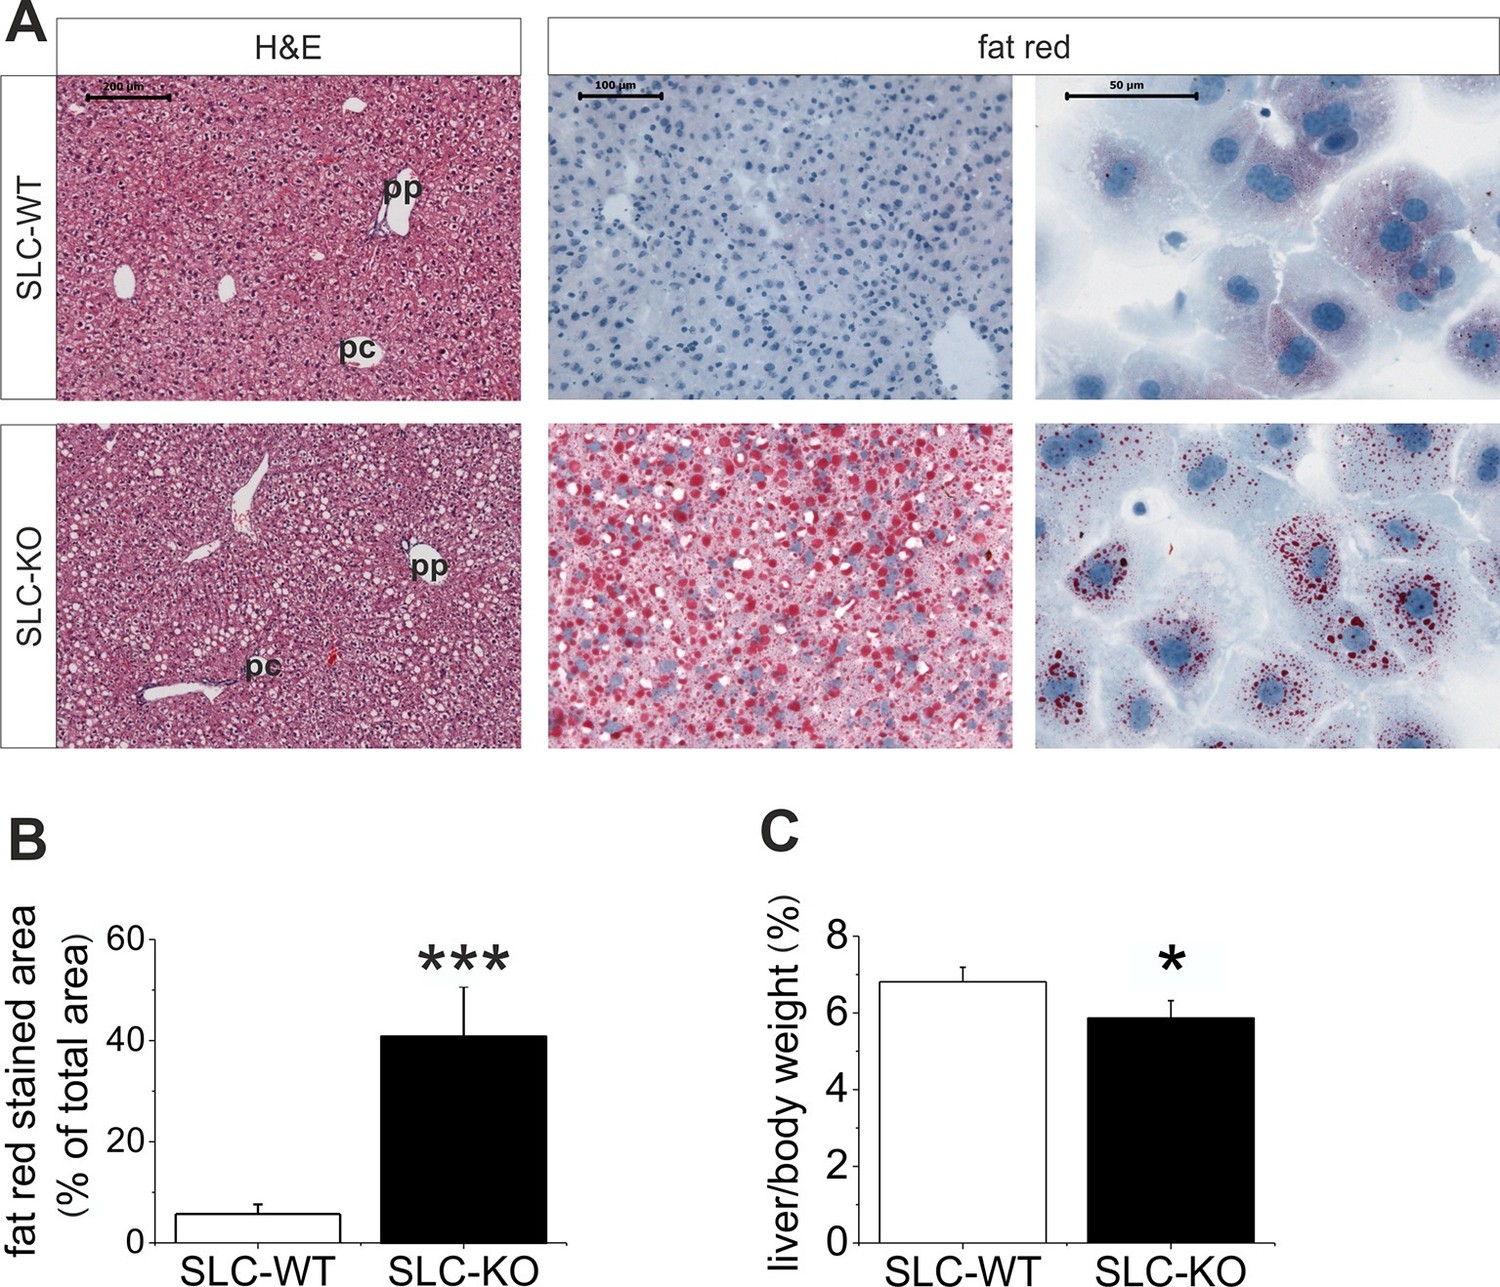
Liver phenotype of the SLC mice.
(A) The H&E and fat red staining of liver sections and hepatocytes showed strong steatosis in the male SLC-KO mice compared to the SLC-WT mice (bars: 200 µm, 100 µm and 50 µm) (pc: pericentral, pc: periportal). (B) Quantification of the fat red-stained liver sections from the male SLC-WT (n=10) and SLC-KO (n=7) mice. (C) Comparison of the liver/body ratio. Source files of all data used for the quantitative analysis are available in the Figure 2—source data 1.
-
Figure 2—source data 1
Source data of quantification of the fat red-stained liver sections from the male SLC-WT and SLC-KO mice (Figure 2B) and comparison of the liver/body ratio (Figure 2C).
- https://doi.org/10.7554/eLife.13308.007
Figure 2—figure supplement 1
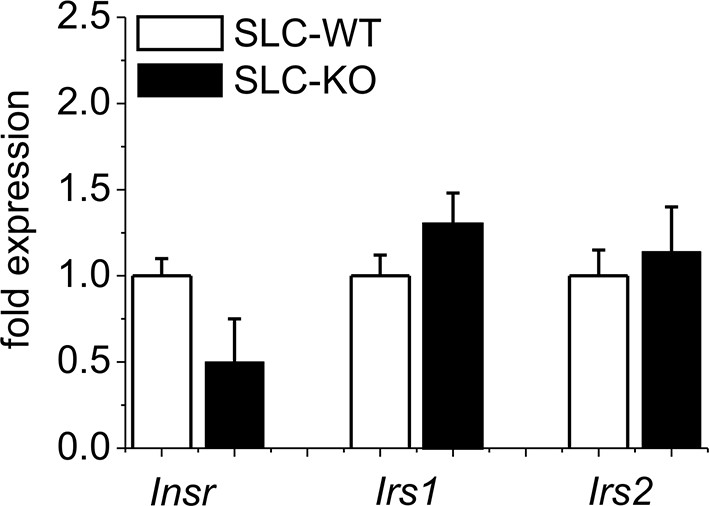
Gene expression of insulin signaling in isolated hepatocytes from SLC mice.
Relative gene expression determined by qRT-PCR in isolated hepatocytes from the male SLC-WT (n=14) and the male SLC-KO (n=14) mice of insulin receptor (Inrs) and insulin receptor substrate 1 and 2 (Irs1, Irs2).
Figure 2—figure supplement 2
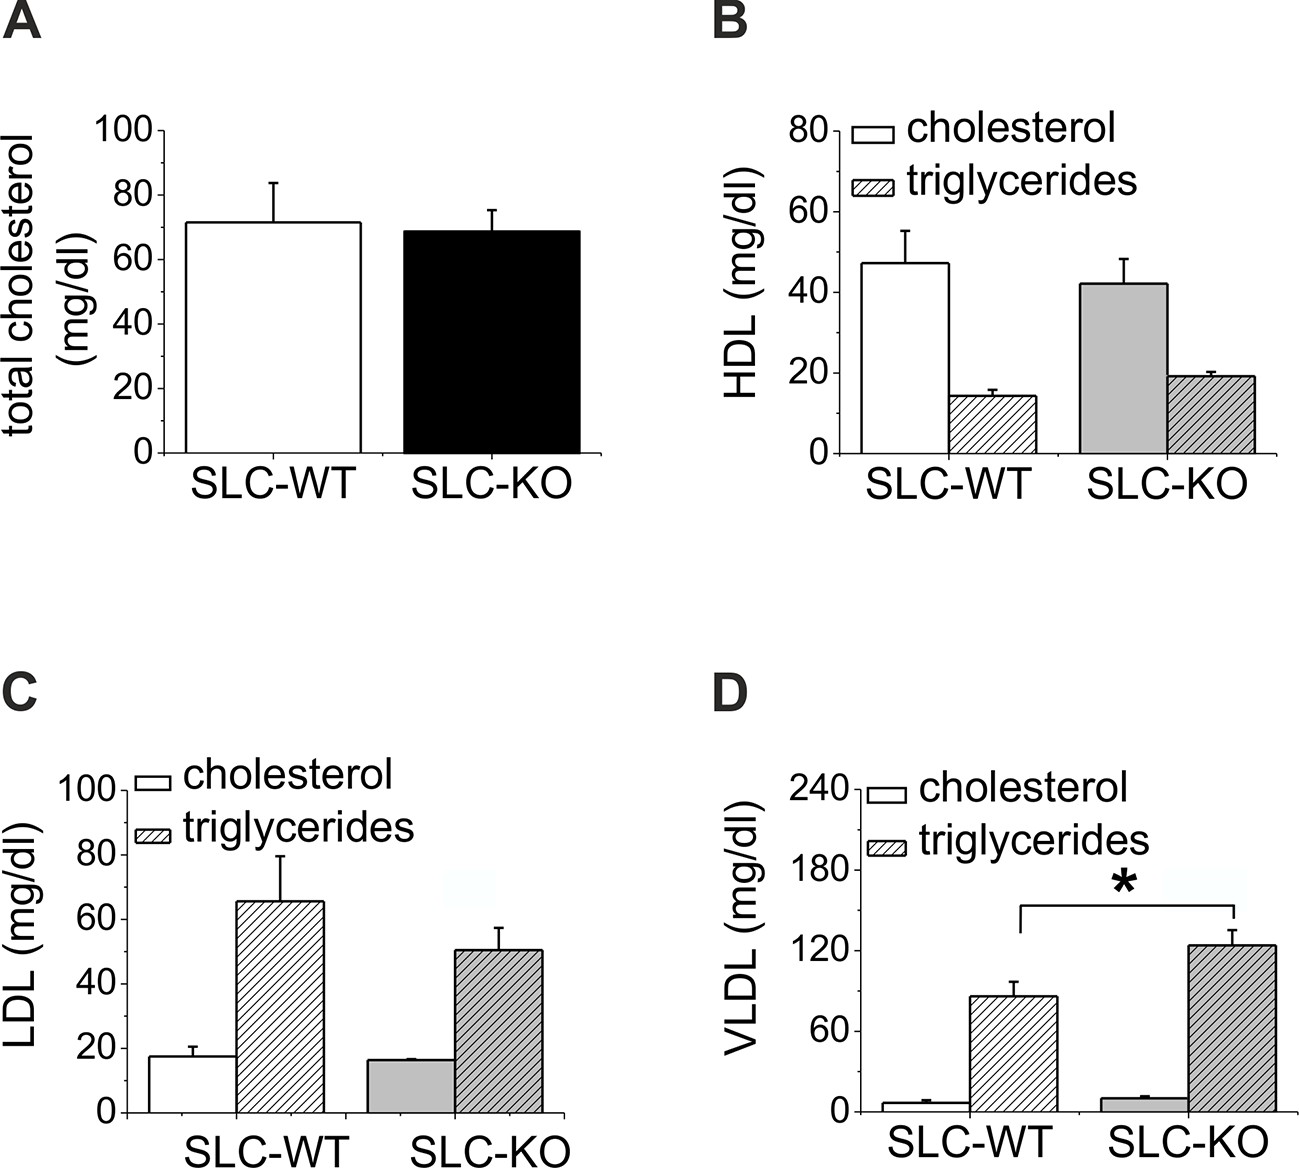
Serum lipoprotein levels of the SLC mice.
(A–D) Total cholesterol, HDL, LDL and VLDL in the serum of the male SLC-WT (n=5) and male SLC-KO mice (n=6).
Figure 2—figure supplement 3
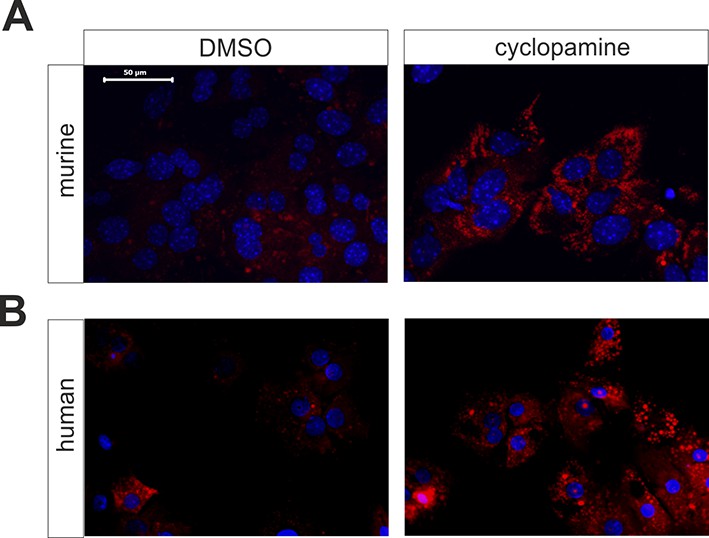
Influence of cyclopamine on accumulation of neutral lipids in cultured mouse and human hepatocytes.
(A) Mouse and (B) human hepatocytes were cultured in the absence (left; vehicle only) or presence (right) of 10 µM cyclopamine (in 0.1% DMSO). After 72 h, cultures were fixed and stained with Nile red. Bar: 50 µm.
Figure 3 with 2 supplements

Expression of genes and proteins related to Hh signaling in SLC mice.
(A–D) qRT-PCR data from isolated hepatocytes from the male SLC-WT (n=6–10) and the SLC-KO (n=6–10) mice illustrating the expression of (A) the ligands Ihh, Shh and Dhh (n.d.: not detectable); (B) the ligand binding molecules Ptch1, Ptch2 and Hhip1; (C) the downstream genes Fu and Sufu and (D) the TFs Gli1, Gli2 and Gli3 of the Hh signaling pathway. (E–F) Immunohistochemistry of liver sections from male SLC-WT and SLC-KO mice of (E) GLI1 and (F) GLI3. Labeled hepatocyte nuclei for both Gli factors are seen only in WT, but not in KO animals (white arrows). Staining in non-parenchymal cells, e. g. bile ductular cells (yellow arrowheads) is not affected by the knockout. Scale bars: 200 μm; 100 μm and 50 μm. Source files of all data used for the quantitative analysis are available in the Figure 3—source data 1.
-
Figure 3—source data 1
Source data of the expression of genes related to Hh signaling in SLC mice (Figure 3A–D).
- https://doi.org/10.7554/eLife.13308.013
Figure 3—figure supplement 1
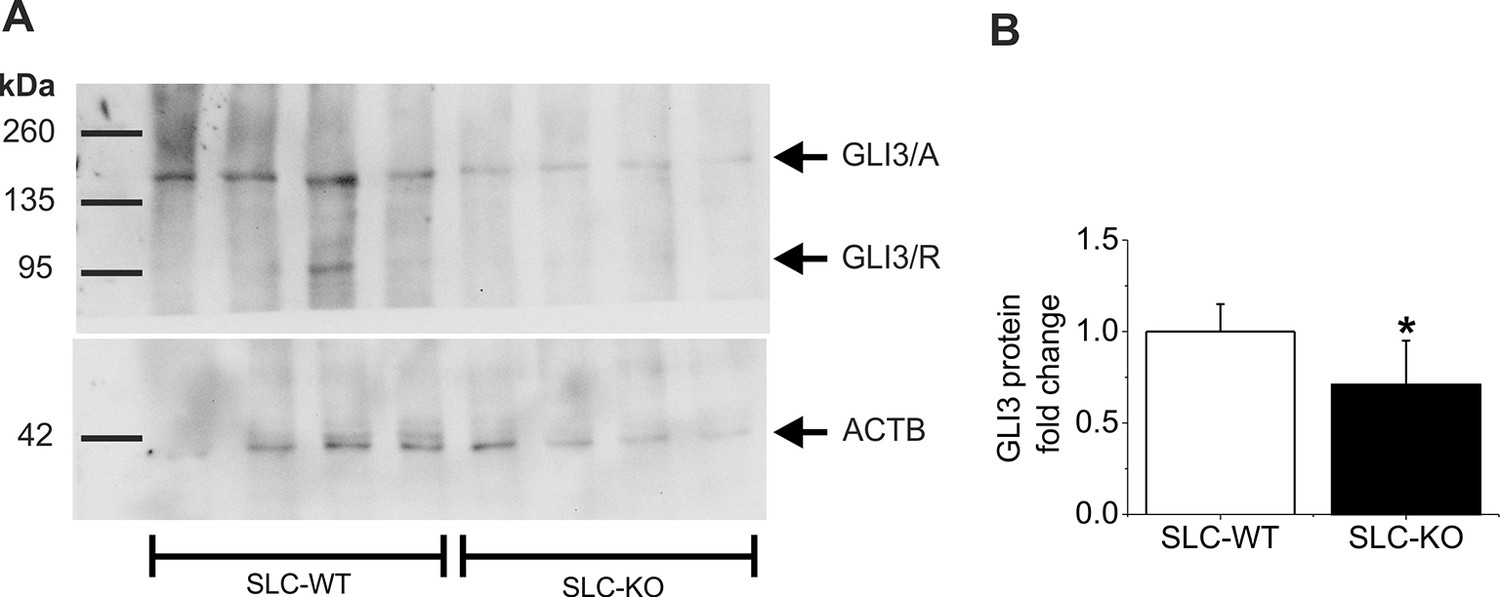
Western Blot of GLI3 in the SLC mice.
(A) Representative Western blot from isolated hepatocytes from male SLC-WT (n=4) and SLC-KO (n=4) mice. The blot shows the expected molecular weight from the two isoforms of GLI3, the full length activator form at 170–190 kDa (GLI3/A) and the truncated repressor form at ~80 kDa (GLI3/R). (B) Densitometric quantification of GLI3/A, normalized to loading control ACTB, was done from three Western blots from SLC-WT (n=9) and SLC-KO (n=9) mice.
Figure 3—figure supplement 2
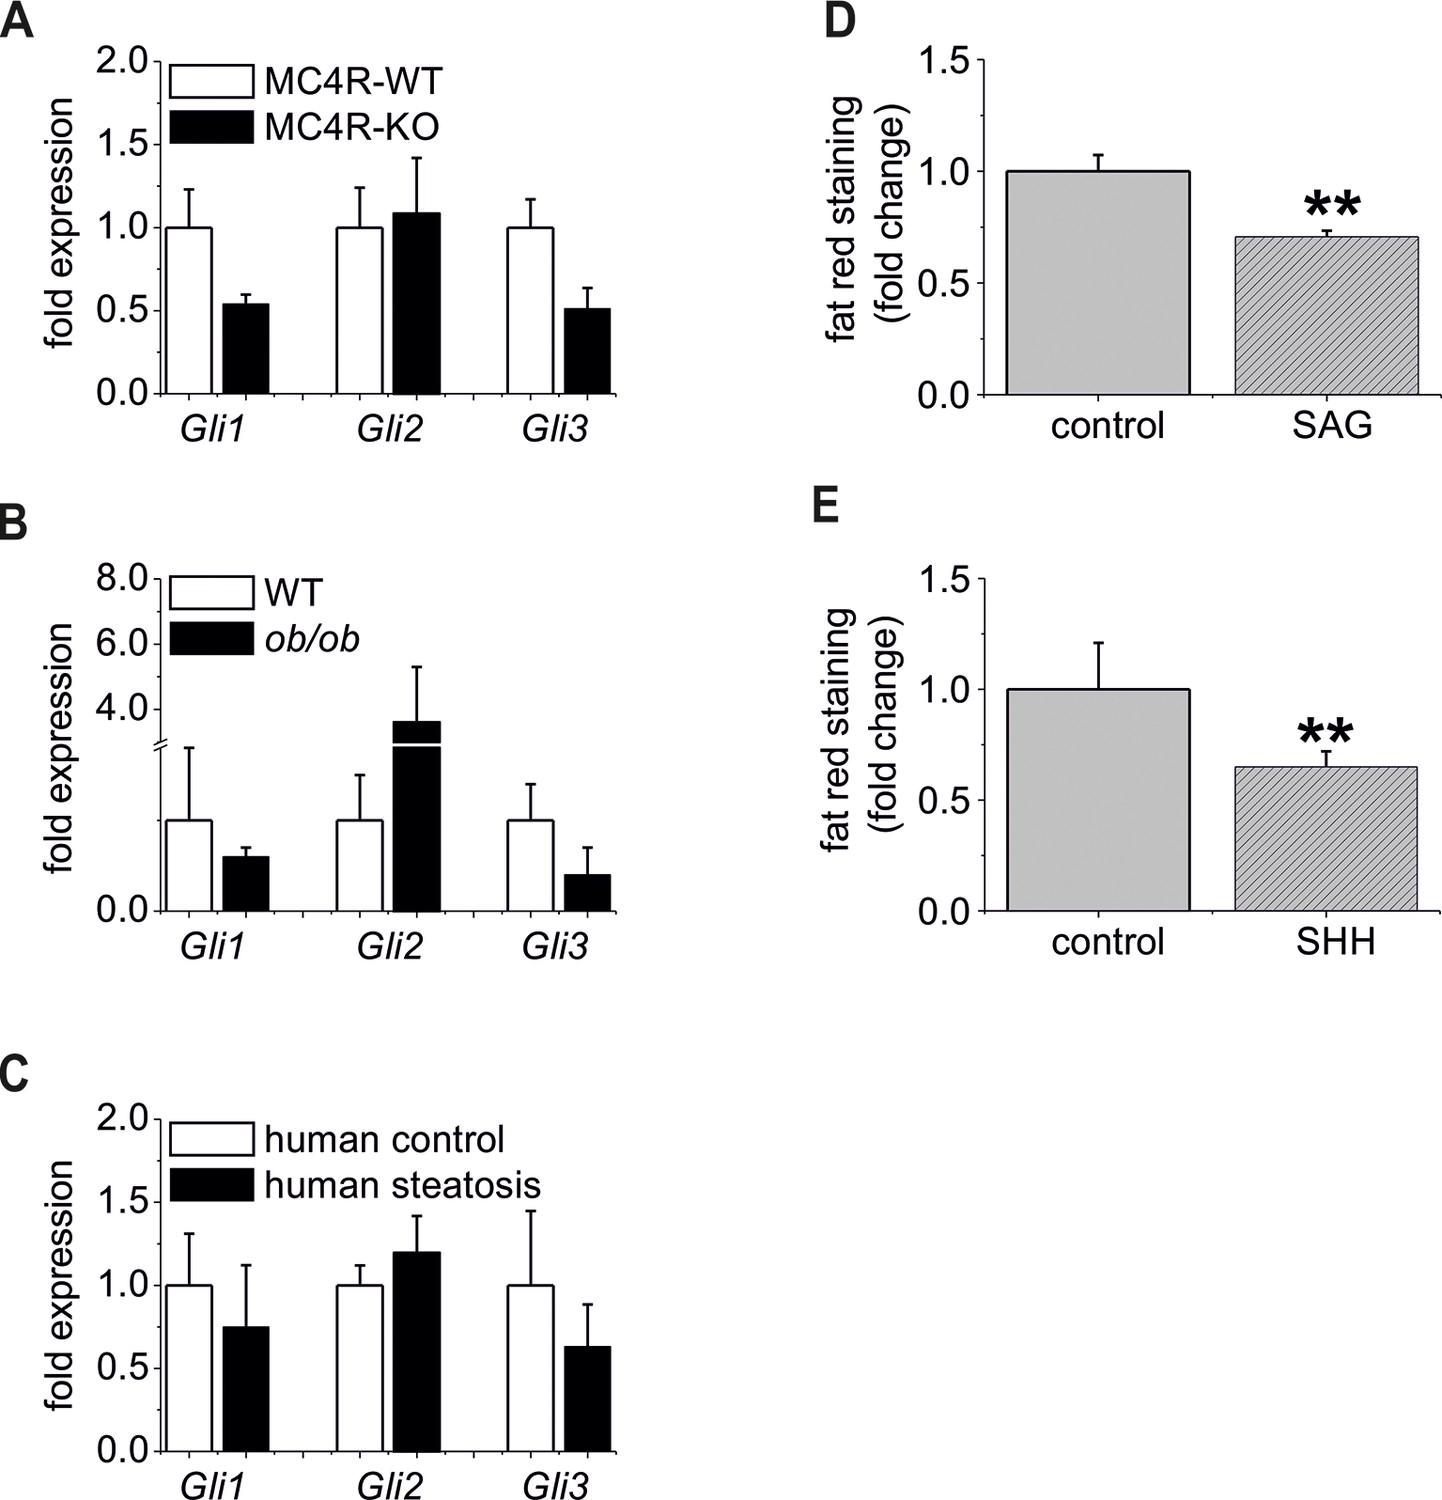
The “steatotic Gli-code” extents to several mouse models and humans with steatosis.
(A) qRT-PCR data from isolated hepatocytes from the male MC4R-WT (n=4) and the MC4R-KO (n=4) mice illustrating the expression of Gli1, Gli2 and Gli3 at the age of 6 month; (B) qRT-PCR data from isolated hepatocytes from the male WT (n=4) and the ob/ob (n=4) mice illustrating the expression of Gli1, Gli2 and Gli3 at the age of 6 month; (C) qRT-PCR data from healthy female human liver tissue (control, n=29) and steatotic samples (n=33) illustrating the expression of Gli1, Gli2 and Gli3. (D) Quantitative fat red staining in isolated hepatocytes from the male MC4R-KO mice after incubation with SAG (300 nM) and control vehicle for 48 hr. (E) Quantitative fat red staining in isolated hepatocytes from the male ob/ob mice after incubation with recombinant SHH (0.25 µg) and control vehicle for 72 hr.
Figure 4
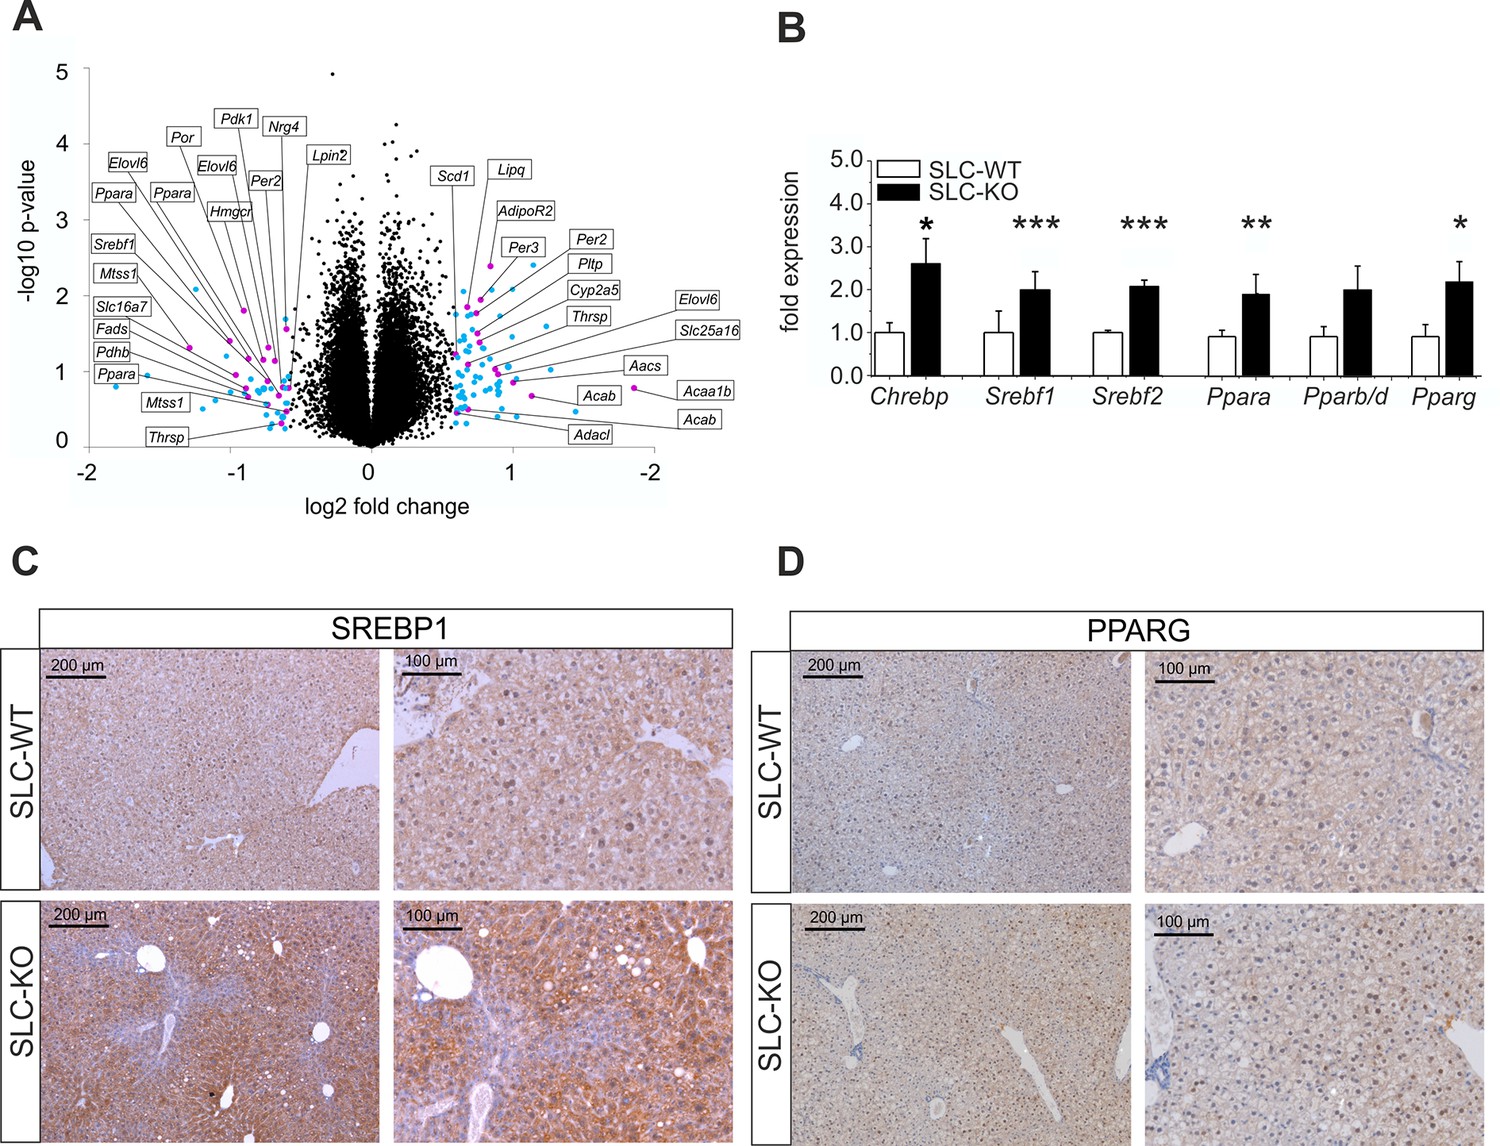
Gen and protein expression of hepatic TFs involved in lipid metabolism in SLC mice.
(A) Volcano blot visualizing differentially expressed genes in male SLC-KO mice detected by Affymetrix microarray analysis (n=4). All colored dots (blue and magenta) indicate an expression fold change equal or higher than 1.5; magenta: central genes of lipid metabolism; blue: other regulated genes. (B) qRT-PCR of Chrebp, Srebf1, Srebf2, Ppara, Pparb/d and Pparg from hepatocytes of male SLC-WT (n=6–13) and SLC-KO (n=6–13) mice. (C–D) Immunohistochemistry in liver sections from male SLC-WT and SLC-KO mice. (C) SREBP1 is strongly induced and shows a higher incidence of nuclear staining in pericentral hepatocytes of SLC-KO mice. (D) PPARG shows a much higher incidence in hepatocyte nuclei and a slight cytoplasmic increase in pericentral hepatocytes of SLC-KO mice. Scale bars: 200 μm and 100 μm. Source files of all data used for the quantitative analysis are available in the Figure 4—source data 2.
-
Figure 4—source data 1
Gene set enrichment analysis of isolated hepatocytes from SLC-WT and SLC-KO mice.
- https://doi.org/10.7554/eLife.13308.017
-
Figure 4—source data 2
Source data of gene expression of hepatic TFs involved in lipid metabolism in SLC mice (Figure 4B).
- https://doi.org/10.7554/eLife.13308.018
Figure 5
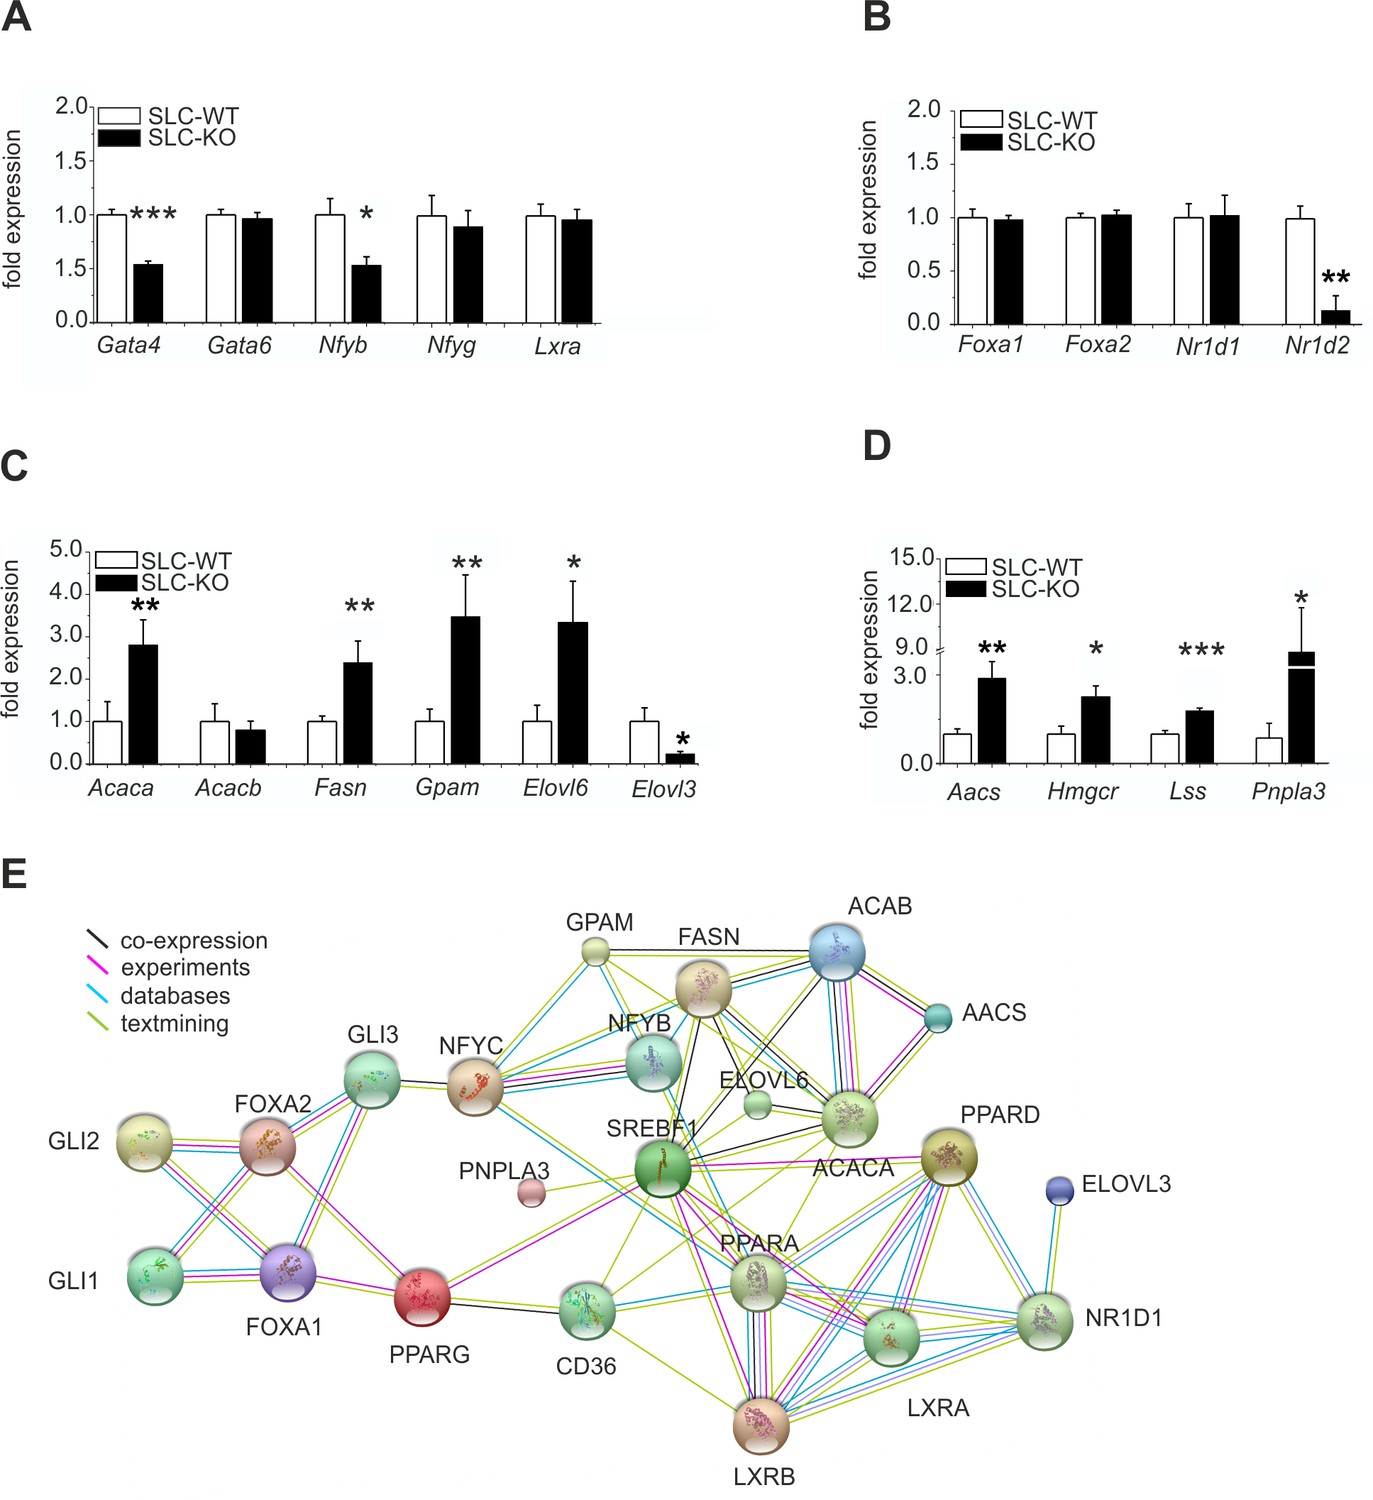
Expression of the hepatic TFs and enzymes involved in lipid metabolism in SLC mice.
(A–D) qRT-PCR data from hepatocytes from the male SLC-WT (n=6–13) and SLC-KO (n=6–13) mice. (A) Gata4, Gata6, Nfyb, Nfyg and Lxra. (B) Foxa1, Foxa2, Nr1d1 and Nr1d2. (C) Acaca, Acacb, Fasn, Gpam, Elovl6 and Elovl3. (D) Aacs, Hmgcr, Lss and Pnpla3. (E) The PPI (protein-protein interaction) network obtained from the STRINGv10 database using steatosis- and Hh-signaling-related genes as the query. The colored lines indicate co-expression (black), experimental data (purple), database scan (blue) and published scientific abstracts (green). Source files of all data used for the quantitative analysis are available in the Figure 5—source data 1.
-
Figure 5—source data 1
Source data of expression of the hepatic TFs and enzymes involved in lipid metabolism in SLC mice (Figure 5A–D).
- https://doi.org/10.7554/eLife.13308.020
Figure 6 with 1 supplement
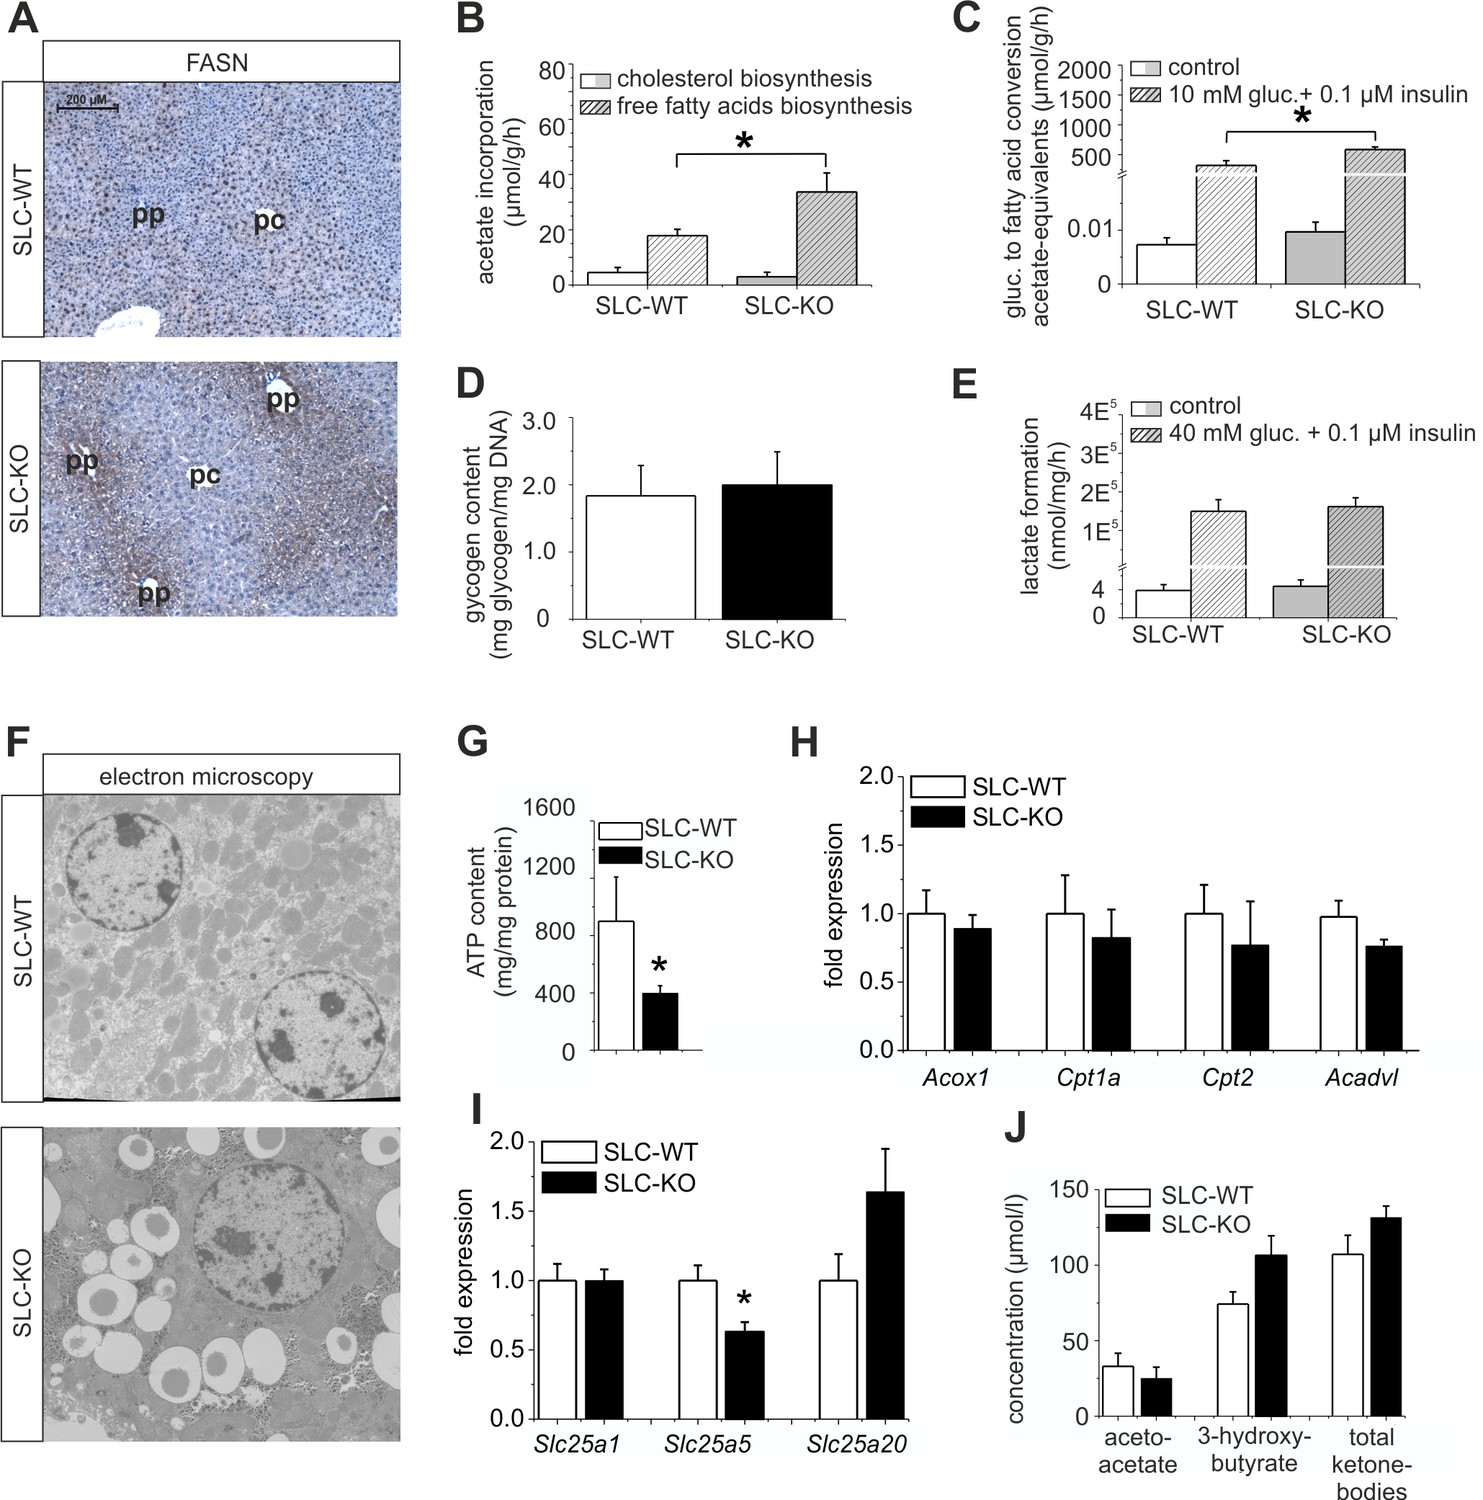
Expression of genes and proteins involved in lipid and mitochondrial energy metabolism in SLC mice.
(A) Immunohistochemistry of FASN in liver sections of male SLC-WT and SLC-KO mice (pp: periportal, pc: pericentral). (B–H) Measurements in freshly isolated hepatocytes from male SLC-WT and SLC-KO mice (B) Determination of fatty acid and cholesterol biosynthesis. (C) Conversion of [14C(U)]-glucose to fatty acids. (D) Glycogen content. (E) Determination of glycolysis. (F) Electron microscopy of liver tissue. (G) ATP content. (H–I) qRT-PCR data from the male SLC-WT (n=6) and the SLC-KO (n=6) mice: (H) Acox1, Cpt1a, Cpt2 and Acadvl, (I) Slc25a1, Slc25a2 and Slc25a20. (J) Serum concentrations of ketone bodies. Eight to ten SLC mice were used in each of the experiments depicted in (B, C, D, E, G, H, I ,J). Source files of all data used for the quantitative analysis are available in the Figure 6—source data 1.
-
Figure 6—source data 1
Source data of expression of genes and proteins involved in lipid and mitochondrial energy metabolism in SLC mice (Figure 6B–J).
- https://doi.org/10.7554/eLife.13308.022
Figure 6—figure supplement 1
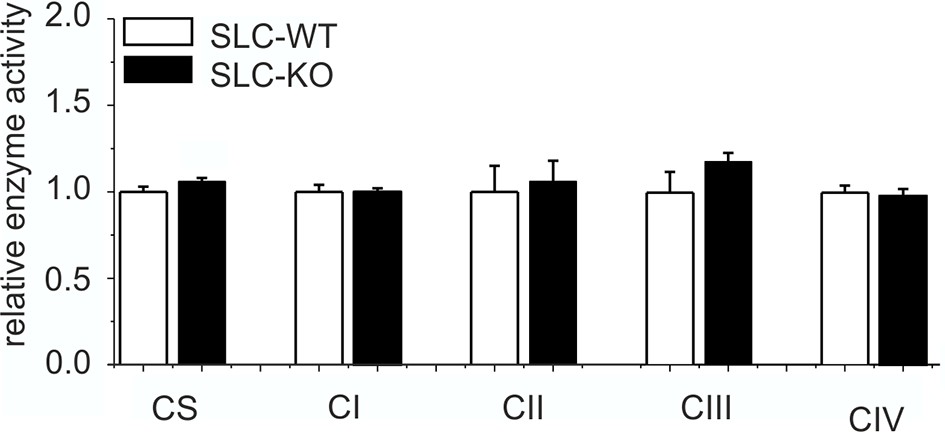
Expression of respiratory chain complexes in SLC mice.
Enzyme activity of citrate synthase (CS) and respiratory chain complexes I-IV in liver tissue of the male SLC-WT (n=6) and the male SLC-KO (n=6) mice.
Figure 7 with 2 supplements
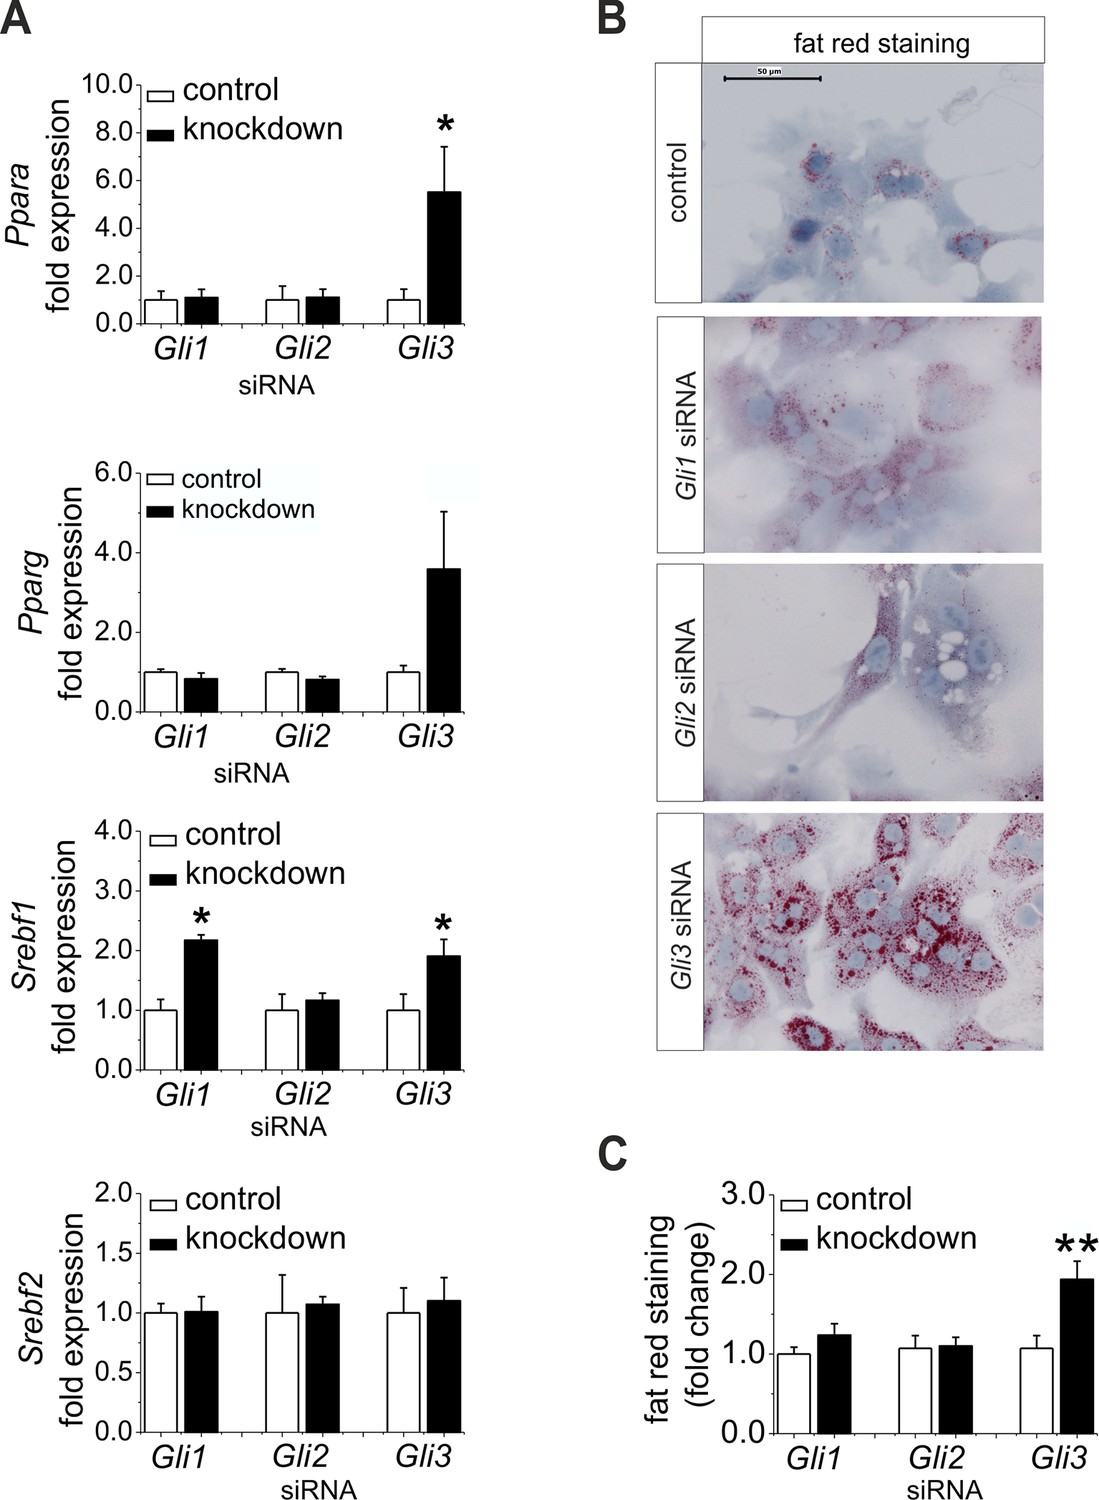
Influence of siRNA-mediated knockdown of Gli1, Gli2 and Gli3 on expression of genes of lipid metabolism.
(A–C) Isolated hepatocytes from male C57BL6/N mice (n=4–9) treated with the control, Gli1, Gli2 and Gli3 siRNAs. (A) Relative expression of Ppara, Pparg, Srebf1 and Srebf2, determined by qRT-PCR. Data for Ppara, Pparg, Srebf1 and Srebf2 were taken from our publication (Schmidt-Heck et al., 2015) with the same mouse model for simplifying comparison. (B) Qualitative and (C) quantitative fat red staining. Source files of all data used for the quantitative analysis are available in the Figure 7—source data 1.
-
Figure 7—source data 1
Source data of the influence of siRNA-mediated knockdown of Gli1, Gli2 and Gli3 on expression of genes of lipid metabolism(Figure 7A,C).
- https://doi.org/10.7554/eLife.13308.025
Figure 7—figure supplement 1

Influence of siRNA-mediated knockdown of Gli1, Gli2 and Gli3 on gene expression of lipogenic enzymes.
(A–D) Isolated hepatocytes from male C57BL6/N mice (n=4–7) treated with the control, Gli1, Gli2 and Gli3 siRNAs. Relative expression of (A) Chrebp, (B) Fasn, (C) Elovl6 and (D) Elovl3 was determined by qRT-PCR.
Figure 7—figure supplement 2
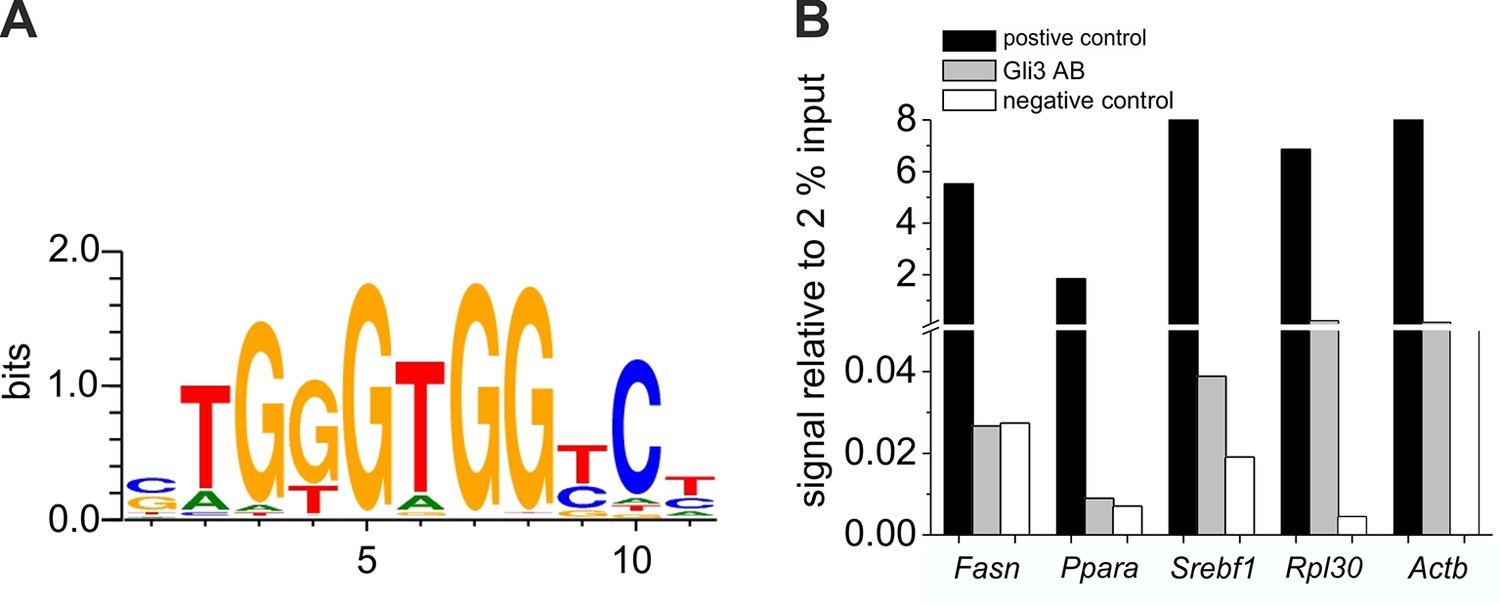
Chromatin immunoprecipitation experiments for GLI3 binding sites.
( A) Consensus sequence of the GLI3 binding site at -1767 bp of the Fasn promoter, at -2674 bp of the Ppara promoter and at -1156 bp of the Srebf1 promoter according to MotivMap. (B) qRT-PCR analyses of precipitated DNA using primers for the promotor region of Fasn, Ppara and Srebf1 (supplementary material table 3). DNA immunoprecipitated with Histone H3 Antibody as positive control (black), GLI3 antibody (grey), and IgG as a negative control (white) was calculated relative to 2% input as described in Materials and methods.
Figure 8
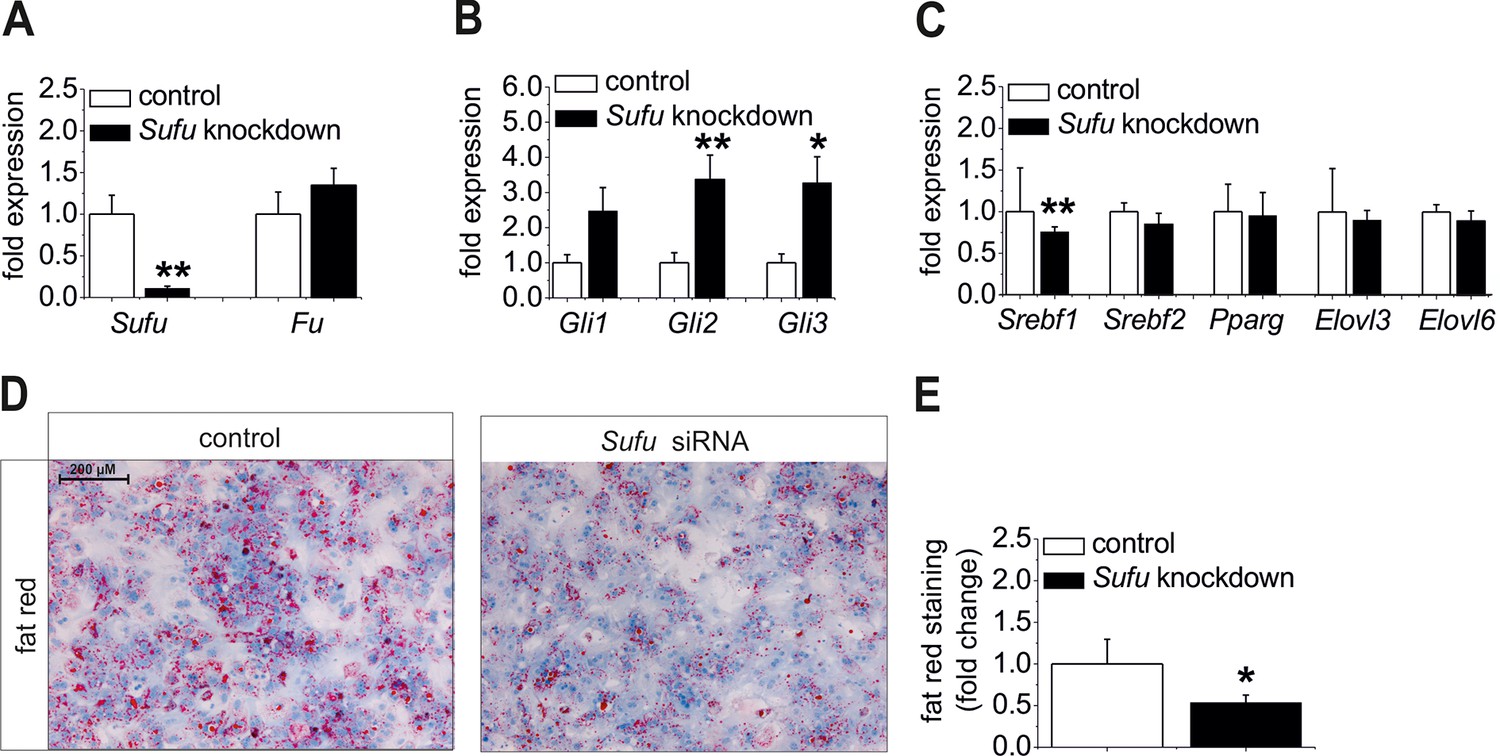
Influence of siRNA-mediated knockdown of Sufu on lipid metabolism in vitro.
(A-C) Isolated hepatocytes from male C57BL6/N mice (n=8) treated with the control and Sufu siRNA. Relative expression of the following genes was determined by qRT-PCR 48 hr post-transfection (A) Sufu and Fu, (B) Gli1, Gli2 and Gli3, (C) Srebf1, Srebf2, Pparg, Elovl3 and Elovl6. (D) Qualitative and (E) quantitative fat red staining in hepatocytes isolated from the MC4R-KO mice in response to treatment with the control and Sufu siRNA. Source files of all data used for the quantitative analysis are available in the Figure 8—source data 1.
-
Figure 8—source data 1
Data source of the influence of siRNA-mediated knockdown of Sufu on lipid metabolism in vitro(Figure 8 A-C, D).
- https://doi.org/10.7554/eLife.13308.029
Figure 9
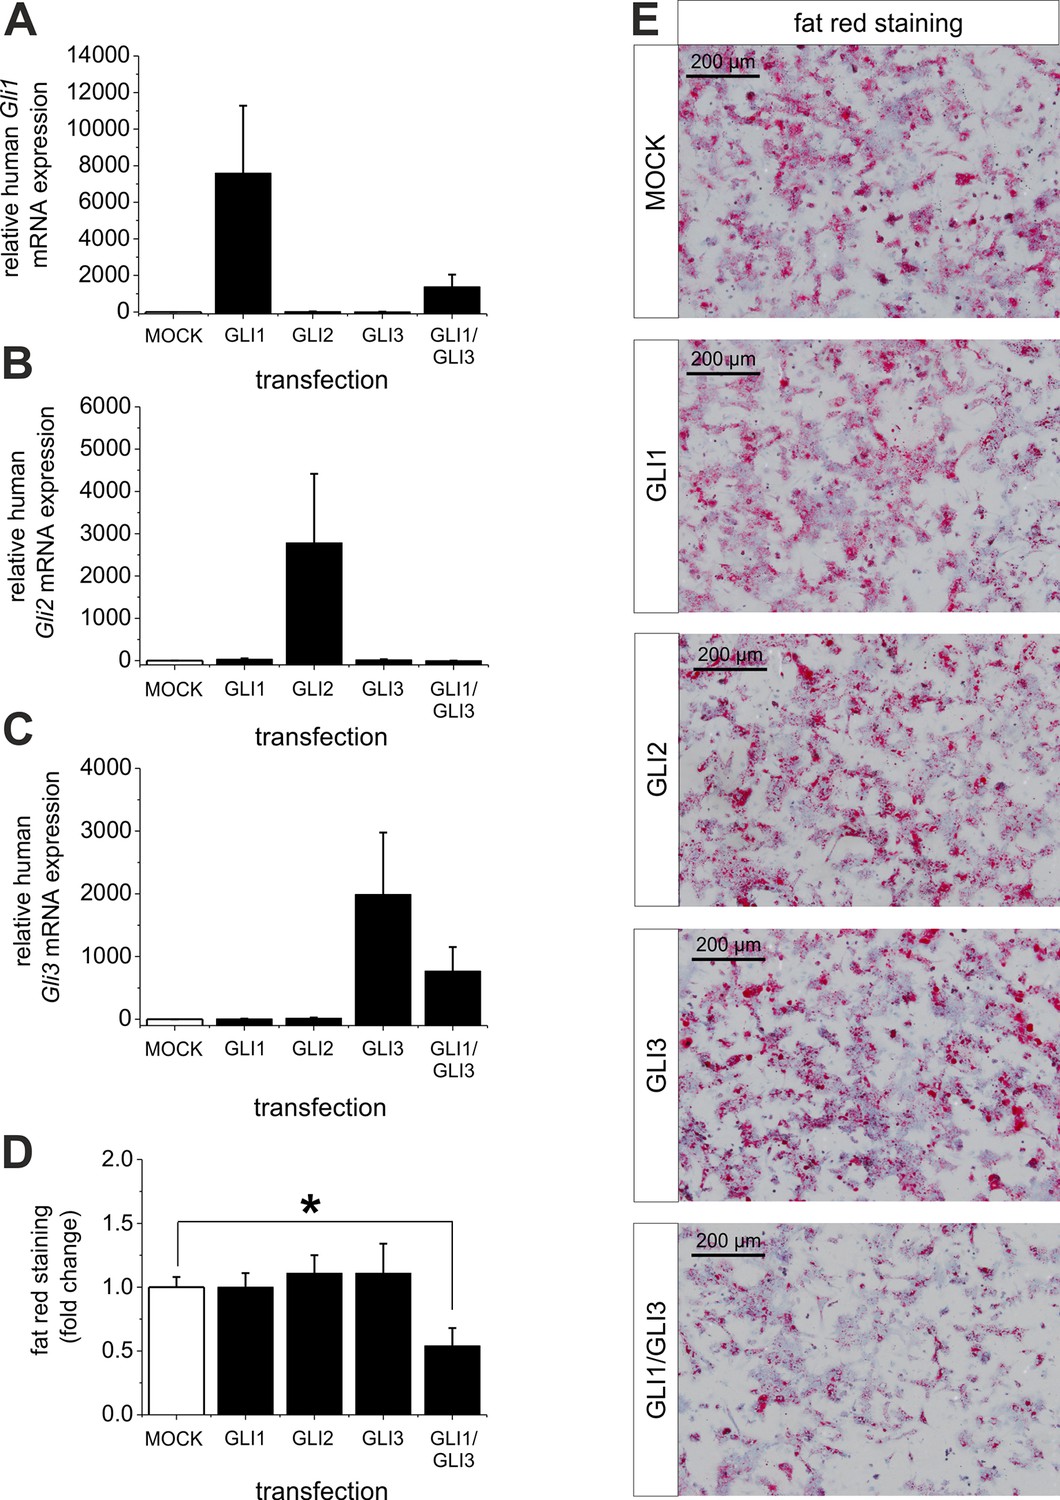
Influence of GLI1, GLI2 and GLI3 overexpression on lipid content in hepatocytes of ob/ob mice.
Isolated hepatocytes from male ob/ob mice (n=3) transfected with the control plasmid (MOCK) and human overexpression plasmids of GLI1, GLI2, and GLI3 or the combination of GLI1 and GLI3, 72 hr post-transfection as described in Materials and Methods. (A-C) Relative expression of the following genes was determined by qRT-PCR. (A) Gli1, (B) Gli2 (C) Gli3. (D) Quantitative and (E) qualitative fat red staining. Lipid content was reduced only in the presence of the combined overexpression of GLI1 and GLI3, but not after expression of each Gli factor alone. Source files of all data used for the quantitative analysis are available in the Figure 9—source data 1.
-
Figure 9—source data 1
Source data of the influence of GLI1, GLI2 and GLI3 overexpression on lipid content in hepatocytes of ob/ob mice (Figure A-D).
- https://doi.org/10.7554/eLife.13308.031
Figure 10

Regulation of hepatic lipid metabolism by Hh signaling.
(A) Intact Hh signaling allows a self-supporting network of the GLI TFs (Schmidt-Heck et al., 2015). Gli1 and Gli3 exert attenuating effects on lipogenic TFs resulting in balanced liver lipid metabolism. (B) The impairment of Hh signaling down-regulates (green) Gli1 and Gli3, while Gli2 is not affected. These selective changes, in turn, lead to the up-regulated expression (red) of Srebf1 and members of the Ppar family and eventually other TFs. (C) These secondary TFs contribute to a complex regulatory network leading to the up-regulation of lipogenic enzymes , which ultimately cause steatosis. The dashed lines indicate weaker effects than the solid lines.
Tables
Table 1
Serum concentrations of glucose, insulin and enzyme activities of ALAT, ASAT and GLDH in SLC mice.
| parameter | SLC-WT | n | SLC-KO | n |
|---|---|---|---|---|
| insulin (pmol/l) | 80.06 ± 9.98 | 13 | 110.88 ± 31.31 | 7 |
| glucose (mmol/dl) | 10.16 ± 1.80 | 5 | 7.68 ± 1.02 | 6 |
| ALAT (µkat/l) | 1.02 ± 0.32 | 5 | 0.81 ± 0.03 | 5 |
| ASAT (µkat/l) | 2.95 ± 0.90 | 5 | 2.50 ± 0.41 | 5 |
| GLDH (µkat/l) | 0.42 ± 0.13 | 5 | 0.28 ± 0.05 | 5 |
Additional files
-
Supplementary file 1. (A)
Primers for genotyping the SLC mice.
(B) Primers for qRT-PCR on murine mRNA. (C) Primers for siRNA mediated knockdown of Sufu. (D) Primers for ChIP (E) Primers for human Gli factors
- https://doi.org/10.7554/eLife.13308.033
Download links
A two-part list of links to download the article, or parts of the article, in various formats.
Downloads (link to download the article as PDF)
Open citations (links to open the citations from this article in various online reference manager services)
Cite this article (links to download the citations from this article in formats compatible with various reference manager tools)
Hedgehog signaling is a potent regulator of liver lipid metabolism and reveals a GLI-code associated with steatosis
eLife 5:e13308.
https://doi.org/10.7554/eLife.13308


