Basal ganglia output reflects internally-specified movements
- University of Colorado School of Medicine, United States
Figures
Figure 1
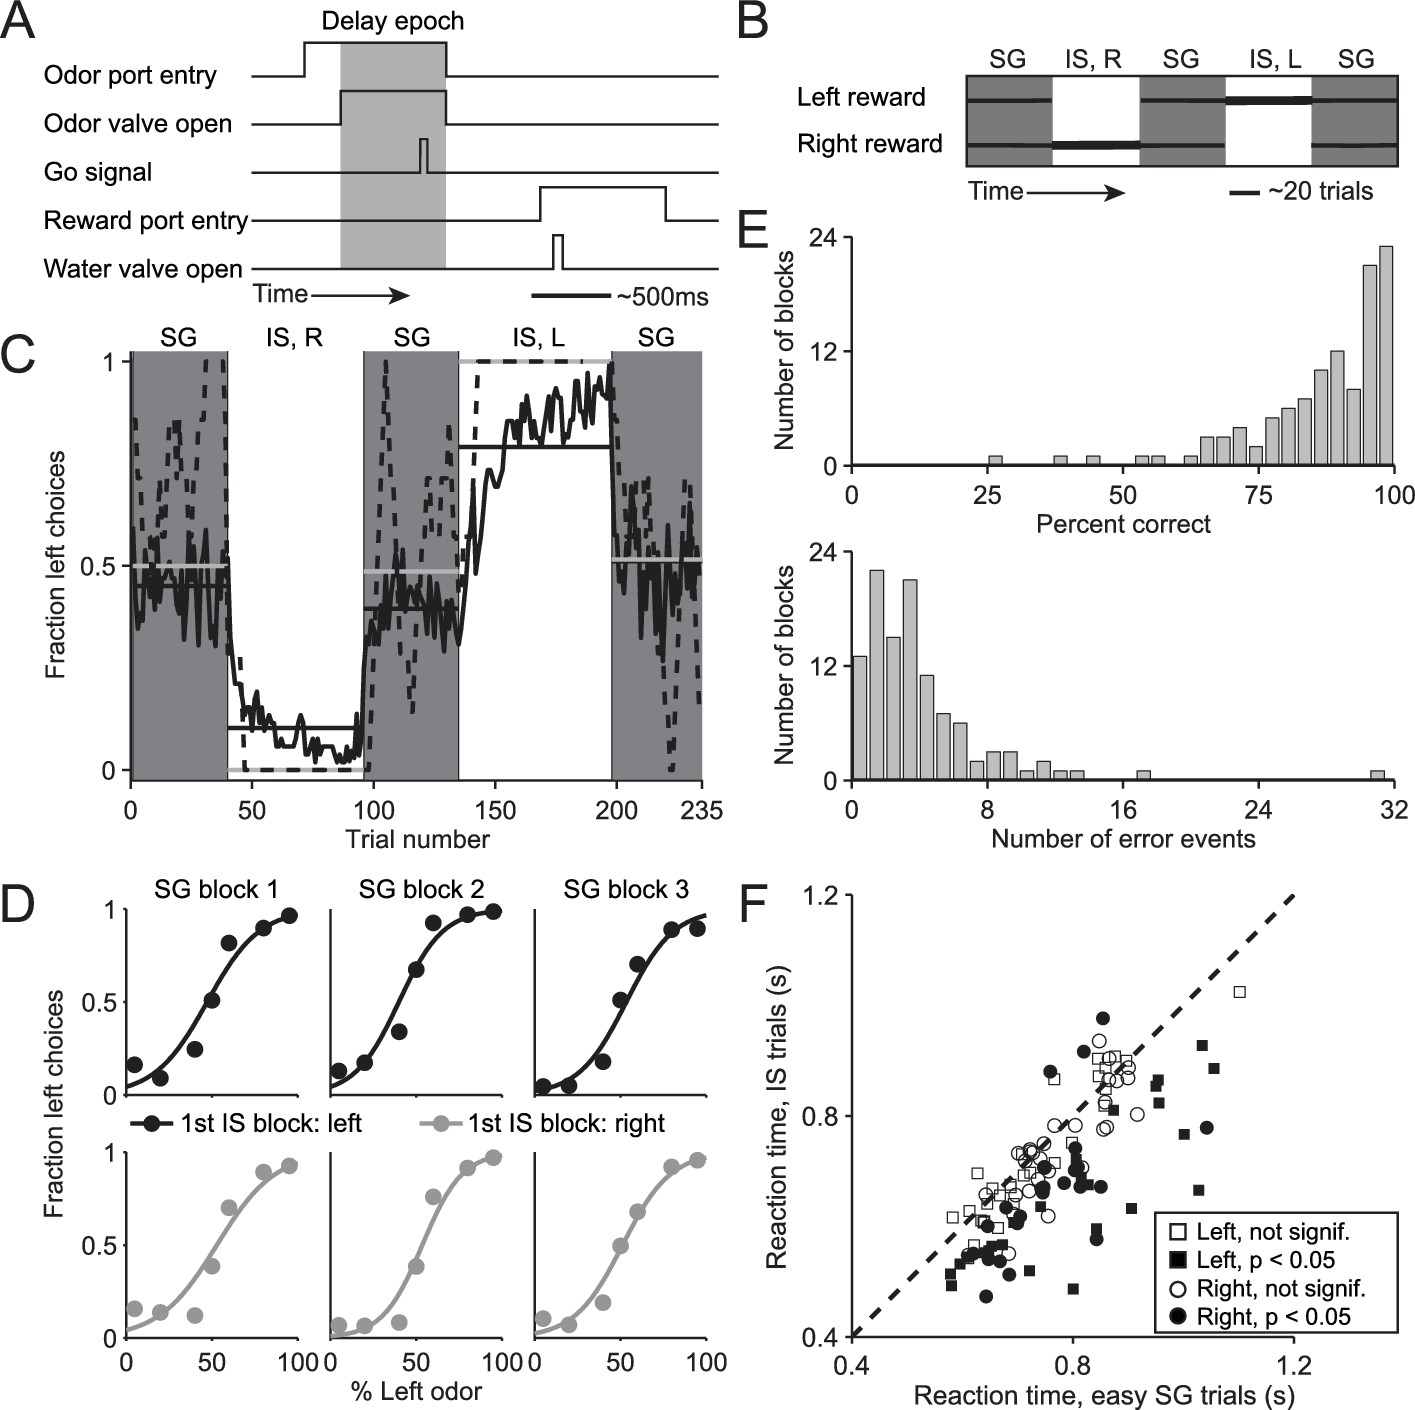
Behavioral task and performance.
(A) Timing of events in each trial. The mouse enters the odor port, receives an odor mixture, waits for the go signal, exits the odor port, moves to one of the reward ports, and receives a water reward for a correct choice. Gray box, delay epoch. (B) Organization of SG (gray) and IS (white) blocks within a session. All sessions start with an SG block and alternate between SG and IS blocks. In SG blocks, reward side corresponds to the dominant odor in the mixture [(-)-carvone, left; (+)-carvone, right]; when the odors are balanced ([(-)-carvone] = [(+)-carvone]), the probability of reward at both reward ports is 0.5. In IS blocks, odors are balanced in every trial and reward is available at the same side in each trial. Thickness of horizontal lines corresponds to probability of reward. SG, stimulus guided; IS, internally specified; L, left; R, right. (C) Fraction of left choices across block types throughout the session. Dashed line shows an example session (boxcar smoothed over 7 trials), solid black line shows mean over all sessions (54, from 4 mice), horizontal black lines show block means, horizontal gray lines show ideal block means (if all choices were correct). To account for different numbers of trials per block across sessions, trials that occur in < 60% of sessions are excluded. In SG blocks only difficult trials [(+)-carvone/(-)-carvone = 60/40, 50/50, or 40/60] are shown. (D) Mean performance in SG blocks over all sessions, separated by rewarded side of first IS block in the session. Lines show best fit to , where x is the proportion of the left odor [(-)-carvone)] in the mixture, p is the fraction of right choices, and a and b are free parameters. While choices were slightly biased by the rewarded direction in the first IS block (center panels), they were much more strongly influenced by the stimulus. (E) Performance in IS blocks. Histograms of percent correct choices (top) and number of error events (run of consecutive incorrect choices, bottom) across blocks over all sessions. (F) Mean reaction time in easy SG trials plotted against mean reaction time in IS trials in the corresponding session, separately for each direction of movement.
Figure 2
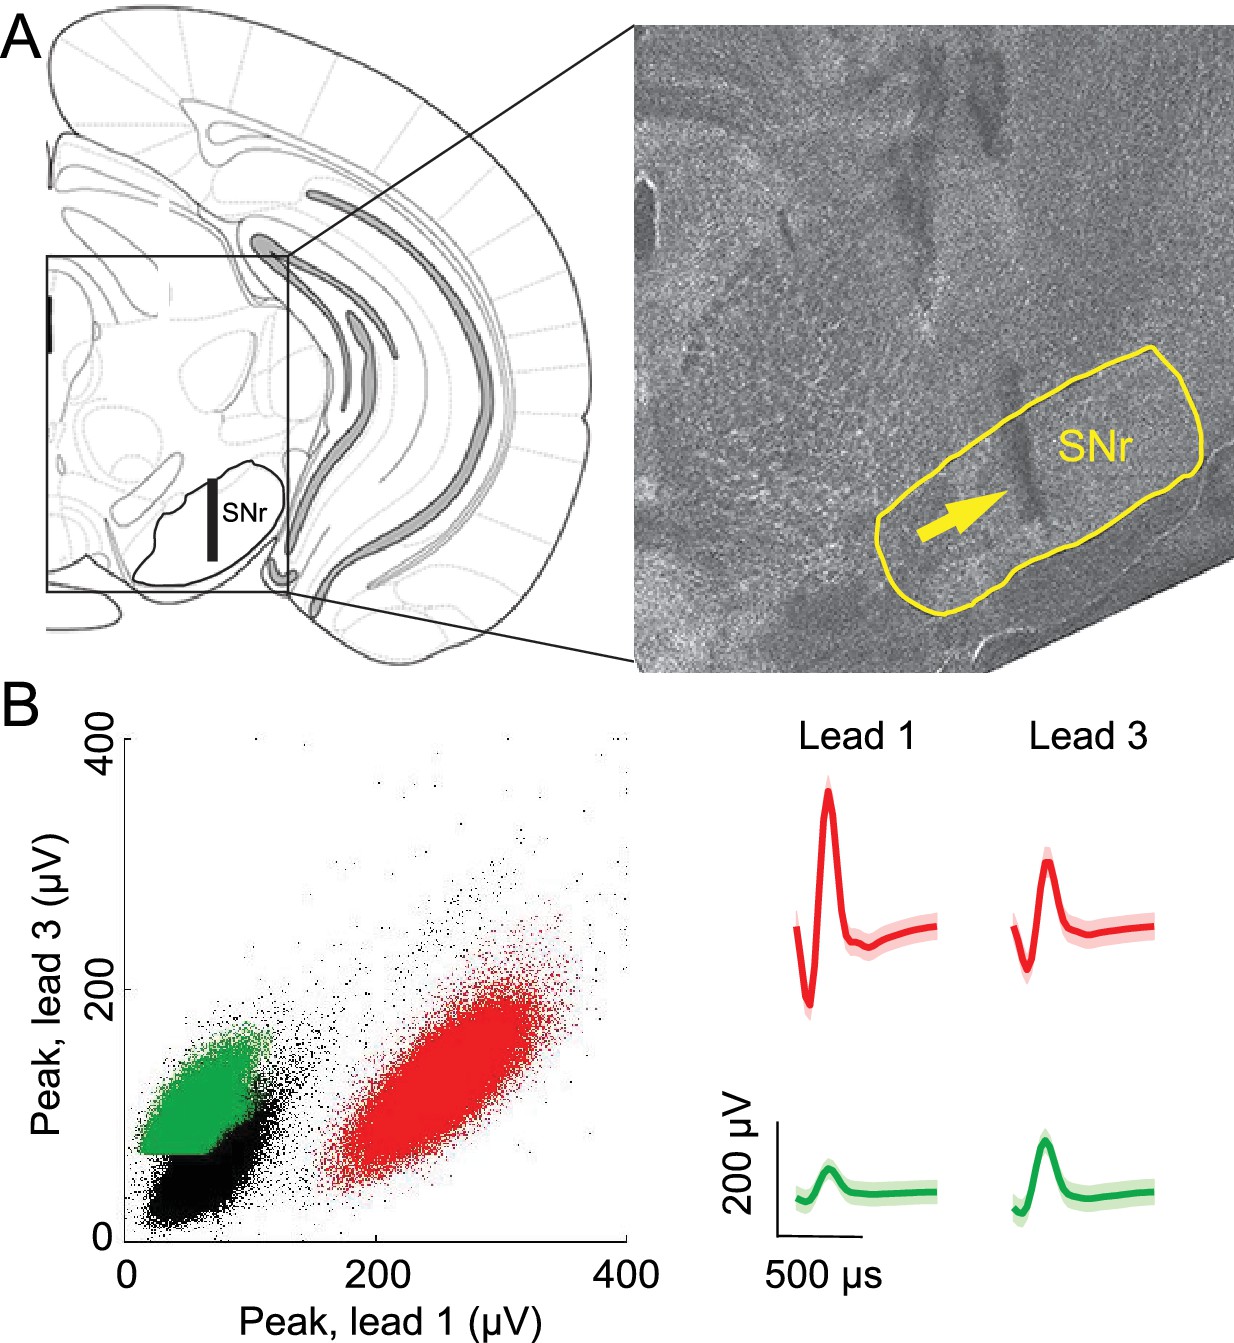
Confirmation of recording sites and spike clustering.
(A) Schematic (left) shows targeted recording extent (bar) within SNr; coronal section (right, 3.3 mm caudal from bregma) shows representative tetrode track (arrow) in SNr. (B) Left, peaks of waveforms from lead 1 plotted against peaks of waveforms from lead 3 of one tetrode for a representative recording session. Note that clustering was performed using additional features to those shown here. Red and green points show waveform peaks recorded from neurons considered to be distinct. Right, waveforms (mean ± SD) corresponding to red and green points.
Figure 3

SNr activity during the delay epoch depends on movement direction and trial type.
(A) Rasters for an example neuron grouped by movement direction (rows) and trial type (columns). For each raster, each row shows spikes (black ticks) in one trial, aligned to time of odor valve open (red line) and sorted by duration of delay epoch. Green ticks, times of go signal; blue ticks, times of odor port exit. Fifty pseudo-randomly selected trials are shown per group. (B) Peri-event histograms showing average activity, separately by direction, in stimulus-guided (left) and internally-specified (right) trials. Shading, ± SEM. Histograms are smoothed with a Gaussian filter (σ = 15 ms). Ipsi., ipsiversive; Contra., contraversive. (C) Histogram of direction preferences during delay epoch across population of neurons. Arrowhead corresponds to example neuron in A. (D) Difference in delay-epoch firing rate between ipsiversive and contraversive trials in SG vs. IS trials in the same session, separately for ipsiversive-preferring neurons (left subpanel, corresponding to left black bars in C) and contraversive-preferring neurons (right subpanel, corresponding to right black bars in C). Only correct trials are included; all choices on 50/50 SG trials were considered correct regardless of whether they were rewarded. Dashed lines show x = 0, y = 0, and x = y. Red marker corresponds to example neuron from A and B. FR, firing rate.
Figure 4
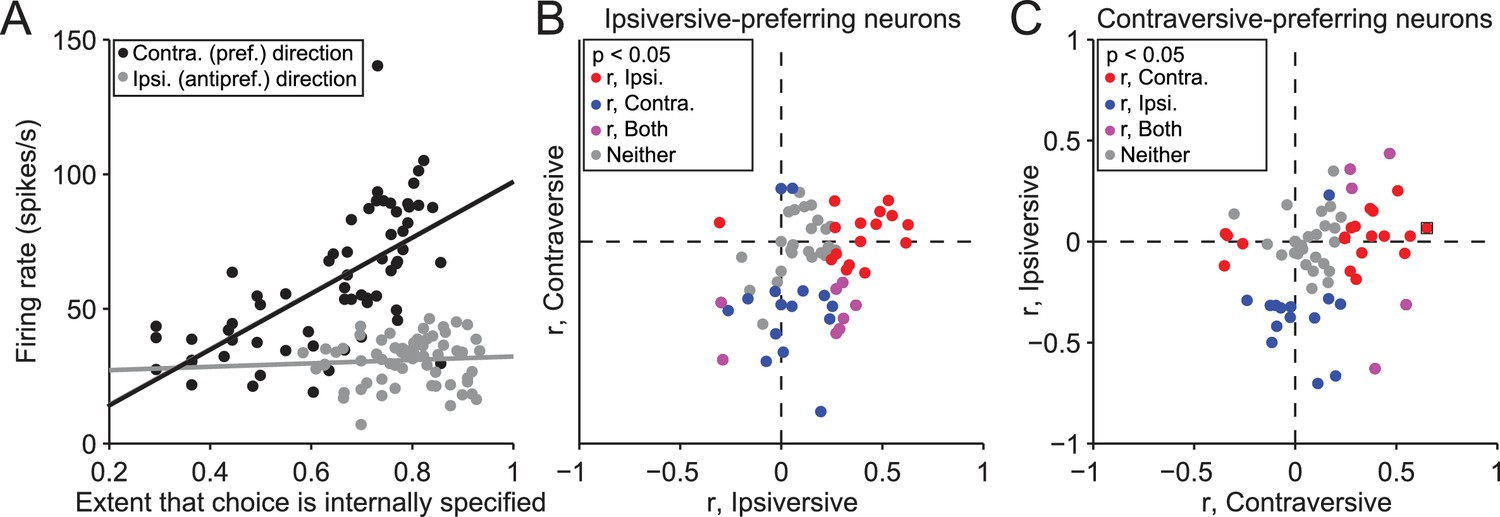
Activity depends on the extent to which movements are internally specified.
(A) Firing rate during delay epoch plotted as a function of the value of the rewarded side, estimated via reinforcement learning (), for both IS blocks in a session, for one example neuron. Each circle corresponds to one trial. (B) Correlations (as in panel A) for ipsiversive movement plotted against contraversive movement, for the population of ipsiversive-preferring neurons (left black bars in Figure 3C) with activity that depended on trial type (SG vs. IS). Each circle corresponds to one neuron. (C) Same as B, for contraversive-preferring neurons (right black bars in Figure 3C). Black box corresponds to example neuron from A.
Figure 5
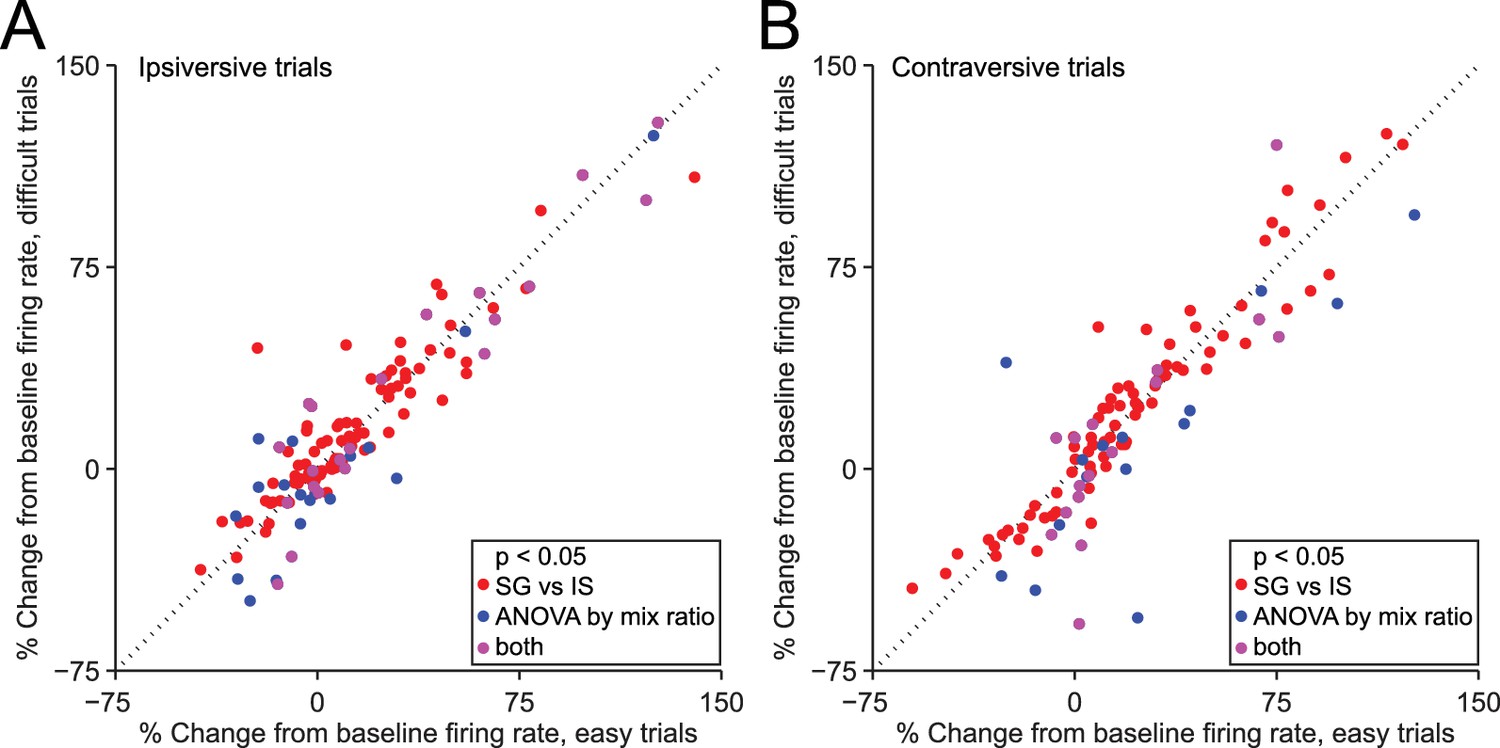
Dependence of firing rate on trial type cannot be explained by discrimination difficulty or an associated variable.
(A) Mean normalized change from baseline (Fc, see Materials and methods) during delay epoch of easy vs. difficult ipsiversive SG trials of direction-selective neurons (black bars in Figure 3C). Each circle corresponds to one neuron. Red circles indicate that activity differs between SG and IS trials, and does not depends on mixture ratio (or an associated variable such as discrimination difficulty). (B) Same as A, for contraversive trials.
Figure 6
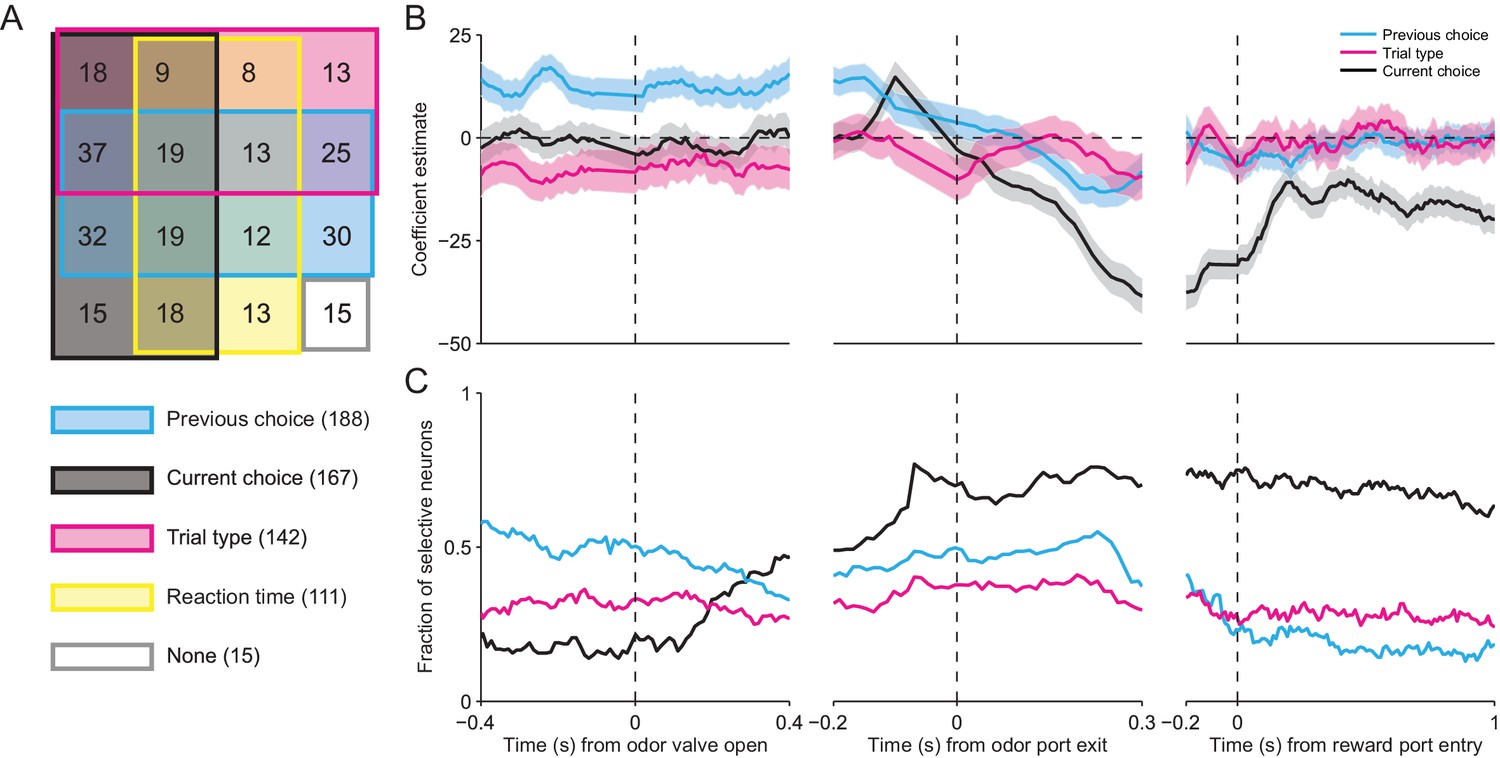
SNr activity is influenced by several task-relevant factors throughout the trial.
(A) Venn diagram showing the number of neurons whose firing rate during the delay epoch was significantly influenced (p < 0.05) by previous choice, current choice, trial type, reaction time, and all combinations of these factors, or by no factor. (B) β coefficients estimated based on firing rate in 100 ms bins aligned to three different trial events for one example neuron (reaction time coefficient not shown, for clarity). Shading, ± 95% confidence interval. (C) Fraction of neurons with a significant β coefficient corresponding to each predictor variable in each 100 ms bin, aligned as in panel B. All 296 neurons were included in this analysis.
Figure 7
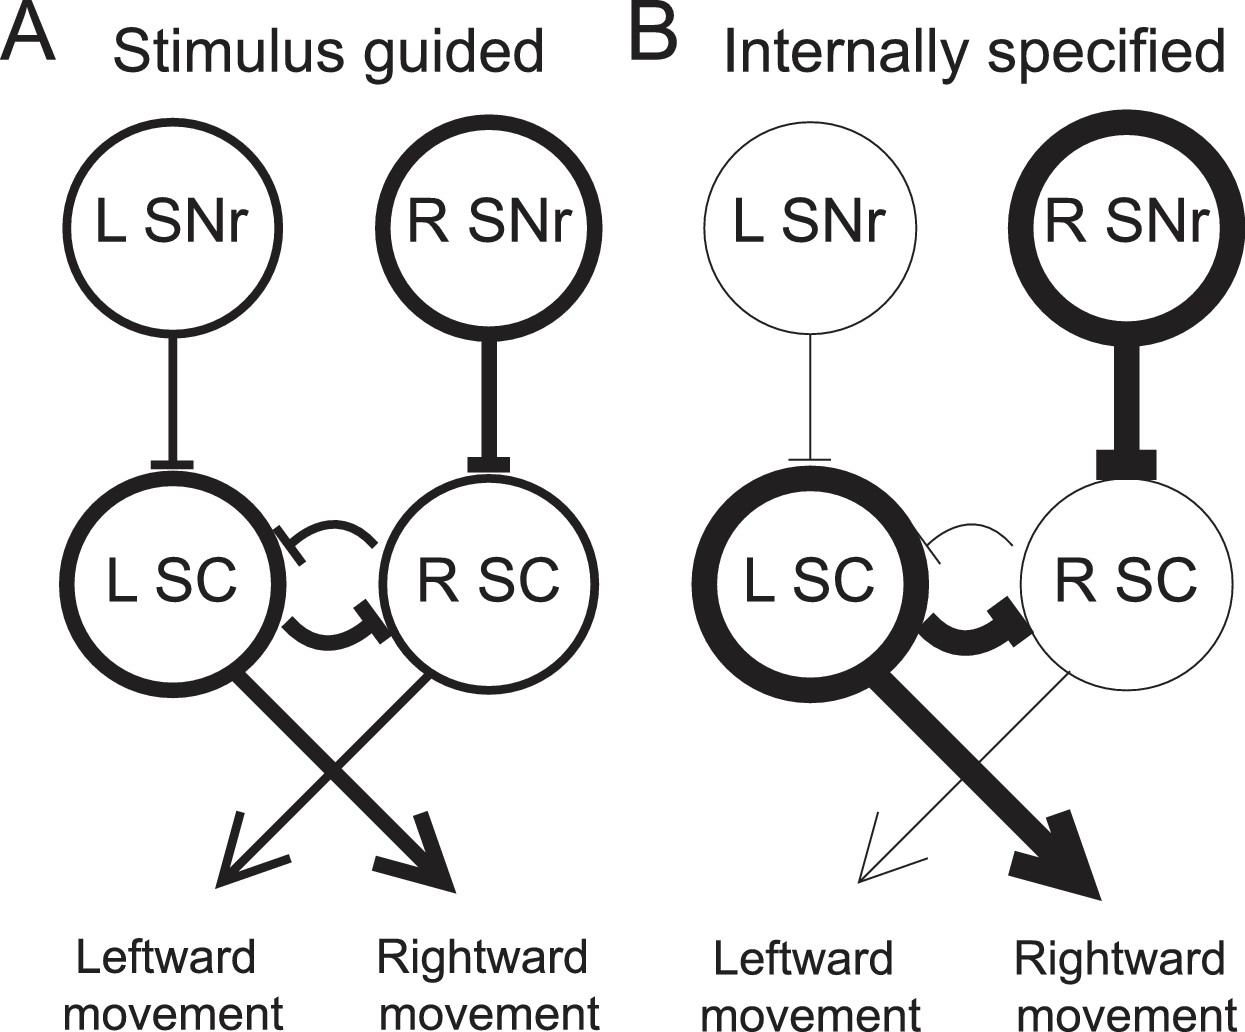
Model proposing how the observed activity of ipsiversive-preferring SNr neurons could facilitate internally-specified movements relative to stimulus-guided movements.
(A) Line thickness corresponds to level of activity. Activity preceding stimulus-guided rightward movement. A left SNr neuron is moderately weakly active, providing moderately weak inhibition to the left SC (superior colliculus). A right SNr neuron is moderately strongly active, providing moderately strong inhibition to the right SC. This pattern of activity in the SC moderately promotes rightward movement. (B) Activity preceding internally-specified rightward movement. Compared to A, a left SNr neuron is very weakly active, providing very weak inhibition to the left SC; and a right SNr neuron is very strongly active, providing very strong inhibition to the right SC. This pattern of activity in the SC strongly promotes rightward movement.
Author response image 1
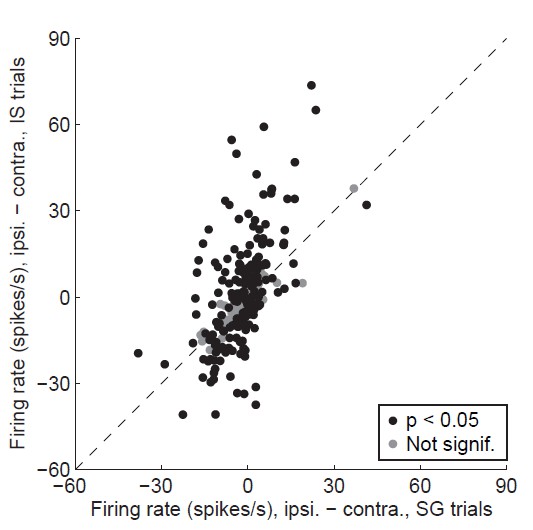
Alternative display for Revised Figure 3D.
Difference in delay-epoch firing rate between ipsiversive and contraversive trials in stimulus-guided vs. internally-specified trials in the corresponding session. Black circles show neurons with a significant direction preference (corresponding to black bars in Figure 3C; gray circles show neurons without a significant direction preference (corresponding to gray bars in Figure 3C. Only correct trials are included; all choices on 50/50 SG trials were considered correct regardless of whether they were rewarded (as in Figure 3D). We believe that this display is not as informative as Revised Figure 3D (see response to Comment #9).
Author response image 2

Alternative display for Revised Figure 5.
Difference in delay-epoch firing rate between ipsiversive and contraversive trials in easy SG trials (A), difficult SG trials (B), and IS trials (C). Neurons with a significant difference in ipsiversive vs. contraversive firing rate are shown in black. We believe that this display is not as informative as Revised Figure 5 (see response to Comment #11).
Author response image 3
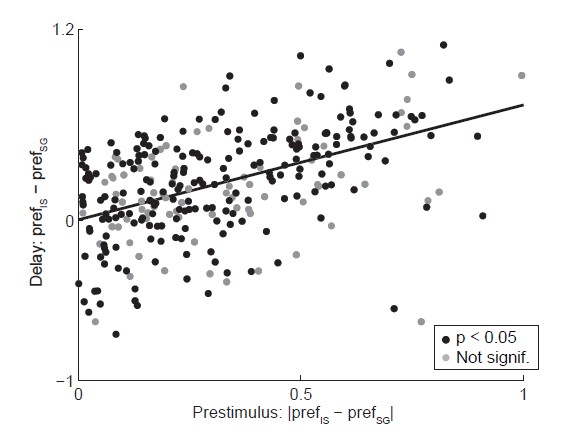
Relationship between activity during prestimulus and delay epochs.
Abscissa shows the absolute value of the difference in strength of direction preference between SG and IS trials during the delay epoch, where the sign preserves the relationship between preference in SG and IS trials across epochs (e.g., if prefSG > prefIS in the prestimulus epoch, ordinate shows prefSG – prefIS). Black circles show neurons with a significant direction preference (corresponding to black bars in Figure 3C; gray circles show neurons without significant direction preference (corresponding to gray bars in Figure 3C. See response to Comment #14.
Author response image 4

Direction preference calculated in SG vs.
IS trials in the same session. Each circle corresponds to one neuron.
Tables
Table 1
Direction preference and activity change during delay epoch. Neurons are grouped by direction preference and whether activity in the preferred direction increased or decreased relative to baseline (see Materials and methods), during the delay epoch. Numbers and percentages of grand total (279) are shown; note that 17 neurons exhibited no change in activity and are not included here.
| Preference | Increase | Decrease | Total | |||
|---|---|---|---|---|---|---|
| Contraversive | 88 | 32% | 27 | 10% | 115 | 41% |
| Ipsiversive | 52 | 19% | 38 | 14% | 90 | 32% |
| Nonselective | 48 | 17% | 26 | 9% | 74 | 27% |
| Total | 188 | 67% | 91 | 33% | 279 | 100% |
Additional files
-
Supplementary file 1
Table of mean firing rates, p-values, and preference values for each SNr neuron included in the study.
Rows correspond to individual neurons. Columns B-C show mean and standard deviation of activity during the baseline (our 'control' window, from odor port entry to reward port exit). Column D shows mean firing rates during the odor sampling epoch (i.e., delay epoch) in leftward (ipsiversive) SG trials. Column E shows p-values for paired t-tests of activity in leftward trials during the odor sampling epoch compared against baseline. Column F is similar to D, for rightward (contraversive) SG trials. Column G is similar to E, for rightward SG trials. Columns H-M are similar to B-G, for IS trials. Columns N-P show p-values for unpaired t-test comparing between SG and IS trials for baseline, odor sampling epoch in leftward trials, and odor sampling epoch in rightward trials, respectively. Column Q shows preference values calculated during the odor sampling epoch and Column R shows p-values associated with these preference values (corresponding to Figure 3C).
- https://doi.org/10.7554/eLife.13833.011
Download links
A two-part list of links to download the article, or parts of the article, in various formats.
Downloads (link to download the article as PDF)
Open citations (links to open the citations from this article in various online reference manager services)
Cite this article (links to download the citations from this article in formats compatible with various reference manager tools)
Basal ganglia output reflects internally-specified movements
eLife 5:e13833.
https://doi.org/10.7554/eLife.13833


