Sensory experience modifies feature map relationships in visual cortex
- Australian College of Optometry, Australia
- University of Melbourne, Australia
- The University of Queensland, Australia
Figures
Figure 1
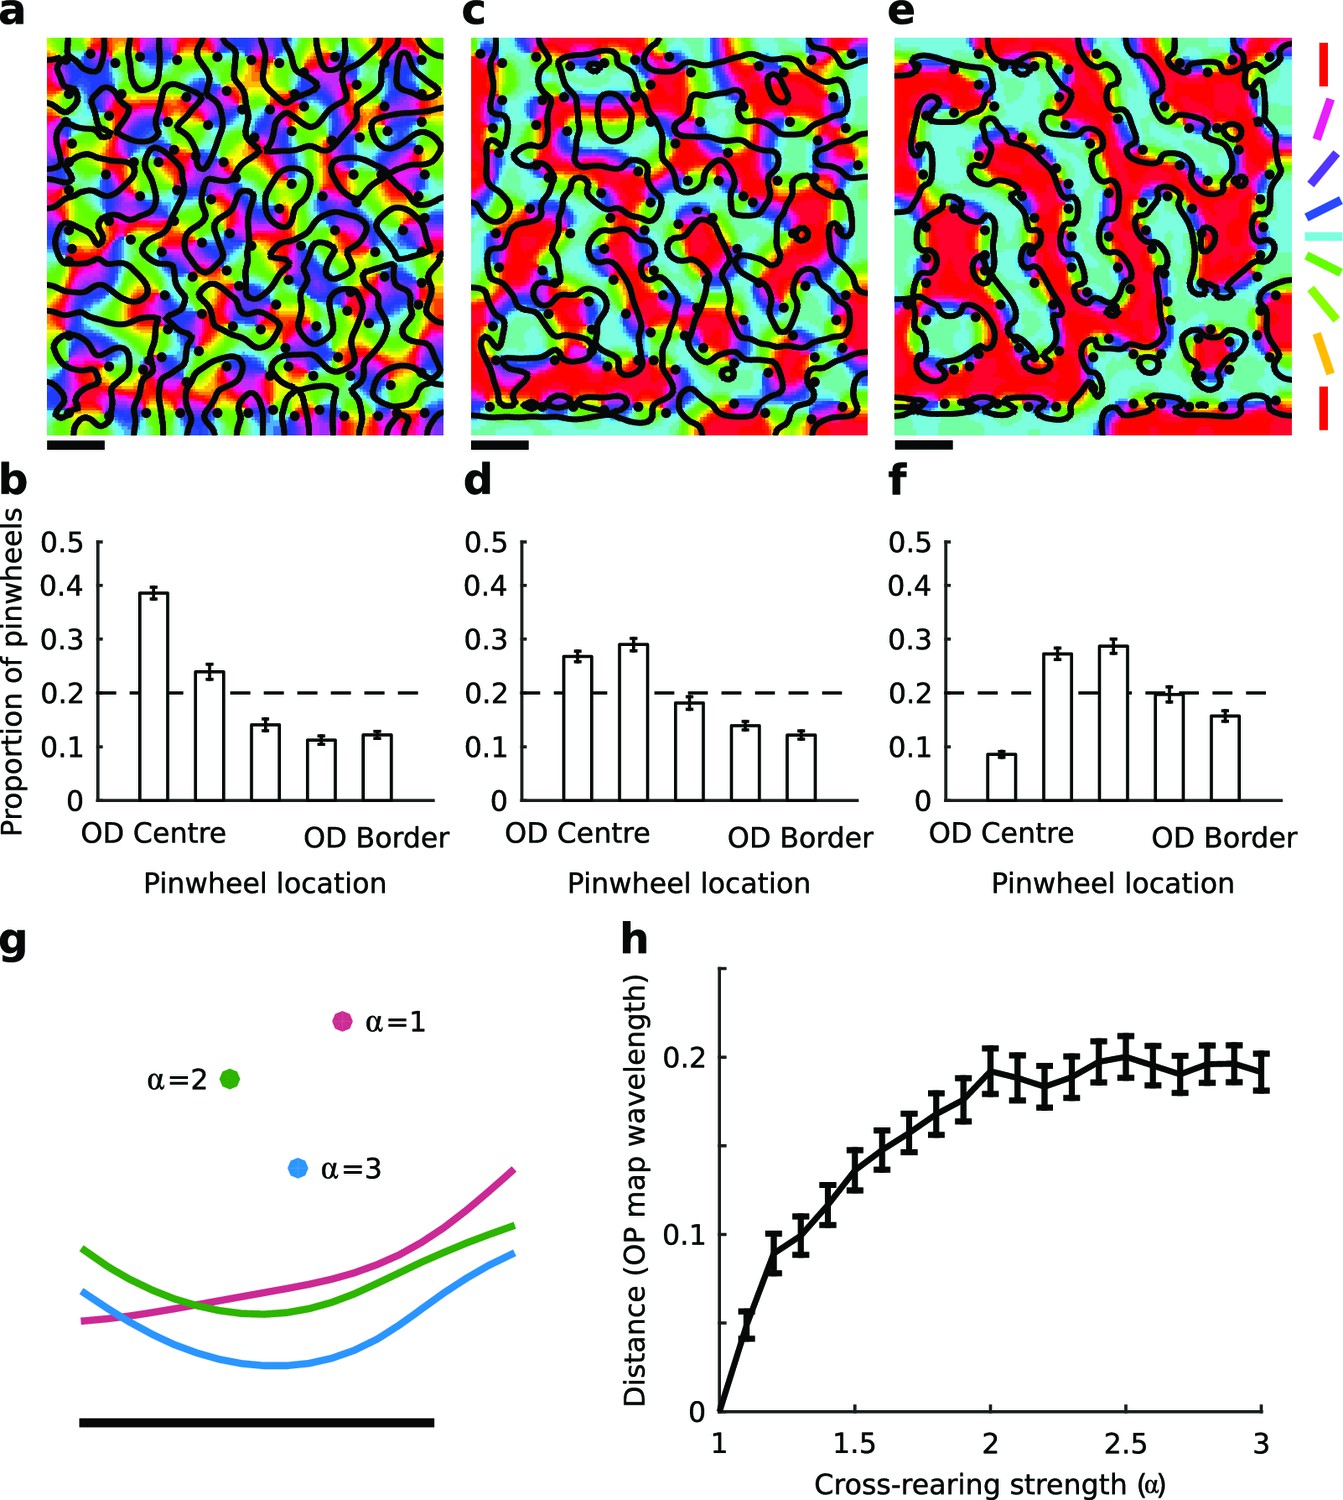
The elastic net model predicts changes in spatial map relationships under cross-rearing.
(a) Simulated orientation preference map (colours), orientation pinwheels (black dots), and ocular dominance borders (black lines) under normal rearing (relative strength of over-representation of horizontal and vertical contours in the input α = 1). (b) Histogram of pinwheel locations relative to the OD borders under normal rearing, showing a preference for pinwheels located near the centre of OD regions as previously observed experimentally. Error bars show ± 1 SEM from 10 independent simulations. The dashed line shows the expected distribution if pinwheels were arranged randomly. (c) Simulated orientation preference map for the cross-reared condition (α = 3). (d) Histogram of pinwheel locations relative to OD borders for this case. (e,f) Simulated orientation preference maps and corresponding histogram of pinwheel locations relative to OD borders for a higher level of cross-rearing (α = 5). In the simulations of cross-rearing, pinwheels are shifted away from the centre and towards the border of OD regions. (g) A cropped region of a simulated OP and OD map produced with the same random seed but increasing strengths of over-representation. Circles show the location of a pinwheel and lines show the location of the adjacent OD border. Both the pinwheel and the OD border move under cross-rearing relative to their positions under normal rearing (α = 1), but the distance between them decreases. (h) The average distance that pinwheels move from their original positions (measured in units of average OP map wavelength) as a function of the strength of cross-rearing. Errors bars show ± 1 SEM across all pinwheels in the map. Scale bars in panels a, c, e and g indicate 15 pixels in the simulated feature maps. Source data for this figure are available in Figure 1—source data 1.
-
Figure 1—source data 1
This HDF5 file contains the numerical values shown in Figure 1.
- https://doi.org/10.7554/eLife.13911.004
Figure 2
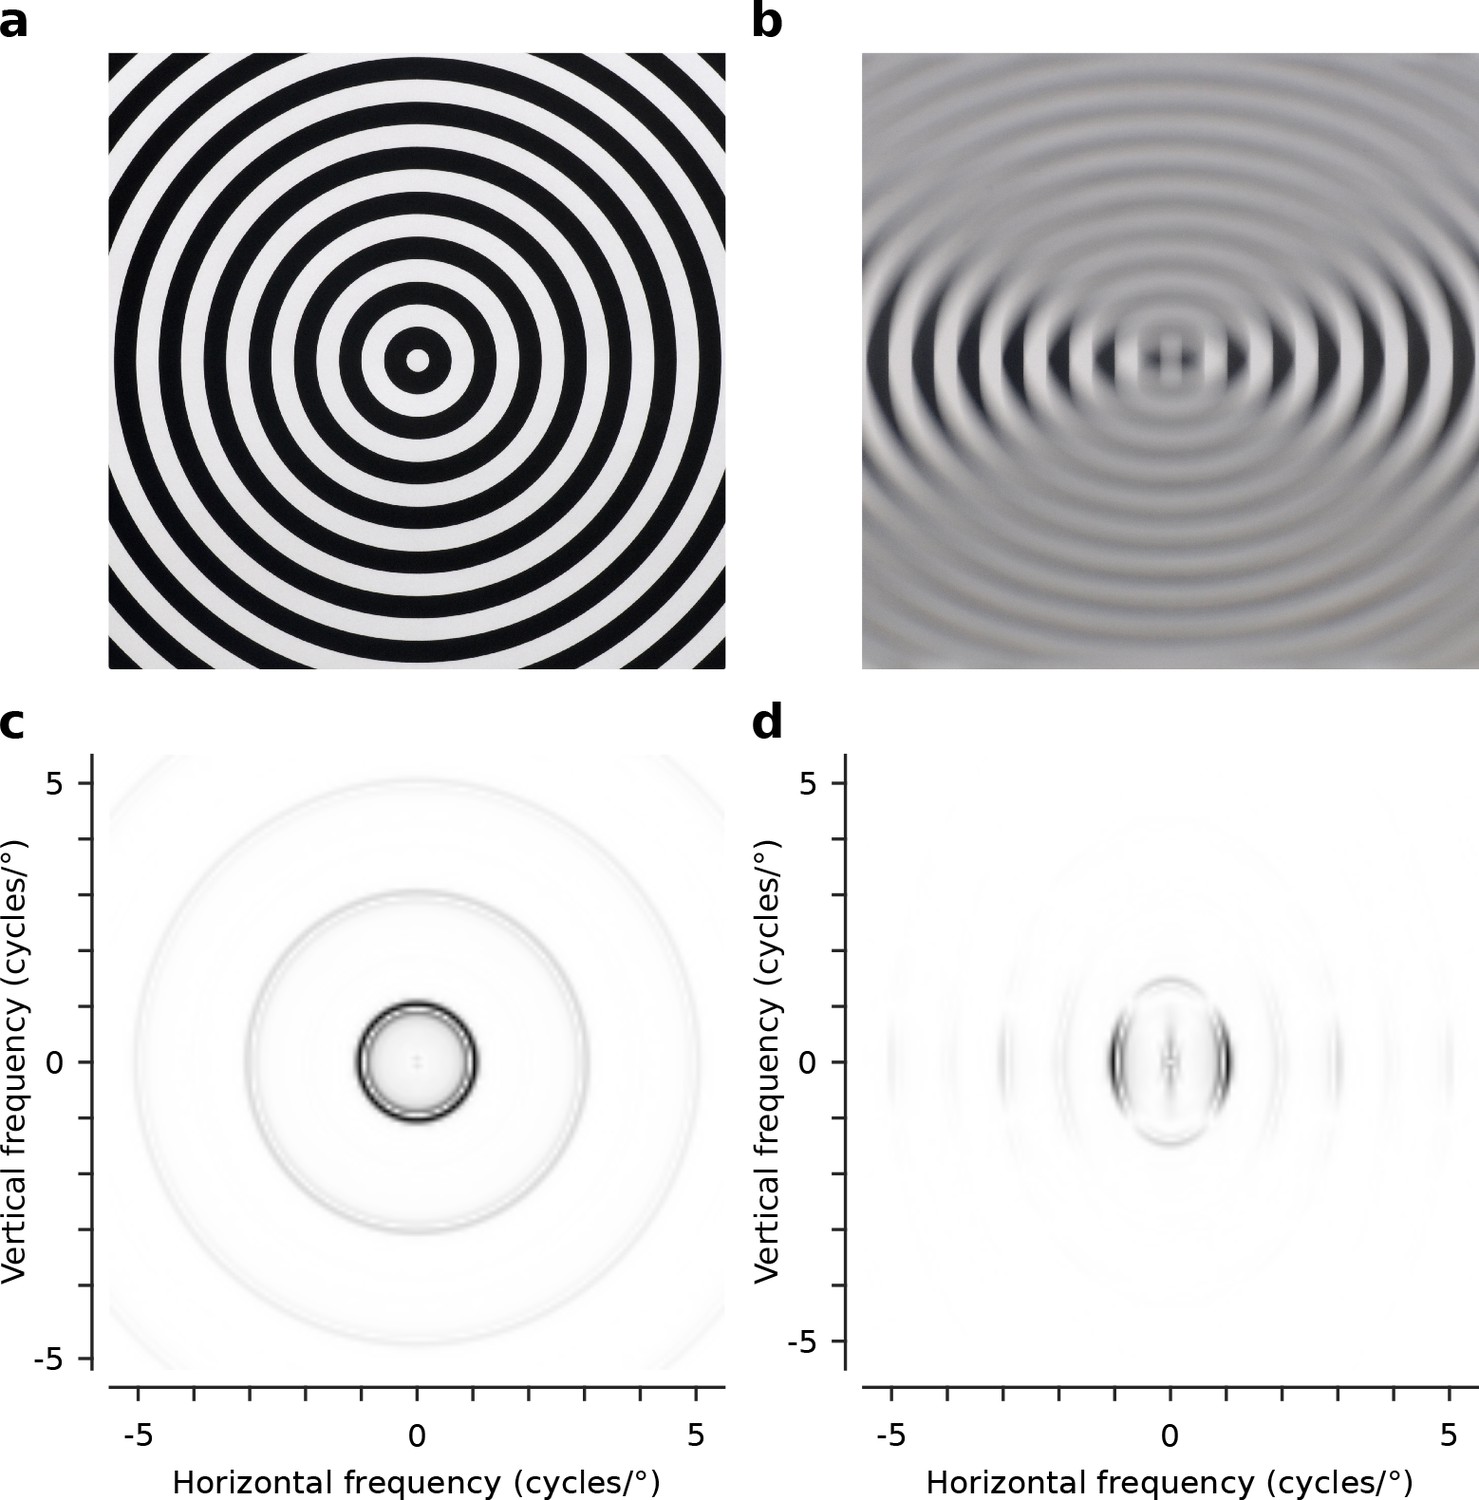
Optical characteristics of the -10 dioptre cylindrical lenses.
(a) Circular square wave test grating (1 cycle/°) viewed normally (no lens). (b) The same grating viewed through the -10 dioptre cylindrical lens, with the lens axis aligned horizontally, attenuating horizontal and preserving vertical contours. (c) The radially symmetric distribution of power over spatial frequency for the test grating viewed normally. (d) The radially asymmetric distribution of power over spatial frequency for the same grating when viewed through the -10 dioptre cylindrical lens with the lens axis aligned horizontally. Contours orthogonal to the axis are preserved while contours parallel to the axis are attenuated. Power spectra shown in (c) and (d) are normalized to the peak power (black).
Figure 3 with 3 supplements
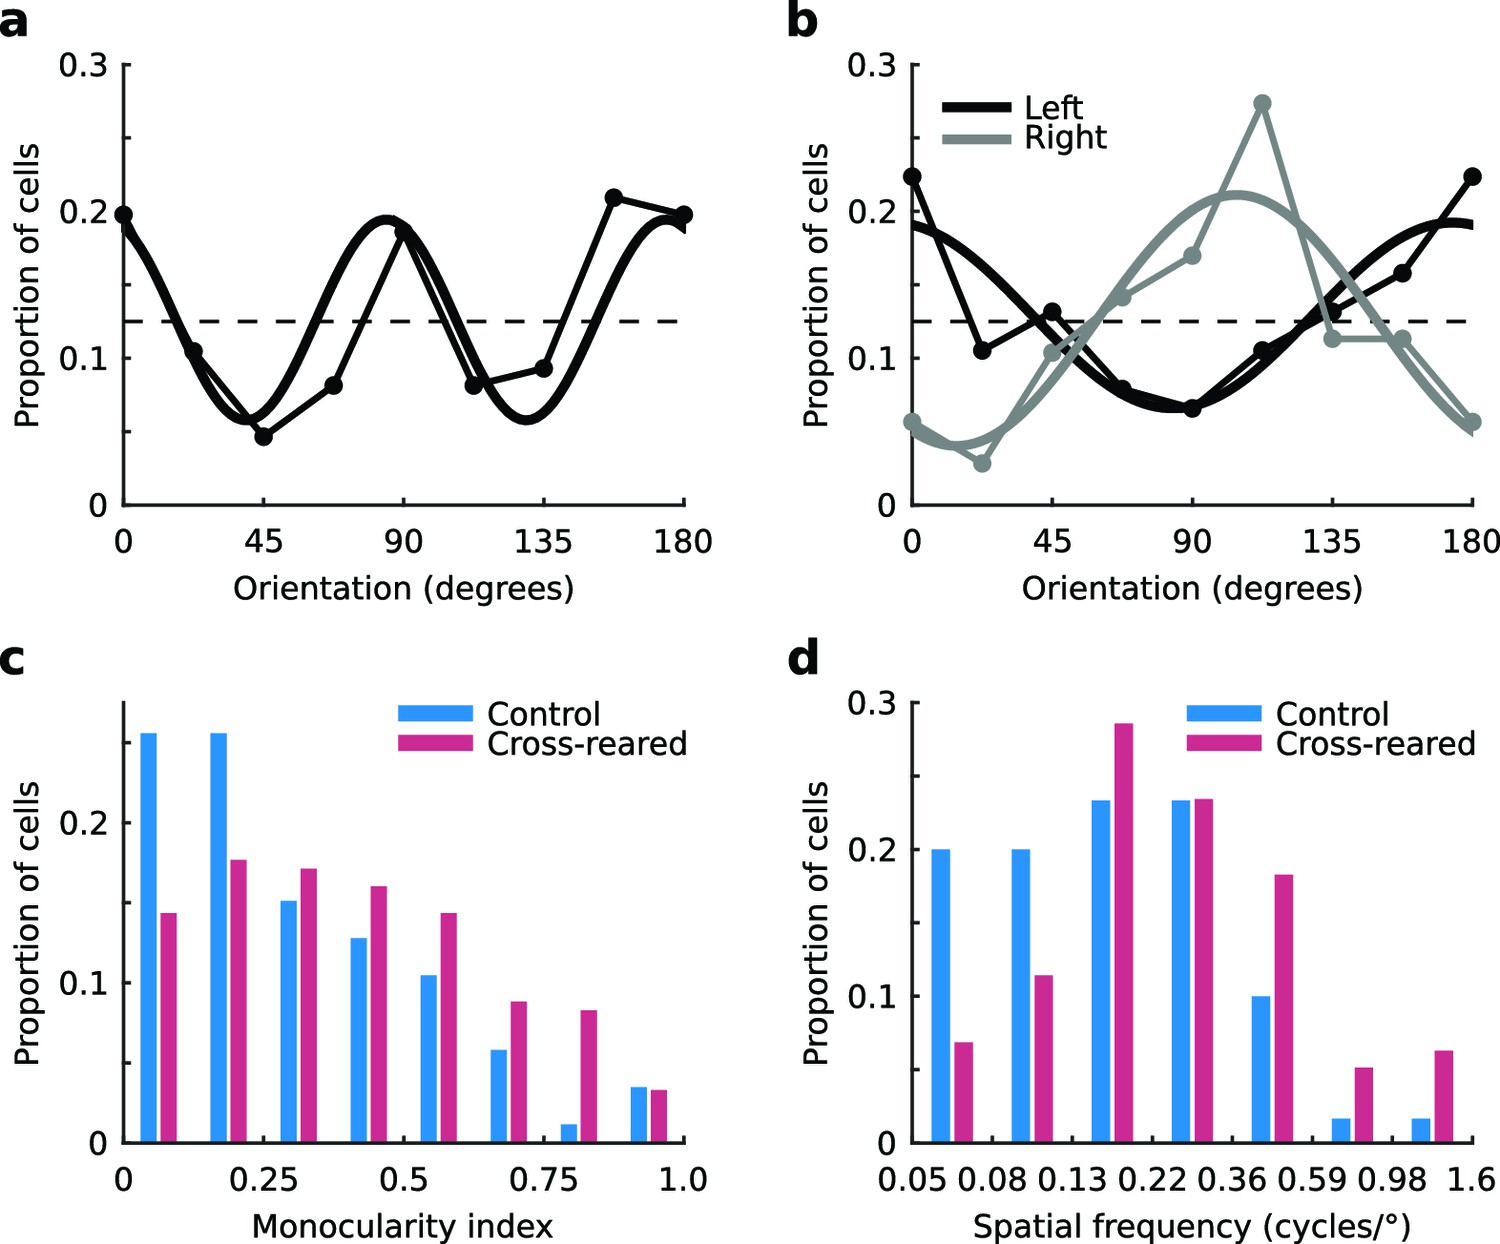
Tuning properties of single units.
(a) The distribution of preferred orientation in control animals exhibited an over representation of cardinal orientations. The dashed line shows the expected distribution if all orientations were represented equally. The best-fitting sine curve with period 90° had peaks at 84° and 174° (thick line, r2 = 0.69). (b) Distributions of preferred orientation in the cross-reared animals, for units driven predominantly by input from the left (black) and right eye (grey). The best-fitting sine curves with period 180° peaked at 174° for the left eye (thick black line, r2 = 0.75) and 104° for the right eye (thick grey line, r2 = 0.79). Cross-rearing thus caused a systematic change in the distributions of preferred orientation of single units. Cross-rearing also caused an increase in monocularity (c) and an increase in preferred spatial frequency (d) of single units. Source data for this figure are available in Figure 3—source data 1.
-
Figure 3—source data 1
This HDF5 file contains the numerical values shown in Figure 3.
- https://doi.org/10.7554/eLife.13911.007
Figure 3—figure supplement 1
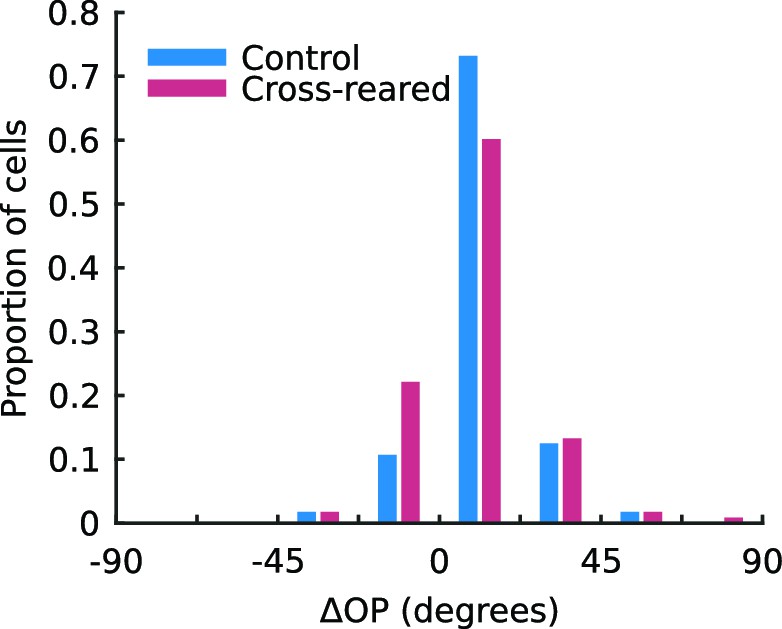
Inter-ocular difference in preferred orientation of single units is not altered by cross-rearing.
The mean inter-ocular difference in preferred orientation (ΔOP) is significantly greater than 0 in both control (mean ΔOP = 11.8°, p < 0.001, two-tailed t-test) and cross-reared animals (mean ΔOP = 9.8°, p < 0.001, two-tailed t-test). The distributions of ΔOP for single units from control and cross-reared animals are not significantly different (p = 0.44, two-tailed, two-sample t-test).
Figure 3—figure supplement 2

Preferred temporal frequency of single units is not altered by cross-rearing.
The distributions of preferred temporal frequency for single units from control and cross-reared animals are not significantly different (p = 0.2, Kruskal-Wallis test).
Figure 3—figure supplement 3

Contrast sensitivity of single units is not altered by cross-rearing.
The distributions of semi-saturation contrast (σ, see Equation 4) for single units from control and cross-reared animals are not significantly different (p = 0.81, Kruskal-Wallis test).
Figure 4

Extended spatial decorrelation recovers OP and OD maps from green light imaging.
(a) Time course of the relative change in reflectance (∆R/R) during a trial, averaged over all pixels and all trials, measured with red (609 nm) and green (520 nm) light. The shaded region shows the stimulus period. Consistent with earlier reports (Sirotin and Das, 2009; Sirotin et al., 2009), green light produced a much stronger signal. (b–d) Representative source coefficient time series from the extended spatial decorrelation algorithm (see Materials and methods). Sources 46–50 (as per legend) for (b) the real component of the OP map, (c) the imaginary component of the OP map, and (d) the OD map. The shaded region shows the stimulus period. The mean over the pre-stimulus period was subtracted from each source. It is clear in each case that one source (in this case source 50) most strongly represents the signal of interest. (e,f) OP maps generated from the green (e) and red (f) light responses. (g,h) OD maps generated from the green (g) and red (h) light responses. Over the region shown here (the one used for analysis), the correlation between red and green OP maps was r2 = 0.78 and between the red and green OD maps was r2 = 0.77. Colour encodes the preferred orientation in the OP maps (as per legend) and brightness encodes eye preference in the OD maps, with black and white representing the left and right eyes, respectively. Data from a control animal. Scale bars: 1 mm. Source data for this figure are available in Figure 4—source data 1.
-
Figure 4—source data 1
This HDF5 file contains the numerical values shown in Figure 4.
- https://doi.org/10.7554/eLife.13911.012
Figure 5 with 2 supplements
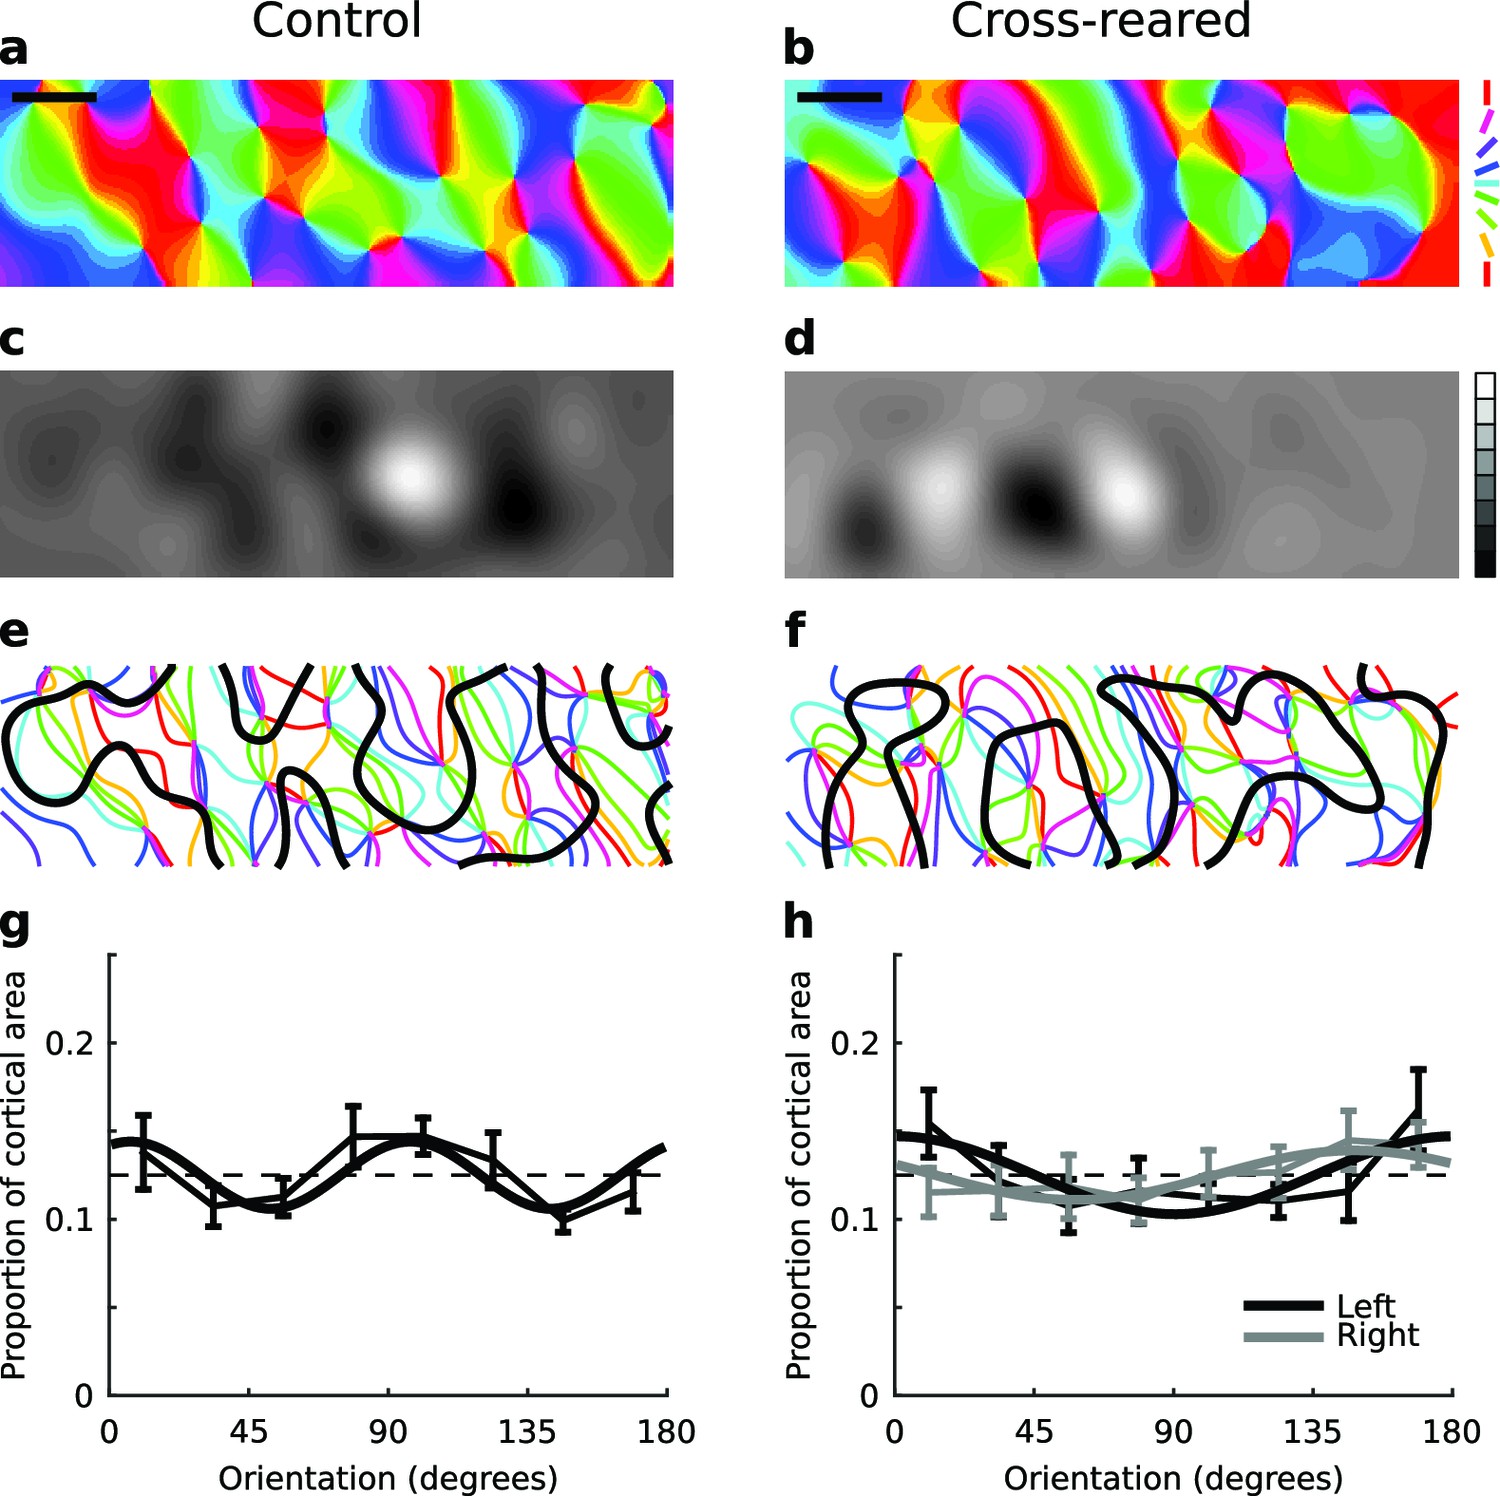
Cross-rearing changes the distribution of orientation preferences.
(a) OP map, (c) OD map and (e) overlay of OD and OP contours for a control cat. (b) OP map, (d) OD map and (f) overlay of OD and OP contours for a cross-reared cat. While qualitatively the control and cross-reared maps look similar, quantitative analysis revealed differences. (g) Proportion of cortical area representing different orientations from binocular stimulation for all control hemispheres (thin line: mean ± 1 SEM, thick line: least-squares sine curve fit). The best-fitting sine curve with period 90° had peaks at 7° and 97°, and an r2 value of 0.6. For comparison the dashed line at a frequency of 1/8 represents equal proportions. (h) Data from left (thin black line) and right (thin grey line) monocular stimulation for all cross-reared hemispheres. The best-fitting sine curve with period 180° peaked at 0° for the left eye (horizontal orientations, thick black line) and 148° for the right eye (vertical orientations, thick grey line). The r2 values for the fits were 0.64 (left eye) and 0.71 (right eye). In contrast the best-fitting sine curves with period 90° (not shown) had r2 values of 0.33 (left eye) and 0.13 (right eye). Thus cross-rearing caused a systematic shift in the proportions of the maps occupied by each orientation, towards the orientation that each eye predominantly experienced. As in Figure 4, colour encodes the preferred orientation in the OP maps and brightness encodes eye preference in the OD maps. Scale bars: 1 mm. Source data for this figure are available in Figure 5—source data 1.
-
Figure 5—source data 1
This HDF5 file contains the numerical values shown in Figure 5.
- https://doi.org/10.7554/eLife.13911.014
Figure 5—figure supplement 1

The distribution of orientation selectivity is slightly altered by cross-rearing.
The mean distributions of normalised orientation selectivity for all control and cross-reared hemispheres. Normalised orientation selectivity was calculated as the absolute value of each pixel in the OP map, normalised to the maximum selectivity value in each map separately. Cross-reared hemispheres have slightly lower median orientation selectivity (p<0.001, two-sample Kruskal-Wallis test). Although the difference is very small, it is statistically significant because each data point is derived from many hundreds of pixels. Error bars show ± 1 SEM.
Figure 5—figure supplement 2
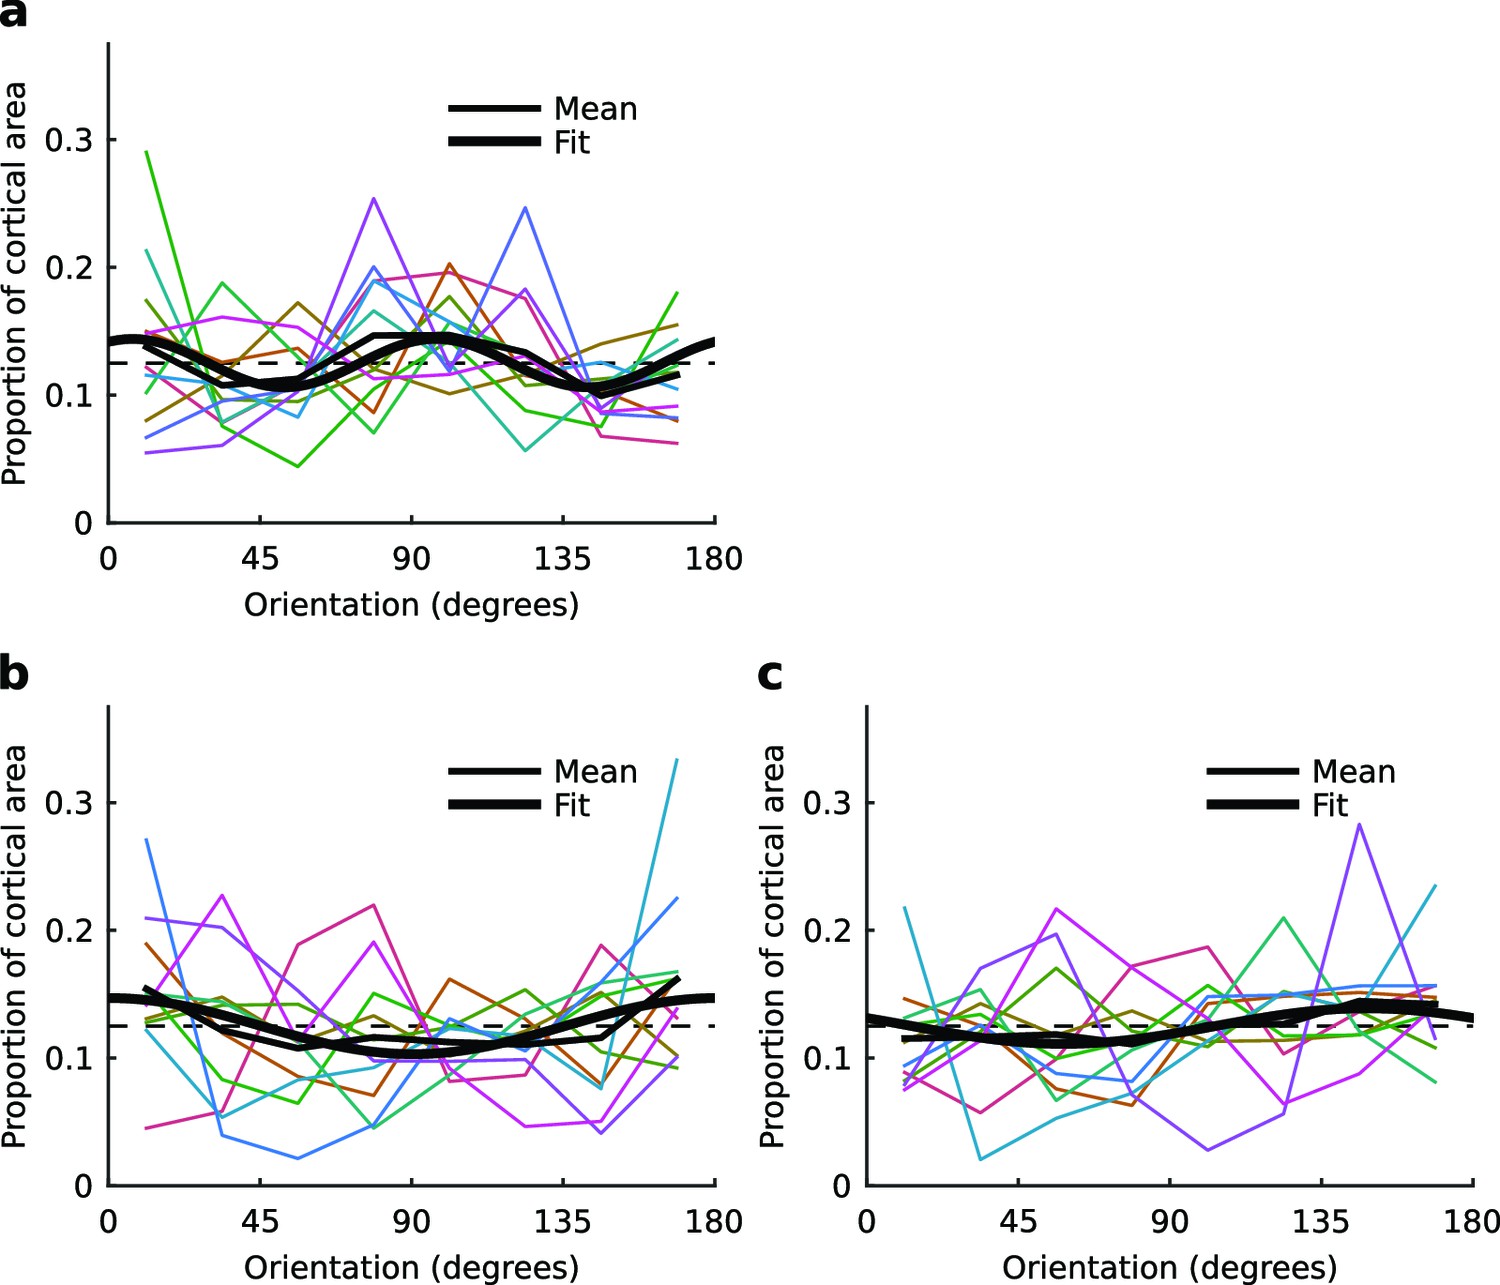
Distributions of orientation preferences in each hemisphere.
(a) Proportion of cortical area representing different orientations from binocular stimulation for all control hemispheres (colored lines), their mean (thin black line), and the best fitting sine curve with period 90° (thick black line). (b,c) Proportion of cortical area representing different orientations from monocular stimulation of the left and right eyes, respectively, for all cross-reared hemispheres (colored lines), their mean (thin black lines), and the best fitting sine curve with period 180° (thick black lines).
Figure 6 with 2 supplements

Spatial relationship between pinwheels and ocular dominance is modified by rearing condition.
(a) Pinwheel density relative to squared map wavelength was not significantly different between control and cross-reared animals, both being consistent with the theoretically predicted value of π (dashed line) (Kaschube et al., 2010). (b) Pinwheel locations relative to the centres/borders of OD regions were quantised into 5 bins similarly to Hübener et al. (1997). For control animals, pinwheels were disproportionately overrepresented at the centre of OD regions (n = 71 pinwheels total in control hemispheres), consistent with previous data (Hübener et al., 1997). (c) In strong contrast, for the cross-reared animals pinwheels were disproportionately underrepresented at the centre of OD regions (n = 55 pinwheels total in cross-reared hemispheres). (d) Computational simulations using the elastic net reproduced the shift of pinwheels away from the centres of OD regions in the cross-reared compared to control condition (data replotted from Figure 1b,f). For all graphs error bars show ± 1 SEM. p-values in (a) and (c) are from two-tailed, two-sample t-tests. Source data for this figure are available in Figure 6—source data 1.
-
Figure 6—source data 1
This HDF5 file contains the numerical values shown in Figure 6.
- https://doi.org/10.7554/eLife.13911.018
Figure 6—figure supplement 1
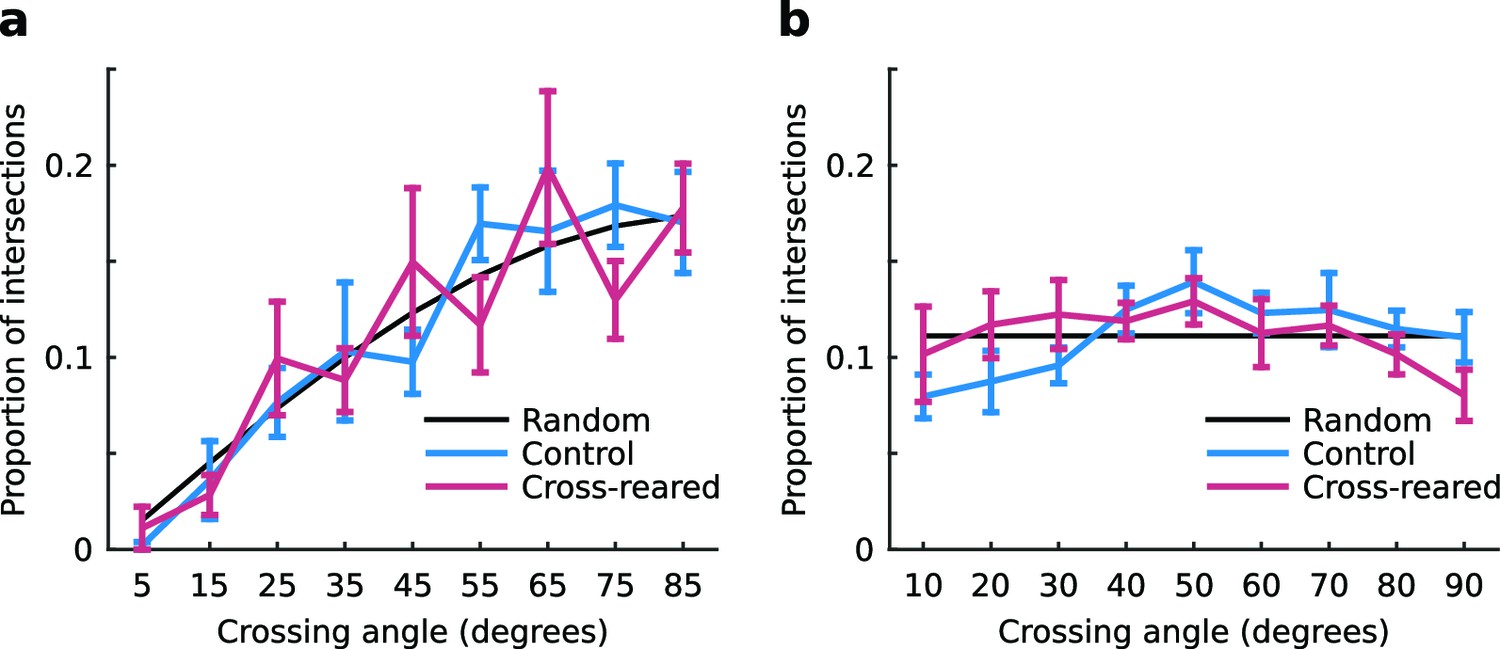
The distribution of intersection angles of the contours of the OP and OD maps is unchanged by cross-rearing.
(a) The distributions for control and cross-reared hemispheres are not significantly different (p = 0.36, two-sample Kruskal-Wallis test). For the quantification we used (see Materials and methods), the random distribution is a sine curve. (b) For comparison, the distributions for control and cross-reared hemispheres using the same quantification as in Hübener et al. (1997). Here, the random distribution is uniform. For these data we cannot say in either case that the distributions are non-random. Errors bars show ± 1 SEM.
Figure 6—figure supplement 2

The spatial layout of orientation selectivity is very slightly altered by cross-rearing.
The mean, normalised orientation selectivity in each of the five ocular dominance bins used to quantify pinwheel location relative to ocular dominance borders (see Materials and methods), averaged over all hemispheres in each condition. In control animals, selectivity was higher near the OD borders. but in cross-reared animals selectivity was higher near OD centres. * denotes a significant difference between conditions (p < 0.001, two-tailed, two-sample t-tests). Error bars show ± 1 SEM over all the pixels in each bin.
Author response image 1

Download links
A two-part list of links to download the article, or parts of the article, in various formats.
Downloads (link to download the article as PDF)
Open citations (links to open the citations from this article in various online reference manager services)
Cite this article (links to download the citations from this article in formats compatible with various reference manager tools)
Sensory experience modifies feature map relationships in visual cortex
eLife 5:e13911.
https://doi.org/10.7554/eLife.13911


