Decoupling kinematics and mechanics reveals coding properties of trigeminal ganglion neurons in the rat vibrissal system
- Northwestern University, United States
Figures
Figure 1
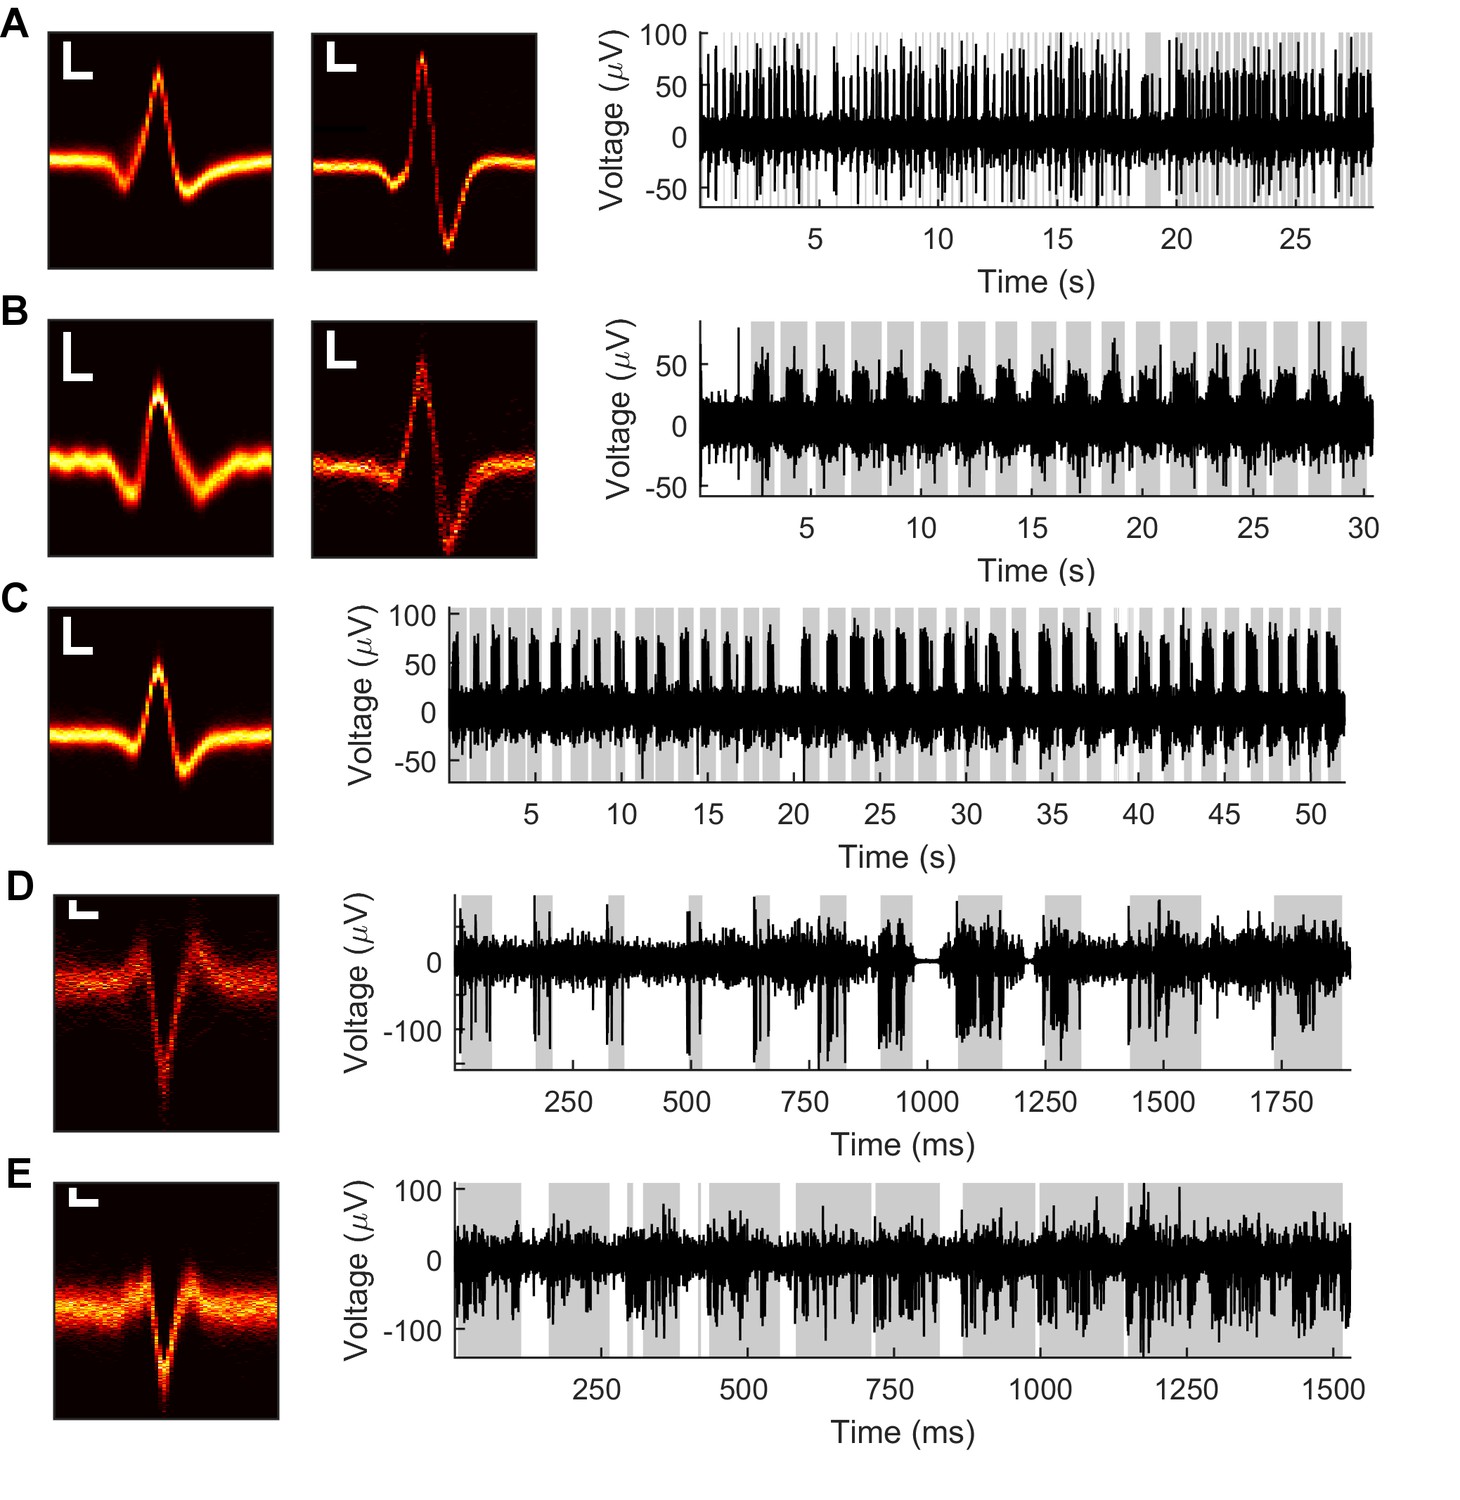
Example Vg recordings from both anesthetized and awake rats.
Data from five neurons in the anesthetized animal (A–C) and two neurons in the awake animal (D–E). Left: Heatmaps of isolated spike waveforms over all recordings of each neuron. Two waveforms in A and B indicate simultaneously recorded neurons. Scale bars are 20 μV, 200 μs; width of waveforms is 1.5 ms. Right: Segments of bandpass filtered (300–6,000 Hz) raw neural traces during periods of passive deflection in the anesthetized animal (A–C) or active contact in the awake animal (D–E). Gray shading indicates periods of contact.
Figure 2
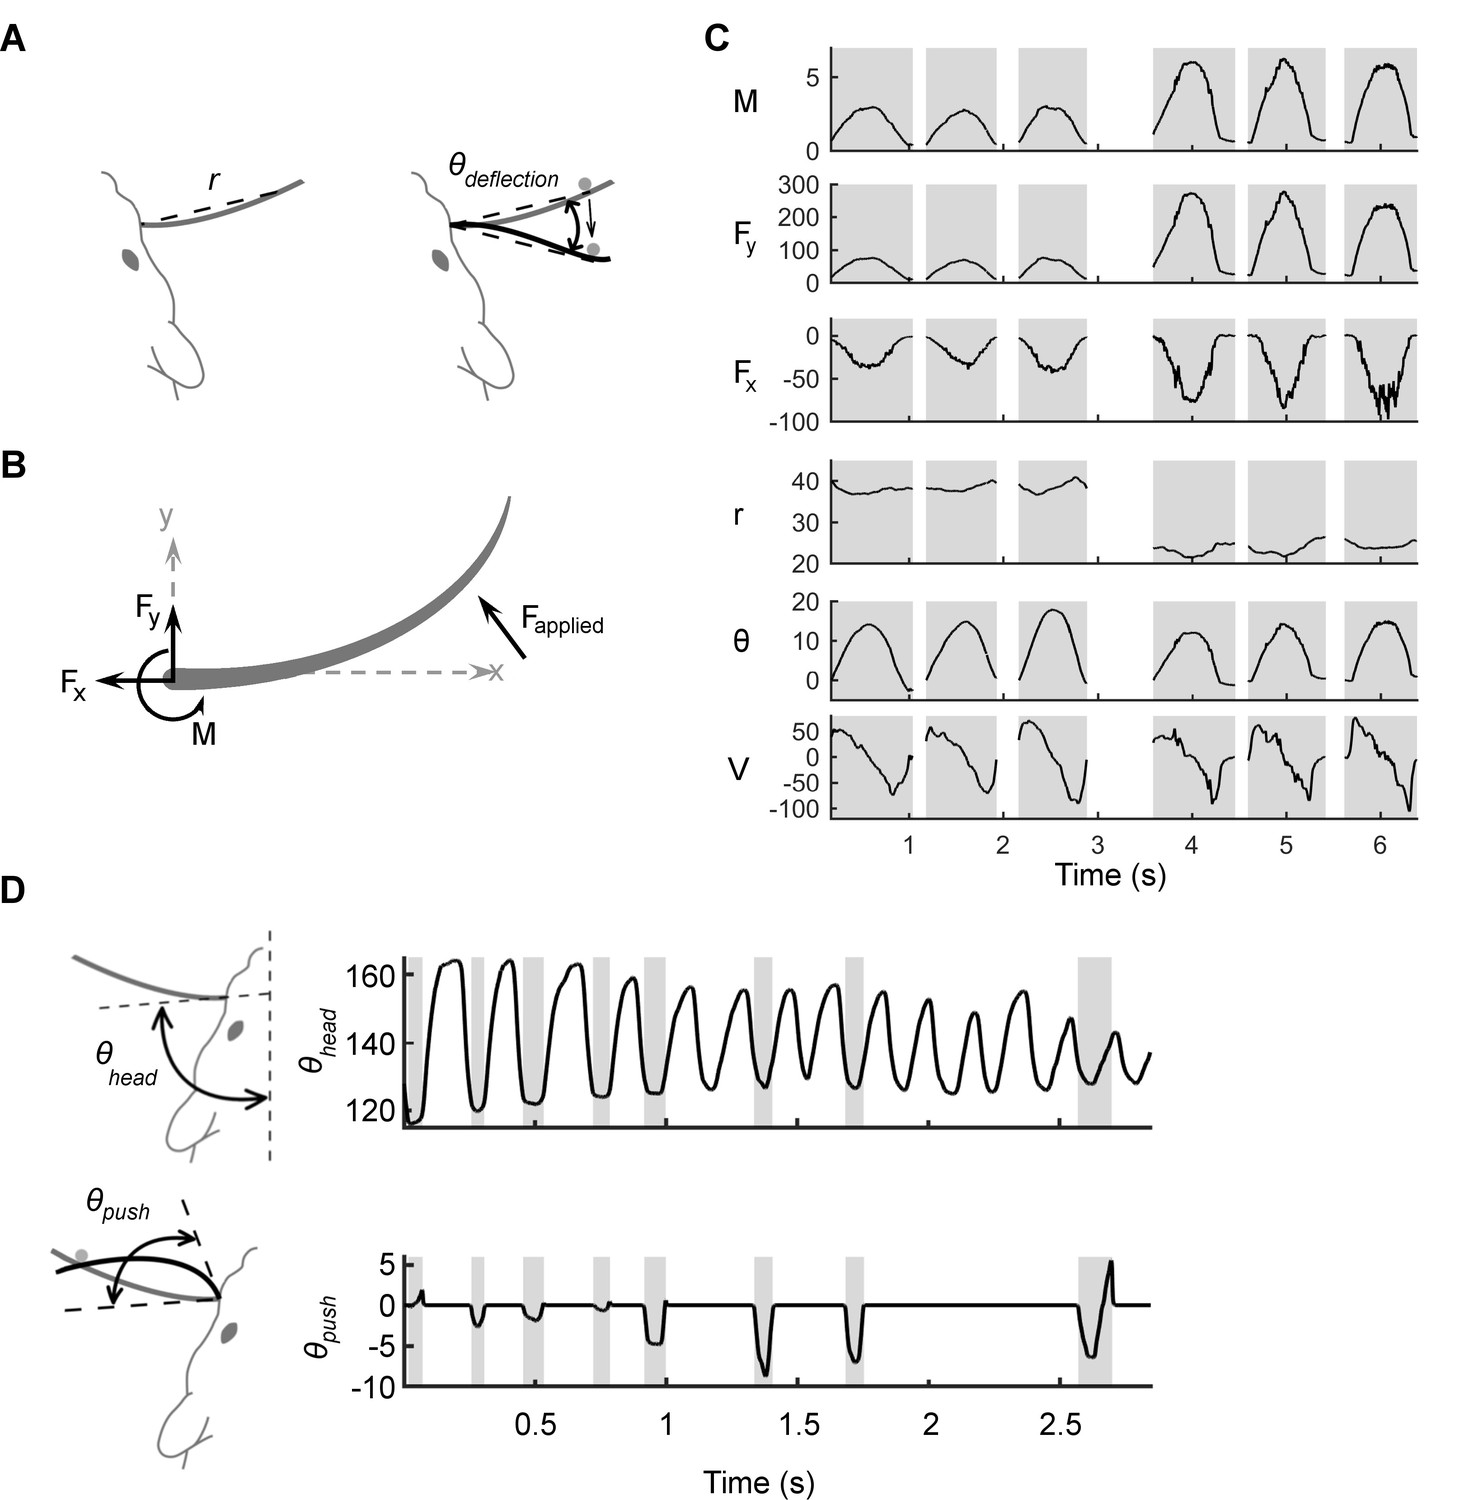
Mechanical and kinematic variables associated with contact.
(A) Schematic of the kinematic variables of contact. The shape and position of the whisker when at rest is in gray. The variable r indicates the straight-line distance from the basepoint to the contact point. During passive deflections, the relevant angle is , the angle between the line segment that connects the basepoint to the current point of contact and the line segment that connects the basepoint to the initial contact point. The velocity , not shown, is the temporal derivative of . (B) Schematic of the mechanical variables of contact: bending moment (), and the transverse () and axial () components of the applied force (). All variables are computed at the whisker base. (C) Examples of mechanical and kinematic variables during six manually delivered passive deflections in the anesthetized rat. Shading denotes contact episodes. The stimulations are similar but not identical to each other; this imparts a naturalistic variability to the tactile inputs. Units for and are μN; is in μN-m; is in mm; is in degrees; and is in degrees/s. (D) In the awake rat, is no longer well defined, and the relevant angle is , the angle swept out by the tangent to the whisker at its base as the whisker deflects against an object. The velocity is the temporal derivative of . The figure illustrates that , the angle between the tangent to the whisker at its base and the midsagittal plane, is not a valid kinematic variable to explain neural responses because it varies independently of contact.
Figure 3
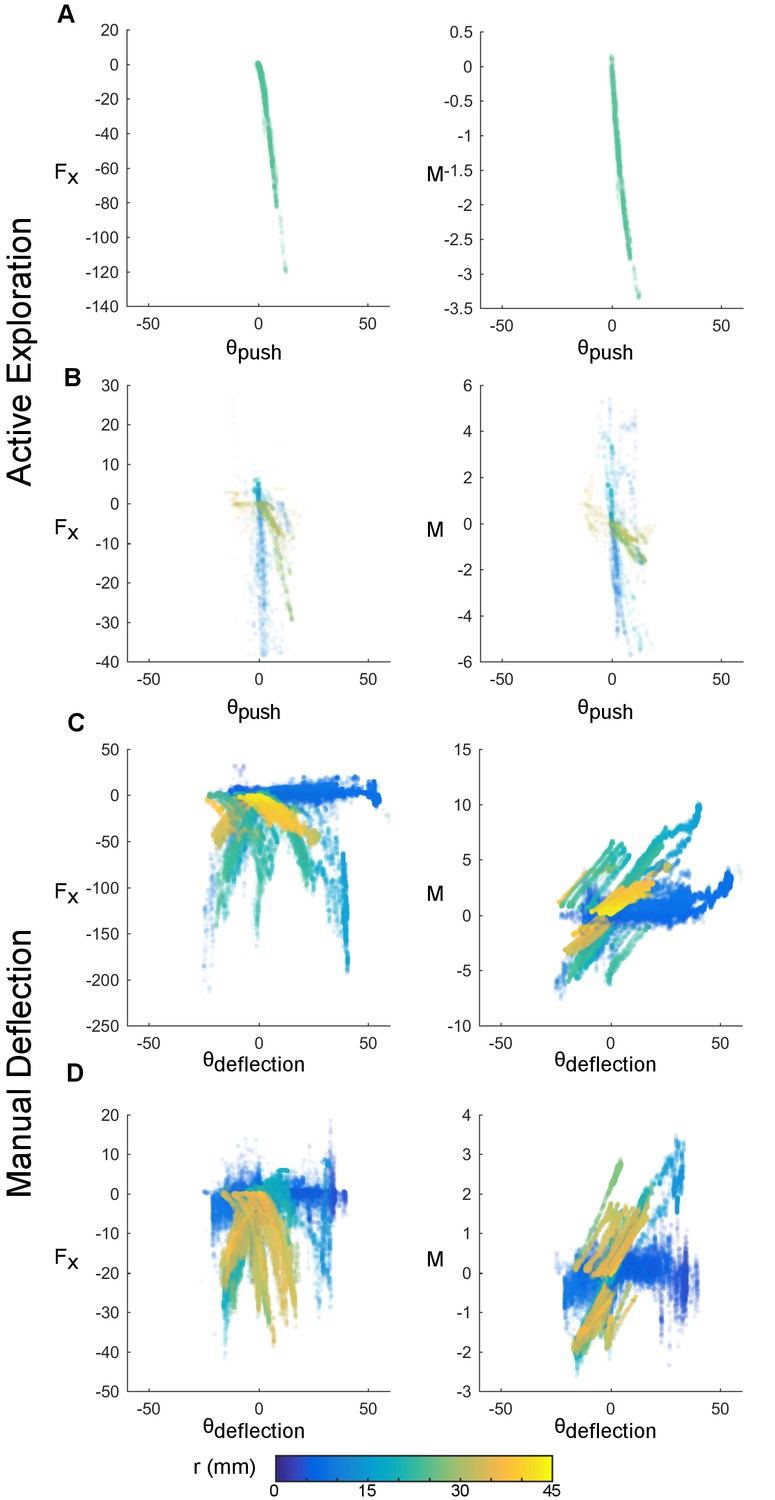
Manual stimulation reliably decouples mechanical and kinematic variables.
Mechanical and kinematic variables of contact are shown across trials of active whisking (rows A and B, whiskers C1 and Gamma respectively) and passive manual stimulation (rows C and D, whiskers B1 and D1 respectively). Awake trials were 3.02 s (A) and 12.9 s (B) in duration; passive trials were 64.67 s (C) and 114.53 s (D) in duration. Each point represents the observed mechanical and kinematic inputs for a 1 ms time bin. The x-axis depicts the angular coordinate of contact in degrees, the y-axis either the axial force (, units of μN) or moment (, units of μN-m). Color represents the radial distance of contact in mm. During manual deflection, a larger input space is sampled. The actual range spanned by the mechanical variables depends on whisker identity.
Figure 4 with 1 supplement

Optimal linear filters indicate that moment is the most important predictor of Vg neural firing.
(A) The non-linear basis of 'raised cosine bumps'. (B) Average absolute value of the GLM fit coefficients (β) across all neurons. βl refers to the coefficient of th cosine basis function, with β1 being the most recent and precise, and β5 being the most delayed and diffuse. Shading corresponds to the basis function plotted in (A). Two neurons have been omitted from this aggregate analysis because their outlying coefficients β (order ) distorted the averages reported here. (C) The linear combination of the basis functions bl plotted in (A) with the coefficients βlj obtained from the GLM fit allows us to obtain predictor specific filters αj, shown here as a function of time (truncated at 20 ms for visualization) for an example neuron. These filters quickly decay to zero, indicating that the majority of the information important to the cell is contained in the preceding few milliseconds. For the cell shown here, moment, transverse force, and angular displacement are important input signals, with moment being the most important.
Figure 4—figure supplement 1
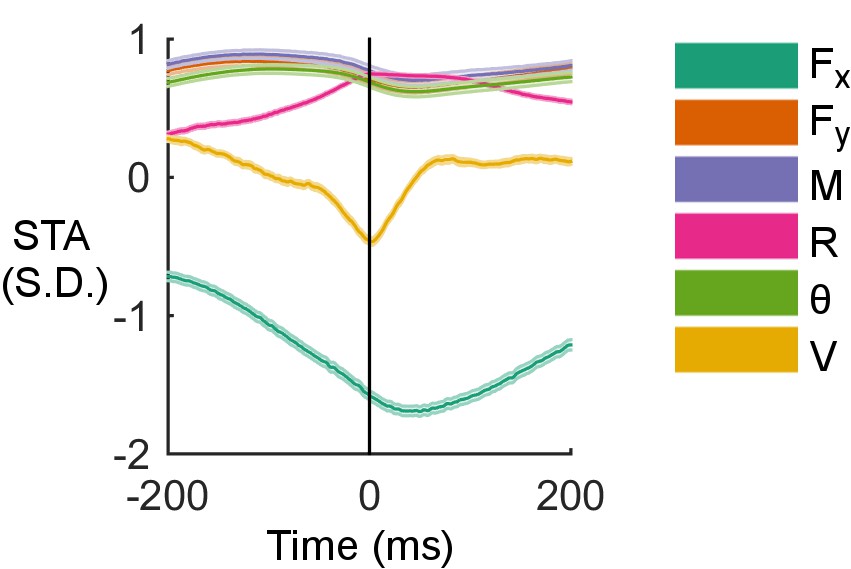
Examples of spike-triggered averages of the six input variables for the cell shown in Figure 4C.
Shaded regions are standard error of the mean, too small to be observed for most traces.
Figure 5
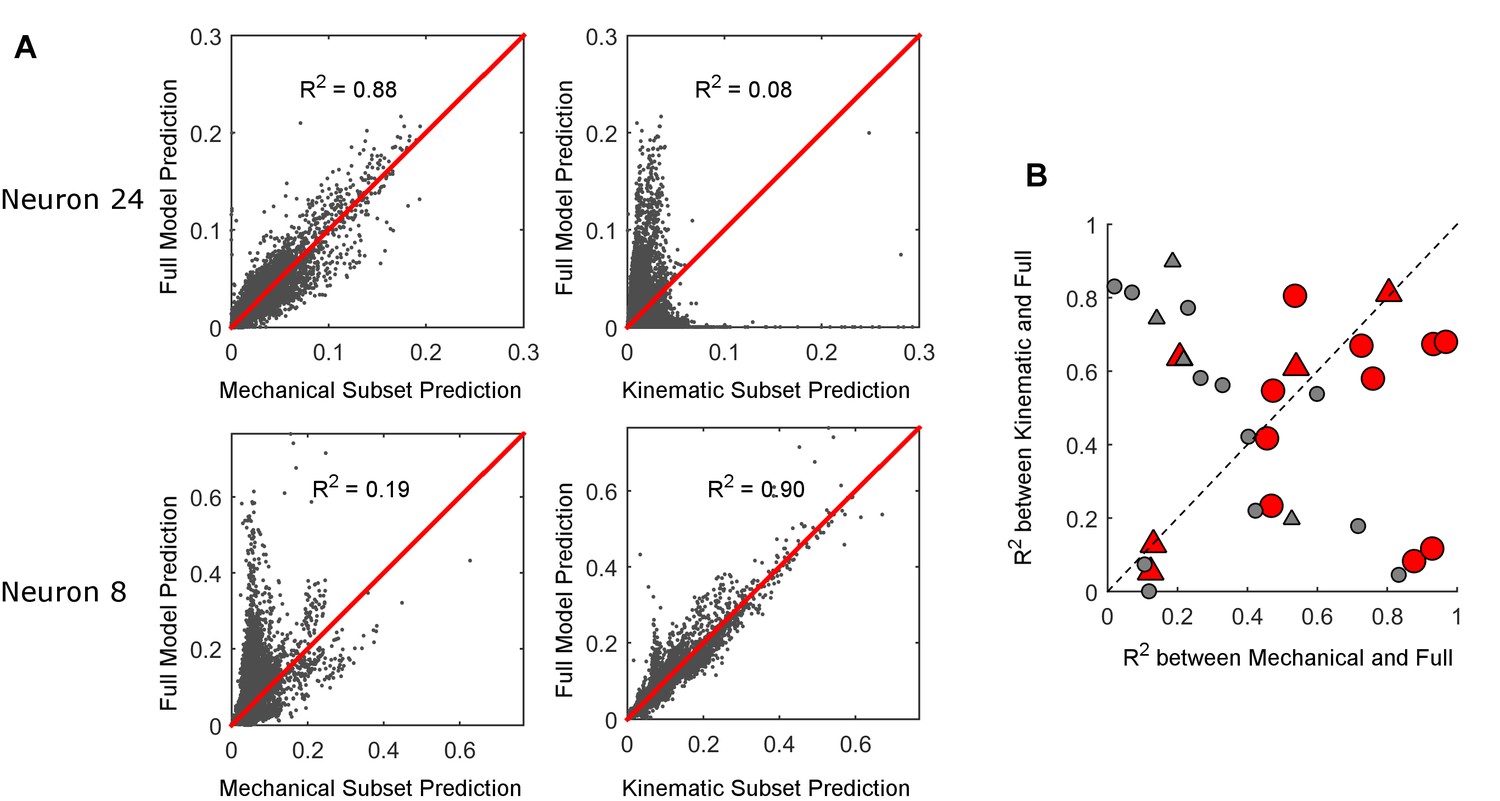
Comparison between full and subset models.
(A) The firing rate prediction of each subset model is plotted against the prediction of the full model. The predictions are probability of a spike in each 1 ms time bin. For neuron 24 in the first row, the mechanical model is well correlated with the full model and the kinematic model is not; the opposite is true for neuron 8 in the second row. (B) The R2 between the firing rate predicted by the full model and the firing rate predicted by each subset model (mechanical on the x-axis; kinematic on the y-axis). Each data point represents one neuron. The triangles represent neurons recorded during active contact; the circles represent neurons recorded during manual deflections. Red markers correspond to models that predict the cell’s spike rate better than the median accuracy (R>0.30). Gray markers indicate poor prediction accuracy (R≤0.30).
-
Figure 5—source data 1
Summary data used to create Figure 5B are reported.
Coefficients of determination calculated between the subset model predictions and the full model predictions for each recorded neuron are listed in columns B and C. Column D indicates whether the neuron was recorded in the awake or anesthetized animal. The accuracy of the full model for each neuron (Pearson Correlation Coefficient, R-value) is listed in column E.
- https://doi.org/10.7554/eLife.13969.015
Figure 6
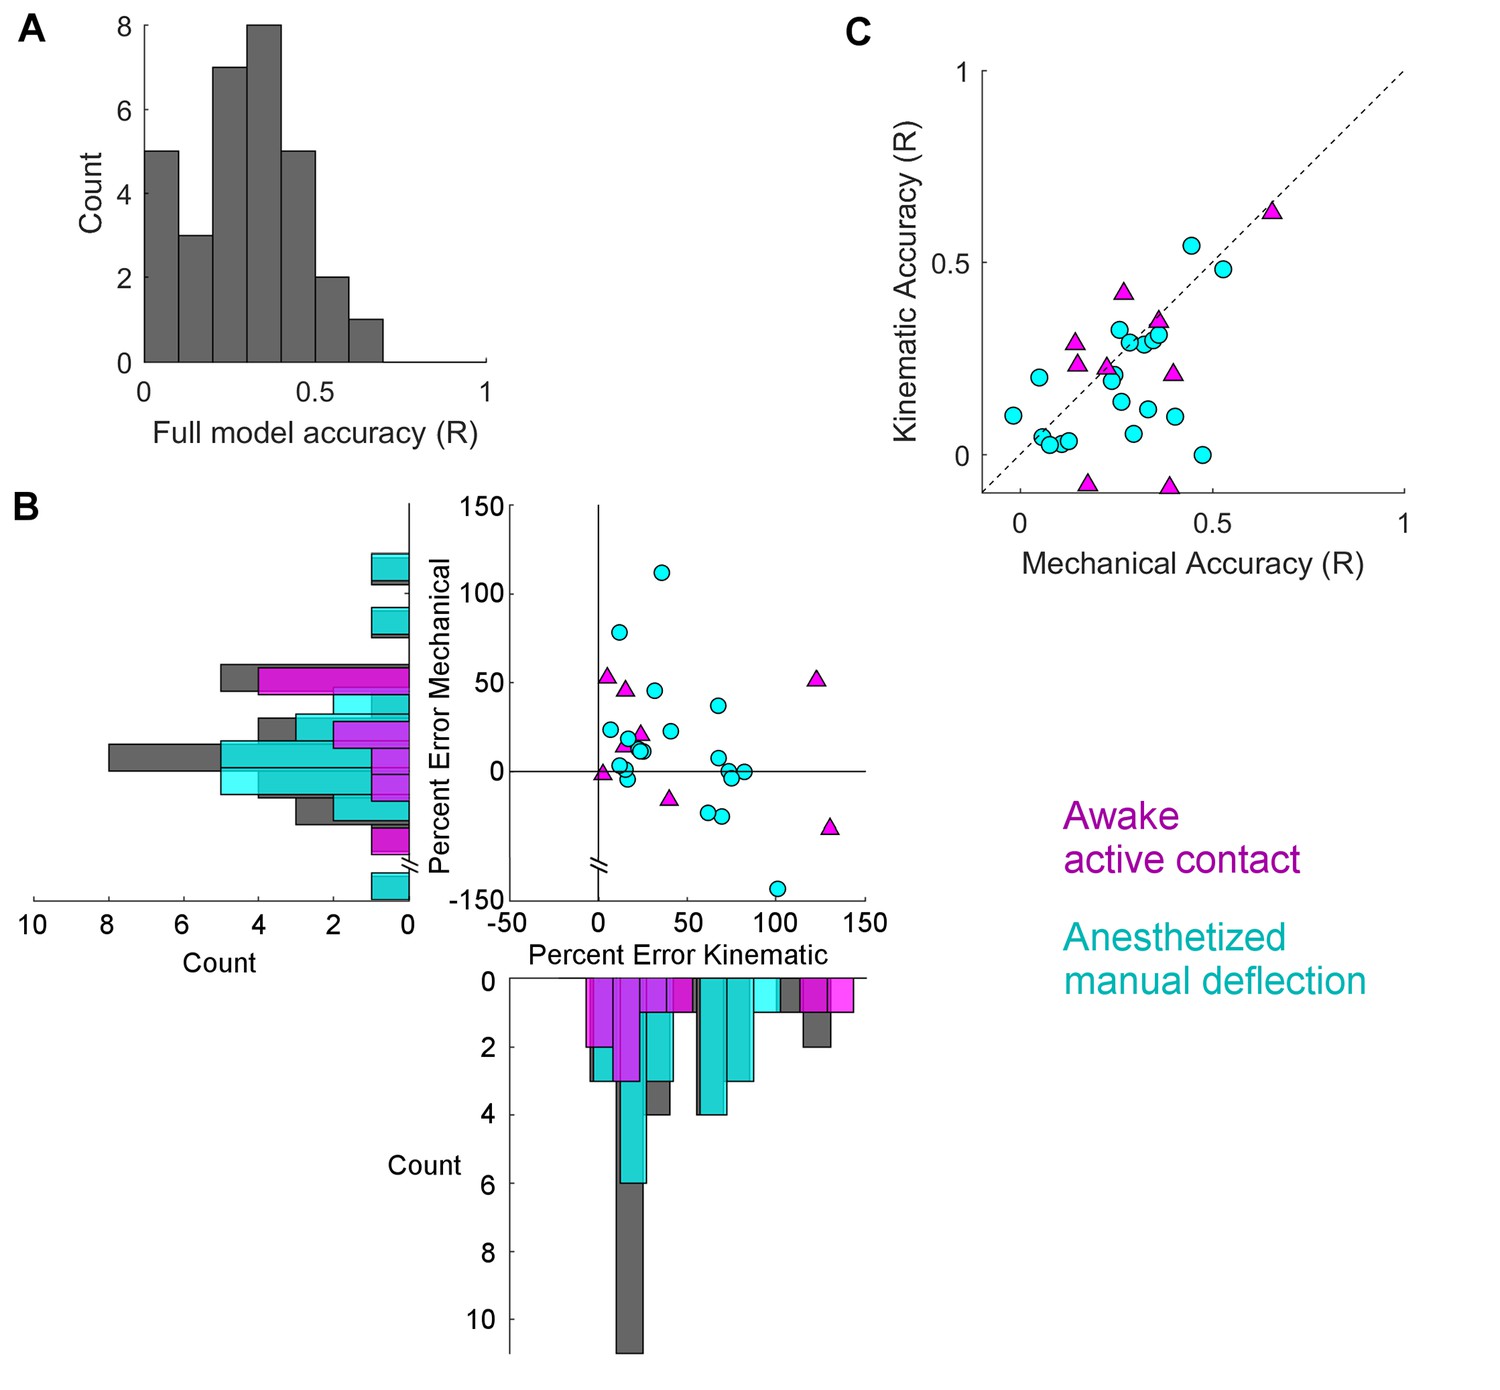
Mechanical models outperform kinematic models for manual deflections.
Pearson correlation coefficients (R) between GLM predictions and observed spike rate smoothed at 15 ms are compared between the full model and the subset models. (A) Histogram of Pearson correlations between the spike rates predicted by the full model and the observed spike rates, for all neurons. (B) Percent error between the R value for the full model and for each of the subset models is plotted for each neuron. Active contact responses are plotted as magenta triangles, manual deflections as cyan circles. Values close to zero indicate that the subset model performed almost as well as the full model; values less than zero indicate that the subset model performed better than the full model. Histograms indicate the distributions of the percent differences of each subset model for active contacts (magenta), manual deflections (cyan), and the whole population (gray). For the data shown here (see text), results for the subset model trained on mechanical data are significantly closer to zero for manual deflections but not for active contacts. (C) The R values for the two subset models are plotted against each other. Points that lie below the diagonal indicate that the mechanical model better predicted the spike rate than the kinematic model. Color and marker scheme same as in (B).
-
Figure 6—source data 1
Summary data used to create Figure 6 are reported.
The accuracies (Pearson Correlation Coefficient, R-value) of the full models, the mechanical models, and the kinematic models for each cell are listed in columns B,C, and D respectively. Column E indicates whether the neuron was recorded in the awake or anesthetized animal.
- https://doi.org/10.7554/eLife.13969.017
Videos
Video 1
Comparison of active whisking with passive, manual deflection.
Two seconds of high speed video (A) as an awake, body restrained rat whisks against a peg, and (B) as the whisker is passively deflected using manual stimulation in the anesthetized animal. Videos are slowed by factors of ~16 and ~15, respectively.
Video 2
3D visualization of mechanical and kinematic relationships for one neuron recorded in the awake animal.
Rotating view of inputs to the neuron shown in Figure 3A, active exploration. Radial distance is represented along the third axis.
Video 3
3D visualization of mechanical and kinematic relationships for a second neuron recorded in the awake animal.
Rotating view of inputs to the neuron shown in Figure 3B, active exploration. Radial distance is represented along the third axis.
Video 4
3D visualization of mechanical and kinematic relationships for one neuron recorded in the anesthetized animal.
Rotating view of inputs to the neuron shown in Figure 3C, manual deflection. Radial distance is represented along the third axis.
Video 5
3D visualization of mechanical and kinematic relationships for a second neuron recorded in the anesthetized animal.
Rotating view of inputs to the neuron shown in Figure 3D, manual deflection. Radial distance is represented along the third axis.
Video 6
Comparison of distal and proximal contact in the anesthetized rat.
High speed video of distal and proximal contacts (3 s per clip, slowed by a factor of ~5) highlights the movement of the follicle relative to the skin when contact is made close to the whisker base.
Download links
A two-part list of links to download the article, or parts of the article, in various formats.
Downloads (link to download the article as PDF)
Open citations (links to open the citations from this article in various online reference manager services)
Cite this article (links to download the citations from this article in formats compatible with various reference manager tools)
Decoupling kinematics and mechanics reveals coding properties of trigeminal ganglion neurons in the rat vibrissal system
eLife 5:e13969.
https://doi.org/10.7554/eLife.13969


