Notch1 regulated autophagy controls survival and suppressor activity of activated murine T-regulatory cells
- National Centre for Biological Sciences, India
- Manipal University, India
- Institute for Stem Cell Biology & Regenerative Medicine, India
Figures
Figure 1 with 1 supplement

Autophagy is activated on cytokine withdrawal in activated Tregs.
(A) Immunoblots probed for LC3 in lysates of Tregs at onset (T0) and after 6 hr culture without IL-2. The values below are densitometry analysis of LC3II relative to tubulin. (B) Z-projected confocal images of Tregs at onset (T0) and cultured without IL-2 for times indicated and stained for LC3 (green) and Hoechst 33342 (blue). Change in fluorescence intensities for LC3 relative to T0 are plotted. (n=150 cells/time point). (C) Immunoblot probed for ATG5 in lysates of Tregs cultured as described in A. (D−F) Apoptotic damage following 15 hr of IL-2 withdrawal in Tregs cultured in the presence of Bafilomycin (Baf) or 3-MA (D) or transduced with shRNA specific for VPS34 (E) or ATG7 (F) or a scrambled control (Scr). Immunoblots of scrambled and shRNA transfected cells are shown below. Data shown are the mean ± SD from at least 3 independent experiments, *p<0.03. Scale bar 5 μm. This figure is accompanied by Figure 1—figure supplement 1.
Figure 1—figure supplement 1
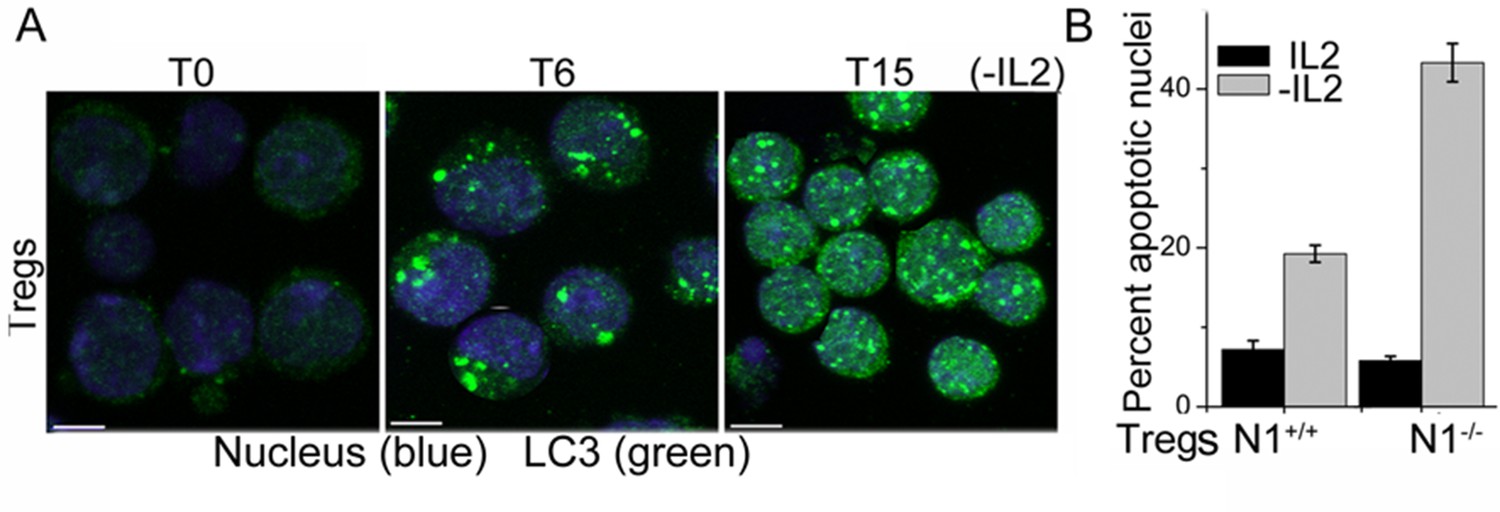
Tregs activate autophagy in response to cytokine deprivation.
(A) Z-projected confocal field views of activated Tregs cultured without IL-2 for T6 and T15 hr and input populations (T0) fixed, permeabilized and stained for LC3 (green) and Hoechst 33342 (blue). (B) Apoptotic damage induced activated WT or Notch1-/- Tregs cultured with or without IL-2. Scale bar 5 μm.
Figure 2 with 1 supplement
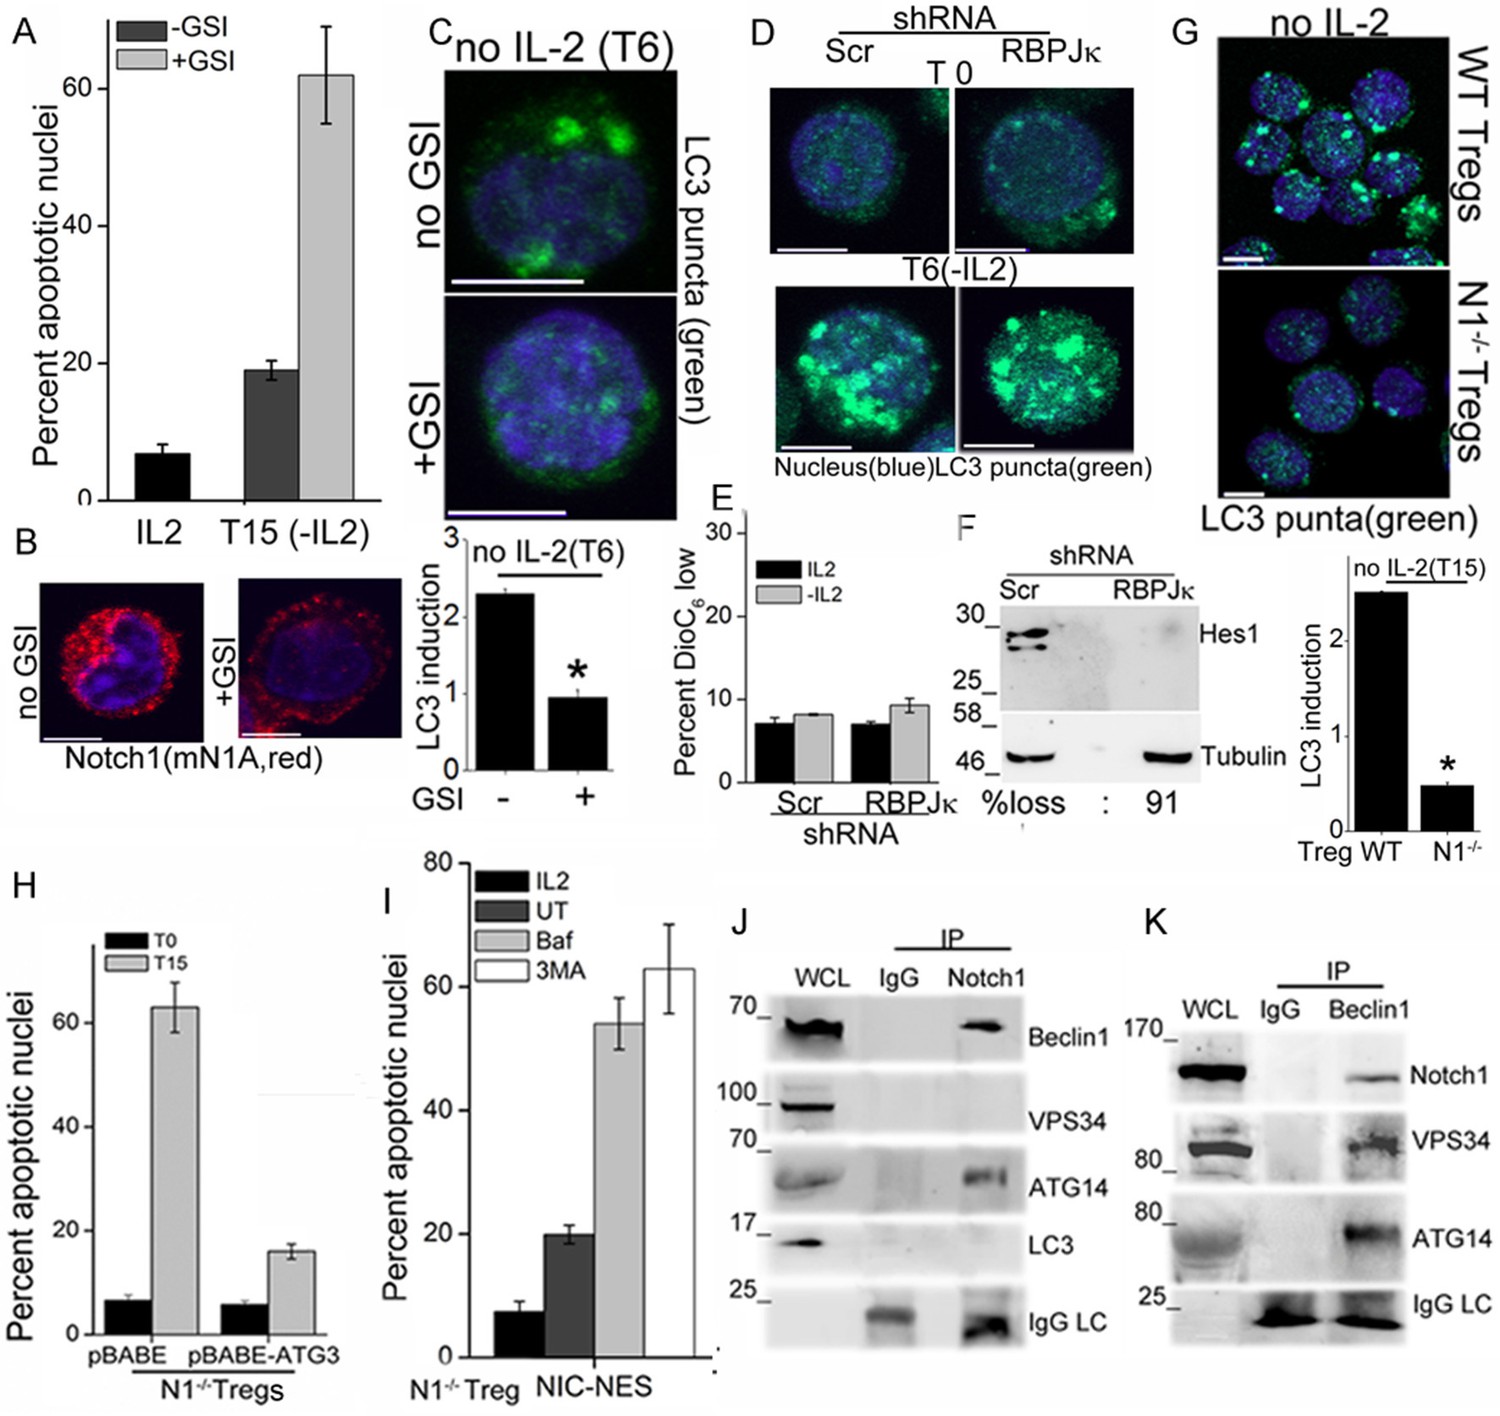
Notch regulates induction of autophagy in Tregs.
(A) Apoptotic damage in Tregs cultured for 15 hr without IL-2, with or without GSI. (B) Representative images of Tregs cultured without IL-2, with or without GSI-X for 6 hr, stained for NIC (mNIA, red) and Hoechst 33342 (blue). (C) Representative, Z-projected images of Tregs treated as in (B) for 6 hr and stained for LC3 and Hoechst 33342. Plot below indicates the change in fluorescence intensities of LC3 relative to T0 (mean +/- SD, n=120 cell/ condition). (D) Tregs transduced with shRNA to RBPJκ or scrambled control, cultured without and with IL-2 for 6 hr and stained for LC3 and Hoechst 33342. (E) DiOC6 uptake in cells transduced with shRNA to RBPJκ or scrambled control and cultured with and without IL-2 for 6 hr. (F) Immunoblot analysis for Hes1 and tubulin in cells expressing control or RBPJκ shRNA. (G) Z-projected confocal images of wildtype (WT) or Notch1-/- Tregs, cultured without IL-2 for 15 hr and stained for LC3 and Hoechst 33342. Plot below indicates the change in fluorescence intensities of LC3 relative to T0 (mean +/- SD, n=120 cell/ condition). (H) Apoptotic damage measured in Notch1-/- Tregs transduced with recombinant ATG3 or pBABE vector control, at onset (T0) or after culture without IL-2 for 15 hr. (I) Notch1-/- Tregs transduced with NIC-NES cultured for 15 hr in the conditions indicated and scored for apoptotic damage. (J) and (K) Immune complexes precipitated from Treg lysates using indicated (IP) antibodies. Immunoblots were probed for proteins indicated on the right. Data show the mean ± SD of at least 3 independent experiments. In all micrographs, LC3 staining is in green and Hoechst 33342 in blue. Scale bar: 5 μm; *p≤0.03 This figure is accompanied by Figure 2—figure supplement 1.
Figure 2—figure supplement 1
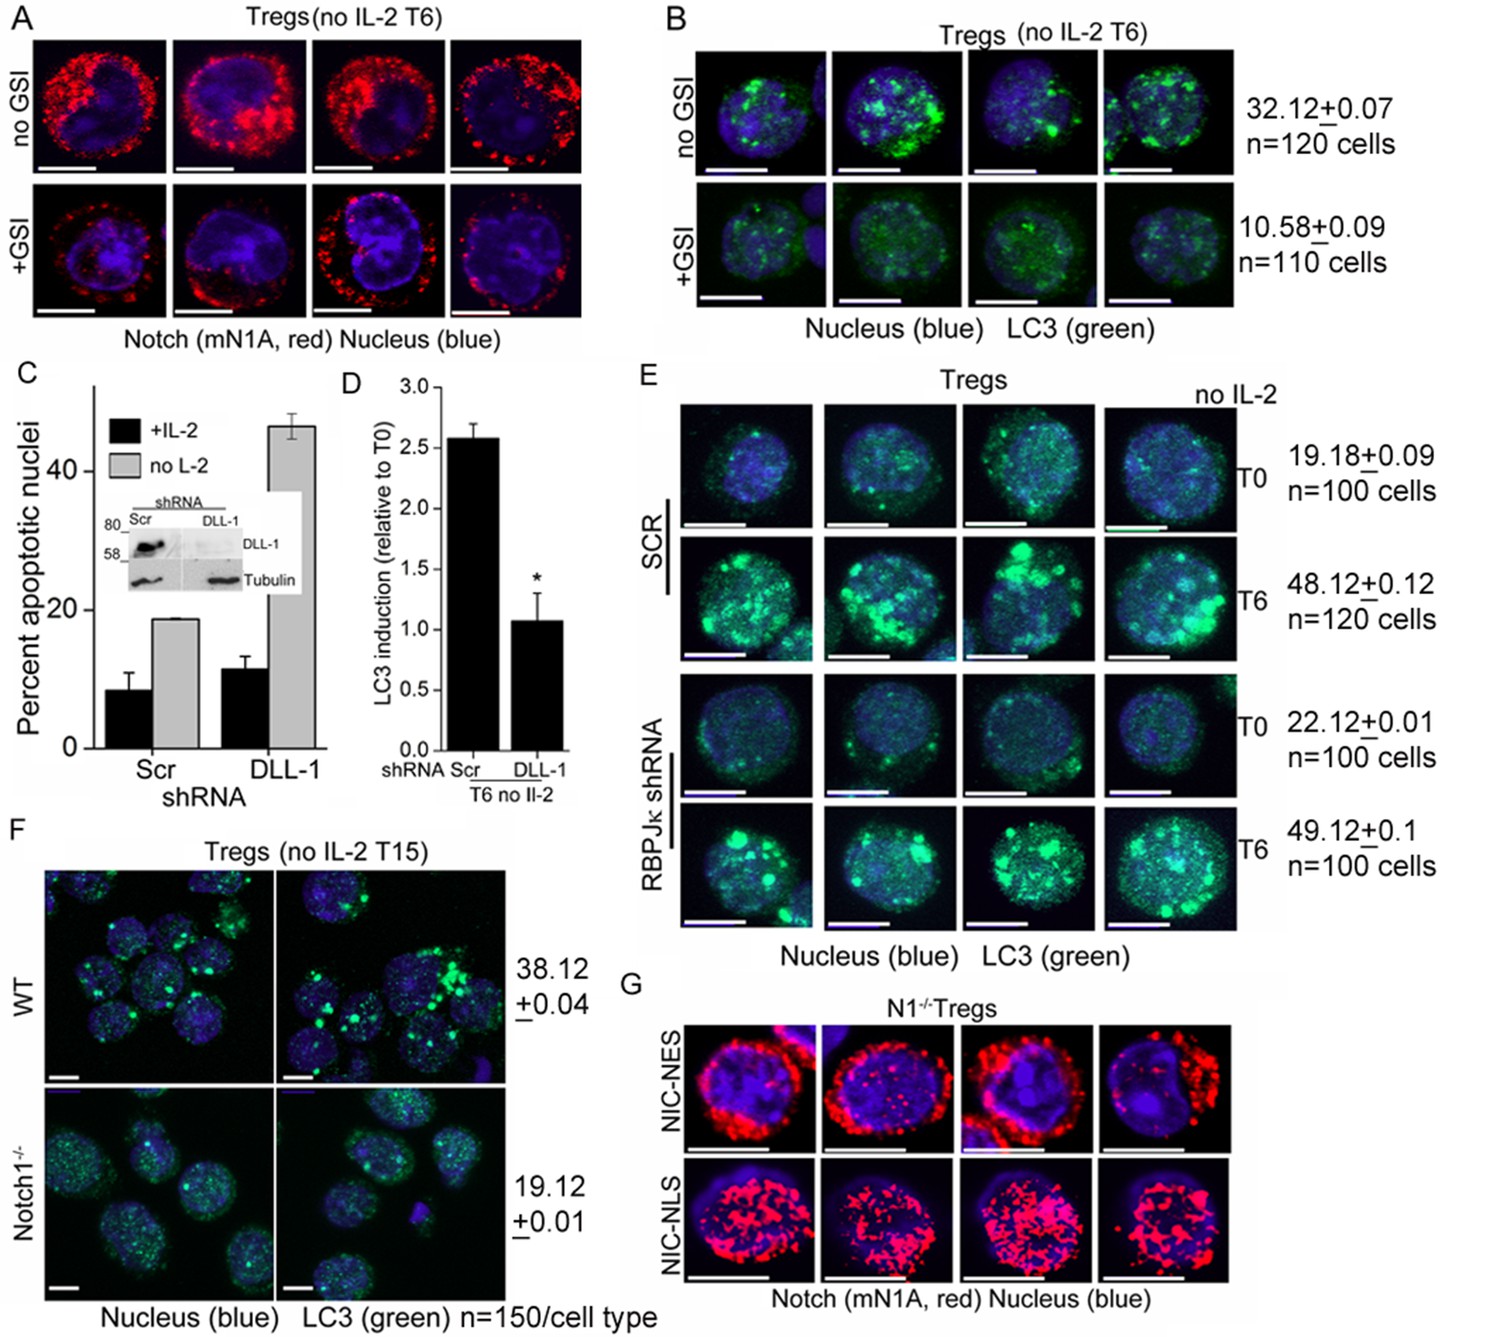
Notch1 signaling from the cytoplasm is needed for autophagy induction in Tregs.
(A) Montage of confocal images (central stack) of Tregs cultured without IL-2 for 6 hr in the absence (upper panel) or presence (lower panel) of GSI-X and then immune-stained for NIC (clone mNIA) and counterstained with Hoechst 33342 (nucleus). (B) Z-projected confocal images of Tregs cultured without IL-2 for 6 hr in the absence (upper panel) or presence (lower panel) of GSI-X. Cells were stained with an antibody to LC3 (green) and counterstained with Hoechst 33342 (blue) and imaged. Numbers indicate pixel intensities and cells analysed. (C) Apoptotic damage at 15 hr following culture without IL-2 in Tregs transduced with scrambled or DLL-1 specific shRNA, followed by antibiotic selection for transfected cells. (D) Change in fluorescence intensities for LC3, relative to T0 (onset of experiment) in Tregs transduced with scrambled or DLL-1 specific shRNA measured 6 hr after IL-2 withdrawal. N=120cells/time point, *p</= 0.03. (E) Z-projected confocal images of Tregs cultured without IL-2 for 6 hr following retroviral transfection with scrambled (SCR) or RBPJ-κ specific shRNA, followed by antibiotic selection for transfected cells. Cells were stained with an antibody to LC3 (green) and counterstained with Hoechst 33342 (blue) and imaged. Numbers indicate pixel intensities and cells analysed. (F) Z-projected confocal field views of images of WT or Notch1-/- Tregs cultured without IL-2 for 15 hr and stained for LC3 (green) and Hoechst33342 (blue). Numbers indicate pixel intensities and cells analysed. (G) Representative images showing activated Notch1-/- Tregs are retrovirally transduced with recombinant NIC-NES (upper panel) or NIC-NLS (lower panel) and stained for Notch using the mN1A antibody clone (red). Cells were counterstained with Hoechst 33342 (blue). Scale bar 5 μm.
Figure 3 with 1 supplement

Notch regulates mitochondrial organization via autophagy.
(A) DiOC6 uptake in activated Tregs in the input population at onset of the assay (T0) or in cells cultured without cytokine for 8 hr with or without 10 μM GSI (Data are plotted to show Mean ± SD, p**</=0.001). (B-G) Representative confocal (Z-projected) images of mitochondria stained with MitoTracker Green in WT Tregs cultured for 6 hr in the following conditions: with or without IL-2 (B), post retroviral transfection of DLL-1 shRNA +/- IL-2 (C); or transfection of Notch1 shRNA +/- IL-2 (D); no IL-2+GSI (E) no IL-2 + Baf (F) or post retroviral transfection of shRNA to Atg7 +/- IL-2 (G). F and G, percent DiOC6-high (live) WT and Notch1-/- Tregs at T0 (F) or 15 hr after culture without IL-2 (G). Mean ± SD from 3 separate experiments. (H) DiOC6 fluorescence in activated Notch1-/- and control Notch1+/+ Tregs in the input population at the onset of the assay (T0) or in cells cultured without cytokine for 15 hr. (Mean ± SD, p*</=0.03). (I) FRAP analysis in MitoTracker Green loaded WT or Notch1-/- Tregs (n=10 cells/ cell type, scale bar 2 μm) at T0. Inset: mitochondria in Notch1-/- Tregs cultured for 6 hr with or without IL-2. (J and K) Representative confocal images (at 6 hr) of mitochondria loaded with MitoTracker Green in Notch1-/- Tregs transfected with Atg3 or empty vector (pBABE), cultured with or without IL-2 (J) or Notch1-/- Tregs transfected with NIC-NES or empty vector (pBABE) in IL-2 (K). Images are representative of n=20 cells per experimental group from 2–3 experiments, scale bar 5 μm. This figure is accompanied by Figure 3—figure supplement 1
Figure 3—figure supplement 1
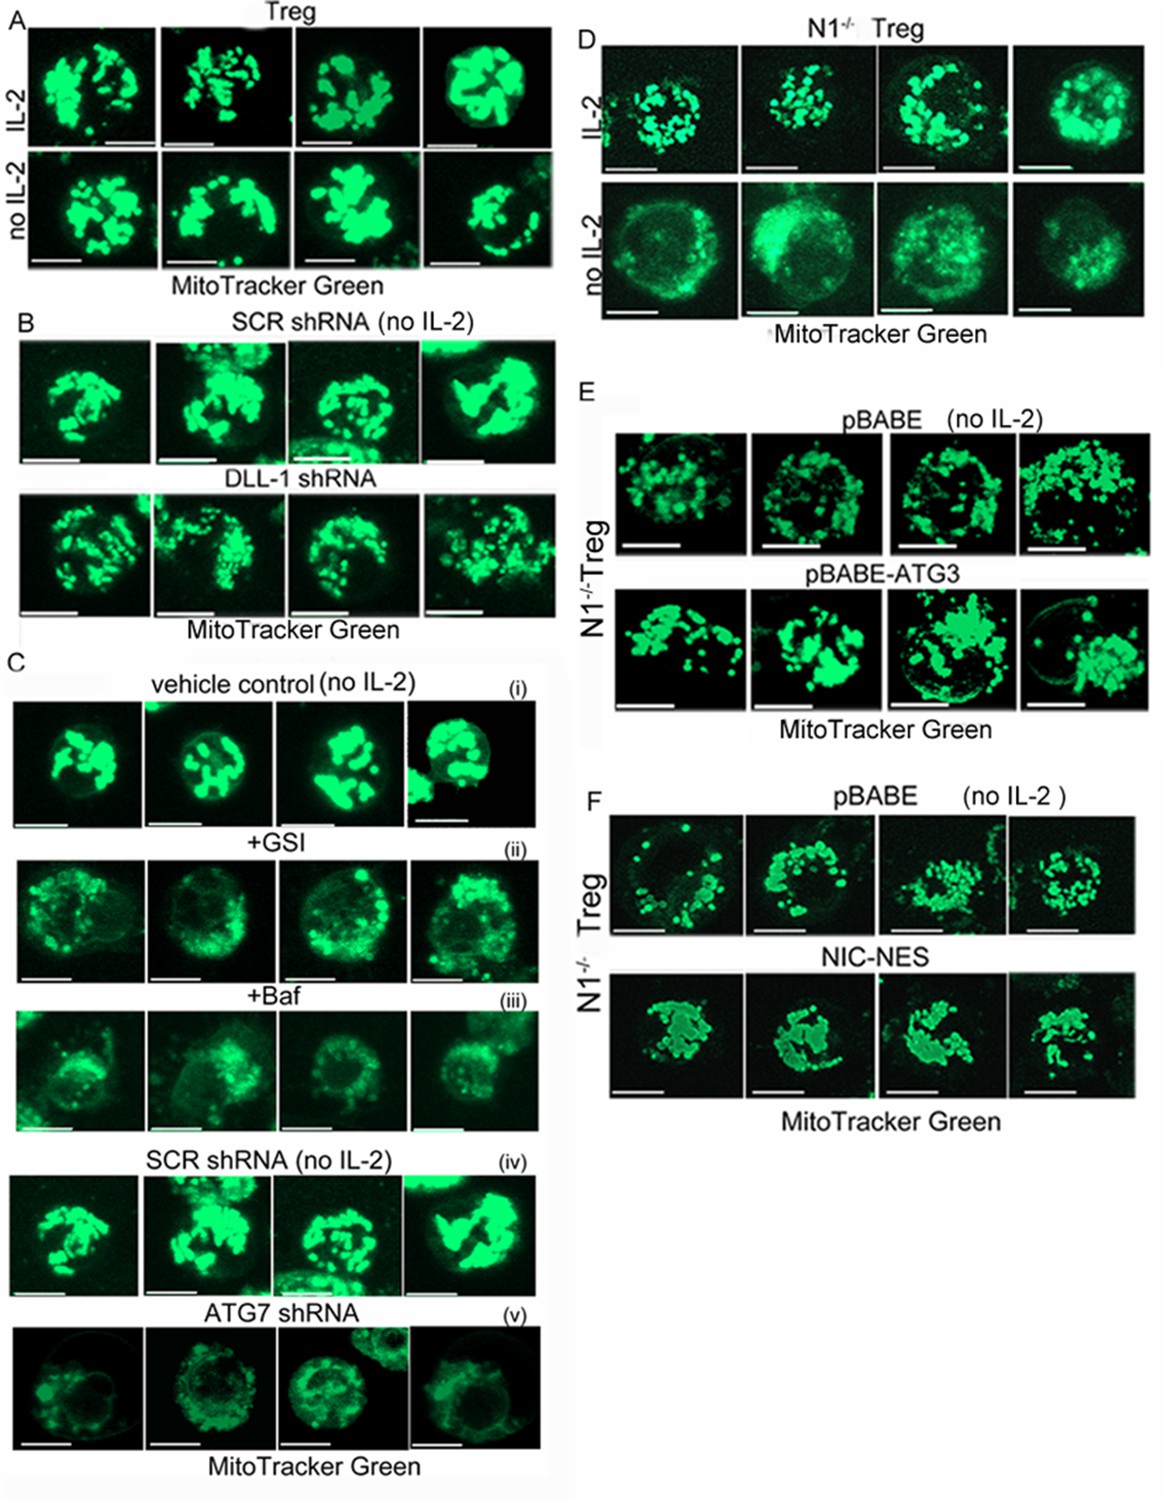
Notch1 regulation of mitochondrial organisation is mediated via autophagy.
(A–C) Representative confocal (Z-projected) images of mitochondria stained with MitoTracker Green in activated WT Tregs cultured in the following conditions: with or without IL-2 for 6 hr (A), with IL-2 for 6 hr post retroviral transfection of scrambled or DLL-1 specific shRNA (B); untreated or transfected with scrambled shRNA cultured without IL-2 (i and ii), without IL-2+GSI (iii), without IL-2 +Baf (iv) or without IL-2 post retroviral transfection of shRNA to Atg7 (v) for 6 hr (C). (D–E) Montages showing confocal (Z-projected) images of mitochondria stained with MitoTracker Green in activated Notch1-/- Tregs cultured in the following conditions: with or without IL-2 (D) or transduced with empty vector (pBABE) or recombinant ATG3 (E) or NIC-NES (F). In E and F cells were maintained in IL-2. Scale bar 5 μm.
Figure 4 with 1 supplement
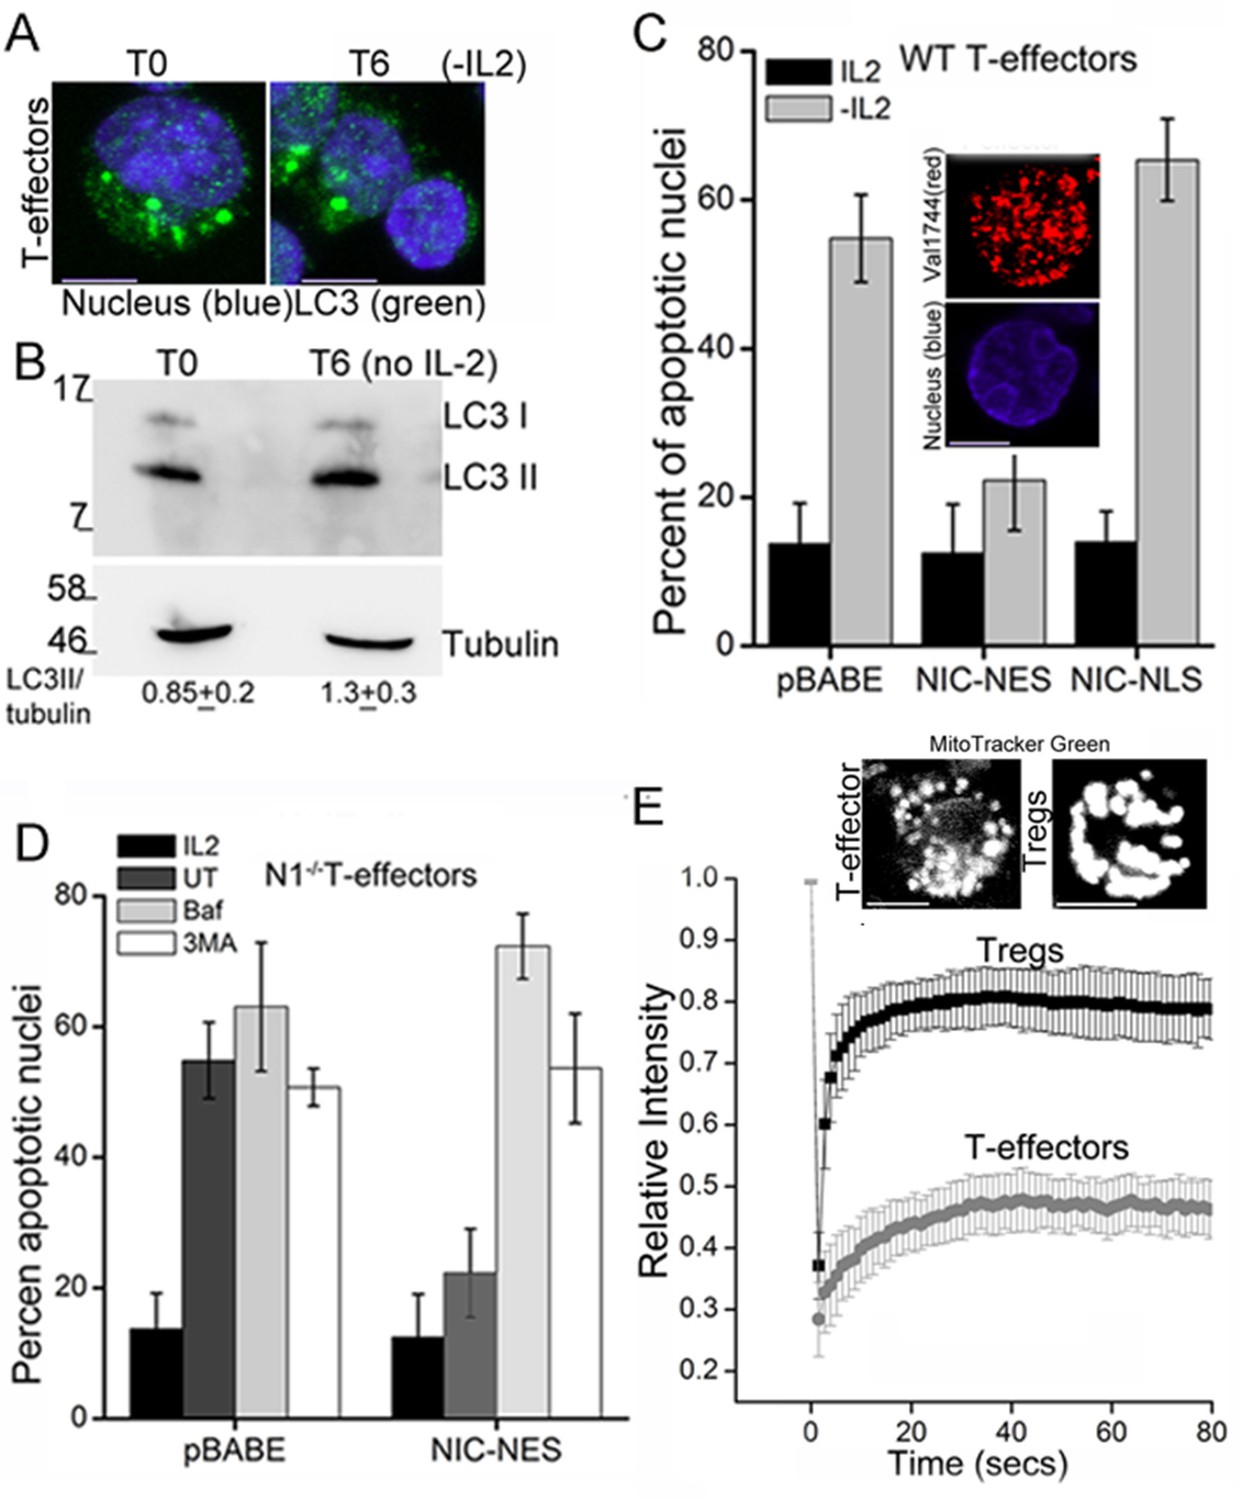
NIC-NES rescues cell death via autophagy in T-effectors.
(A) Z-projected confocal images of T-effectors stained for LC3 (green) and Hoechst 33342 (blue) at onset of assay (T0) or following culture without IL-2 for 6 hr. (B) Immunoblots probed for LC3 in lysates of T-effectors at T0 and cultured without IL-2 for 6 hr. The values indicate densitometry analysis of LC3II relative to tubulin. (C) Apoptotic damage induced by IL-2 withdrawal in T-effectors expressing NIC-NES, NIC-NLS or pBABE cultured in the presence or absence of IL-2. Inset: Representative image of a T-effector stained with Val1744 antibody to detect endogenous Notch (red) and counterstained with Hoechst 33342 (blue). (D) Apoptotic damage in Notch1-/- T-effectors expressing NIC-NES or pBABE cultured with IL-2 (black), without IL-2 (grey) and the addition of Baf (light grey) or 3-MA (white) for 15 hr. (E) FRAP analysis in Tregs and T-effectors loaded with MitoTracker Green at T0 (n=10 cells/ cell type, scale bar 2 μm). Inset above, representative images of MitoTracker Green loaded cells visualized by confocal microscopy. Data shown are the mean ± SD from 3 independent experiments. Scale bar 5 μm. This figure is accompanied by Figure 4—figure supplement 1
Figure 4—figure supplement 1
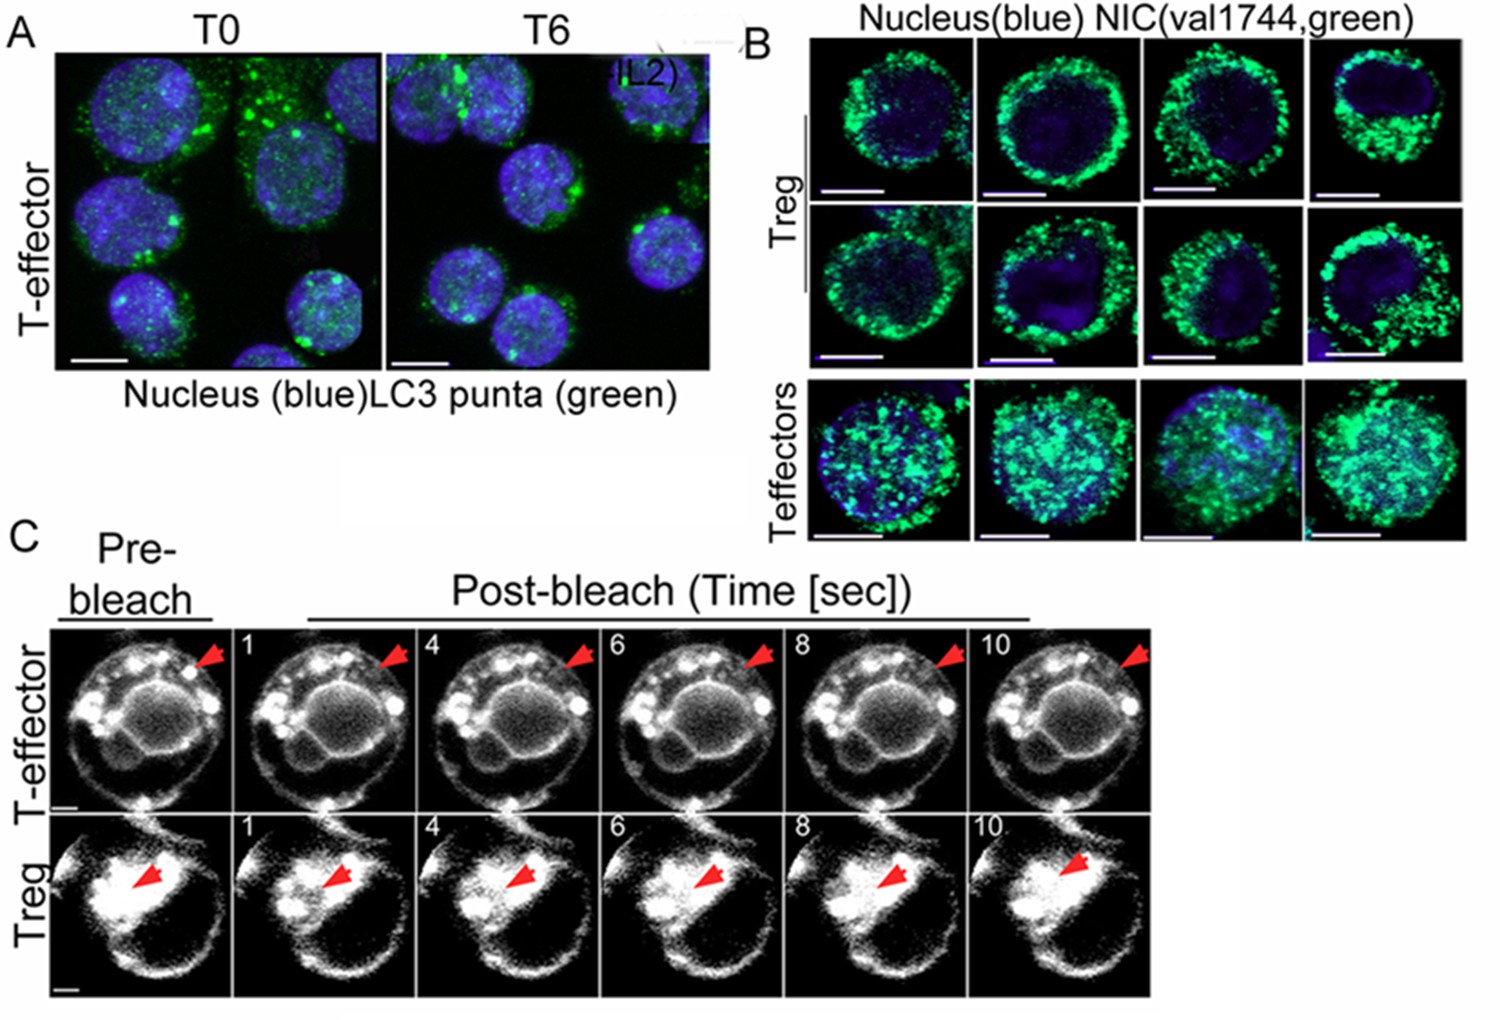
Non-nuclear Notch1 dependent survival is mediated by autophagy in T-effectors.
(A) Representative Z-projected confocal field views of T-effectors input populations (T0) or cultured without IL-2 for 6 hr and stained for LC3 (green) and Hoechst 33342 (nucleus, blue). (B) Representative confocal images (central stack) of activated Tregs or T-effectors immune-stained for NIC with Val 1744 and counterstained with Hoechst 33342 (nucleus). (C) Montage showing time-lapse images of one Treg and one T-effector used in the FRAP analysis plotted in the main figure. The red arrow indicates the bleach spot, scale bar 2 μm.
Figure 5 with 1 supplement
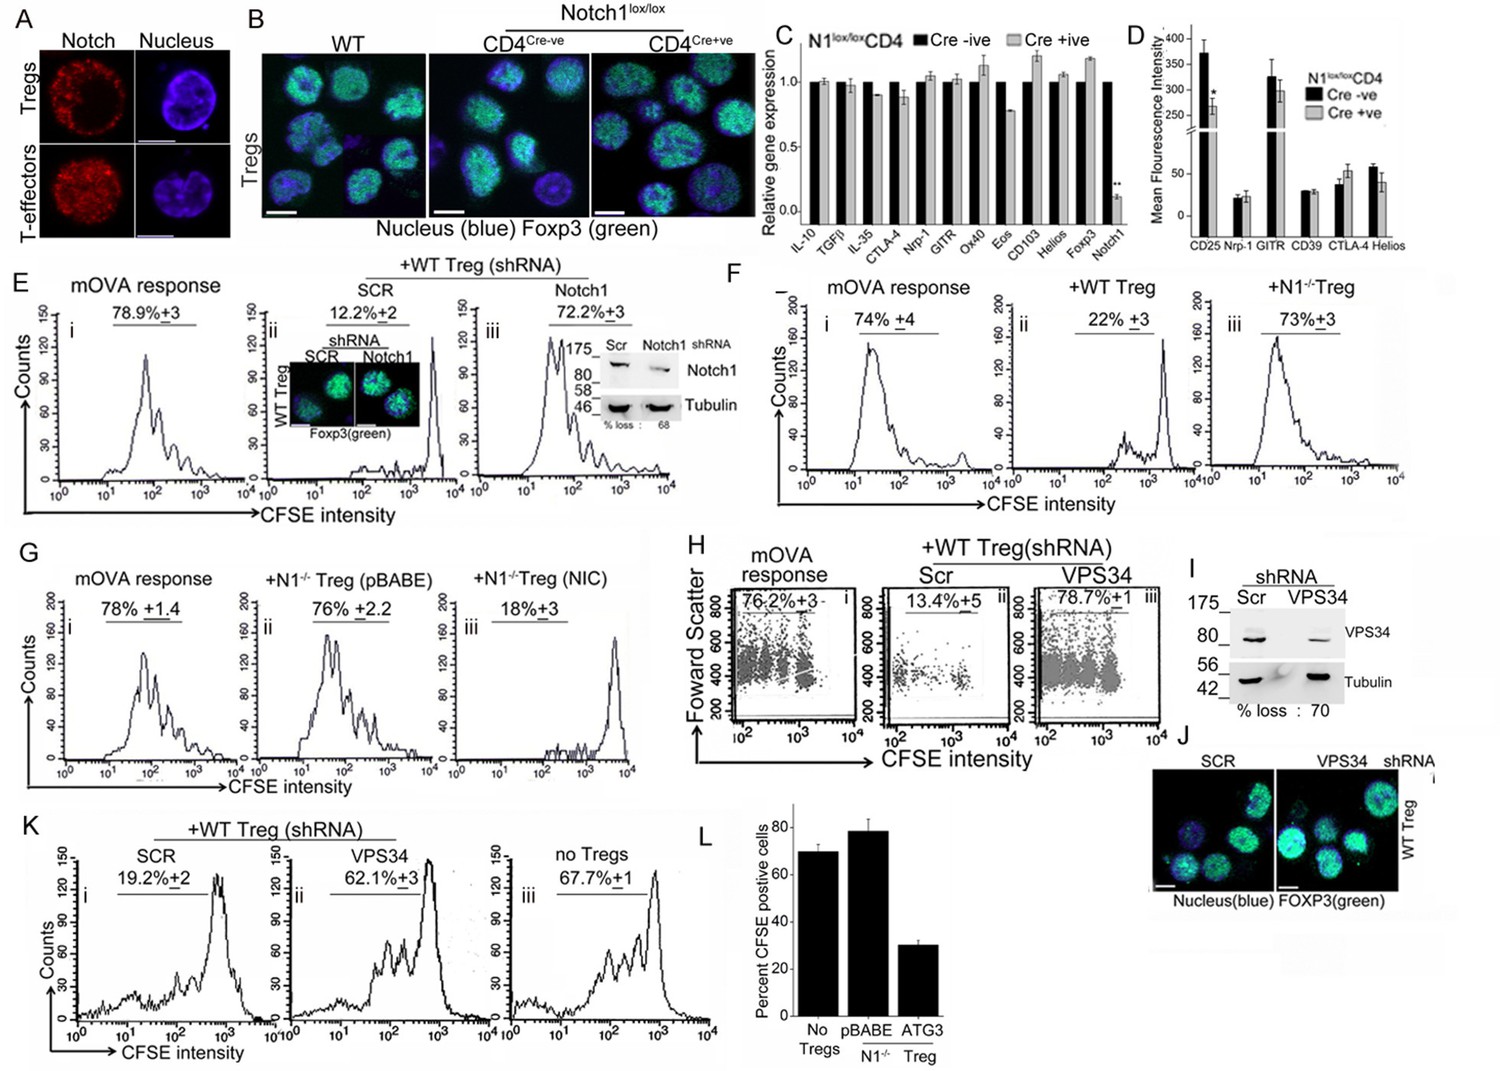
Notch activity and autophagy regulate Treg suppressor function.
(A) Representative, confocal images (central stack) of activated Tregs (upper panel), or T-effectors (lower panel) immune-stained for NIC (red) and Hoechst 33342 (blue). N: 15–20 cells/experiment. (B) Representative confocal (central stack) field views of activated Tregs immune-stained for Foxp3 (green) and Hoechst 33342 (blue). Tregs were derived from C57Bl/6 (wildtype, WT) or Cre negative (Cre-ve) or Cd4-Cre::Notch1lox/lox (Cre+ve) mice. (C) Real Time PCR quantification of genes enriched in Tregs, comparing activated Tregs from Cd4-Cre::Notch1lox/lox (open bars) and genetic control Cre-ive (black bars) mice. 5–6 mice are included in each group being compared. The data plotted is mean+/-SD. p**</=0.001. (D) Flowcytometry based expression of molecules (mean fluorescence intensity, MFI, relative to control isotype antibody shown) enriched in Treg subsets, compared in activated Tregs generated from Cre+ive (open bars) and Cre-ive (black bars) mice. 4–6 mice are included in each group. (E) Flowcytometry plots indicating dilution of CFSE in CD45.2+ (OT-II) gated cells isolated from lymph nodes of mice injected with OT-II cells alone (i) or, OT-II co-injected with Tregs transduced with scrambled (ii) or Notch1 shRNA (iii), three days after antigen challenge. Inset: (ii) confocal images of Tregs detecting Foxp3 in scrambled or Notch1 shRNA groups and (iii) immunoblot for Notch1 in shRNA treated groups. (F) Flowcytometry plots indicating dilution of CFSE in CD45.2+ (OT-II) gated cells isolated from lymph nodes of mice injected with OT-II (i) OT-II + WT Tregs (ii) or OT-II + Notch1-/- Tegs (iii) three days after antigen challenge. (G) CFSE dilutions of OT-II cells co-injected with Notch1-/- Tregs transduced with empty vector (pBABE) (ii) or recombinant NIC (iii) three days after antigen challenge. Data are representative of 2–3 independent experiments with 2–3 mice/ experimental group. Percentage of cells in the CFSE diluted group is indicated in each plot. Tregs activated in vitro are used in all experimetns. (H) Proliferation in CD4+OT-II cells alone (i), or co-injected with Tregs transduced with retroviruses expressing shRNA to VPS34 (iii) or a scrambled control (ii) post antigen challenge. (I) Confocal (merged) images of Foxp3 (green) immunostaining counterstained with Hoechst 33342 (blue). (J) immunoblot detecting VPS34 (H) in shRNA treated groups as in H. (K) Flow cytometry plots indicating CFSE dilution in naïve CD4+T-cells 72 hr post-stimulation with anti-CD3 and APC in vitro. T-cells were either cultured alone (no Tregs) or with Tregs transduced with shRNA as described in H. (L) Percent CFSE positive, CD45.2+ OT-II cells isolated from host mice isolated after antigen challenge. Host mice were injected with OT-II naïve T-cells alone (no Tregs) or, naïve cells co-injected with Notch1-/- Tregs retrovirally transduced with empty vector pBABE or recombinant ATG3. Scale bar: 5 μm. This figure is accompanied by Figure 5—figure supplement 1.
Figure 5—figure supplement 1
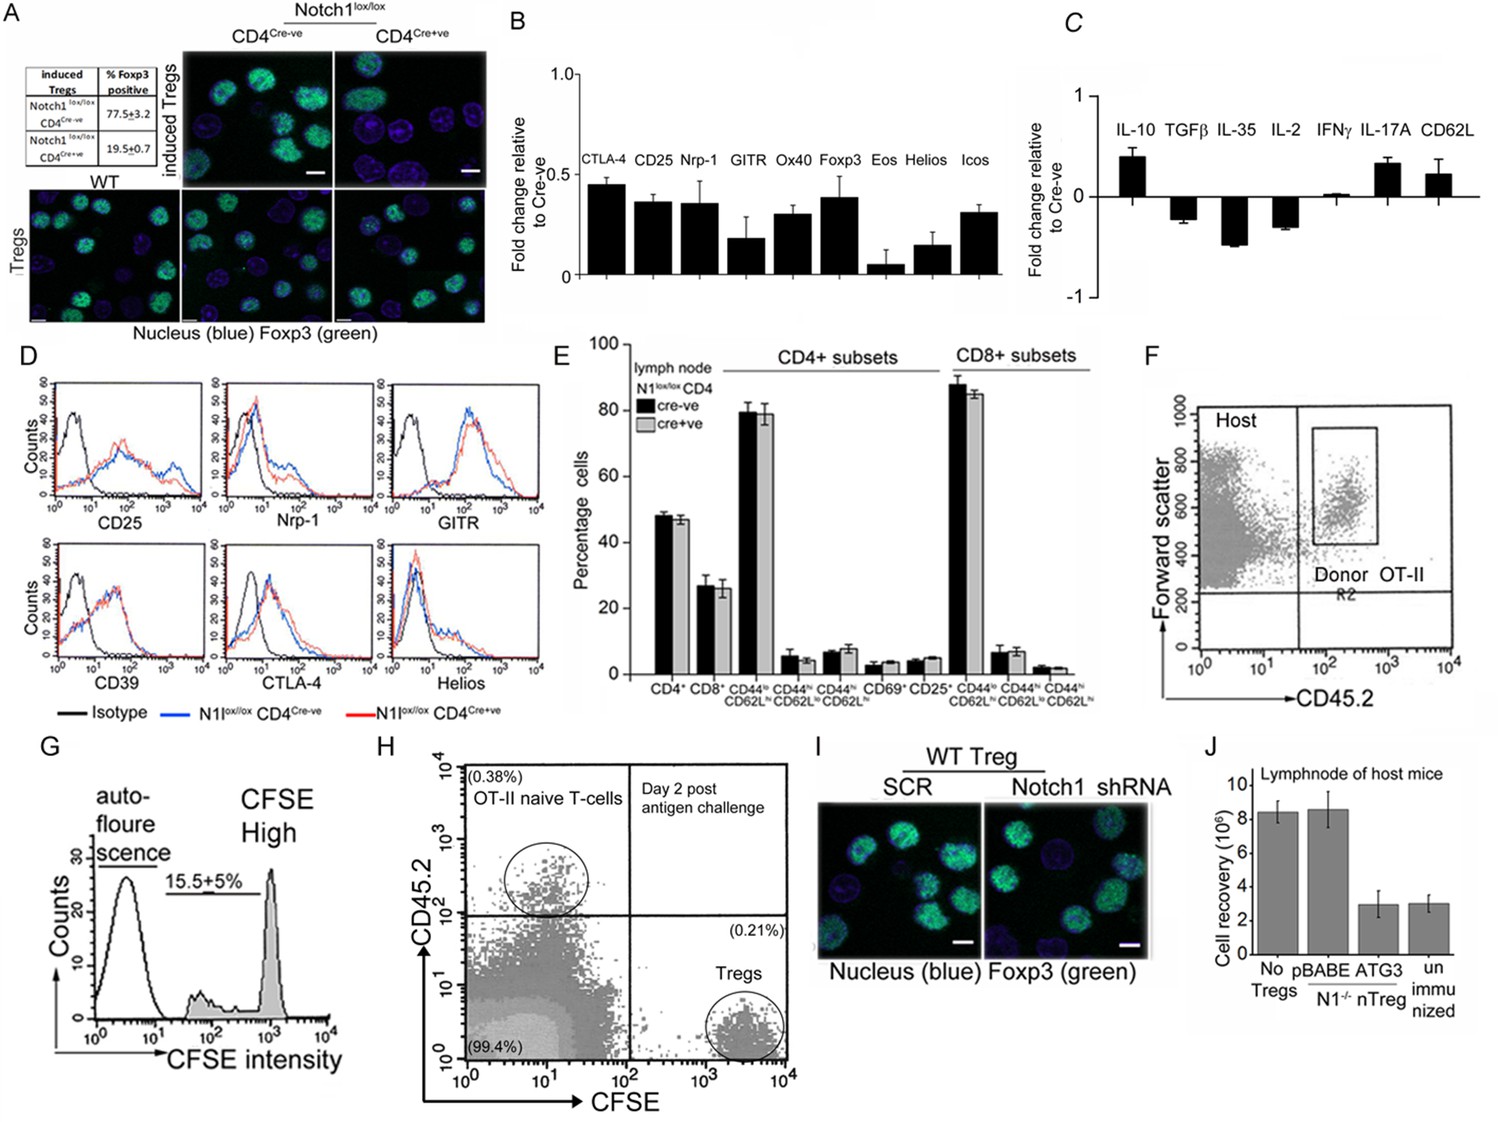
Notch1 signaling and autophagy pathway are needed for Treg function.
(A) Representative field views of induced-Tregs (upper panel) or activated Tregs (lower panel), of indicated genetic backgrounds, immune-stained for Foxp3. Inset table: Percent cells positive for Foxp3 in the different groups from multiple experiments. (B and C), Gene subsets in Notch1-/- Tregs relative to control Cre-negative Tregs, based on a microarray analysis of activated Tregs preparations (values plotted are the mean fold change ± SD). (D) Flowcytomety histogram plots for expression of different proteins in activated Tregs of these genotypes. (E) CD4+ and CD8+ T-cell subset (naïve and memory) analysis in lymph node cells isolated from 6–8 week Cd4-Cre::Notch1lox/lox and genetic (Cre negative) mice. Mean+/-SD of analysis from 6–8 mice of each genotype are shown. (F) Flow cytometry quadrant plot showing the gating of CD45.2+ donor T-cells, in the lymph nodes isolated from a CD45.1 host. Host cells are seen in the upper left quadrant. C, CD45.2+ CFSE cells isolated from lymph nodes of unimmunized host mice. The peak in the third log indicates donor cells, which are detected at high intensity. The auto-fluorescence in a CFSE unlabelled population is shown for comparison. (G) Flow cytometry plot of the analysis of lymph node cells isolated from a CD45.1 (host mouse) to detect injected CD45.2+ donor cells (upper left quadrant) and CFSE labelled Tregs (lower right quadrant). (H) A representative field view of Foxp3 staining in activated Tregs transfected with scrambled (SCR) or Notch1shRNA. (I) Plot of total cell recovery from lymph nodes of host mice 3 days post immunization. All data are representative of 2–3 independent experiments with 2–3 mice/ experimental condition.
Figure 6 with 1 supplement
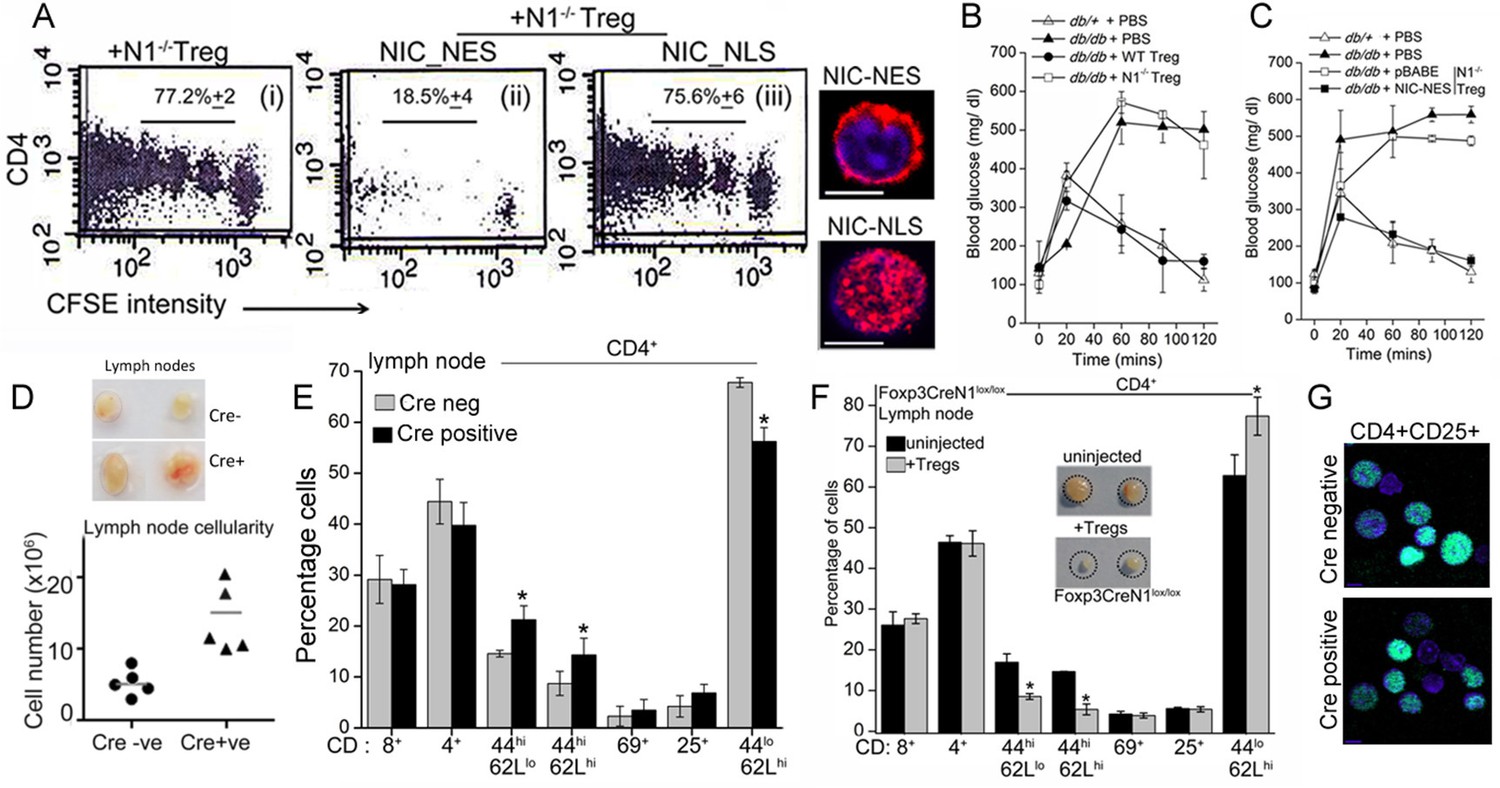
Non-nuclear NIC regulates Treg suppressor activity.
(A) Proliferation of CFSE loaded CD4+ OT-II cells co-injected with untransfected, or NIC-NES or NIC-NLS transfected Notch1-/- Tregs. The numbers indicate the percentage of the population with CFSE dilution Inset: staining for Notch1 in transfected cells. (B) IPGTT in Leprdb/+ (△) or Leprdb/db (filled ∆) mice injected intravenously with PBS (△ or▲), or WT (⬤) or Notch1-/- (□) Tregs. (C) IPGTT in Leprdb/+ (△) or Leprdb/db mice injected intravenously with Notch1-/- Tregs expressing recombinant NIC-NES (■) or pBABE (□). Data are mean ± SD of 2 independent experiments with three animals in each condition. (D) Whole lymph nodes (representative) from Cre+ and Cre- mice and plotted below, cell recoveries from lymph nodes from mice from different experiments. (E) T-cell immune cells subset analysis in lymph nodes isolated from wild type and mutant mice. (F) Subset analysis of T-cells in lymph-nodes of mutant mice, which are either not injected or injected with WT Tregs mice seven days prior to analysis. (G) Representative confocal images (field views) of activated Tregs from Cd4-Cre::Notch1lox/lox and Cre-ve mice fixed and stained for Foxp3 (green) and counterstained with Hoechst 33342 (nucleus, blue). *p≤0.03; Scale bar: 5 μm This figure is accompanied by Figure 6—figure supplement 1.
Figure 6—figure supplement 1
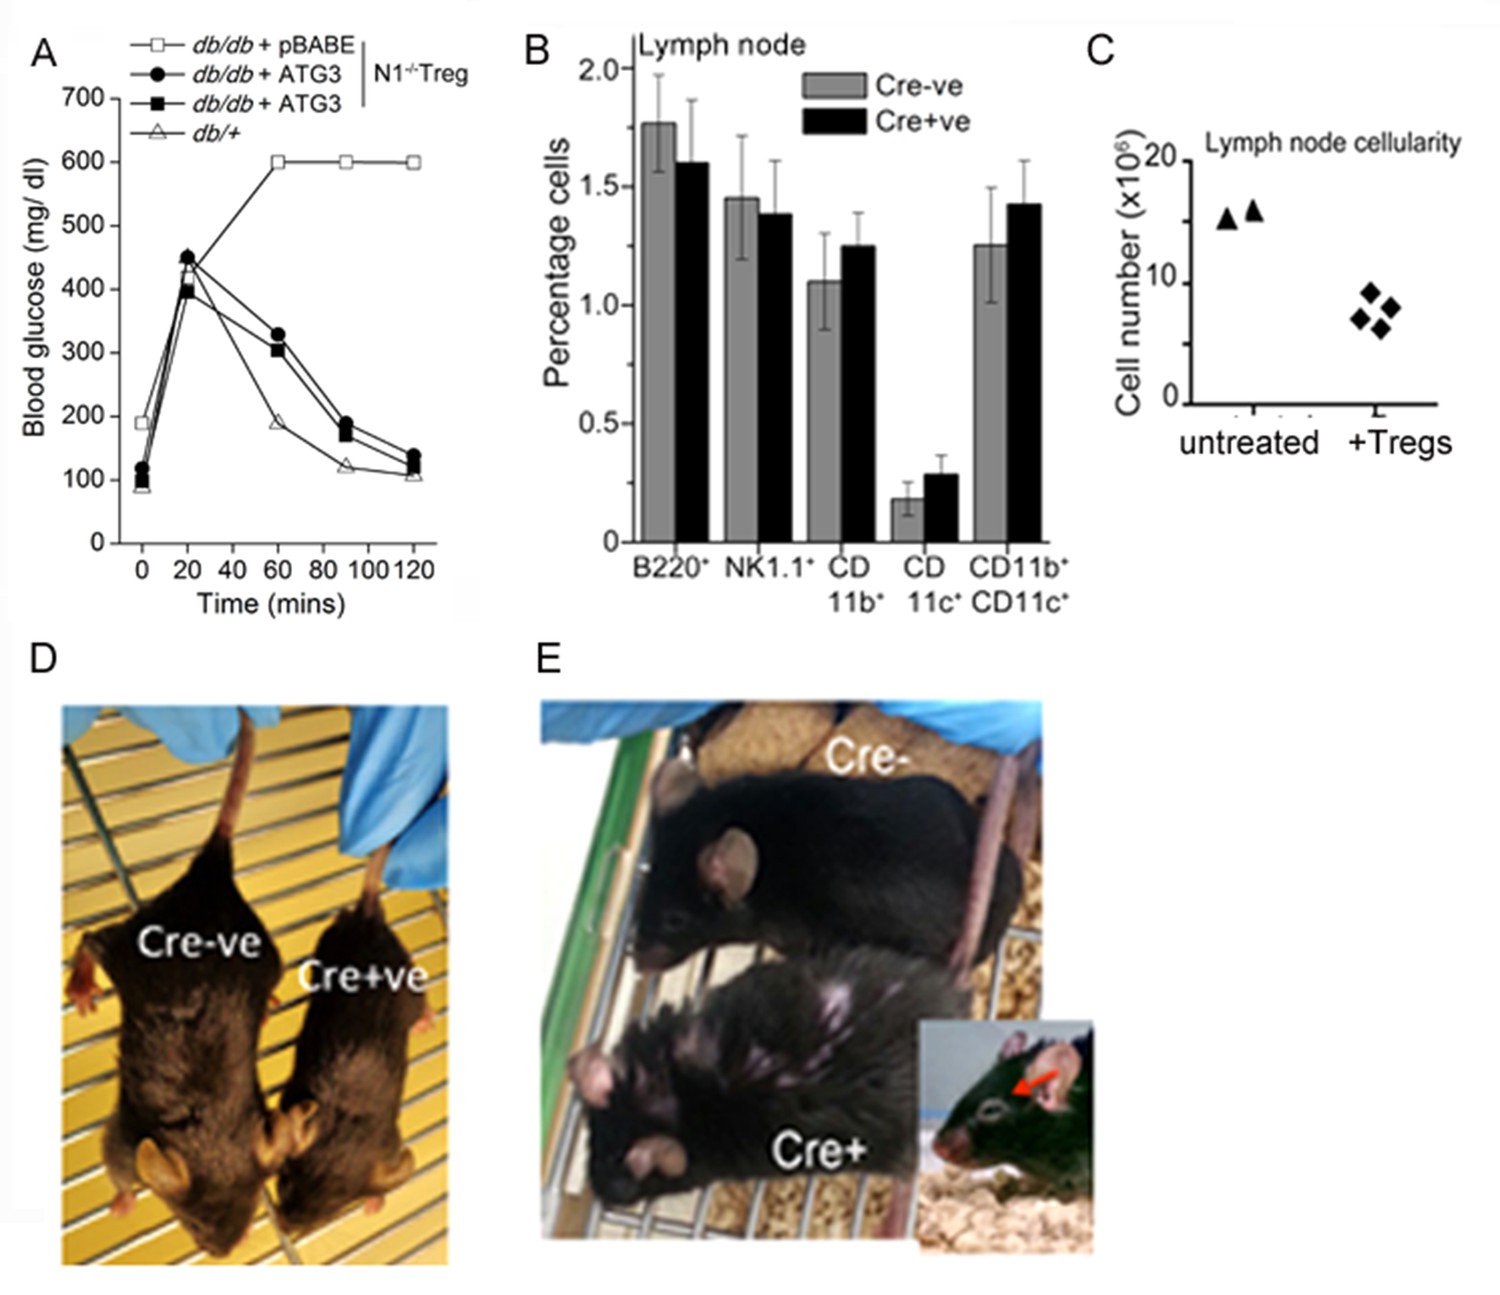
Treg suppressor function is regulated by Notch1 signaling from the cytoplasm.
(A) IPGTT analysis in Leprdb/+ (△) or Leprdb/db, mice injected intravenously seven days prior to the assay with activated Notch1-/-Tregs infected to express recombinant ATG3 (⬤,■) or pBABE (□). (B) Analysis of lymphoid subsets isolated from lymph nodes of mice of the indicated genotypes. (C) Lymph node cellularity in Foxp3-Cre::Notch1lox/lox mice either untreated or injected with WT-Tregs seven days prior to the analysis. (D) Representative images of littermates of genetic (Cre-) controls and Foxp3-Cre::Notch1lox/lox (Cre+) mice at 3 weeks of age. (E) Representative images showing coarsened and patchy distribution of fur and crusting around eyes in Foxp3-Cre::Notch1lox/lox mice.
Download links
A two-part list of links to download the article, or parts of the article, in various formats.
Downloads (link to download the article as PDF)
Open citations (links to open the citations from this article in various online reference manager services)
Cite this article (links to download the citations from this article in formats compatible with various reference manager tools)
Notch1 regulated autophagy controls survival and suppressor activity of activated murine T-regulatory cells
eLife 5:e14023.
https://doi.org/10.7554/eLife.14023


