Constitutive turnover of histone H2A.Z at yeast promoters requires the preinitiation complex
- Stony Brook University, United States
Figures
Figure 1 with 11 supplements

H2A.Z nucleosome occupancy determined by qChIP-seq in the TBP-FRB and the untagged control (no FRB) strains with and without rapamycin treatment.
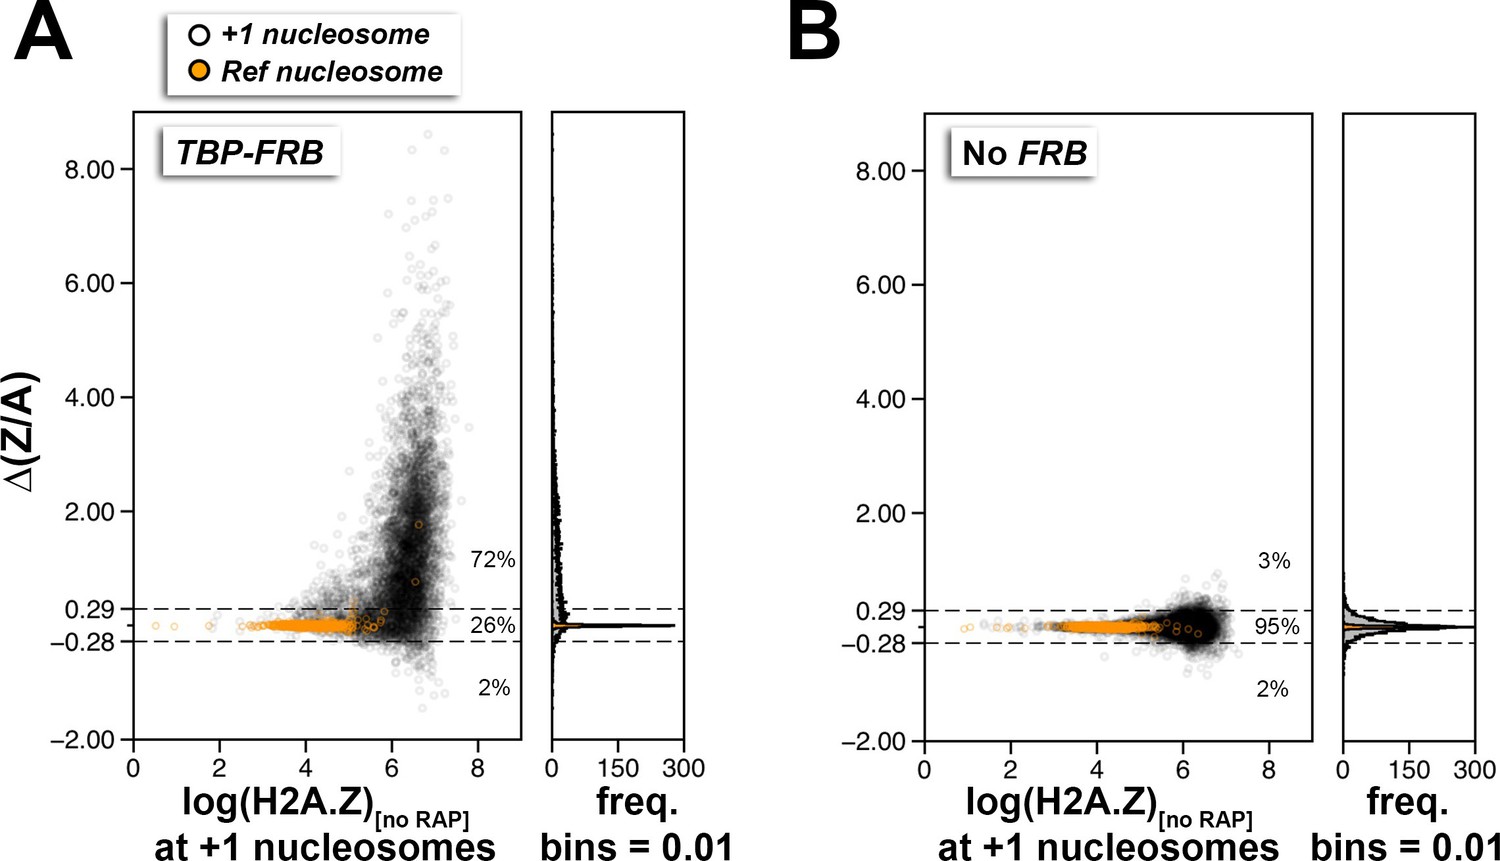
(A,B) Sequencing tag coverage of H2A.Z (in green), FT (indicated as H2A in red), and input (in gray) at a representative genomic region on chromosome III. Blue traces indicate Δ(Z/A), the H2A.Z-to-H2A (Z/A) ratio with rapamycin treatment (+RAP) minus that without treatment (no RAP). Plus signs and arrowheads mark +1 nucleosomes and transcription start sites, respectively. (C,D) Compiled read counts (midpoints) of H2A.Z (green), H2A (red), and input (gray) nucleosomes were centered around the dyad of 4,738 +1 nucleosomes. (E) Verification of the qChIP-seq data by qPCR using primer pairs covering the +1 nucleosomes of the indicated promoters and regions within the indicated open reading frames (ORF). (F) Scatter plots and histograms showing the change in (H2A.Z/input) of the +1 and reference nucleosomes as a function of endogenous H2A.Z level before rapamycin treatment. The (H2A.Z/input) value represents the ratio of H2A.Z tag coverage over input tag coverage within a 120 bp region around the nucleosome dyad. Open black circles mark the +1 nucleosomes (Rhee et al., 2014). Orange dots mark the reference nucleosomes used for normalization. Dotted lines represent the upper and lower thresholds for significant change in H2A.Z levels, which are defined as two standard deviations from the median of the no FRB control. The percentages of data points within and outside the threshold regions are indicated. The qChIP-seq and qPCR data represent averages of >3 independent ChIP reactions (technical replicates) of two independent cultures (biological replicates). The error bars in (E) represent standard deviation.
-
Figure 1—source data 1
Reference regions or 'no-Z-zones' used for normalization.
- https://doi.org/10.7554/eLife.14243.004
-
Figure 1—source data 2
Normalization factors.
- https://doi.org/10.7554/eLife.14243.005
-
Figure 1—source data 3
Nucleosome tag profiles of TBP-FRB around the +1 dyads before normalization.
- https://doi.org/10.7554/eLife.14243.006
-
Figure 1—source data 4
Nucleosome tag profiles of no FRB around the +1 dyads before normalization.
- https://doi.org/10.7554/eLife.14243.007
-
Figure 1—source data 5
Nucleosome tag profiles of RPB1-FRB around the +1 dyads before normalization.
- https://doi.org/10.7554/eLife.14243.008
-
Figure 1—source data 6
Average tag coverage around the +1 dyads of TBP-FRB.
- https://doi.org/10.7554/eLife.14243.009
-
Figure 1—source data 7
Average tag coverage around the +1 dyads of no FRB.
- https://doi.org/10.7554/eLife.14243.010
-
Figure 1—source data 8
Average tag coverage around the +1 dyads of RPB1-FRB.
- https://doi.org/10.7554/eLife.14243.011
-
Figure 1—source data 9
Source data for Figure 1E.
- https://doi.org/10.7554/eLife.14243.012
Figure 1—figure supplement 1

A proposed model to account for the constitutive histone turnover at yeast promoters.
(A) The conversion of a +1 H2A nucleosome to an H2A.Z nucleosome by SWR1 is followed by nucleosome disassembly. Histone chaperones are omitted for simplicity. NDR: nucleosome-depleted region. ‘+1’: +1 nucleosome. TSS: transcription start site. H2A.Z-H2B dimers are in green, H2A-H2B dimers in red, and (H3-H4)2 tetramers in gray. (Step I-a) SWR1 replaces one nucleosomal H2A-H2B dimer in a homotypic 'AA' +1 nucleosome with a dimer of H2A.Z-H2B to generate a heterotypic 'AZ' nucleosome. (Step I-b) SWR1 replaces the second H2A-H2B dimer with H2A.Z-H2B generating a homotypic 'ZZ' nucleosome. (Steps I-c and I-d) The reported reverse replacement reaction by the INO80 complex (Papamichos-Chronakis et al., 2011). (Step II) The ZZ nucleosome is disassembled by an unknown mechanism indicated by a question mark. (Step III) A canonical AA nucleosome is reassembled. (B) Same as (A) except step II is blocked.
Figure 1—figure supplement 2

Fluorescence microscopy of yeast expressing TBP-FRB-GFP with and without rapamycin treatment.
At the indicated times after the addition of 1 µg/mL rapamycin (RAP), cells were fixed with 4% formaldehyde for 5 min, washed with PBS and stained with DAPI before imaged under a Zeiss Axio Observer Z1 microscope. DAPI: red; GFP: green; DIC: differential interference contrast optics.
Figure 1—figure supplement 3

Immunoblot analysis to control for anti-FLAG IP efficiency.
The nucleosomes used in the IP reactions were prepared from formaldehyde fixed haploid cells expressing the 2xFLAG-epitope-tagged Htz1 (H2A.ZFL). Nucleosomes were released from crude chromatin by MNase digestion. After centrifugation, the supernatant was filtered through a low-binding PVDF membrane. A sample of the soluble nucleosome was collected as the input (IN) of the IP reaction. After incubation with anti-FLAG agarose, an equivalent amount of the flow-through fraction (FT) was collected. Both the IN and the FT were heated at 95˚C in SDS-PAGE sample buffer for 30 min to allow decrosslinking before analysis with SDS-PAGE and anti-H2A.Z immunoblotting. Serially diluted samples of the IN fraction were loaded next to the FT lane for comparison. The number above each lane indicates the relative sample volume applied to the gel. Western signals were developed by the ECL Prime reagent (GE Healthcare, Pittsburgh, PA) and imaged by the ImageQuant FLA4010 imaging system (GE Healthcare). Representative western blots for individual IP reactions of both no RAP and + RAP samples are shown for the no FRB control in (A), TBP-FRB in (B), and RPB1-FRB in (C), and INO80-FRB in (D).
Figure 1—figure supplement 4
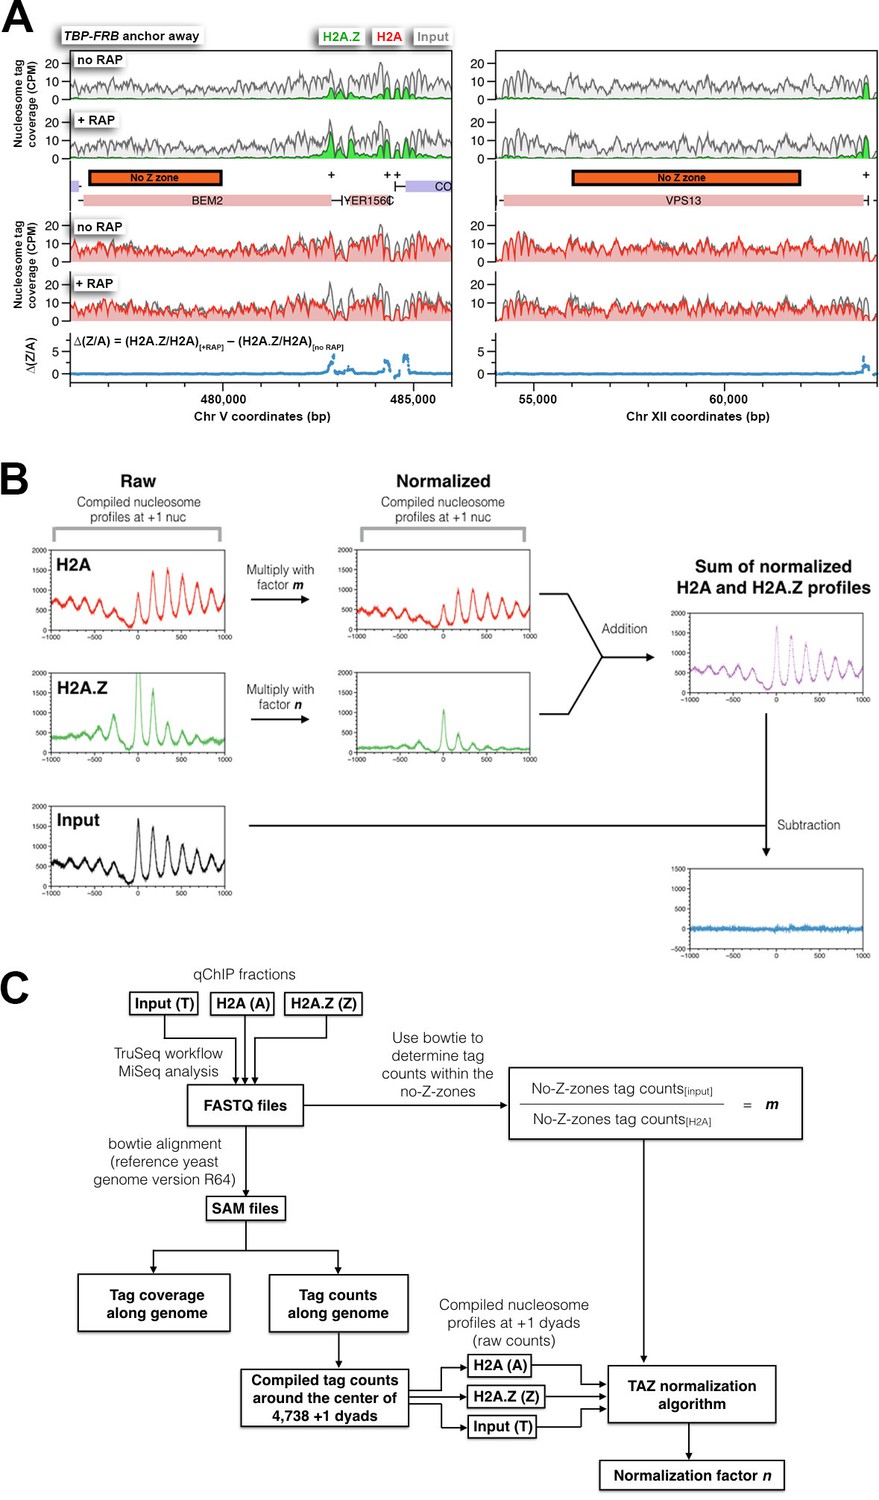
The strategy used to normalize relative H2A and H2A.Z occupancy.
(A) Examples of the no-Z-zones used in the normalization of the H2A profile. (B) An overview of the ‘TAZ’ normalization approach used to rescale the H2A.Z and H2A nucleosomal profiles. The compiled tag counts (midpoints) in relation to the distance from the +1 nucleosomal dyads (n = 4,738) were plotted for H2A (A), H2A.Z (Z) and input (T) nucleosomes, which are in red, green, and black, respectively. To normalize the raw data, the scaling factors, m and n, were applied to the H2A and H2A.Z profiles respectively. The scaling factor m was determined for each IP reaction by dividing the tag count within the no-Z-zones of the input fraction by that of the H2A fraction. The scaling factor n was subsequently determined by a curve-fitting algorithm such that the sum of the resulting profiles (m × H2A + n × H2A.Z) equals, to a first approximation, the input nucleosomal profile. (C) The informatics pipeline of TAZ normalization. The sequencing tags of the H2A, H2A.Z, and input fractions (in FASTQ file format) were mapped to the yeast genome by bowtie (Langmead et al., 2009). Mapped reads were either presented as tag coverage (density covered by paired-end reads) or tag counts (density of mid-points of paired-end reads) along the yeast genome. Bowtie was also used to determine the tag counts within the no-Z-zones in the input and the H2A fractions. The TAZ curve-fitting algorithm is provided in a Python script, which requires four inputs: the scaling factor m and the compiled nucleosome profiles of H2A, H2A.Z and input around the +1 dyads. The algorithm generates the scaling factor n for normalization of the H2A.Z profile.
Figure 1—figure supplement 5
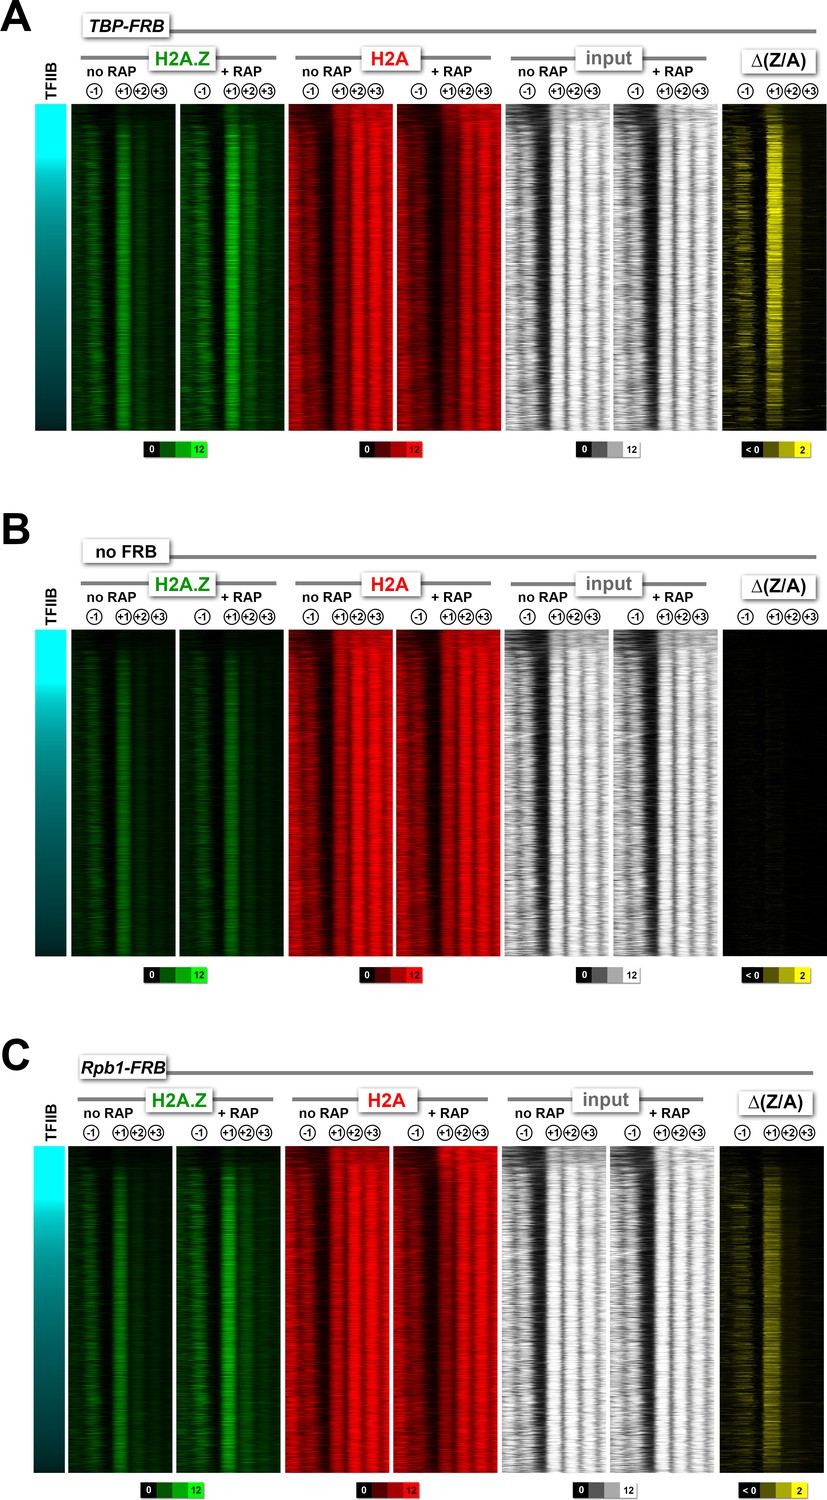
Heatmaps of H2A.Z, H2A and input nucleosomes for the TBP-FRB, no FRB, and RPB1-FRB strains .
Nucleosome tag coverage of H2A.Z (in green), H2A (in red) and input (in white) were plotted around the +1 dyads (n = 4,182) for TBP-FRB in (A), no FRB in (B) and RPB1-FRB in (C) before and after rapamycin treatment. Genes were sorted by TFIIB/Sua7 occupancy (Rhee and Pugh, 2012).
Figure 1—figure supplement 6

Concordance of relative H2A.Z occupancy between biological replicates.
The (H2A.Z/input) signals of the biological replicates at the +1 nucleosomal positions (Rhee et al., 2014, n = 4,738) were plotted against each other for TBP-FRB, no RAP in (A), TBP-FRB, + RAP in (B), no FRB, no RAP in (C), and no FRB, + RAP in (D). The biological replicates represent independent yeast cultures. Dotted red lines: arbitrary reference perimeter set at -0.25 on both axes.
Figure 1—figure supplement 7
Using ∆(Z/A) as a parameter to identify +1 nucleosomes with PIC-dependent H2A.Z eviction.
(A,B) Scatter plots and histograms showing the ∆(Z/A) values of +1 and reference nucleosomes as a function of endogenous H2A.Z level (before rapamycin treatment) for the TBP-FRB and no FRB strains, respectively. Open black circles mark the +1 nucleosomes. Orange dots mark the reference nucleosomes used for normalization. Dotted horizontal lines represent the upper and lower thresholds for significant change in ∆(Z/A), which are two standard deviations from the median of the no FRB control. The percentages of data points within and outside the threshold regions are indicated.
Figure 1—figure supplement 8

Relative H2A.Z occupancy before and after Rpb1 depletion.
(A) Sequencing tag coverage of H2A.Z (in green), H2A (in red), and input (in gray) at a representative genomic region on chromosome III. Blue traces indicate ∆(Z/A), the H2A.Z-to-H2A (Z/A) ratio with rapamycin treatment minus that without . Plus signs and arrowheads mark +1 nucleosomes and transcription start sites, respectively. (B) Compiled read counts (midpoints) of H2A.Z (green), H2A (red), and input (gray) nucleosomes were centered around the dyad of 4,738 +1 nucleosomes. (C) Scatter plots and histograms showing the change in (H2A.Z/input) of the +1 or reference nucleosomes as a function of endogenous H2A.Z level. Open black circles mark the +1 nucleosomes. Orange dots mark the reference nucleosomes. Dotted black lines are the upper and lower thresholds for significant change in H2A.Z levels. The data in (A–C) represent averages of two biological replicates. (D) Scatter plots showing the concordance of log(H2A.Z/input) at +1 nucleosomes of the biological replicates. Dotted red lines: arbitrary reference perimeter set at –0.25 on both axes.
Figure 1—figure supplement 9
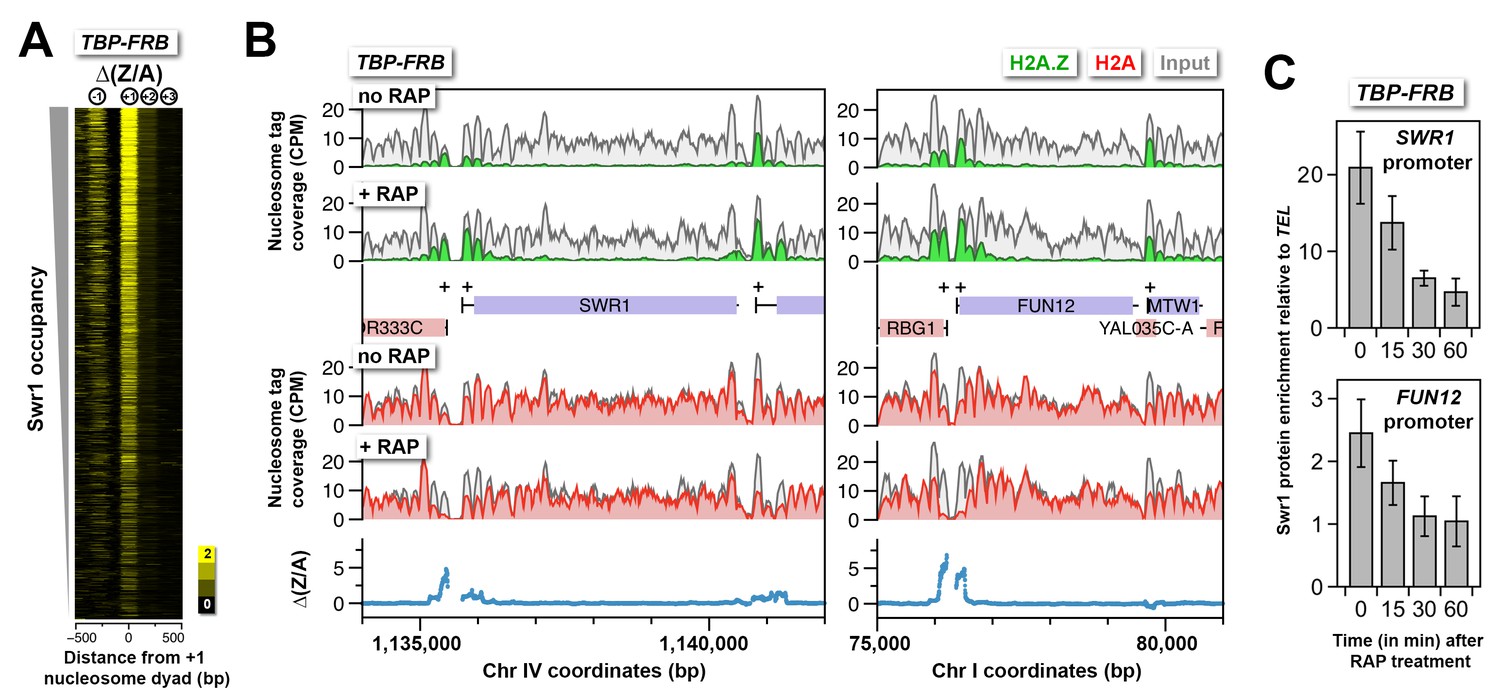
H2A.Z accumulation is not due to aberrant accumulation of the SWR1 complex.
(A) ∆(Z/A) around the +1 dyads after TBP depletion. Genes were sorted by endogenous SWR1 occupancy (Venters and Pugh, 2009). (B) Sequencing tag coverage of H2A.Z, H2A and input nucleosomes surrounding the SWR1 and FUN12 genes. (C) ChIP-qPCR analysis was performed using an antibody directed against Swr1 and primers targeting the promoters of SWR1 and FUN12 relative to a control region near TEL6R (Ranjan et al., 2013). Swr1 enrichment represents the mean of a total of four independent ChIP reactions from two biological replicates. Error bars: standard deviation.
Figure 1—figure supplement 10

Input nucleosome occupancy at the +1 positions before and after TBP depletion.
Left panel: The occupancy of +1 nucleosomes represents the read coverage within a 120 bp region around the +1 dyad (n = 4,738). The +1 occupancy associated with the top 3% most actively transcribing genes are in red (Lipson et al., 2009). The red line and dotted black line represent the linear regression for the highlighted genes and all the genes, respectively. Right panel. Same as left except that the +1 nucleosomes associated with the bottom 3% least active genes are highlighted. Blue line is the corresponding linear regression.
Figure 1—figure supplement 11
qPCR and H2A western analyses of the flow-through fractions.
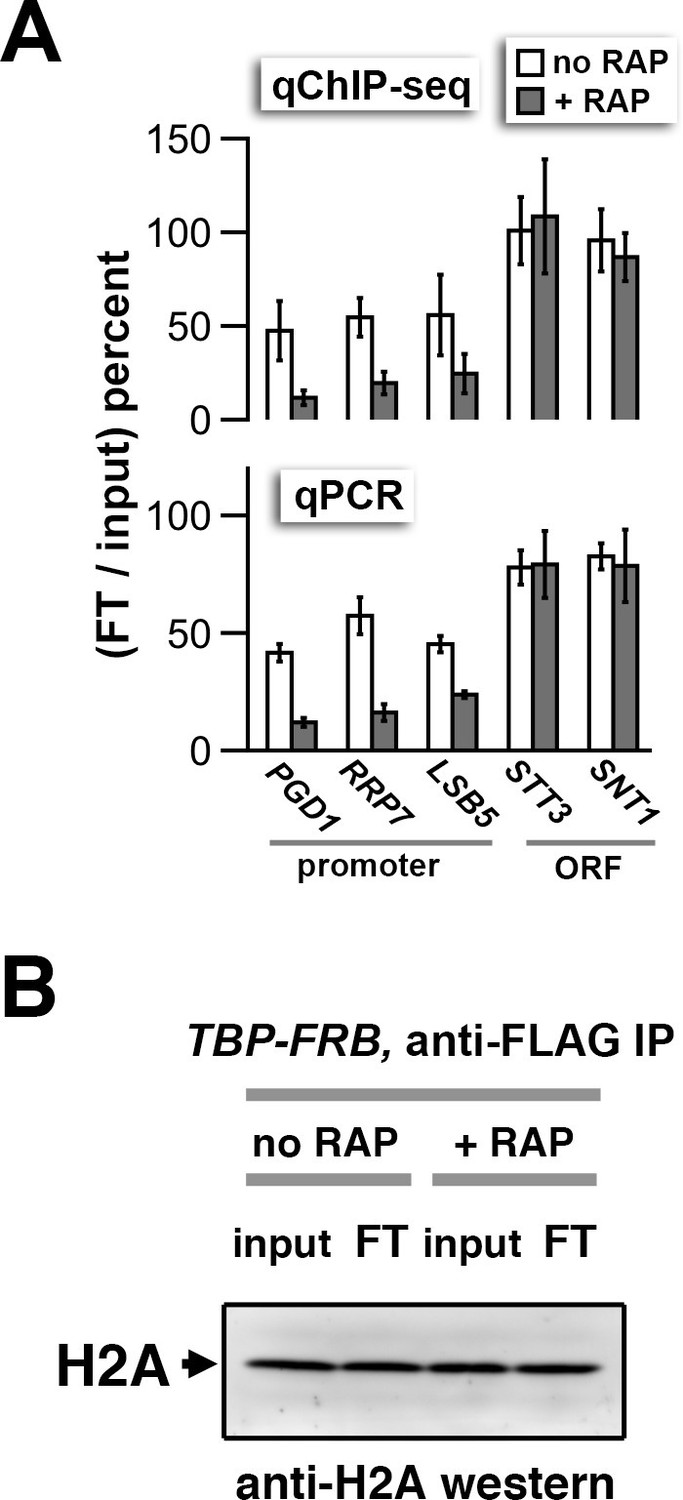
(A) qChIP-seq and qPCR quantification of the nucleosomal DNA in the flow-through (FT) relative to the input of the anti-FLAG (H2A.Z) IP reactions. The primer pairs for qPCR cover +1 nucleosomes of the indicated promoters and regions within the indicated open reading frames (ORF) that are known to be depleted for H2A.Z. Error bars for the qPCR represent the range of two biological replicates, whereas those for the qChIP-seq analysis represent the standard deviation of independent ChIP reactions of two biological samples. (B) Immunoblotting analysis of H2A in the FT and input fractions showing that the bulk of H2A remains in the FT after the anti-FLAG IP reaction. The protein samples were decrosslinked by heating before analyzed by SDS-PAGE and anti-H2A western blotting as described in Figure 1—figure supplement 3.
Figure 2 with 1 supplement
Change in nucleosomal H2A.Z and H2A levels near promoters before and after depletion of TBP.
(A) Heatmaps showing the average normalized tag coverage of H2A.Z (green), H2A (red) and input (white), and the corresponding ∆(Z/A) values (yellow) around the +1 dyads of the TBP-FRB strain with and without rapamycin treatment. Promoters enriched for the PIC (based on Sua7 occupancy) were grouped into high and low TFIID (based on Taf1 occupancy) and were then sorted by mRNA abundance (n = 3,919) (Lipson et al., 2009; Rhee and Pugh, 2012). The ribosomal protein (RP) genes (n = 128) are 'zoomed in 4x' meaning that the line thickness is 4 times of the other genes. (B) Compiled nucleosome tag counts of H2A.Z (green), H2A (red), and input (gray) around the +1 dyads of the RP genes. (C) The +1 nucleosomes were grouped according to transcriptional frequency (Holstege et al., 1998) and the (H2A.Z/input) values were presented as box plots. Box: interquartile range (IQR); line in box: median; whiskers: range. The most active genes (>50 mRNA/hr) were sub-divided into two groups that are SAGA- or TFIID-enriched. The number of +1 nucleosomes in the transcriptional frequency groups <1, 1–4, 4–16, 16–50, and >50 mRNA/hr are 937, 1932, 1018, 219 and 161, respectively. There are 22 promoters in the SAGA >50 group and 130 in the TFIID >50 group.
Figure 2—figure supplement 1
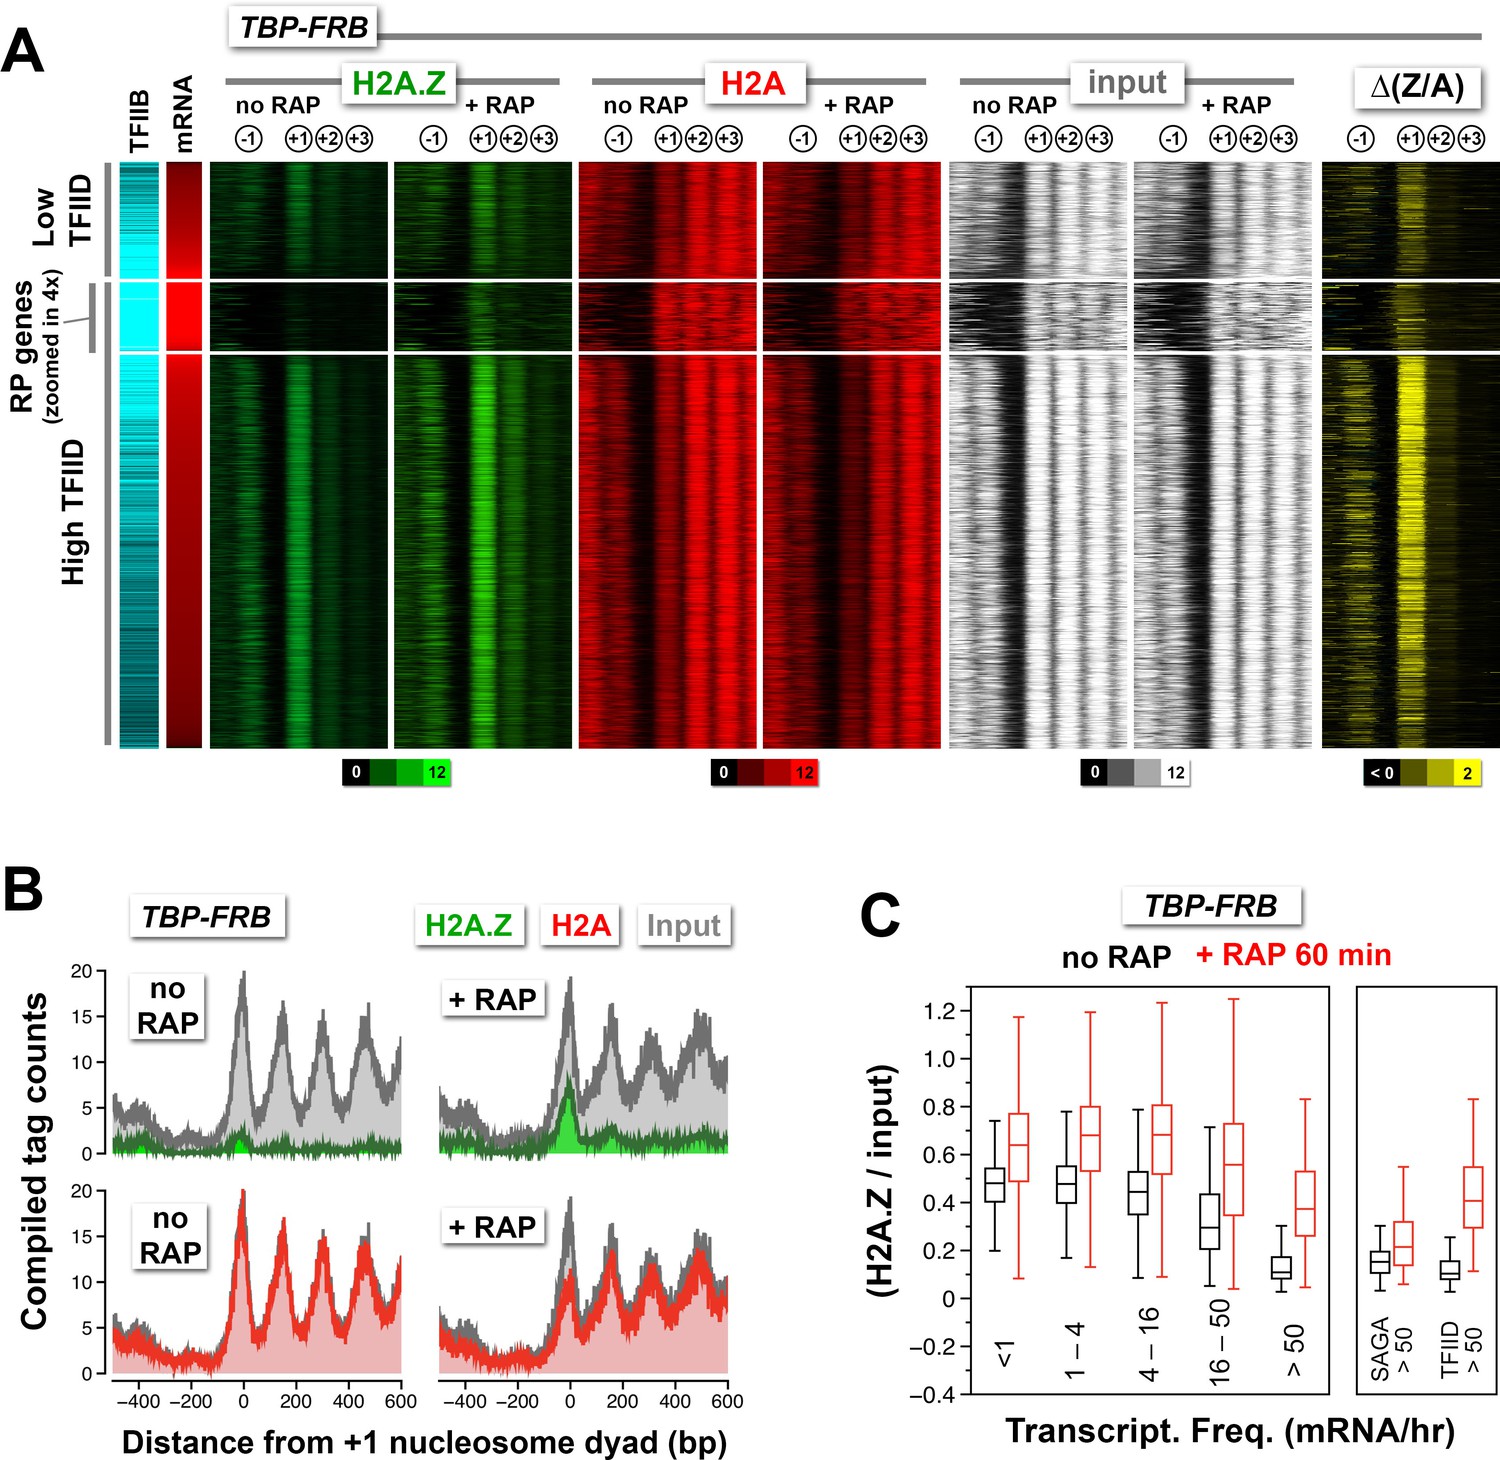
Normalized nucleosome tag coverage for H2A.Z, H2A, and input before and after the depletion of Rpb1.
(A) Heatmaps were plotted and sorted by TFIID/Taf1 levels as described in Figure 2A. (B) Compiled tag counts of the RP genes.
Figure 3 with 2 supplements
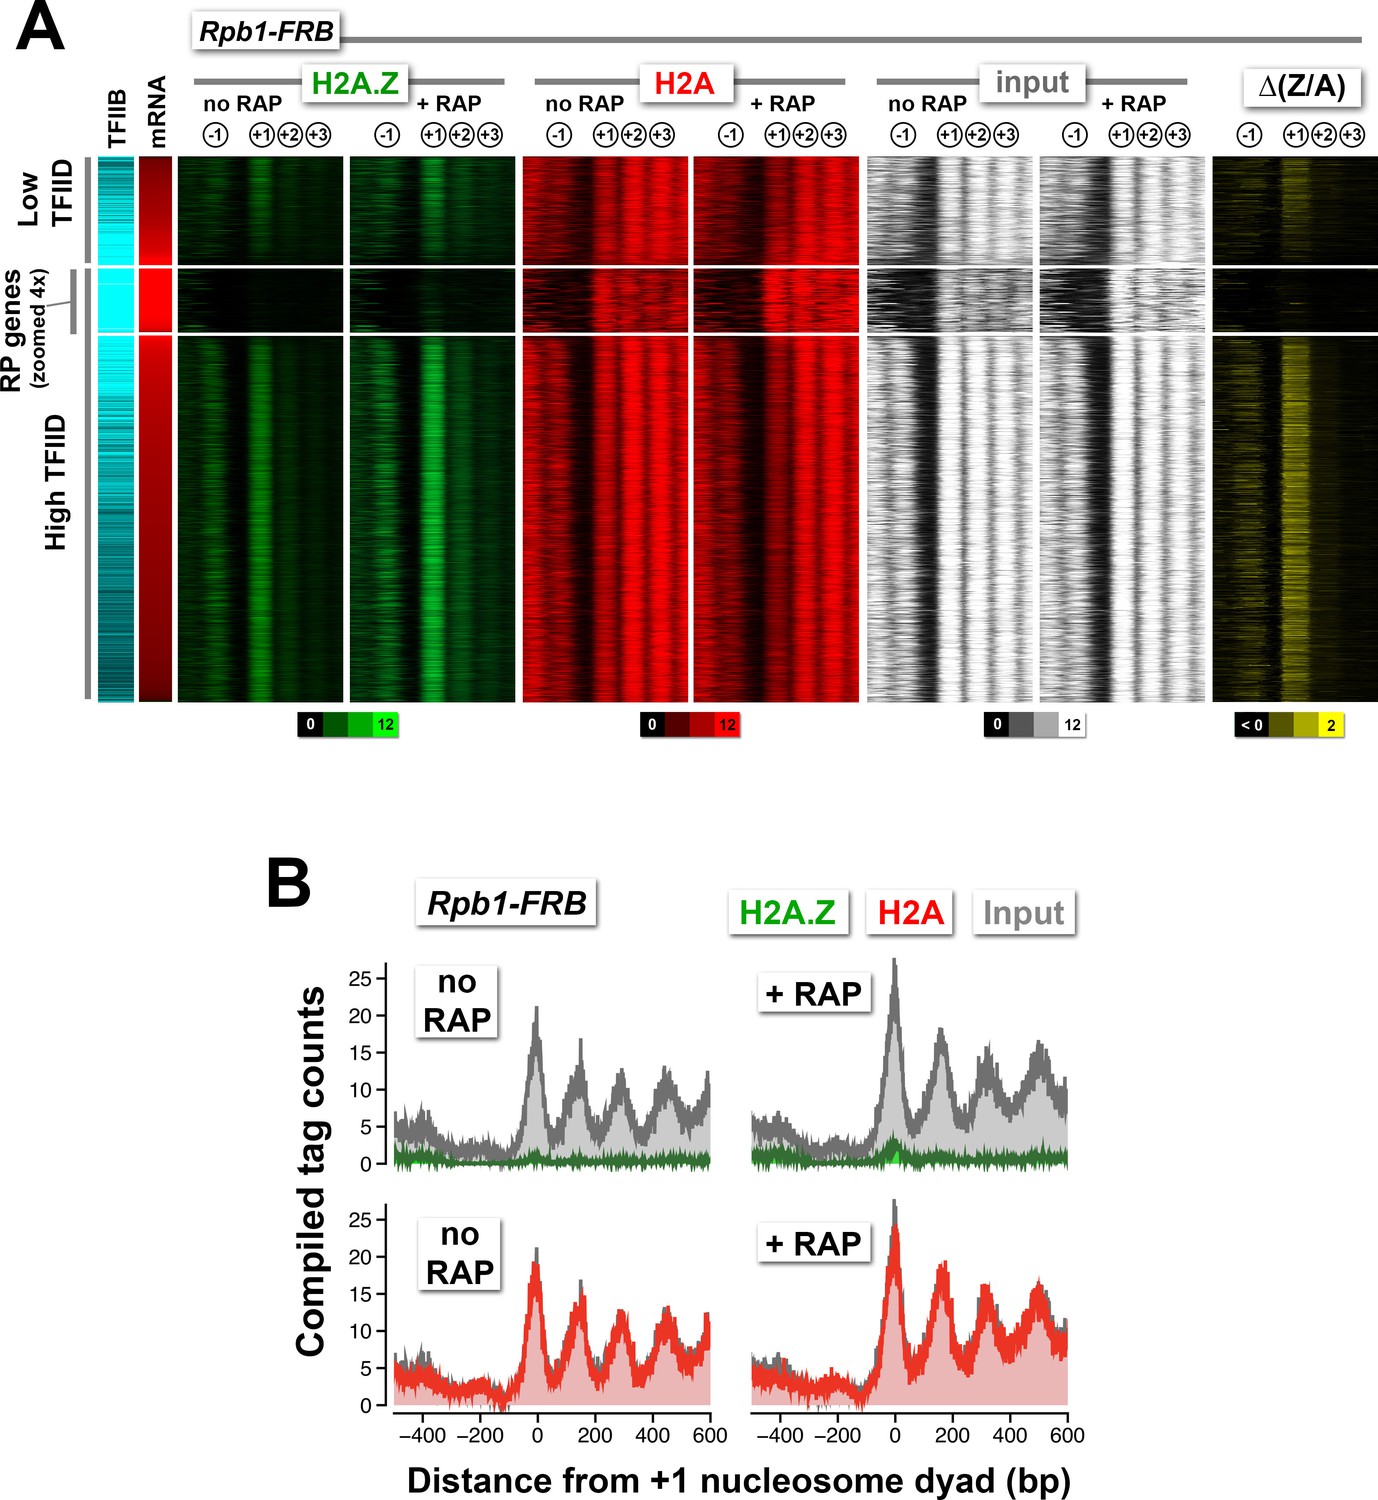
Depletion of Swc5 revealed rapid PIC-dependent eviction of H2A.Z at the +1 nucleosome of active and infrequently transcribed genes.
(A) Compiled tag counts of H2A.Z nucleosomes around the +1 dyads in the SWC5-FRB strain before and after 30 min of rapamycin treatment. (B) Scatter plot analysis showing the change in relative H2A.Z occupancy against endogenous H2A.Z level in the SWC5-FRB strain at the +1 nucleosomes (n = 4,738) after 30 min of rapamycin treatment. Gray: +1 nucleosomes. Orange: reference nucleosomes depleted for H2A.Z. (C) Same as Figure 2C, except the SWC5-FRB strain was used. (D–F) Same as (A–C), except the SWC5-FRB TBP-FRB strain was used.
-
Figure 3—source data 1
Compiled nucleosome tag profiles of SWC5-FRB and SWC5-FRB TBP-FRB around the +1 dyads before normalization.
- https://doi.org/10.7554/eLife.14243.027
-
Figure 3—source data 2
Average tag coverage around the +1 dyads of SWC5-FRB.
- https://doi.org/10.7554/eLife.14243.028
-
Figure 3—source data 3
Average tag coverage around the +1 dyads of SWC5-FRB TBP-FRB.
- https://doi.org/10.7554/eLife.14243.029
Figure 3—figure supplement 1

Concordance of relative H2A.Z occupancy between technical replicates (independent IP reactions).
The +1 nucleosome log(H2A.Z/input) values for the replicates of SWC5-FRB and SWC5-FRB TBP-FRB were plotted as described in Figure 1—figure supplement 6. +RAP: Rapamycin treatment for 30 min. Dotted red lines: arbitrary reference perimeter set at -0.25 on both axes.
Figure 3—figure supplement 2
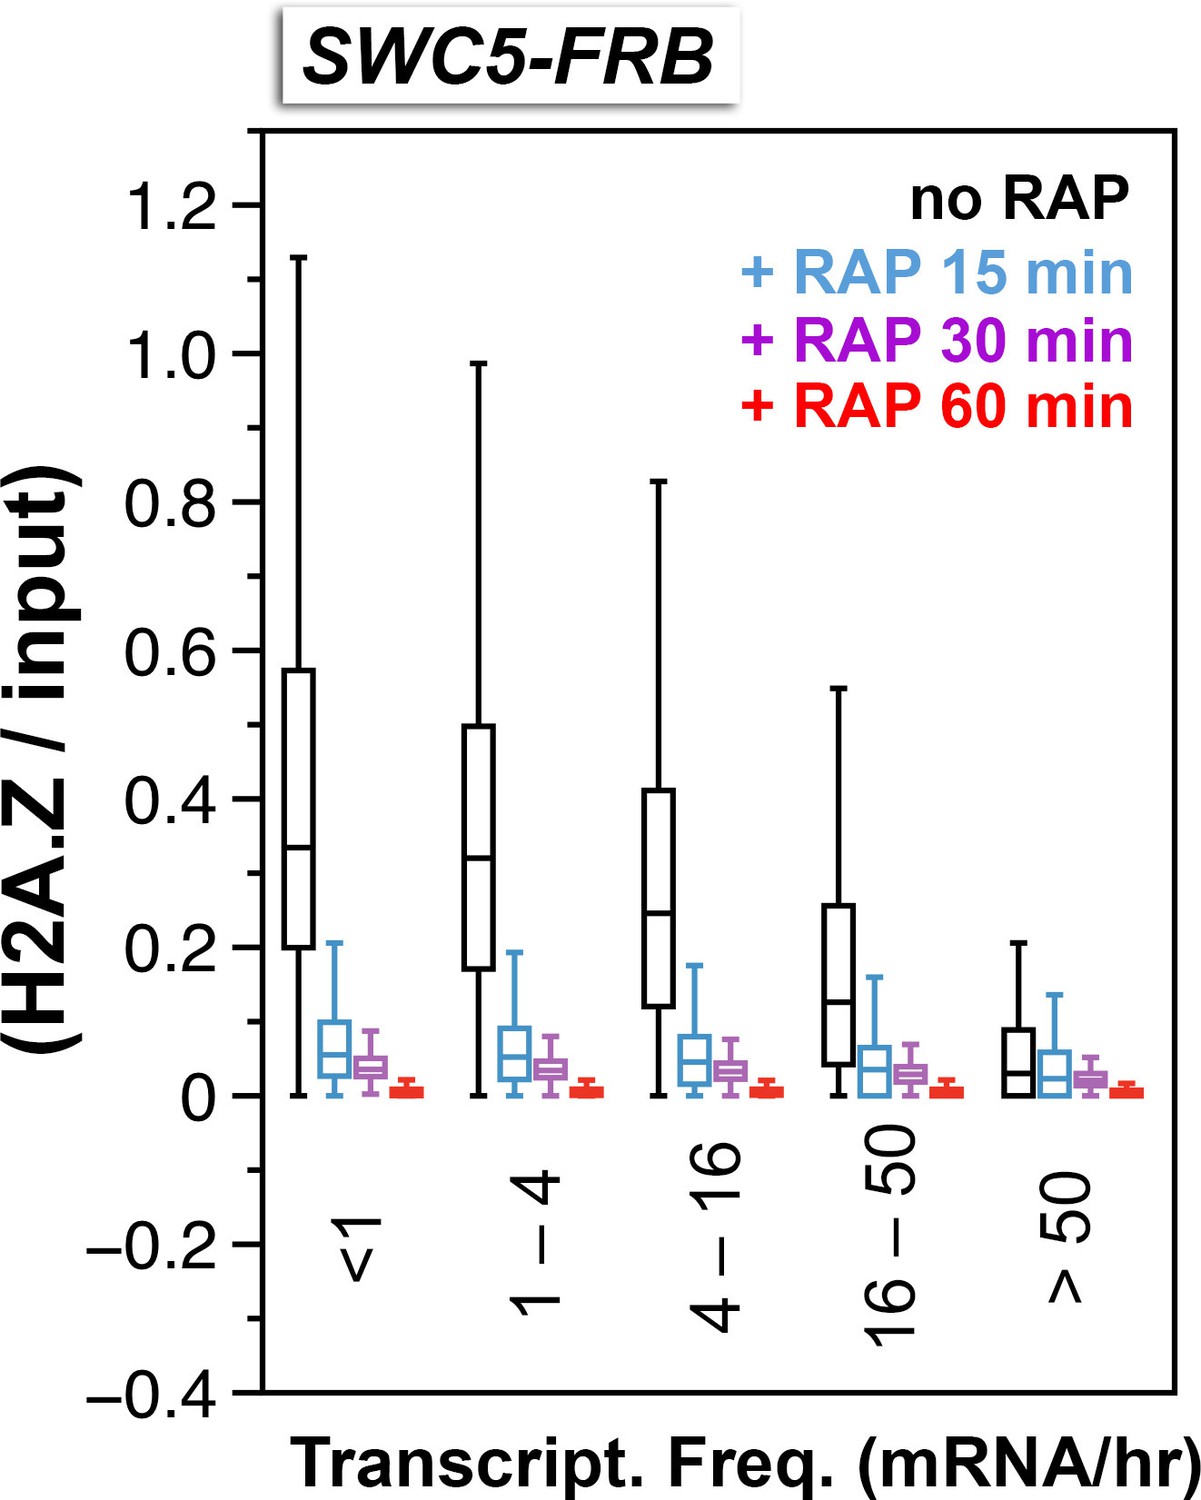
Relative H2A.Z occupancy at the +1 nucleosomes of the SWC5-FRB strain at different times after rapamycin treatment.
Same as Figure 3C except additional time points after rapamycin treatment were included.
Figure 4 with 1 supplement
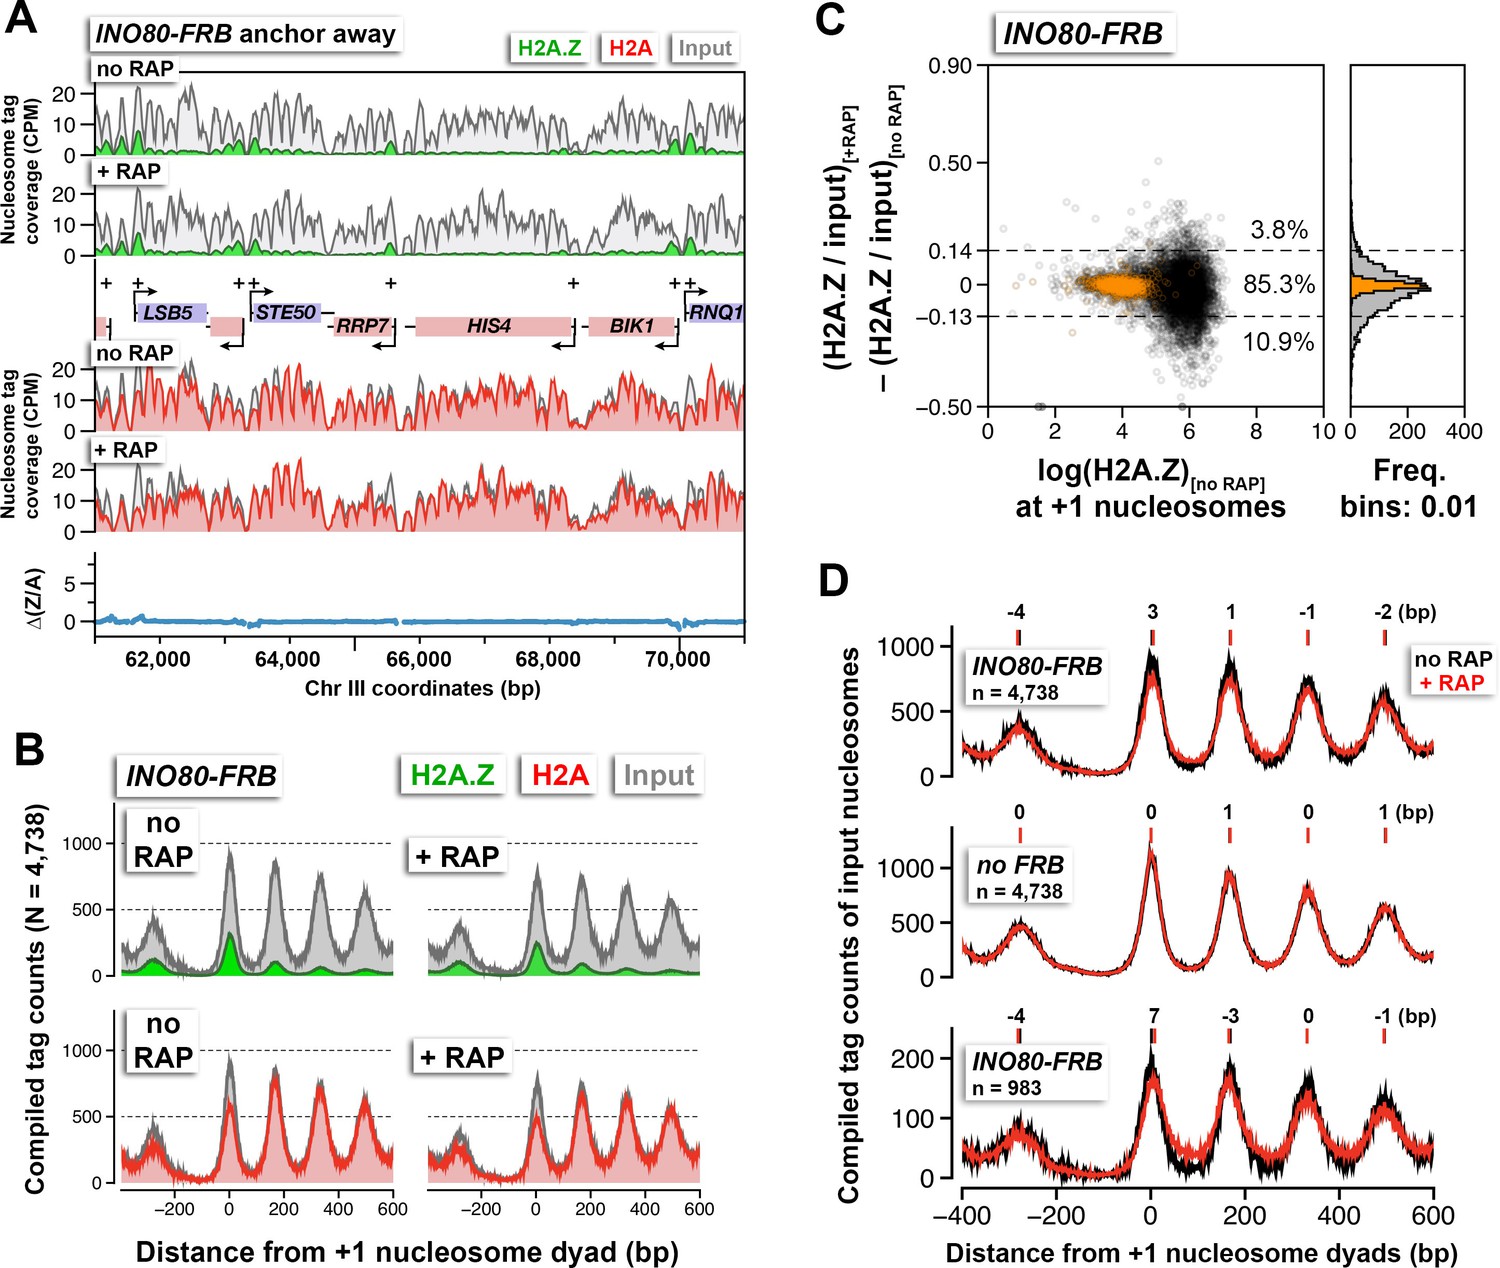
The effects of Ino80 depletion on H2A.Z occupancy and nucleosomal positions.
(A) Sequencing tag coverage of H2A.Z (green), H2A (red), and input (gray) nucleosomes, as well as the corresponding ∆(Z/A) values were plotted as described in Figure 1A. (B) Compiled read counts around the +1 nucleosome dyads. (C) Scatter plot and histogram showing the change in (H2A.Z/input) for individual +1 nucleosomes after Ino80 depletion. The thresholds (dotted lines) were determined as described in Figure 1F. Open black circles: +1 nucleosomes. Orange: reference nucleosomes. (D) The compiled input nucleosome profiles before (black) and after (red) rapamycin treatment in INO80-FRB (top) and no FRB, (middle) were re-plotted using the data from (B) and Figure 1D to highlight any difference in the nucleosomal arrays. Bottom: The compiled tag counts of 983 genes with fuzzier nucleosomal organization upon Ino80 depletion. The integers above the nucleosomal peaks indicate shift distance in base pairs. Positive values indicate right-shift after rapamycin treatment and vice versa. Peak center positions were determined by curve fitting with a Gaussian model followed by local maxima calculation. All qChIP-seq data of Ino80-FRB represent the mean of two biological replicates.
-
Figure 4—source data 1
Nucleosome tag profiles of INO80-FRB around the +1 dyads before normalization.
- https://doi.org/10.7554/eLife.14243.033
-
Figure 4—source data 2
Average tag coverage around the +1 dyads of INO80-FRB.
- https://doi.org/10.7554/eLife.14243.034
-
Figure 4—source data 3
The list of 983 genes with fuzzier nucleosomal organization after Ino80 depletion.
- https://doi.org/10.7554/eLife.14243.035
Figure 4—figure supplement 1
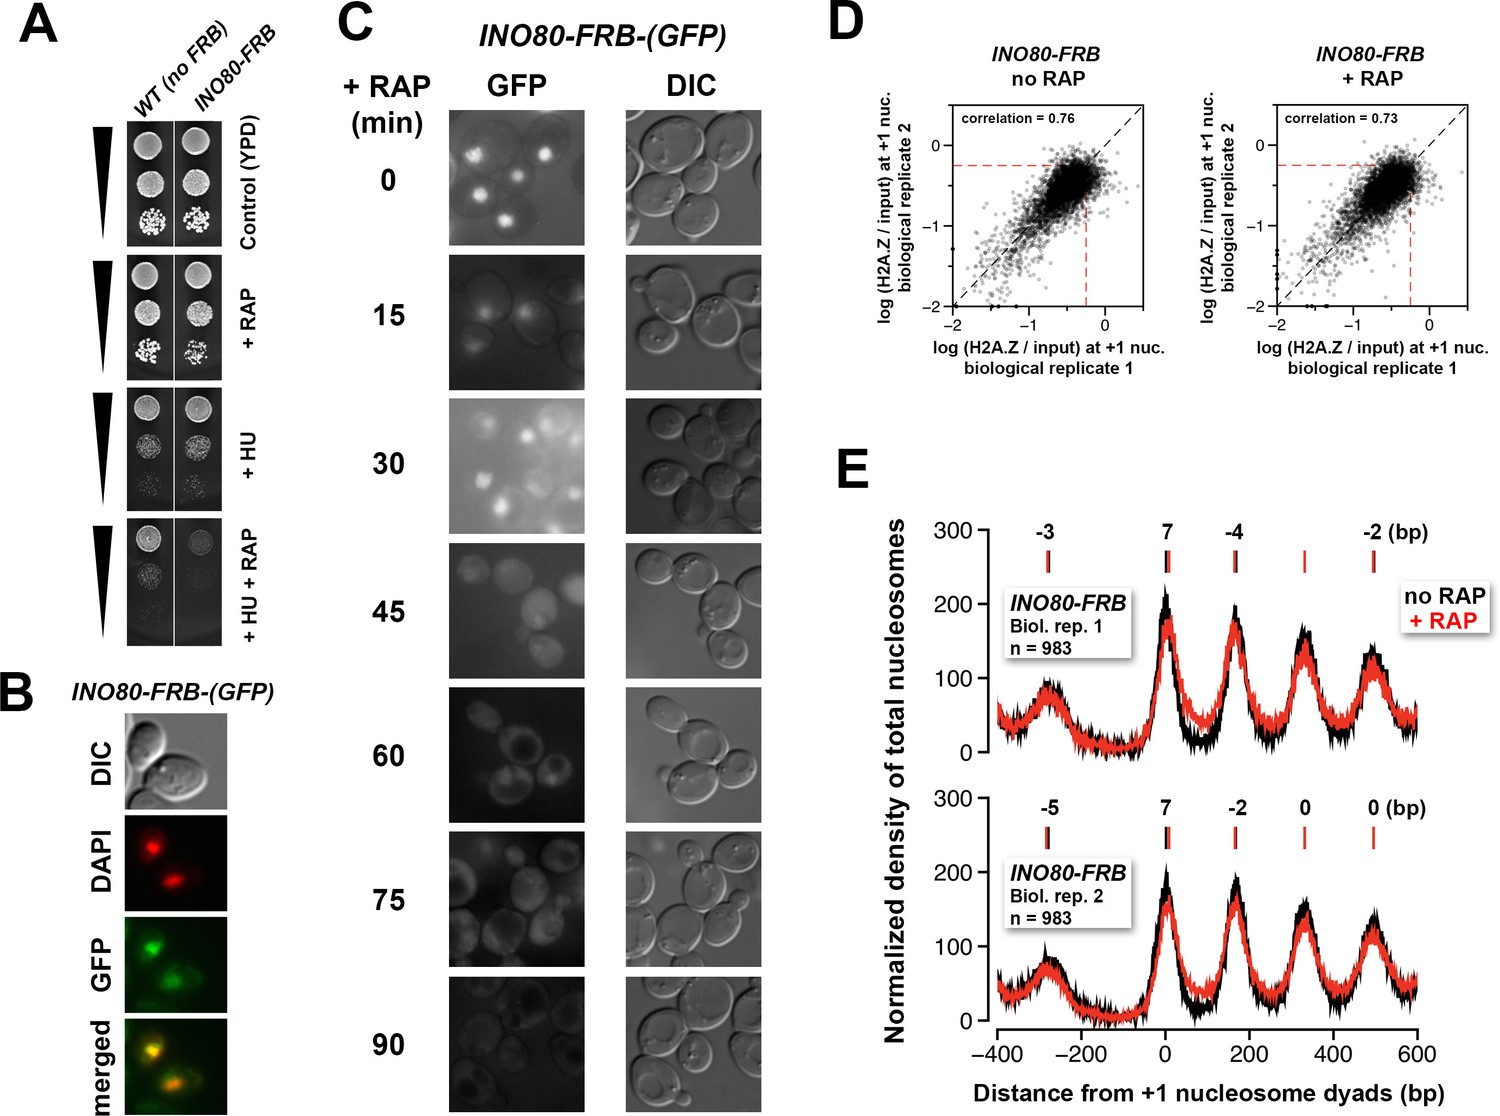
Verification of the conditional depletion of Ino80-FRB and concordance of biological replicates.
(A) Spotting assay of the anchor-away strain bearing the INO80-FRB allele fused in-frame with GFP and the isogenic untagged (no FRB) control in the presence or absence of 100 mM hydroxyurea (HU) and/or 1 µg/mL rapamycin. (B) Fluorescence microscopy of fixed yeast cells expressing the INO80-FRB-(GFP) construct. The cells were fixed with 4% formaldehyde for 5 min before they were washed with PBS and stained with DAPI (pseudo-colored in red). (C) Fluorescence microscopy of live cells expressing INO80-FRB-(GFP) before and after various times of rapamycin treatment. DIC: differential interference contrast optics. (D) Scatter plots showing the concordance of log(H2A.Z/input) at +1 nucleosomes for the biological replicates. (E) Compiled input nucleosome profiles in INO80-FRB before (black) and after (red) rapamycin treatment of the biological replicates. The integers above the nucleosomal peaks indicate the shift distance of the peaks after rapamycin treatment. Peak center positions were determined as described in Figure 4D.
Figure 5
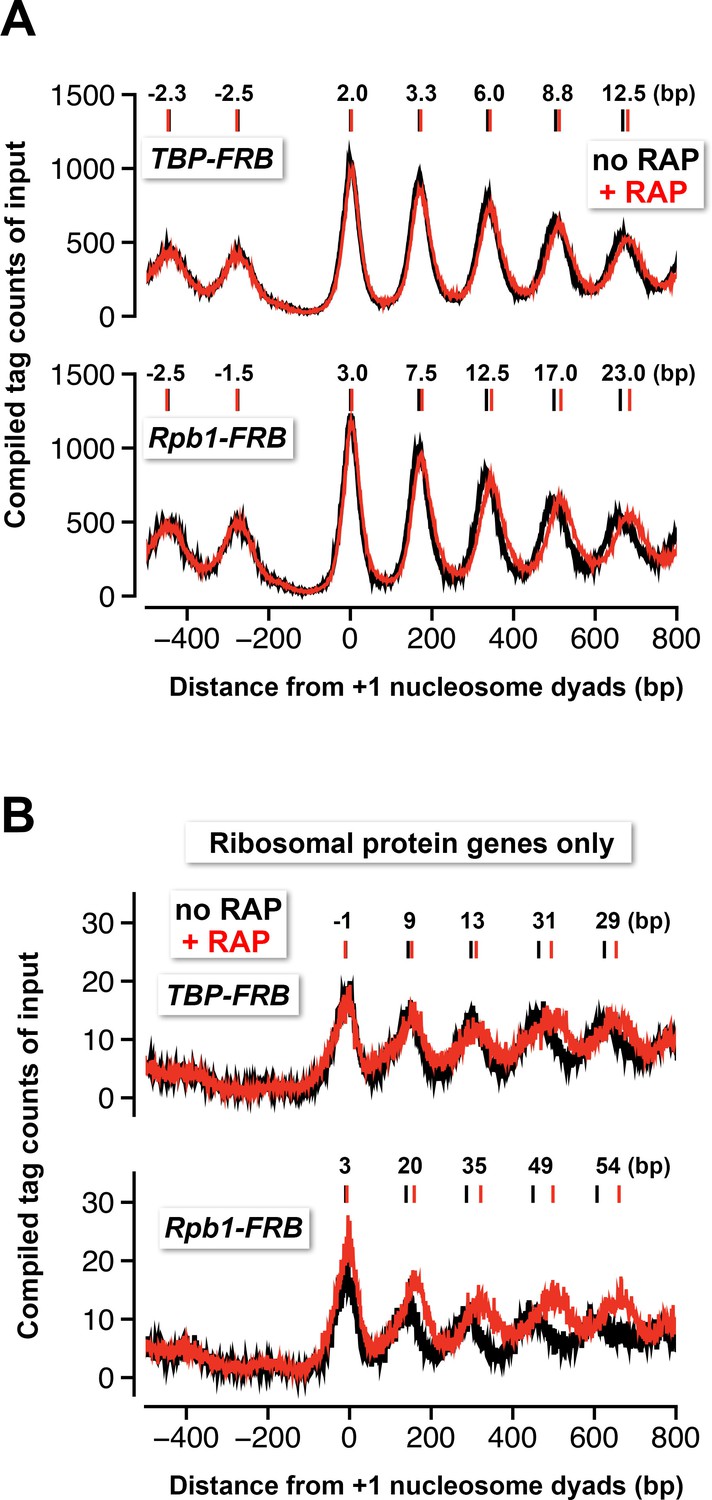
Nucleosomes shift away from the NDR in response to TBP and Rpb1 depletion.
(A) The compiled tag counts of the input nucleosomal fraction (n = 4,738) before (black) and after (red) nuclear depletion of TBP-FRB (top) and Rpb1-FRB (bottom) were re-plotted using the data from Figure 1 and Figure 1C—figure supplement 8B. The integers above the nucleosomal peaks indicate shift distance after rapamycin treatment. Peak center positions were determined as described in Figure 4D. (B) Same as (A) except that the compiled data of the ribosomal protein genes (n = 128) are shown.
Figure 6 with 1 supplement
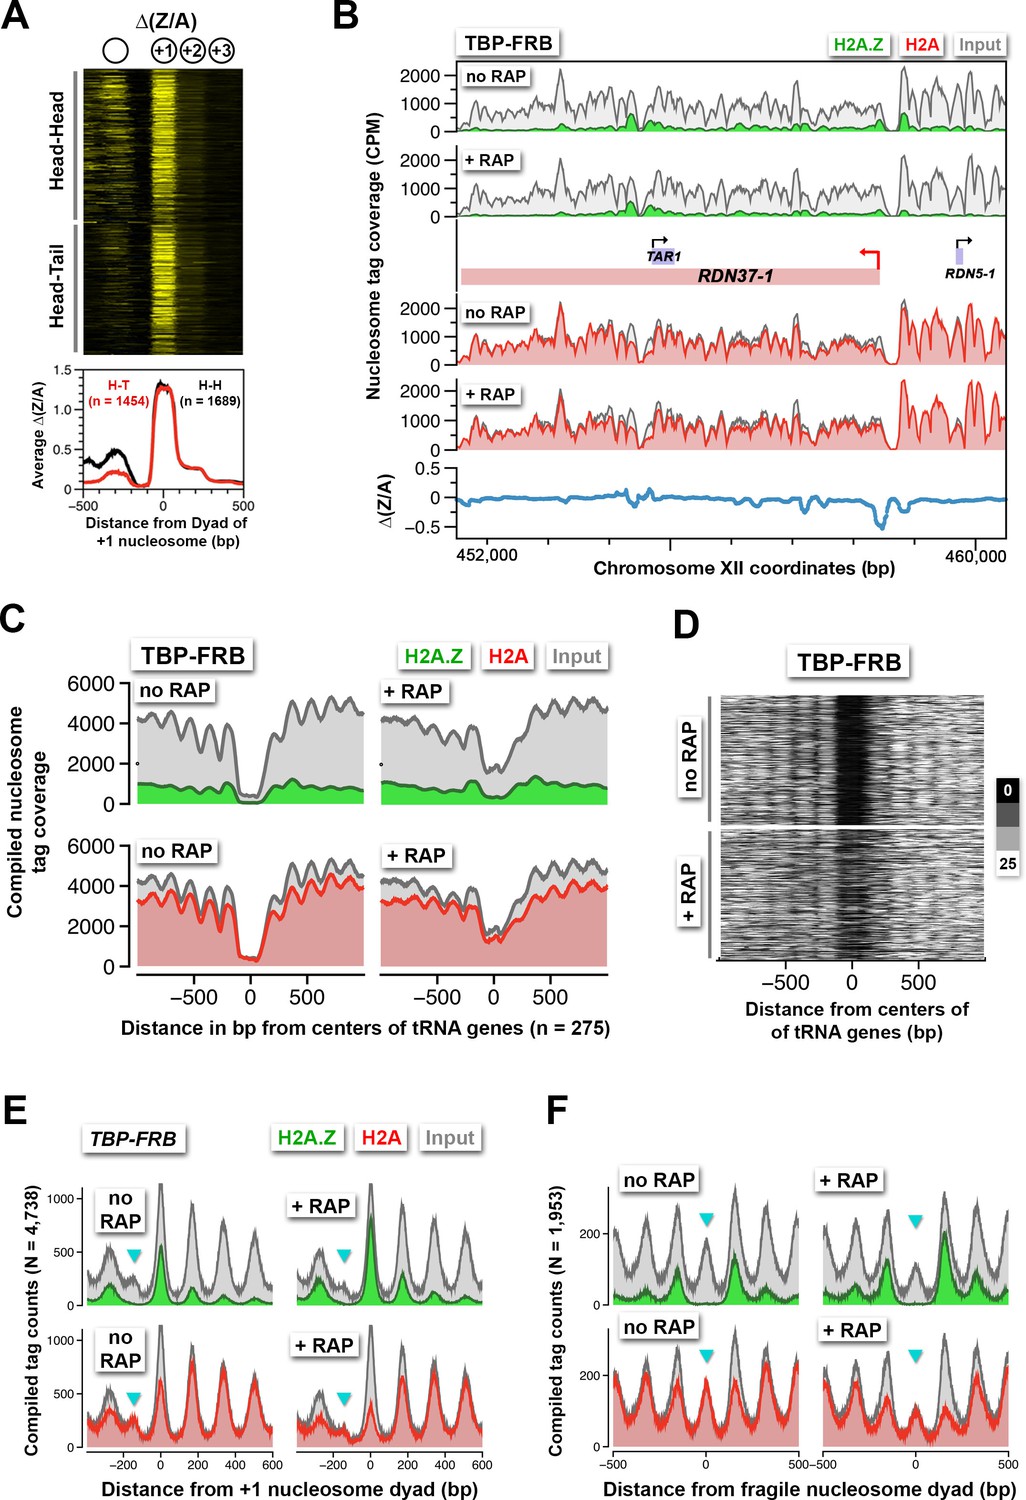
Rapid H2A.Z dynamics is restricted to the +1 nucleosomes of Pol II promoters, not to -1 nucleosomes or fragile nucleosomes.
(A) A heatmap showing the ∆(Z/A) values of TBP-FRB around the +1 dyads of 3,143 promoters sorted by the orientation of the upstream gene. Head-Head (H-H): promoters with an upstream gene oriented divergently. Head-to-tail (H-T): oriented in tandem. (B) Normalized H2A.Z, H2A, and input nucleosome tag coverage around the repetitive RDN1 locus. A red arrow marks the TSS of the Pol I-controlled RDN37-1 promoter. (C) Compiled tag coverage of 275 tRNA genes with and without rapamycin treatment. (D) Heat maps of input nucleosomes around the center of tRNA genes. (E) Nucleosome profiles of under-digested chromatin from the TBP-FRB strain centered at the dyad of the +1 nucleosomes. Cyan triangles mark the peak of fragile nucleosomes. (F) Same as (E) except the profiles were aligned at the dyad of fragile nucleosomes (Kubik et al., 2015).
-
Figure 6—source data 1
Nucleosome tag profiles around the +1 dyads for the under-digested TBP-FRB chromatin sample in (E).
- https://doi.org/10.7554/eLife.14243.039
-
Figure 6—source data 2
A list of -1 nucleosomes that are flanked by two +1 nucleosomes.
- https://doi.org/10.7554/eLife.14243.040
Figure 6—figure supplement 1

Compiled nucleosome tag coverage of 44 divergent promoters in TBP-FRB with a bona fide -1 nucleosome flanked by +1 nucleosomes.
Tag coverage instead of tag mid-point was plotted to smooth the data.
Figure 7 with 1 supplement
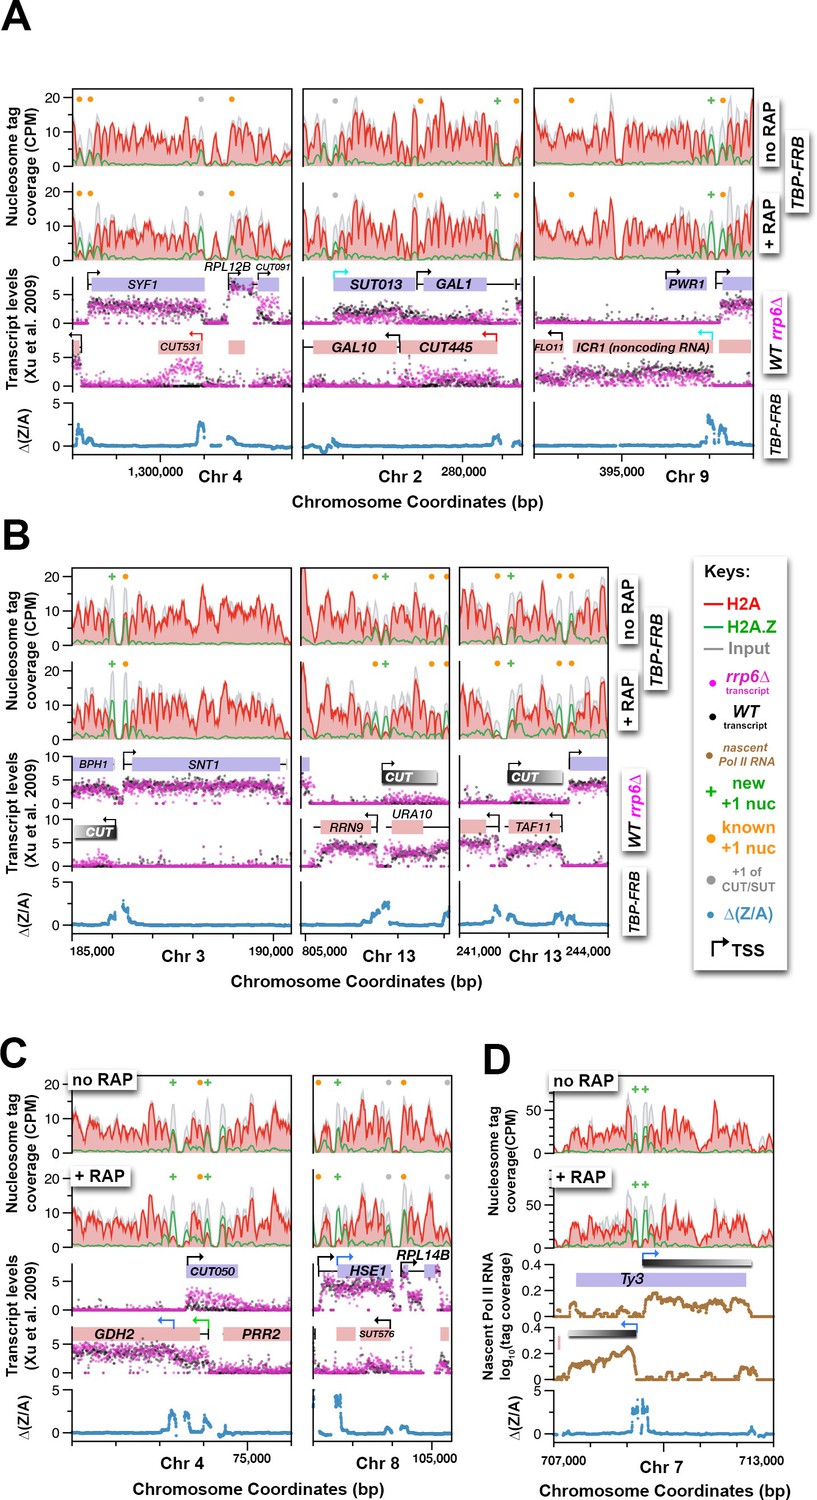
Using H2A.Z dynamics before and after TBP depletion to identify cryptic and alternative transcription start sites.
(A) Genomic regions highlighting representative CUTs and noncoding RNAs, e.g. CUT531, SUT013, CUT445, and ICR1. Transcript data of wild-type (black) and rrp6∆ (purple) strains are from (Xu et al., 2009). (B) H2A.Z dynamics around subtle cryptic transcription start sites. Gray bars: unannotated CUTs. (C) Start sites masked by upstream transcripts were revealed by strong H2A.Z dynamics (blue arrows). (D) The cryptic divergent promoters within the coding region of a Ty3 element. Brown traces: Nascent Pol II RNA tag coverage. Orange dots: previously annotated +1 nucleosomes of protein coding genes (Rhee et al., 2014; Kubik et al., 2015). Gray dots: +1 nucleosomes of CUTs and SUTs. Green ‘+’ signs: new +1 nucleosomes.
-
Figure 7—source data 1
Novel and previously annotated +1 nucleosomes identified by PIC-dependent H2A.Z dynamics.
- https://doi.org/10.7554/eLife.14243.043
Figure 7—figure supplement 1

Identification of novel +1 nucleosomes using the ∆(Z/A) parameter associated with TBP depletion.
The ∆(Z/A) profiles around the dyads of 61,568 annotated nucleosomes (Jiang and Pugh, 2009; Kubik et al., 2015) were sorted by k-means clustering (k = 4). Nucleosomes with robust, symmetrically distributed ∆(Z/A) signals were selected. The procedure was reiterated once with the remaining nucleosomes (n = 56,193) with weaker ∆(Z/A) signals. (B) Venn diagram showing the overlap of +1 nucleosomes identified by the clustering analysis and known +1 nucleosomes of protein coding and noncoding gene (Jiang and Pugh, 2009; Kubik et al., 2015). (C) Pol II nascent RNA-seq data highlighting the genomic region around the HSE1 gene. (D) Standard RNA-seq analysis of mRNA of a wild-type strain in the S288C (BY4741) background.
Figure 8
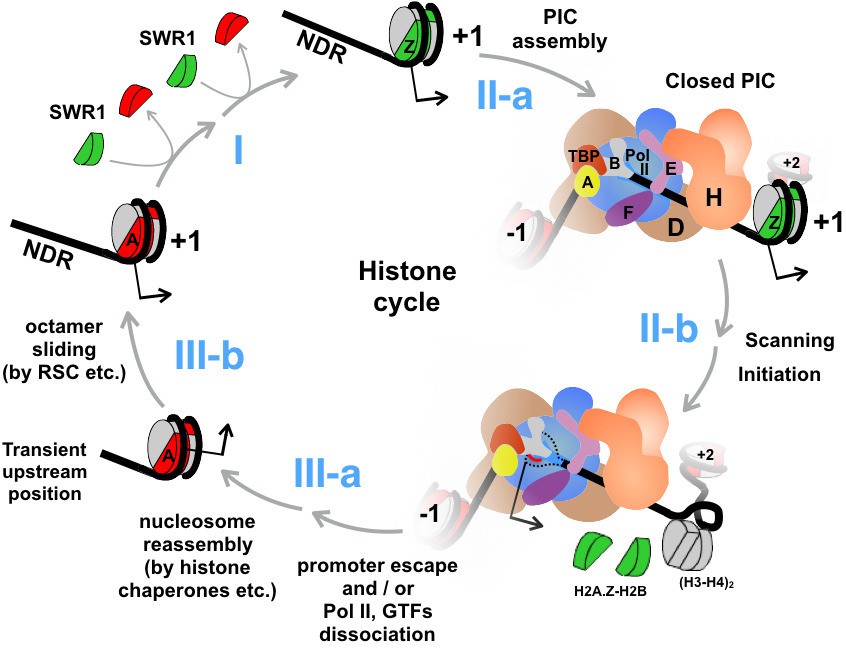
An updated histone cycle model.
Step I: The SWR1 complex is recruited to the NDR and replaces the two nucleosomal H2A-H2B dimers with H2A.Z-H2B dimers. The H2A.Z-H2B dimers are always bound by histone chaperones in vivo but is omitted here for simplicity (Luk et al., 2007). Step II-a: Assembly of the PIC at NDR adjacent to the +1 H2A.Z nucleosome. General transcription factors are identified with single letters for simplicity. The model of PIC was adapted from (Sainsbury et al., 2015) Step II-b: The PIC engages the H2A.Z nucleosome. Dotted black lines depict the unstructured ssDNA, which is not drawn to scale. Red line depicts the nascent RNA. Black arrow indicates the transcription start site (TSS). (H3-H4)2 tetramers are in gray, H2A.Z-H2B dimers in green, and H2A-H2B dimers in red. Step III-a: After the dissociation of Pol II and GTFs from the promoter, a canonical H2A nucleosome reassembles over the TSS but at an imprecise position that is likely too upstream of the TSS. Step III-b: Chromatin remodelers, such as RSC, slide the octamer downstream to the stereotypic +1 position completing the histone cycle.
Additional files
-
Supplementary file 1
Table of yeast strains used in this study.
- https://doi.org/10.7554/eLife.14243.046
-
Supplementary file 2
Table of primers used in ChIP-qPCR analyses.
- https://doi.org/10.7554/eLife.14243.047
-
Supplementary file 3
The visualization tool used to verify the normalization process.
- https://doi.org/10.7554/eLife.14243.048
-
Supplementary file 4
Detailed instructions on how to use the TAZ normalization script and the visualization tool.
- https://doi.org/10.7554/eLife.14243.049
-
Supplementary file 5
An example of the INFILE of the python script corresponding to the raw data of a TBP-FRB + RAP replicate.
- https://doi.org/10.7554/eLife.14243.050
-
Supplementary file 6
An example of the INFILE of the python script corresponding to the raw data of a TBP-FRB no RAP replicate.
- https://doi.org/10.7554/eLife.14243.051
-
Source code 1
The Python script used to perform TAZ normalization.
- https://doi.org/10.7554/eLife.14243.052
Download links
A two-part list of links to download the article, or parts of the article, in various formats.
Downloads (link to download the article as PDF)
Open citations (links to open the citations from this article in various online reference manager services)
Cite this article (links to download the citations from this article in formats compatible with various reference manager tools)
Constitutive turnover of histone H2A.Z at yeast promoters requires the preinitiation complex
eLife 5:e14243.
https://doi.org/10.7554/eLife.14243


