PROP1 triggers epithelial-mesenchymal transition-like process in pituitary stem cells
- University of Michigan, United States
Figures
Figure 1
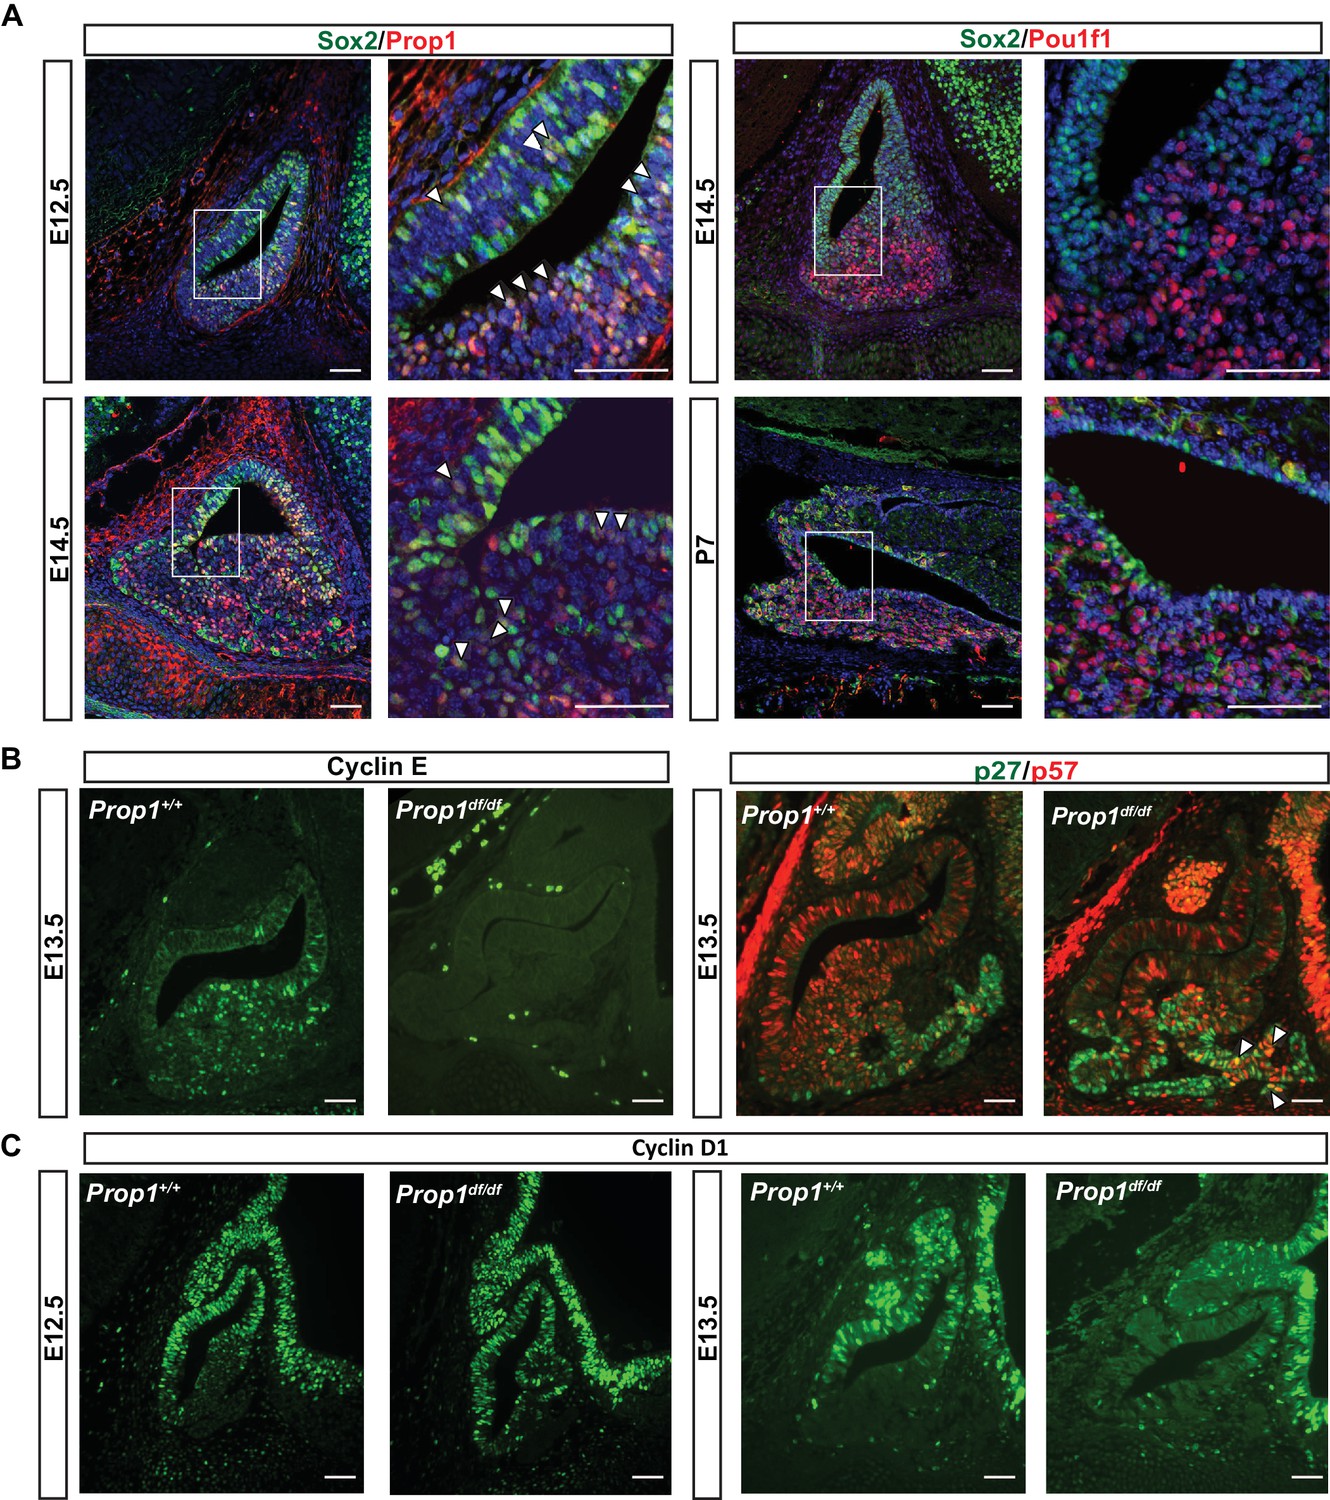
PROP1 is expressed in pituitary stem cells and is necessary for cell cycle regulation.
(A) Left Panel: Double immunofluorescence reveals co-staining of PROP1 (red) and SOX2 (green) at e12.5 in the dorsal and ventral areas of Rathke’s pouch (arrowheads). At e14.5 less co-localization was observed (arrowheads). Right Panel: Nuclear expression of SOX2 (green) and POU1F1 (red) is mutually exclusive during development (e14.5) and afterbirth (P7). Cell nuclei were stained with DAPI (blue). (B) Immunofluorescence was performed on embryonic sections of Prop1df/df and normal controls at e13.5 with a primary antibody for CYCLIN E (green). No CYCLIN E expression was detected in the developing pituitary glands of mutants. At e13.5 there are more cells double positive for p27kip1 (green) and p57kip2 (red) in the Prop1dfdf relative to Prop1+/+ (arrowheads). (C) Immunofluorescence reveals no changes in CYCLIN D1 expression at e12.5 but a decreased level later in development of Prop1df/df pituitaries compared to controls. Scale bars 100 µm.
Figure 2 with 1 supplement
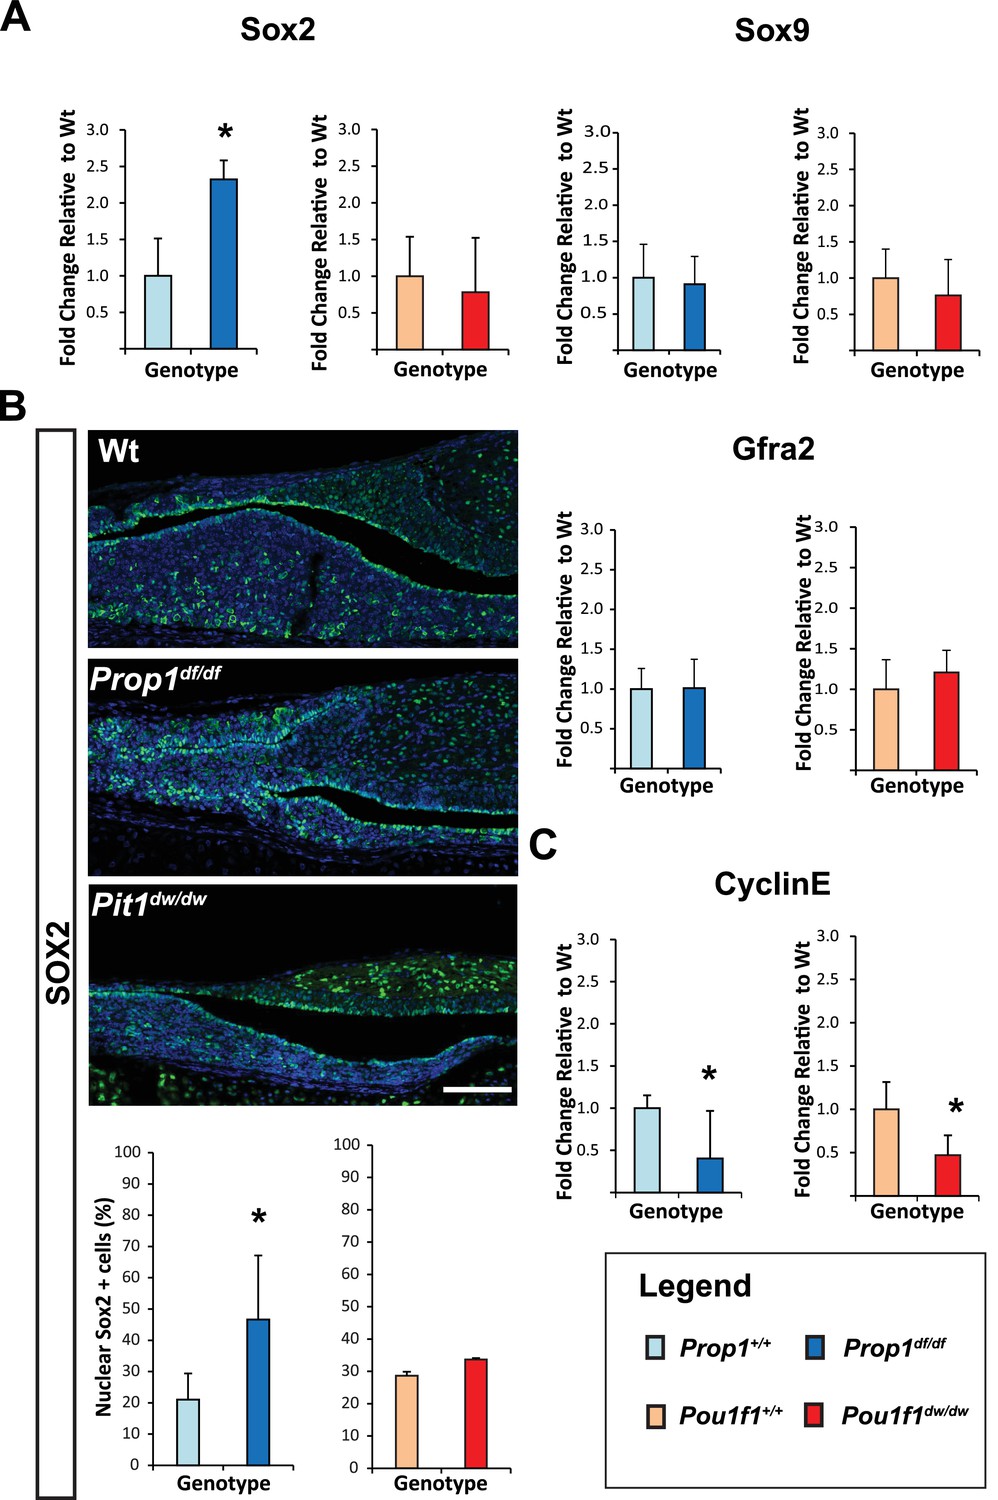
Loss of Prop1 but not Pou1f1 results in increased SOX2 expression at P7.
(A) Sox2 mRNA levels are increased in whole pituitaries of Prop1df/df mice at P7 relative to controls. No changes were observed in Pou1f1 mutant P7 pituitaries. Sox9 and Gfra2 mRNA levels are similar in whole pituitaries of Prop1df/df, Pou1f1dw/dw and control pituitaries at p7 (N = 3). Samples were normalized to GAPDH. One-way ANOVA (OWA) and * indicates p<0.05 relative to control. (B) SOX2 is expressed in postnatal pituitaries (P7) in cells lining the pituitary cleft and also in the parenchyma of the anterior lobe in mutant and control mice. Immunofluorescence detection of SOX2 (green) was performed on coronal pituitary sections of wild type, Prop1df/df and Pou1f1dw/dw mice. An increase in SOX2 expression was detected only in Prop1 mutant pituitaries. Cell nuclei were stained with DAPI (blue). Scale bars: 100 µm. The charts represent the percentage of cells that immunostain for the indicated marker, N = 5. One-way ANOVA (OWA) and * indicates p<0.05 relative to control. (C) Cyclin E mRNA levels are decreased in Prop1df/dfand Pou1f1dw/dwP7 pituitaries (N = 5). Samples were normalized to GAPDH. OWA and * indicates p<0.05 relative to control.
Figure 2—figure supplement 1
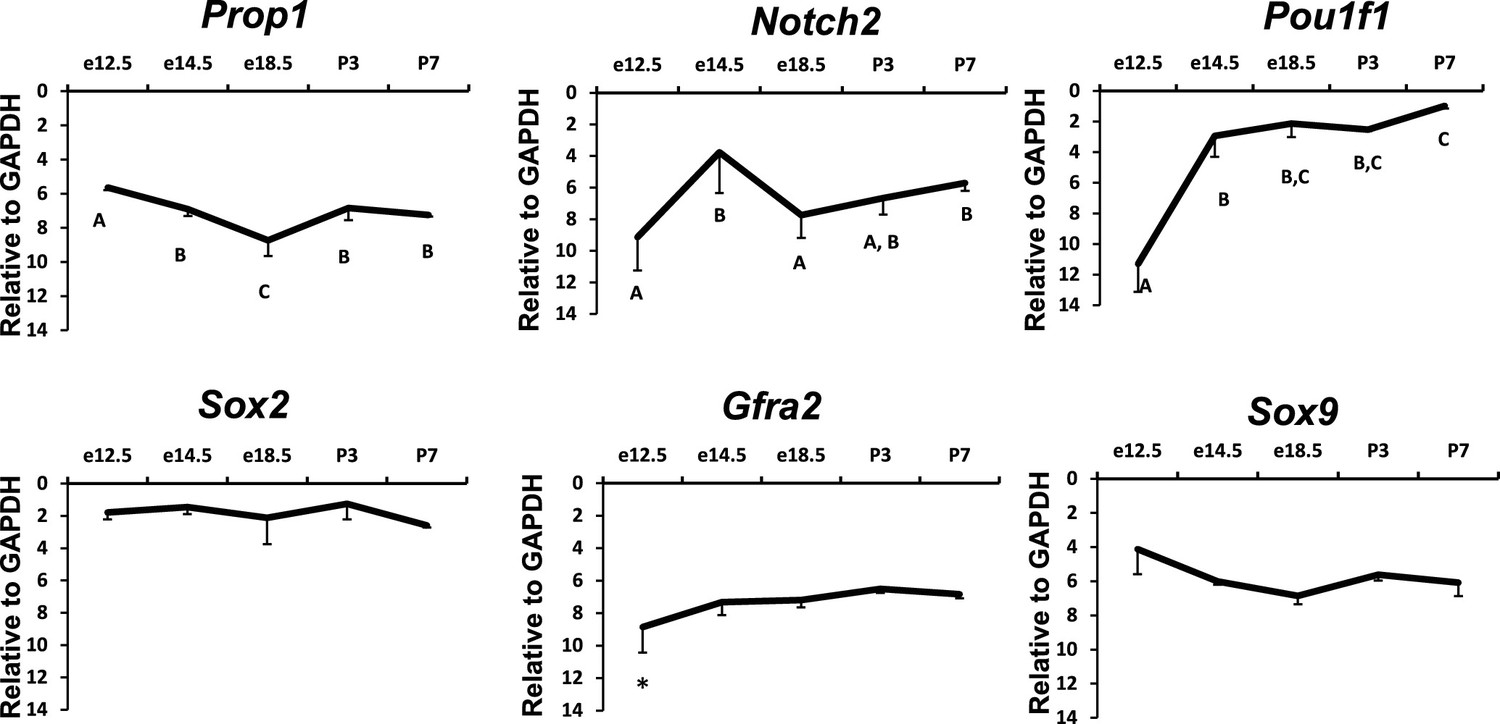
Temporal expression patterns of Prop1, PROP1 targets and stem cell markers during pituitary development.
Relative mRNA levels of Prop1, Notch2, Pit1, Sox2, Gfra2 and Sox9 in pituitaries of wild-type mice (n=7) were determined by semi-quantitative real-time PCR at different time points (e12.5, e14.5, e18.5 and postnatal day 3 and 7). ANOVA, post hoc Fisher analysis: letters and *show a statistically significant difference, p<0.05. Samples were normalized to GAPDH mRNA. Plots denote the mean ± SEM.
Figure 3 with 1 supplement
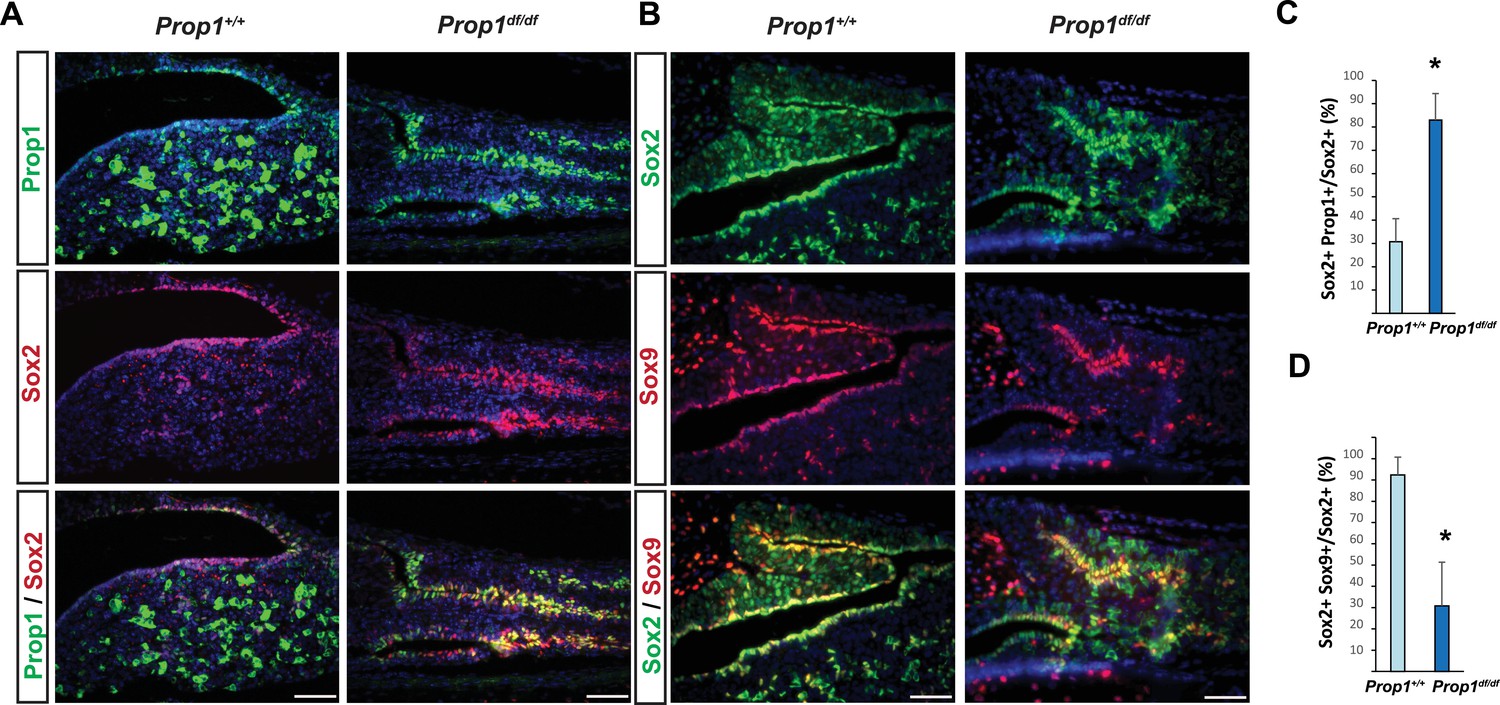
Prop1 regulates Sox2+ stem cell population.
Double immunofluorescence labeling of PROP1 and SOX2 (A) and SOX2 and SOX9 (B) in wild-type control and Prop1 mutants at P3. (C) Quantification SOX2+, PROP1+ cells among SOX2+ cells in the marginal zone in control and mutants. (D) Quantification SOX2+, SOX9+ cells among SOX2+ cells in the marginal zone in control and mutants. Data are represented as mean ± SEM (n = 3 mice, *p<0.05). Scale bars, 50 µm.
Figure 3—figure supplement 1

Immunofluorescence for PROP1 on e12.5 sagittal sections.
Immunostaining with specific antibody against PROP1 in wild-type and Prop1-/- embryos. Cell nuclei were stained with DAPI (blue).
Figure 4 with 1 supplement
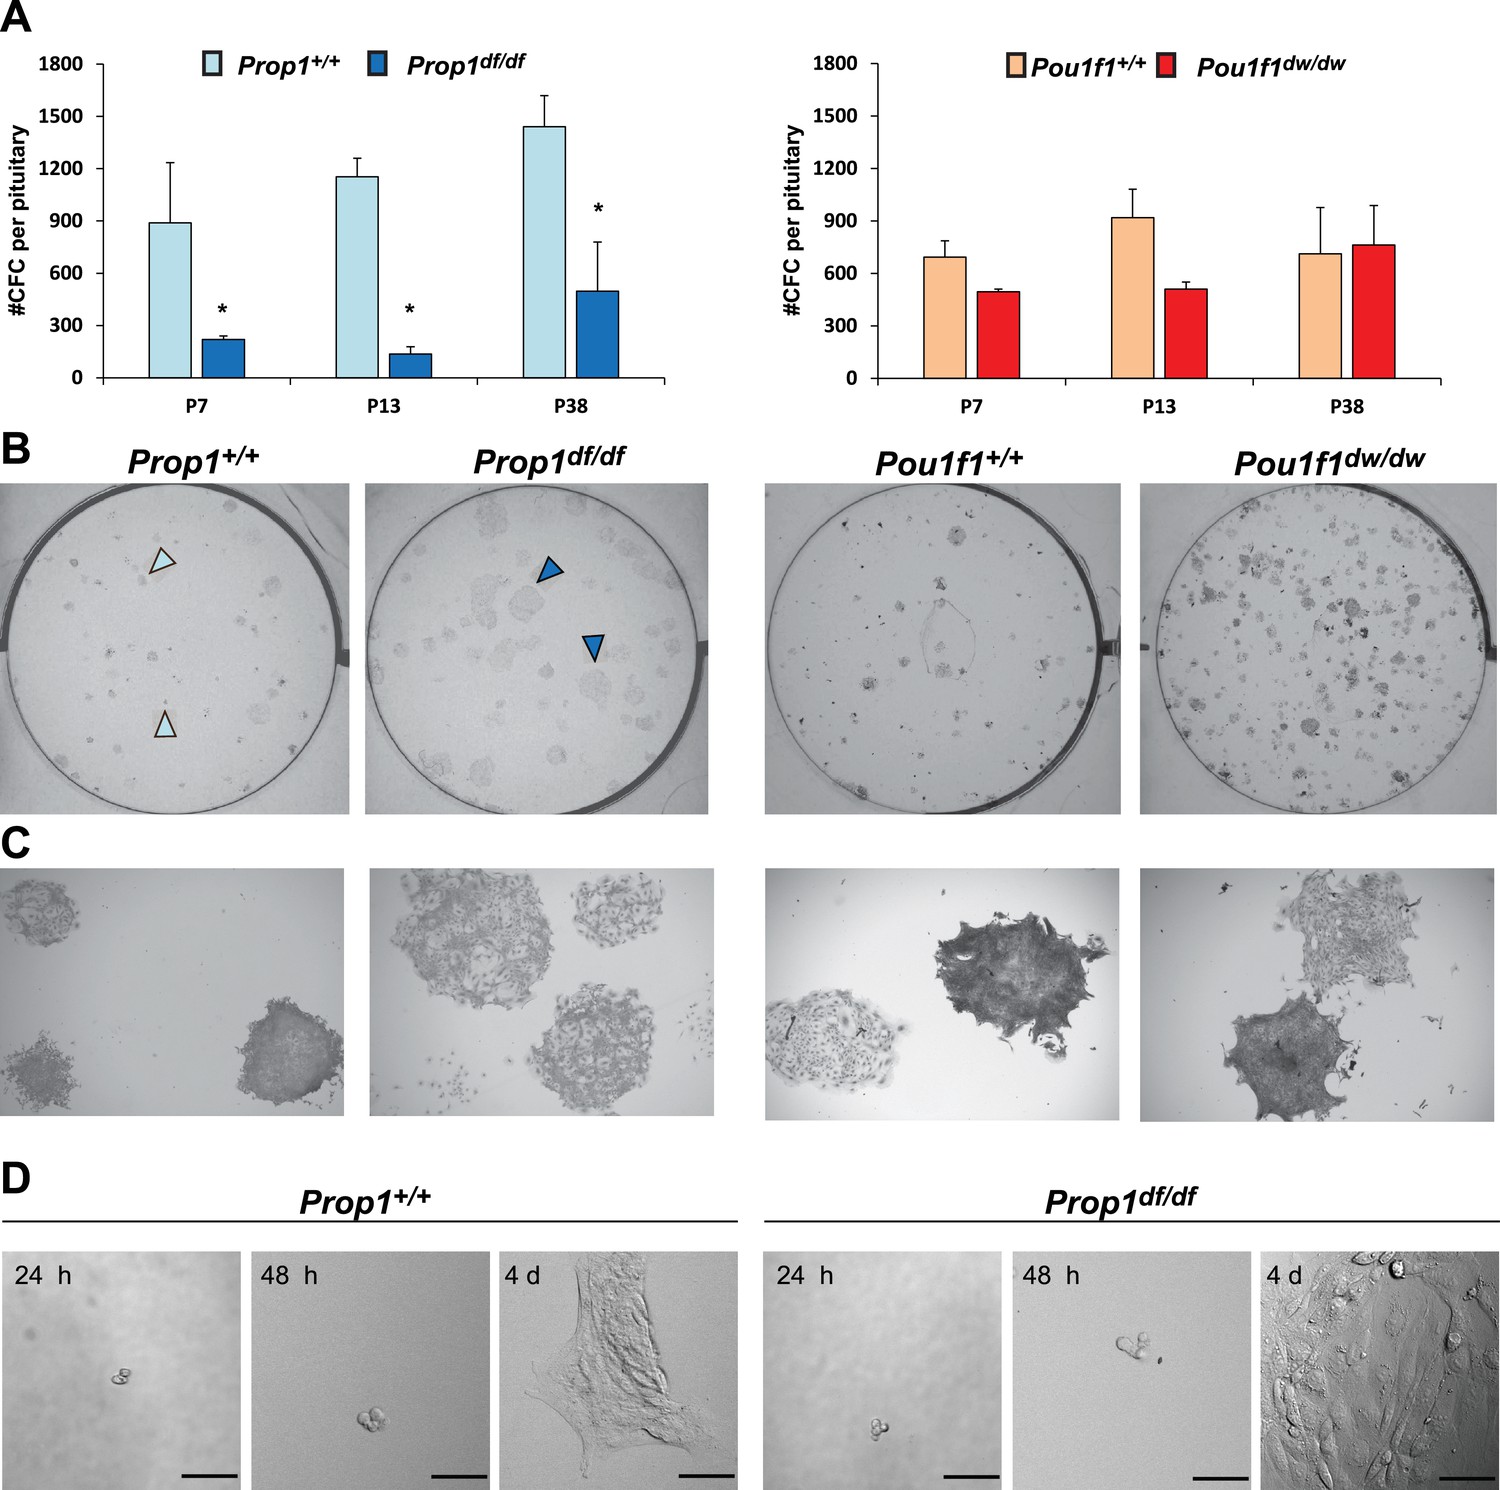
Prop1 regulates pituitary stem cells after birth.
(A) Number of colony-forming cells per pituitary after 10 days in culture (N = 3–6 pituitaries per stage). Two-way ANOVA *p<0.05 for Prop1df/df vs aged matched Prop1+/+ littermates, post hoc Fisher analysis. Plots denote the mean ± SEM and * indicates p<0.05 relative to control. (B and C) Pictures of the tissue culture plates showing colonies from Prop1 (left) and Pou1f1 (right) mutant pituitaries fixed and stained, show the different morphology of colonies from Prop1df/df pituitaries (arrowheads). (C) Photos taken at higher magnification, 2x. (D) Time lapse microscopy shows the formation of a colony from a single stem cell captured 24 hr after the cells were plated and 4 days later. Colonies from Prop1 mutant pituitaries have an altered morphology since the colony formation starts around day 4. Scale bar 100 µm. See also Figure 4—figure supplement 1.
Figure 4—figure supplement 1
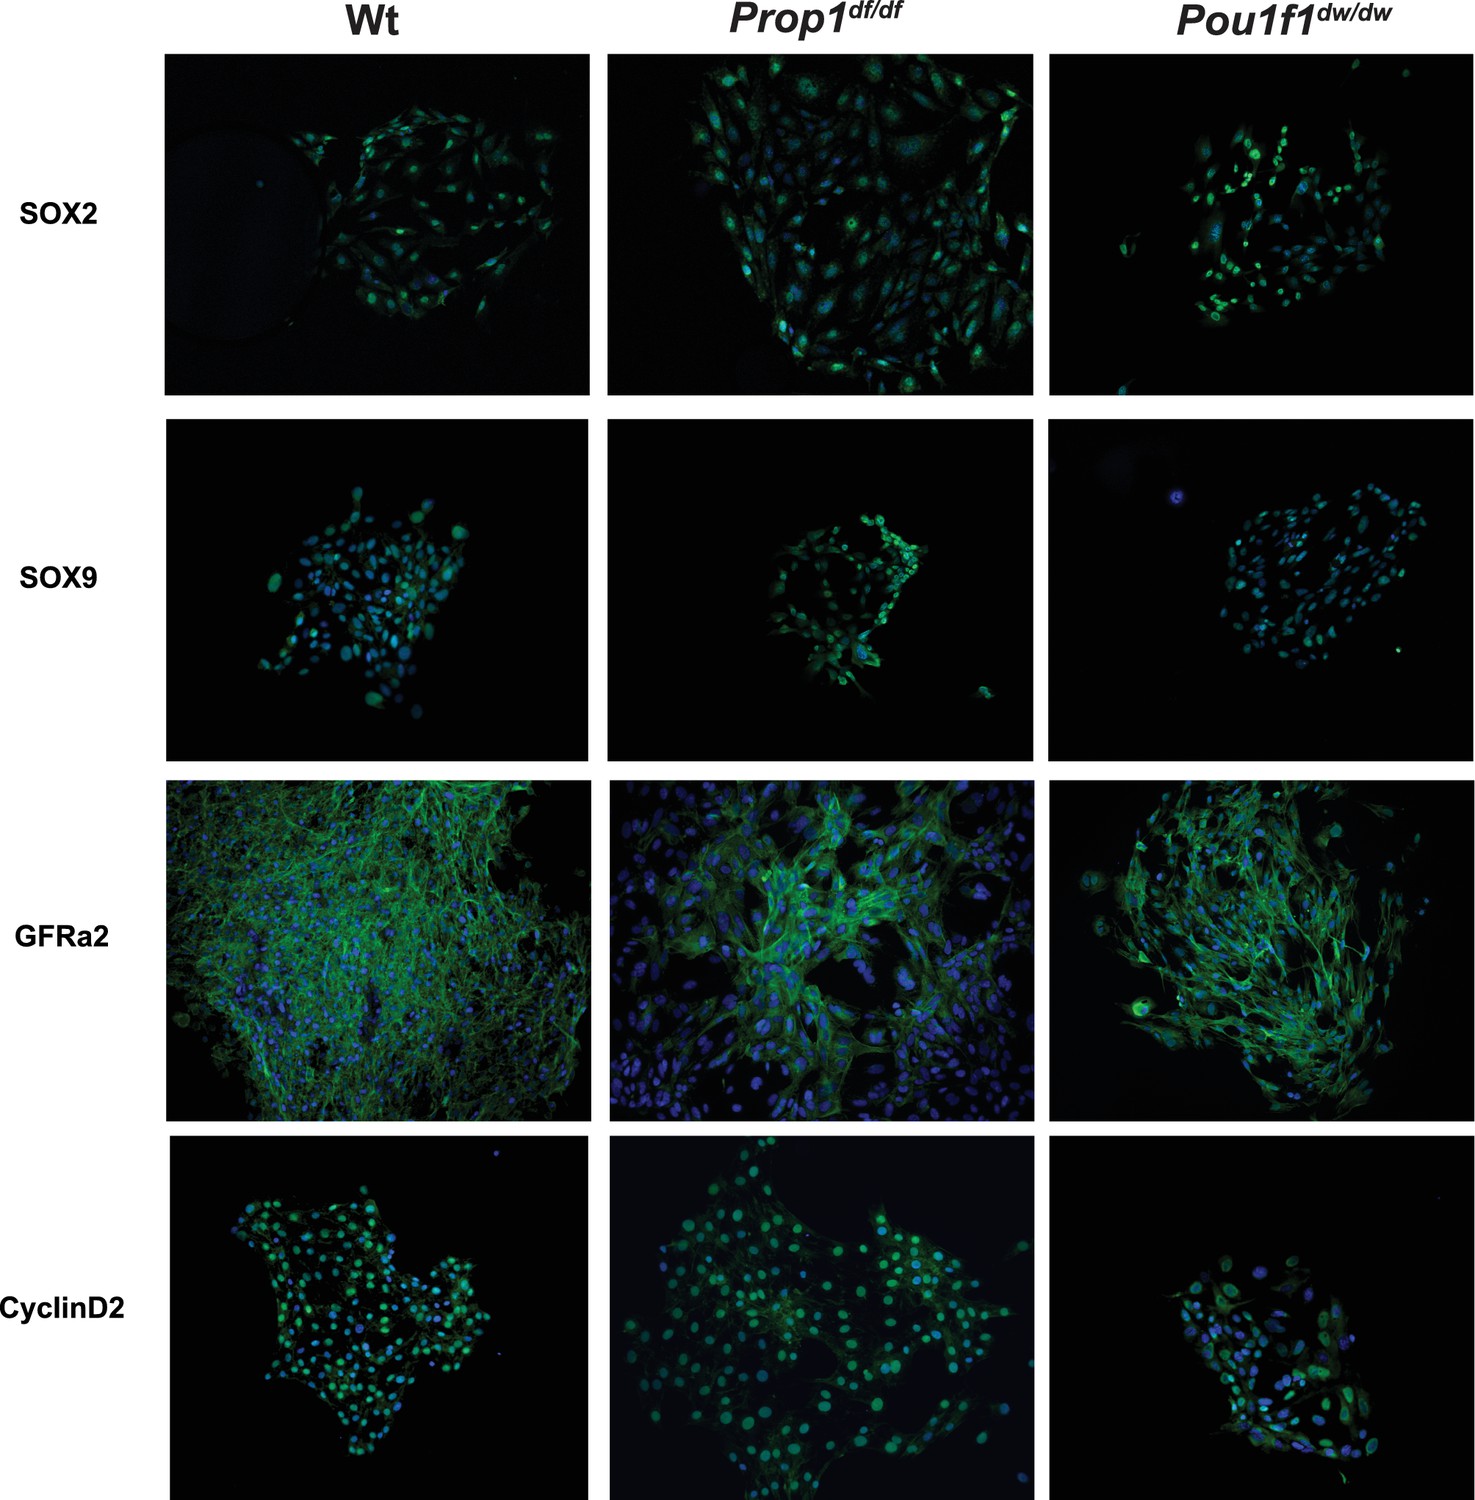
Pituitary stem-cell-derived colonies from Prop1 and Pou1f1 mutant pituitaries.
Immunostaining with specific antibodies performed on fixed colonies show expression of stem cell markers, SOX2, SOX9 and GFRa2 and CYCLIN D2. No differences were found between genotypes. Cell nuclei were stained with DAPI (blue).
Figure 5
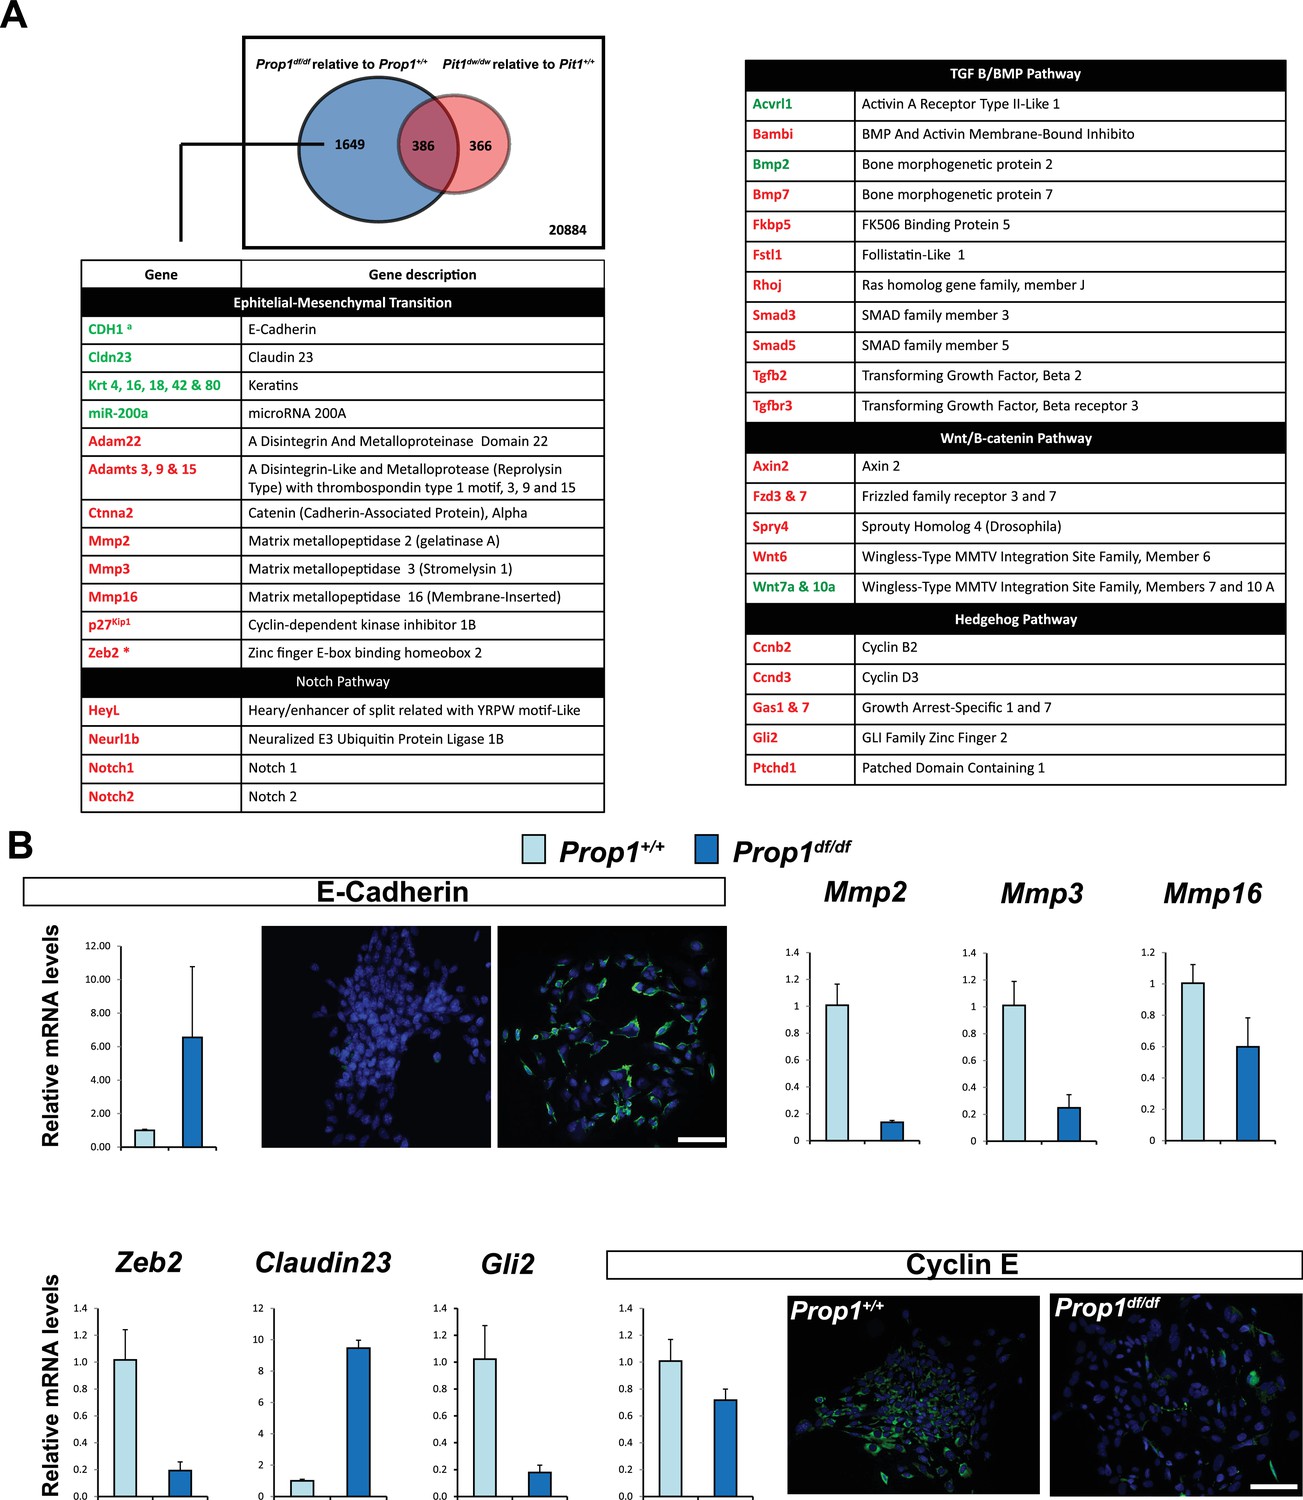
Differential gene expression in Prop1df/df and Pou1f1dw/dw pituitary stem-cell-derived colonies at P13.
(A) A Venn diagram illustrates the total number of genes with significantly different expression in Prop1 mutants relative to their wild-type littermates (blue circle) and Pou1f1 mutants relative to their wild-type counterparts (red circle). The table shows examples of genes up regulated (green) or down regulated (red) (p value ≤ 0.05, |log2FCΙ ≥ 1) uniquely in the Prop1 mutant colonies relative to Pou1f1 mutants. (B) RT-qPCR validation of RNA-Seq data. GAPDH was used as an internal control (N = 4) OWA and * indicates p<0.05 relative to control. Immunostaining for CDH1 shows an increased in protein expression on colonies from Prop1df/df pituitaries compare to control. CYCLIN E immunostaining reveals that Prop1+/+ colonies express this protein but is absent on Prop1df/df colonies. Cell nuclei were stained with DAPI (blue). Scale bar 100 µm. Plots denote the mean ± SEM. qPCRs were done using at least three technical replicates.
Figure 6
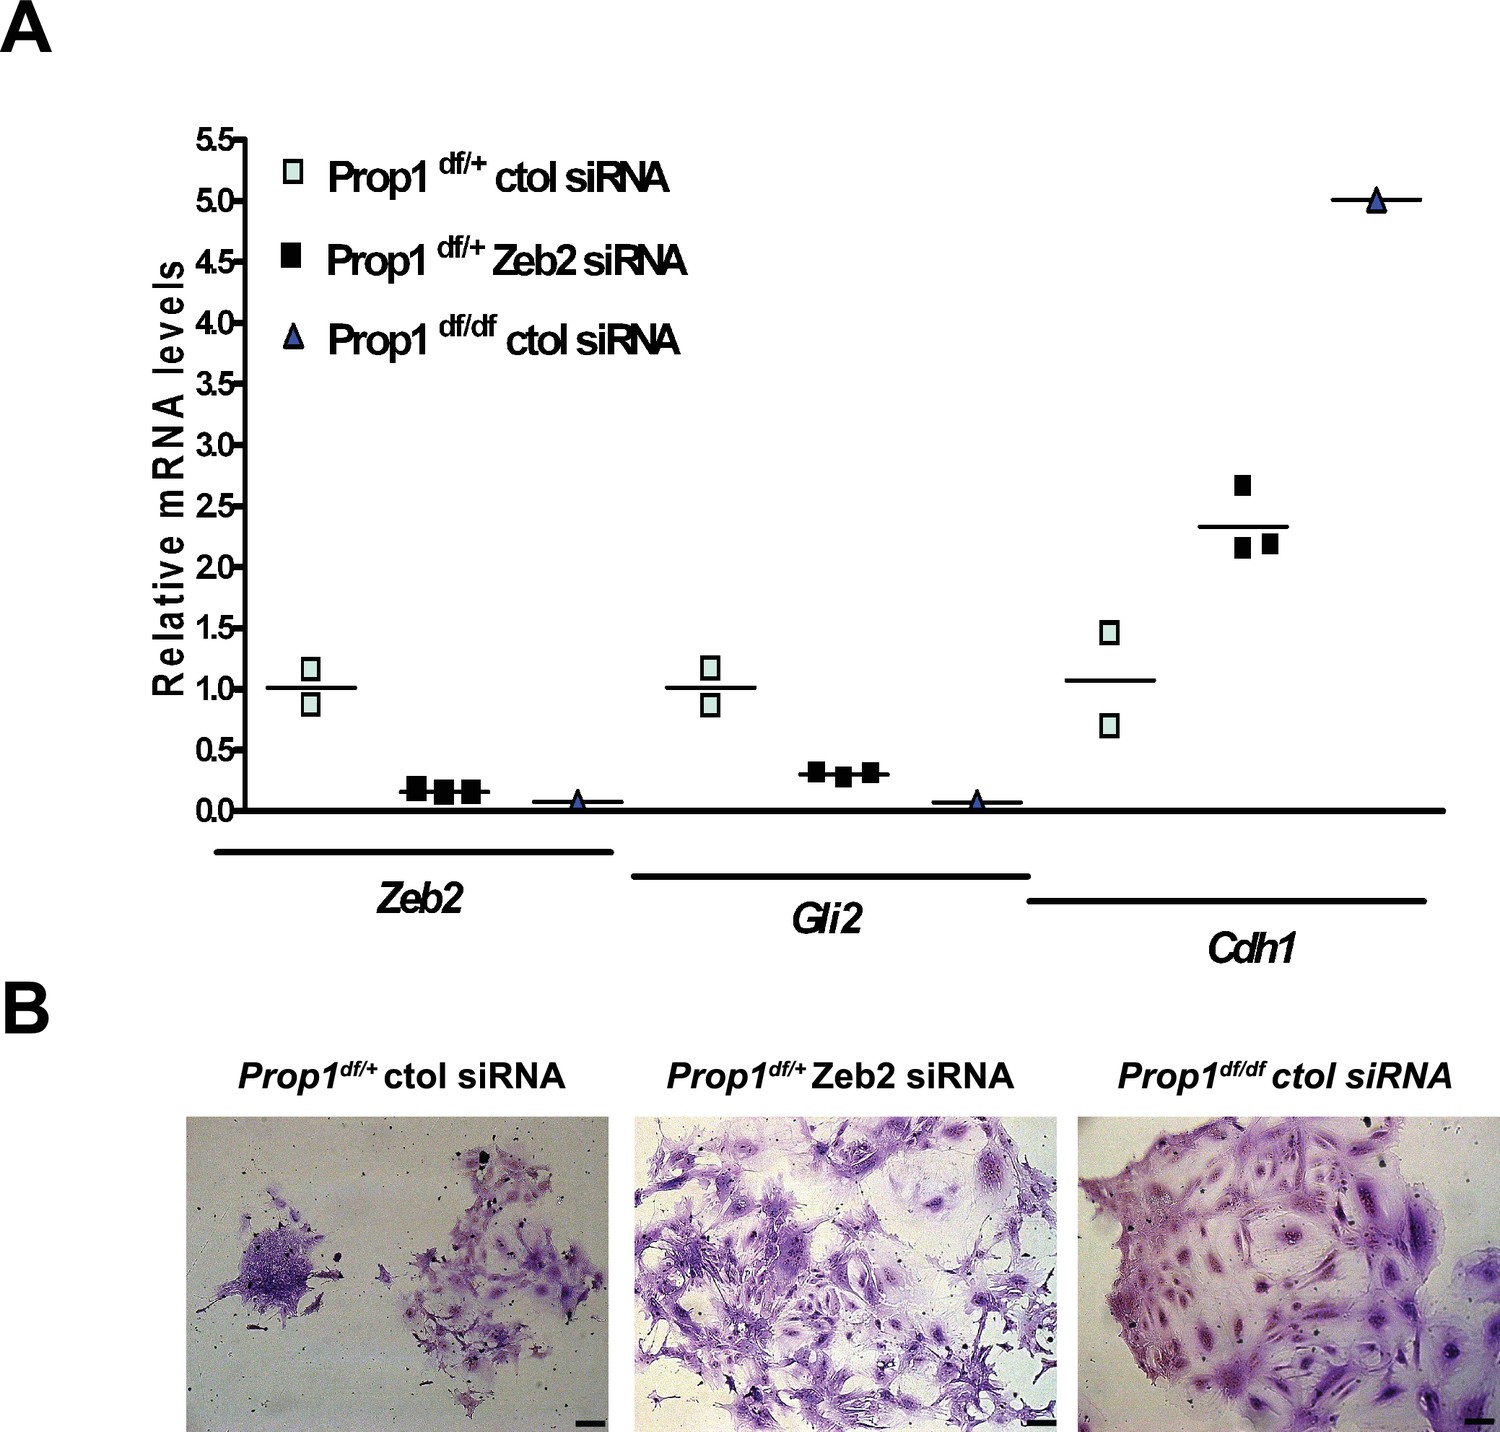
Zeb2 knockdown resemble colonies derived from Prop1 mutant mice.
(A) Zeb2, Gli2 and Cdh1 mRNA levels in colonies from Prop1df/+ and Prop1df/df pituitaries treated with Zeb2 siRNA and negative control siRNA (control). Samples were normalized to GAPDH. qPCRs were done using at least three technical replicates. (B) Pictures of the colonies from Prop1df/+ and Prop1df/df pituitaries fixed and stained, show the different morphology of colonies between control siRNA and treated with Zeb2 siRNA.
Figure 7
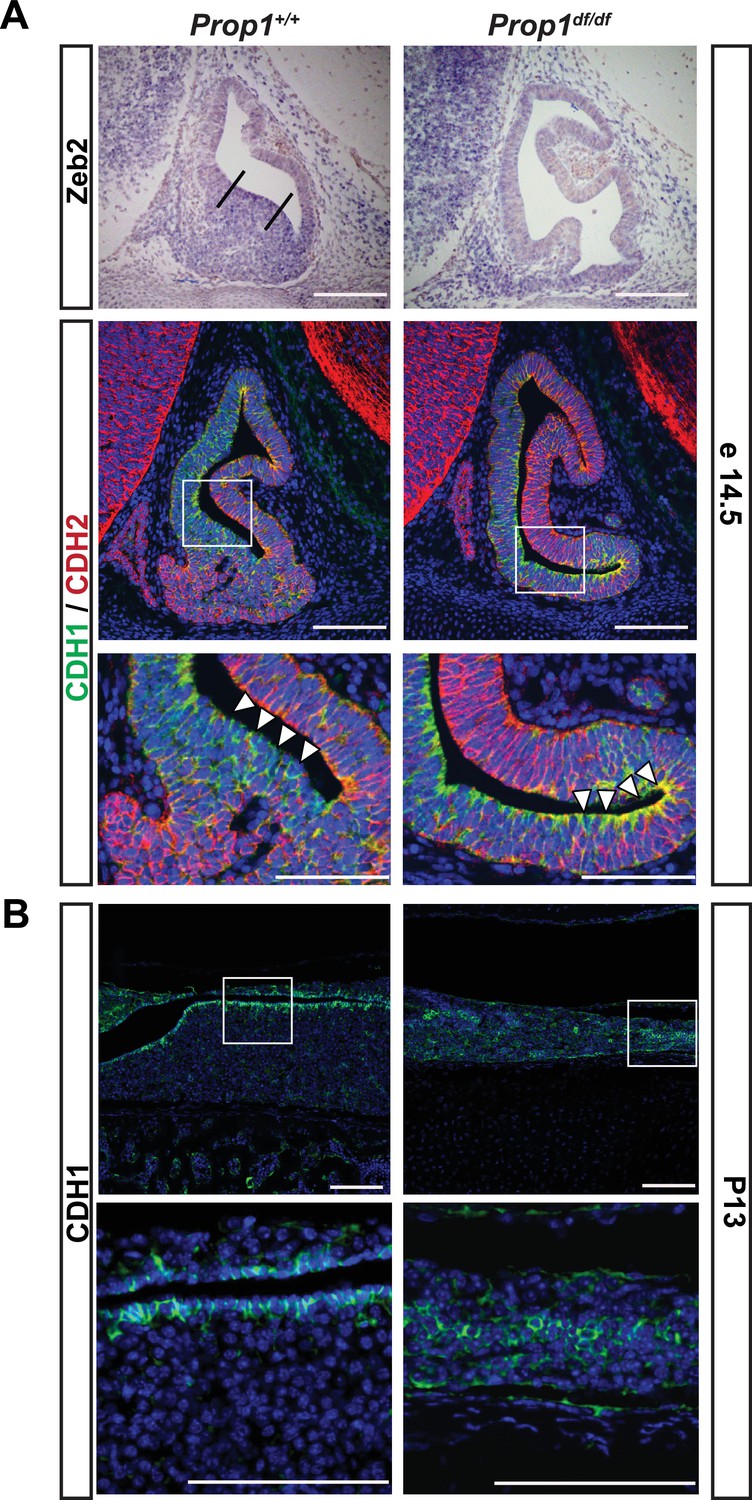
Loss of Prop1 affects EMT pathway genes in pituitary tissues.
(A) Upper panel:In situ hybridization using a Zeb2 antisense riboprobe at e14.5 detected expression in the control pituitary. Most of the positive cells are in the ventral area, around the cleft (between the lines). In Prop1df/df pituitaries very few cells are expressing Zeb2. Lower panel: Sagittal sections of 14.5 embryos were stained for CDH1 (green) and CDH2 (red) by immunohistochemistry. In the wild-type pituitary, CDH1 expression is dispersed throughout the Rathke’s Pouch, while CDH2 expression is more concentrated in the rostral area and in the forming anterior lobe. In Prop1 mutant pituitaries, CDH1 expression is increased and concentrated in the area ventral to the lumen, where Zeb2 expression was absent. White boxes indicate where higher magnification photos were taken. (B) Immunohistochemestry for CDH1 at P13 shows that Prop1df/df pituitaries have an expanded expression of this endothelial protein in the anterior lobe compared to control pituitaries. White boxes indicate where higher magnification photos were taken. Cell nuclei were stained with DAPI (blue). Scale bar 100 µm.
Figure 8 with 1 supplement
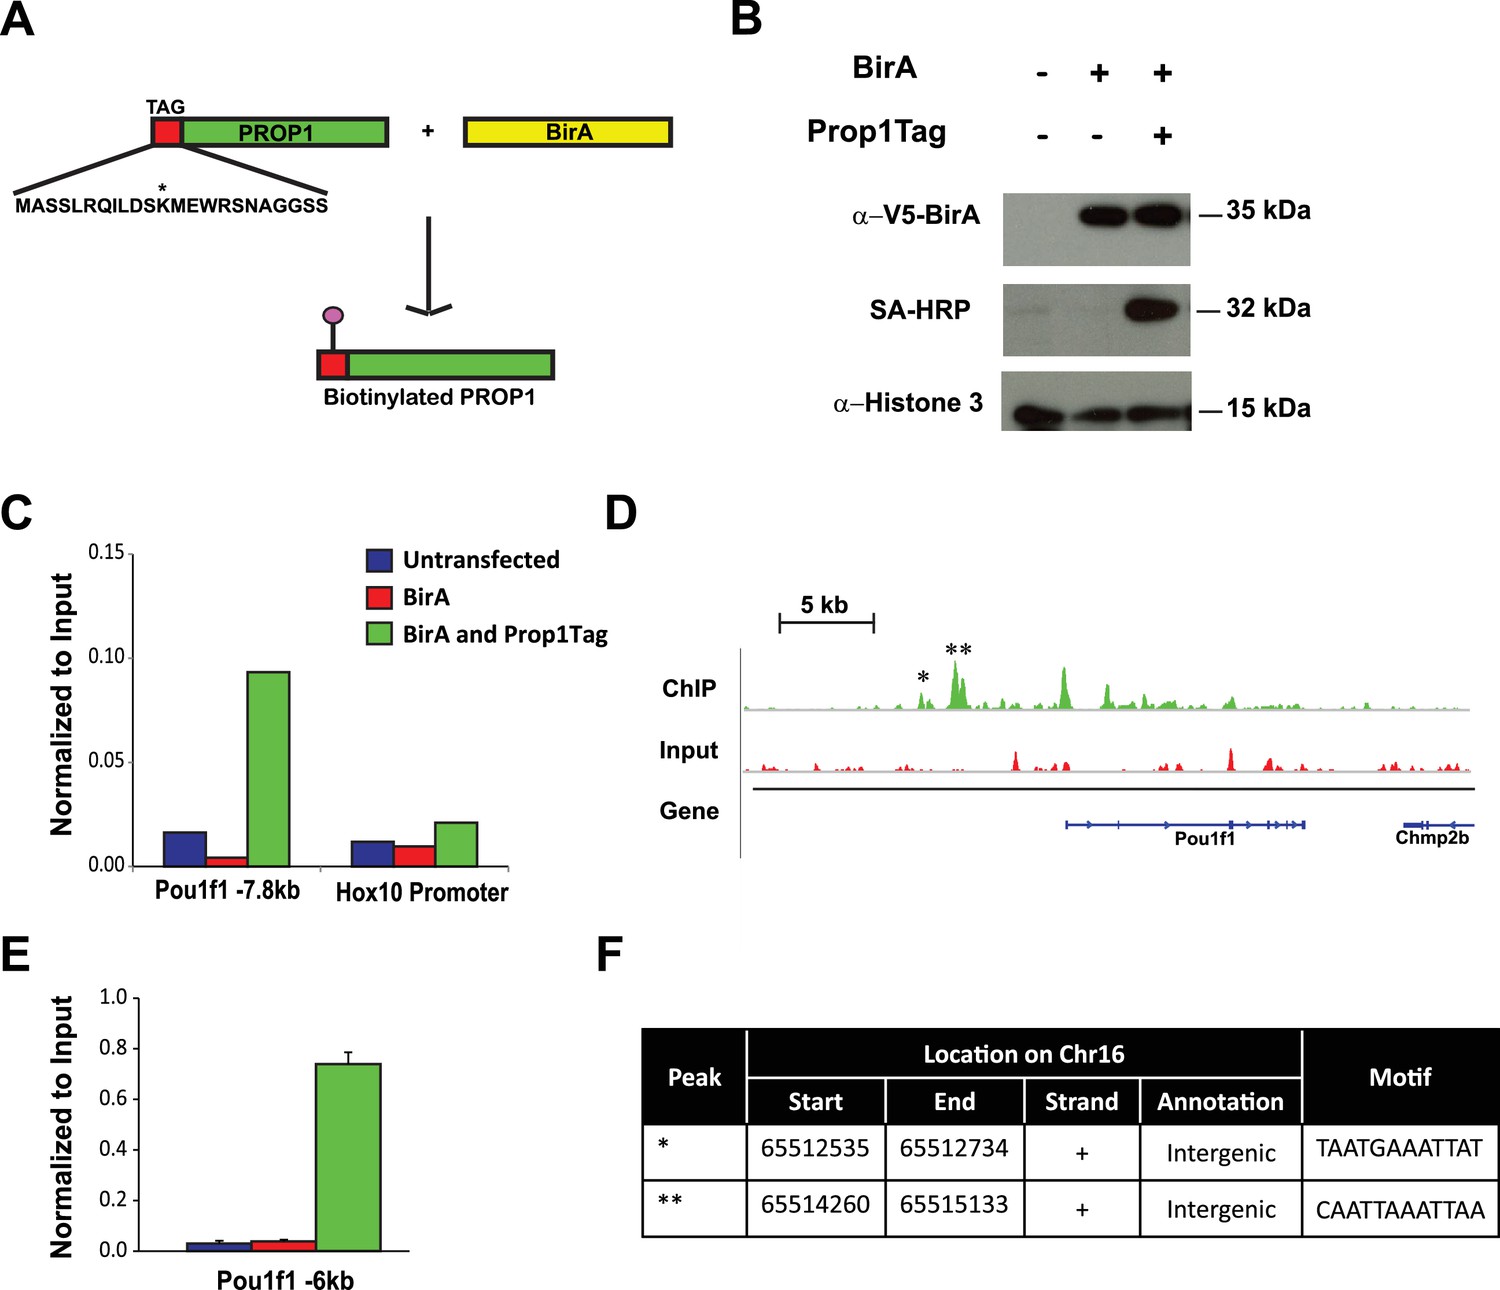
Streptavidin ChIP-Seq of biotinylated PROP1 in GHFT1 cells.
(A) Schematic diagram of biotin tagging system. The birA recognition motif tag (red) is shown fused to the amino terminus of PROP1. The biotin acceptor lysine (K) is indicated with *. (B) Western blot of protein extracts from GHFT1 cell clones expressing either BirA alone, or BirA and the recombinant Prop1Tag. Upper panel, probed with anti-alpha-V5 antibody for BirA detection; Middle panel, probed with streptavidin horse radish peroxidase (SA-HRP) and lower panel, probed with anti-Histone 3 antibody for protein loading control. (C) Quantitative ChIP assay at a known PROP1 occupancy site in the Pou1f1 promoter and a negative control site (Hoxd10 promoter) using streptavidin-based ChIP. (D) Streptavidin ChIP-Seq enrichment profiles for PROP1 at the Pou1f1 gene. The known peak at −7.8 kb is indicated with *. A novel peak at -6 kb is indicated with ** and (E) validated N = 3 OWA and * indicates p<0.05 relative to controls. Data are mean + SEM. Each ChIP experiment was repeated at least twice with similar results. (F) Table containing coordinates of the peaks at the Pou1f1 promoter and the motifs found in the peaks.
-
Figure 8—source data 1
RNA-Seq performed on GHFT1 BirA and GHFT1 BirA Prop1Tag cells (N = 3).
The table shows fkpm values for each sample. The authentication of this cell line was based on the expression of Gapdh as an internal control, Pou1f1, Cga, Prl, Gh and Tsh.
- https://doi.org/10.7554/eLife.14470.013
Figure 8—figure supplement 1
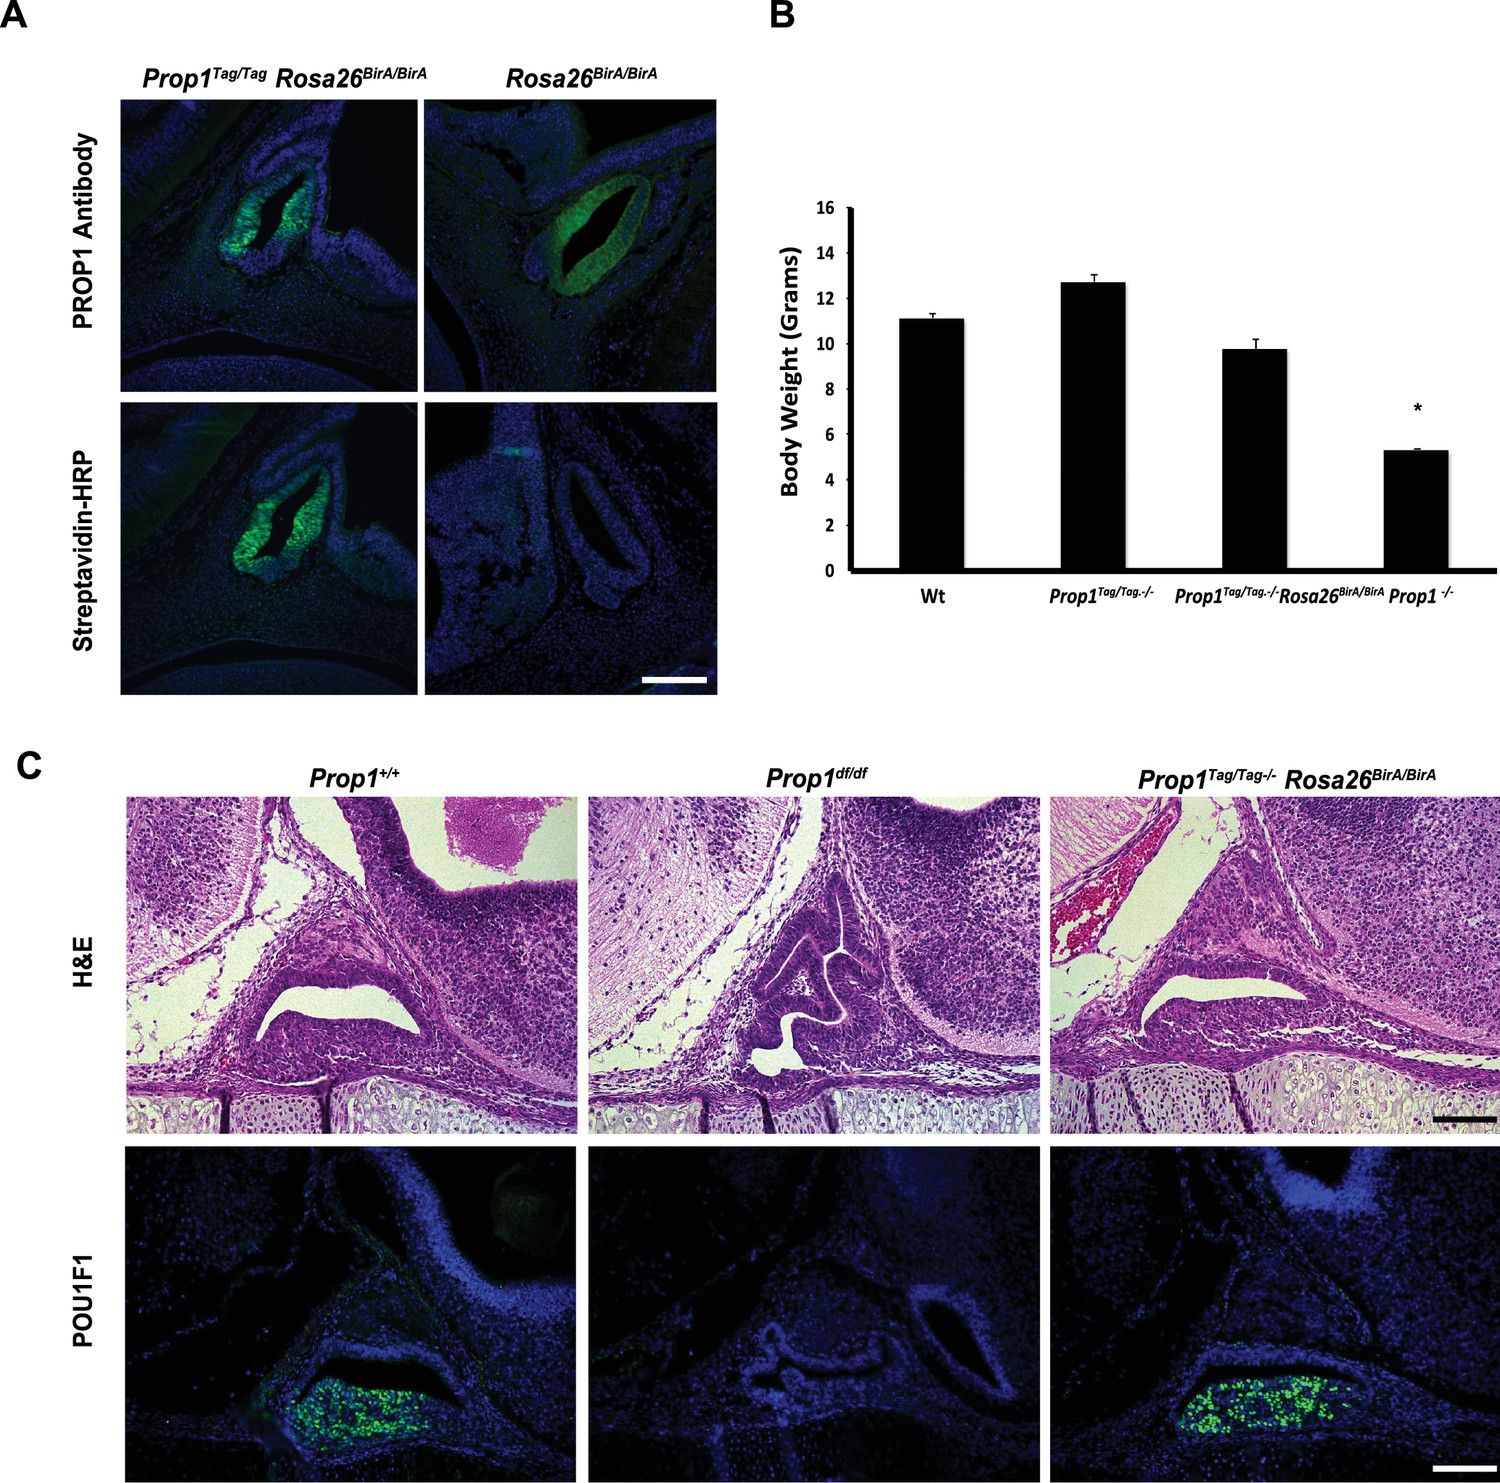
Characterization of Prop1-biotag transgenic mice.
(A) Pituitary paraffin sections were prepared from e12.5 embryos of the genotype indicated and immunohistochemistry was performed. A polyclonal antibody against PROP1 detects the PROP1 protein in the pituitary primordium - Rathke’s Pouch (upper panel). The transgenic PROP1-biotag protein can be detected with fluorescein-conjugated streptavidin only when is co-expressed with BirA (lower panel). (B) Body weight at P21. Prop1-/- mice are dwarfed, but the presence of the Prop1-biotag transgene alone or co-expressed with BirA rescues the dwarf phenotype. The mean of body weight of mice of each genotype is graphed. Error bars represent the standard deviation. (n = 25–40) ANOVA *p<0.05. (C) Dysmorphology characteristic of the Prop1 mutant pituitary gland is rescued by the biotin-tagged Prop1 transgene. Upper panel: Hematoxylin and eosin staining of e16.5 embryos. Lower panel: Immunostaining with POU1F1-1 antibody at e16.5 paraffin sections. Scale bars, 100 µm.
Figure 9
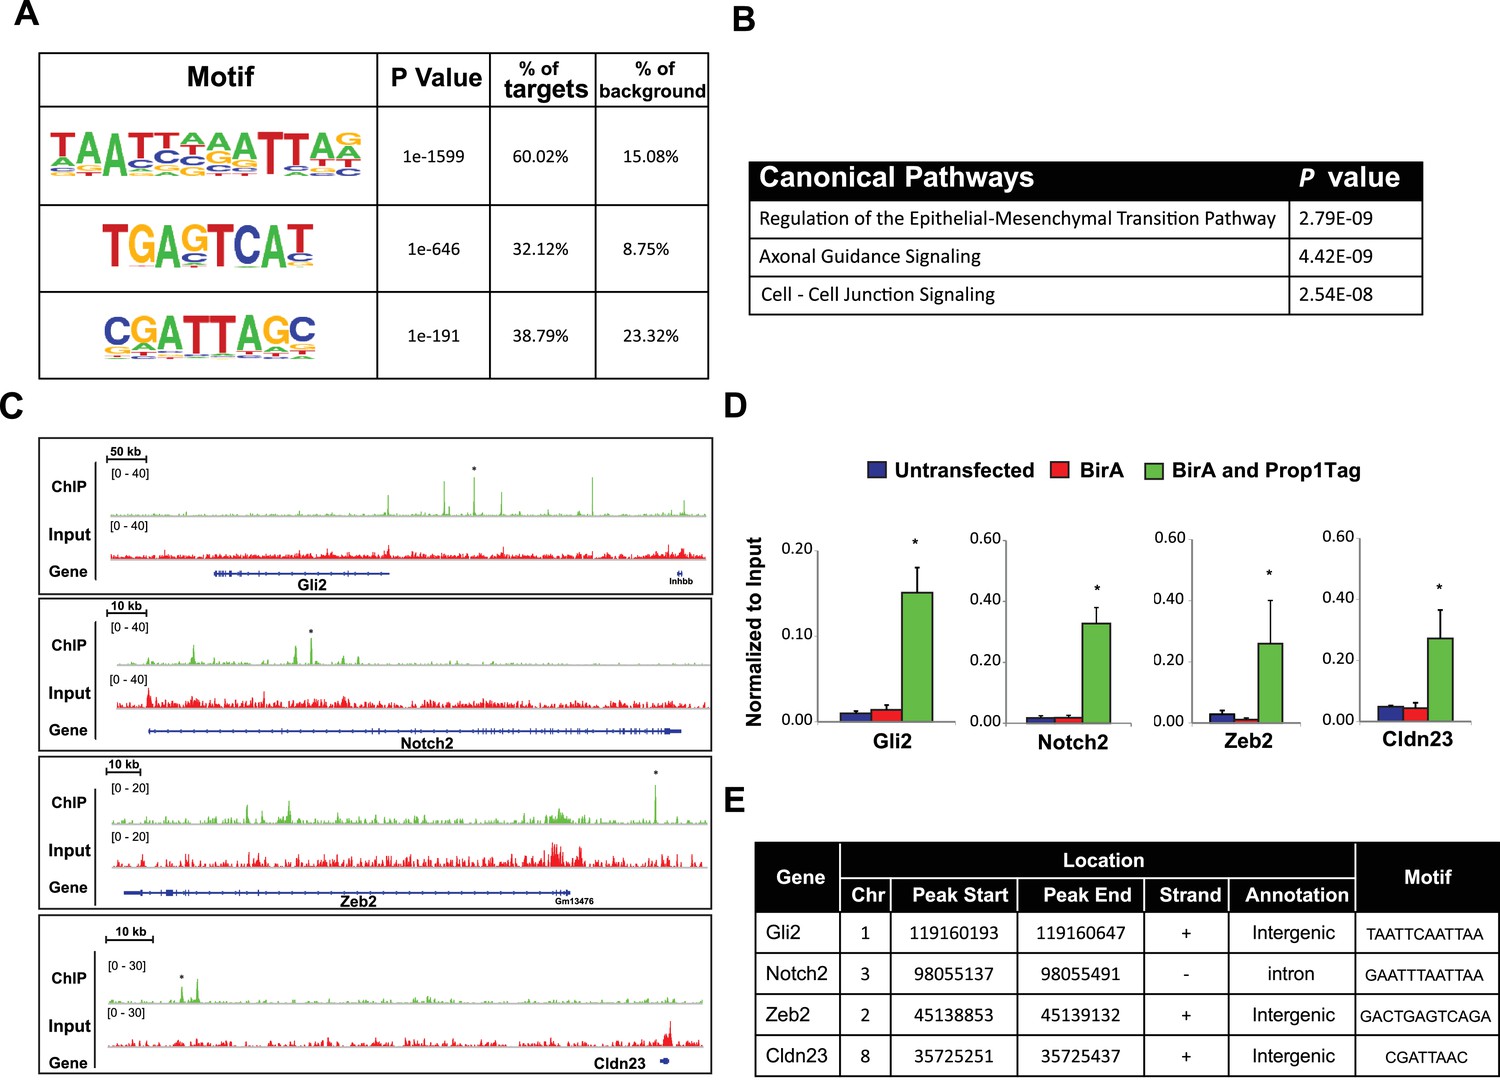
PROP1 is a regulator of genes involved in EMT.
(A) HOMER analysis of new motif enrichment within PROP1 peaks. (B) Canonical Pathway Analysis of the putative PROP1 target genes found on the ChIP-Seq. (C) Streptavidin ChIP-Seq enrichment profiles. Enrichment peaks corresponding to Gli2, Notch2, Zeb2 and Cldn23 are indicated with asterisks. (D) Quantitative ChIP assay on candidate promoters. For each gene, primers were designed to amplify region where the PROP1 peak was detected. Note that enrichment of DNA fragments was specific to BirA, Prop1Tag cells, validating the specificity of ChIP-Seq. Experiments were done using three samples for each genotype (N = 3). Data are mean + SEM. OWA and * indicates p<0.05 relative to controls. Each ChIP experiment was repeated at least twice with similar results. (E) Table containing coordinates of the peaks found on each gene and the enriched motif found by HOMER. See also Figure 9—source data 1.
-
Figure 9—source data 1
Top list of putative PROP1 target genes that were associated with strong peaks in ChIP-Seq.
Related to Figure 9.
- https://doi.org/10.7554/eLife.14470.016
Figure 10
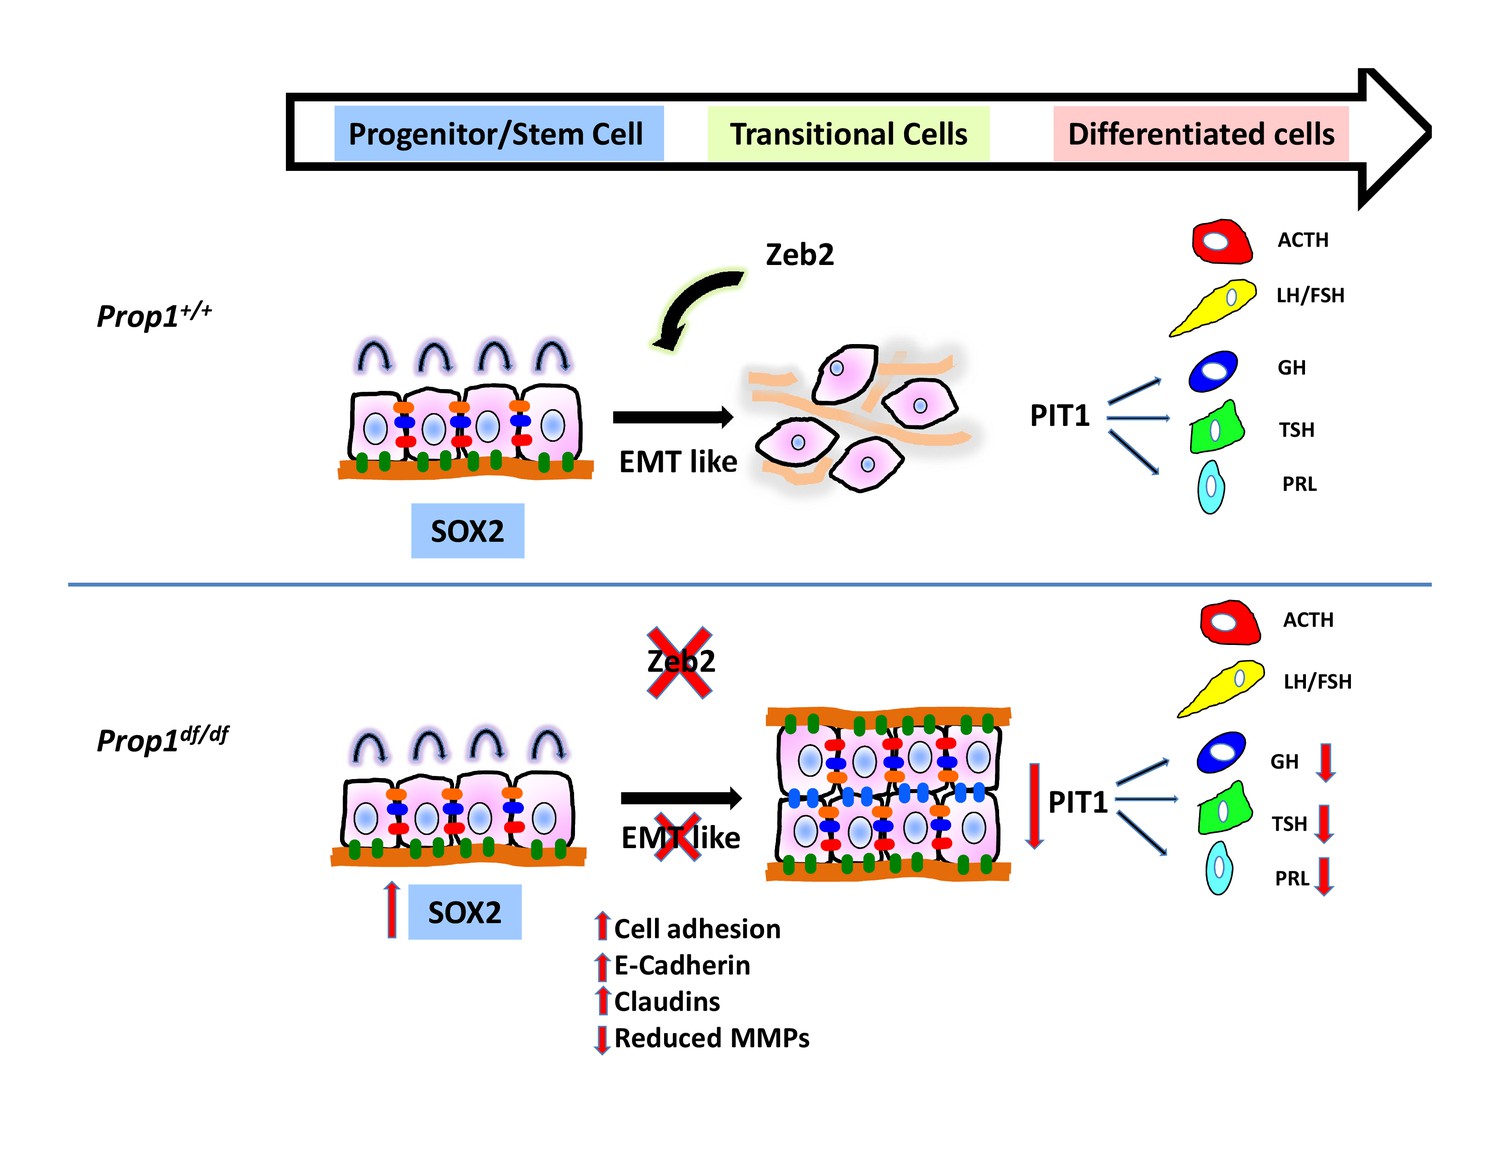
Model of Prop1’s role in the transition of stem cells to differentiation.
During normal pituitary development when stem cells transition toward differentiation they exit the cell cycle and express Cyclin E. Our results suggest that for progenitors to differentiate they need to go through an EMT-like process where E-cadherin is down-regulated and the cells lose adhesion. In the absence of Prop1, the expression of genes that can induce EMT, like Zeb2, is reduced, leading to increased cell adhesion and increased expression of tight junction proteins like claudins. Our data suggest that PROP1 is required for progenitors to progress to the transitional stage marked by Cyclin E expression embryonically, and in the absence of Prop1, Sox2 expression is elevated. The failure of progenitors cells to advance to the transitional stage leads to pituitary hormone deficiency and organ dysmorphology.
Additional files
-
Supplementary file 1
Supplementary Information.
(A) Primary antibodies used in this study. (B) Secondary Antibodies in this study. (C) Primers for RT-PCR used to confirm ChIP-Seq peaks.
- https://doi.org/10.7554/eLife.14470.018
Download links
A two-part list of links to download the article, or parts of the article, in various formats.
Downloads (link to download the article as PDF)
Open citations (links to open the citations from this article in various online reference manager services)
Cite this article (links to download the citations from this article in formats compatible with various reference manager tools)
PROP1 triggers epithelial-mesenchymal transition-like process in pituitary stem cells
eLife 5:e14470.
https://doi.org/10.7554/eLife.14470


