A cytoplasmic peptidoglycan amidase homologue controls mycobacterial cell wall synthesis
- Harvard TH Chan School of Public Health, United States
- University of Massachusetts Medical School, United States
- Texas A and M University, United States
- Harvard Medical School, United States
Figures
Figure 1 with 1 supplement
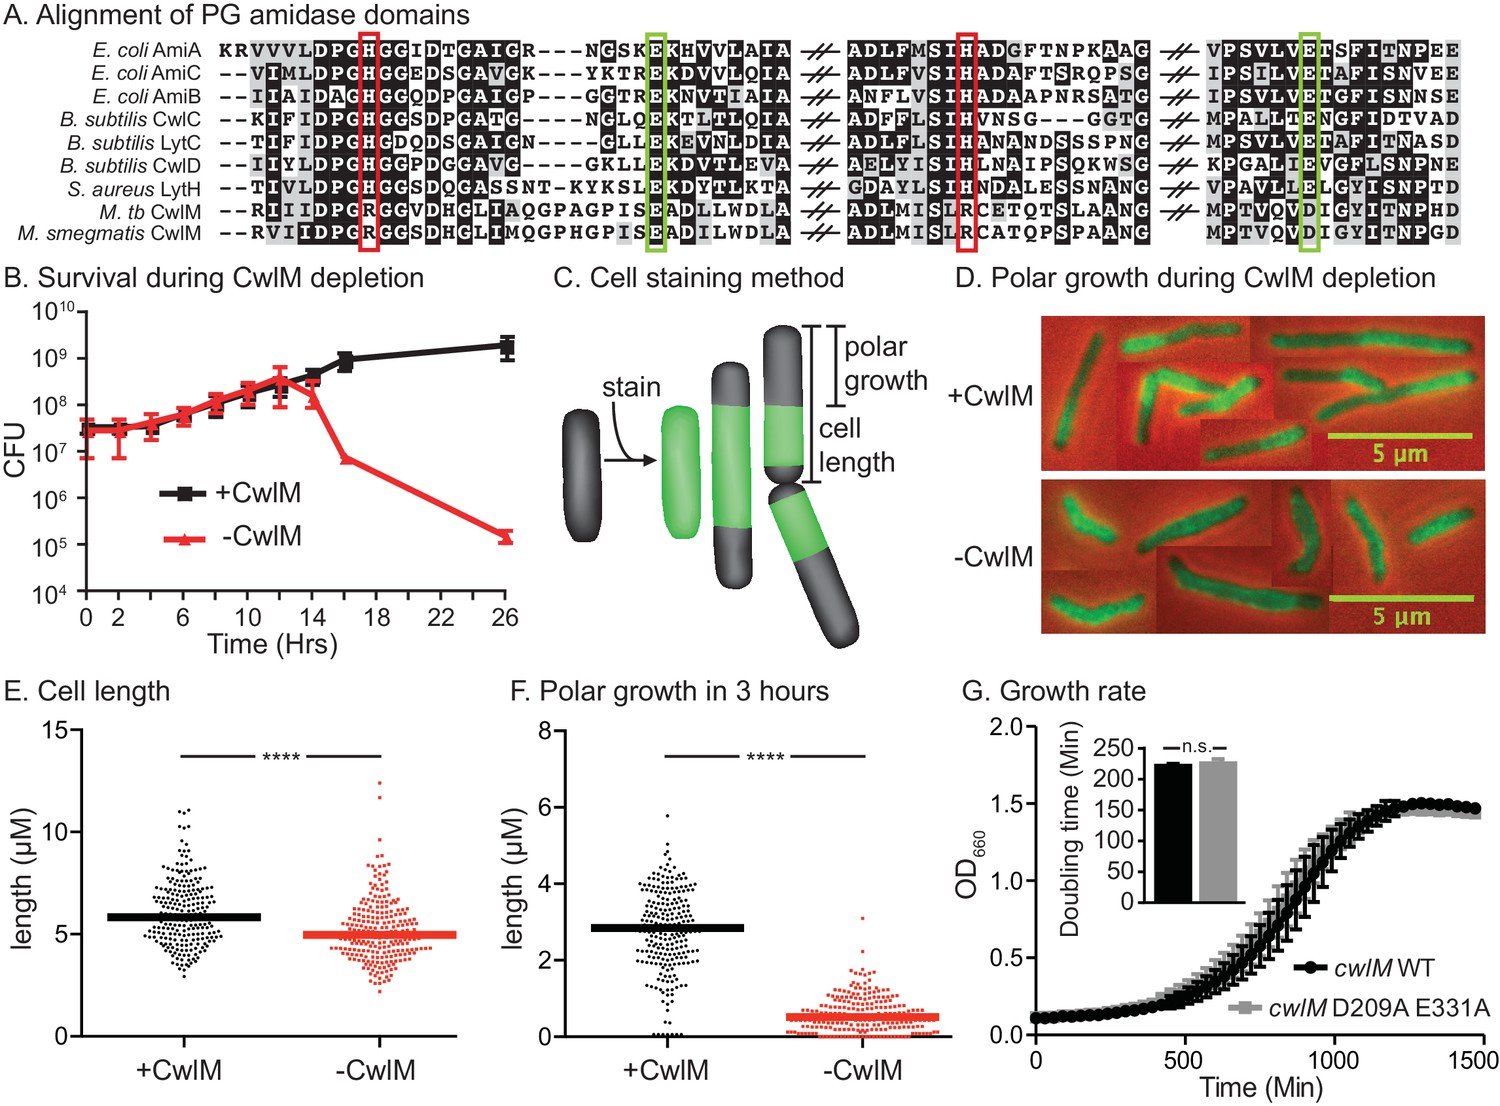
CwlM’s essential function promotes polar growth, but not through enzymatic activity.
(A) Alignment of the active-site proximal regions of the enzymatic domain of PG amidases. The Zn2+-coordinating residues are boxed: the conserved aspartate/ glutamates in green, and the degenerate histidine/ arginines in red. (B) Colony forming units (CFU) of the Ptet::cwlM (CB82) strain grown with (+CwlM) or without (−CwlM) Atc inducer from Time 0. Data from all experiments throughout is from three biological replicates and error bars are the standard deviation, unless otherwise noted. (C) Cartoon of the amine reactive dye (ARD) staining method showing polar growth after staining, with a diagram of how cell length and polar growth were measured for Figures 1EF and 2EF. (D) Overlaid micrographs of the Ptet::cwlM strain grown with (+CwlM) or without (−CwlM) Atc for 9 hr, stained with ARD, grown 3 hr and imaged with a 488/530 filter (green) and in phase (red and black). Representative cells from several images used in E and F were pasted together, the scale is conserved between images. (E) The length of ~230 cells from each condition in (D). Two biological replicates were used for all microscopy experiments, unless noted. (F) The length of the longer unstained pole of the cells in (E), line indicates the median in (E) and (F). **** p value <0.0001. (G) Growth curves showing the OD660 of WT (L5::cwlM, CB236) and amidase-ablated (L5::cwlM D209A E331A, CB239) strains growing in 7H9, and a bar graph showing the calculated doubling times of these strains (inset). n.s. – not significant. The p value was 0.51 by the student’s t-test
Figure 1—figure supplement 1
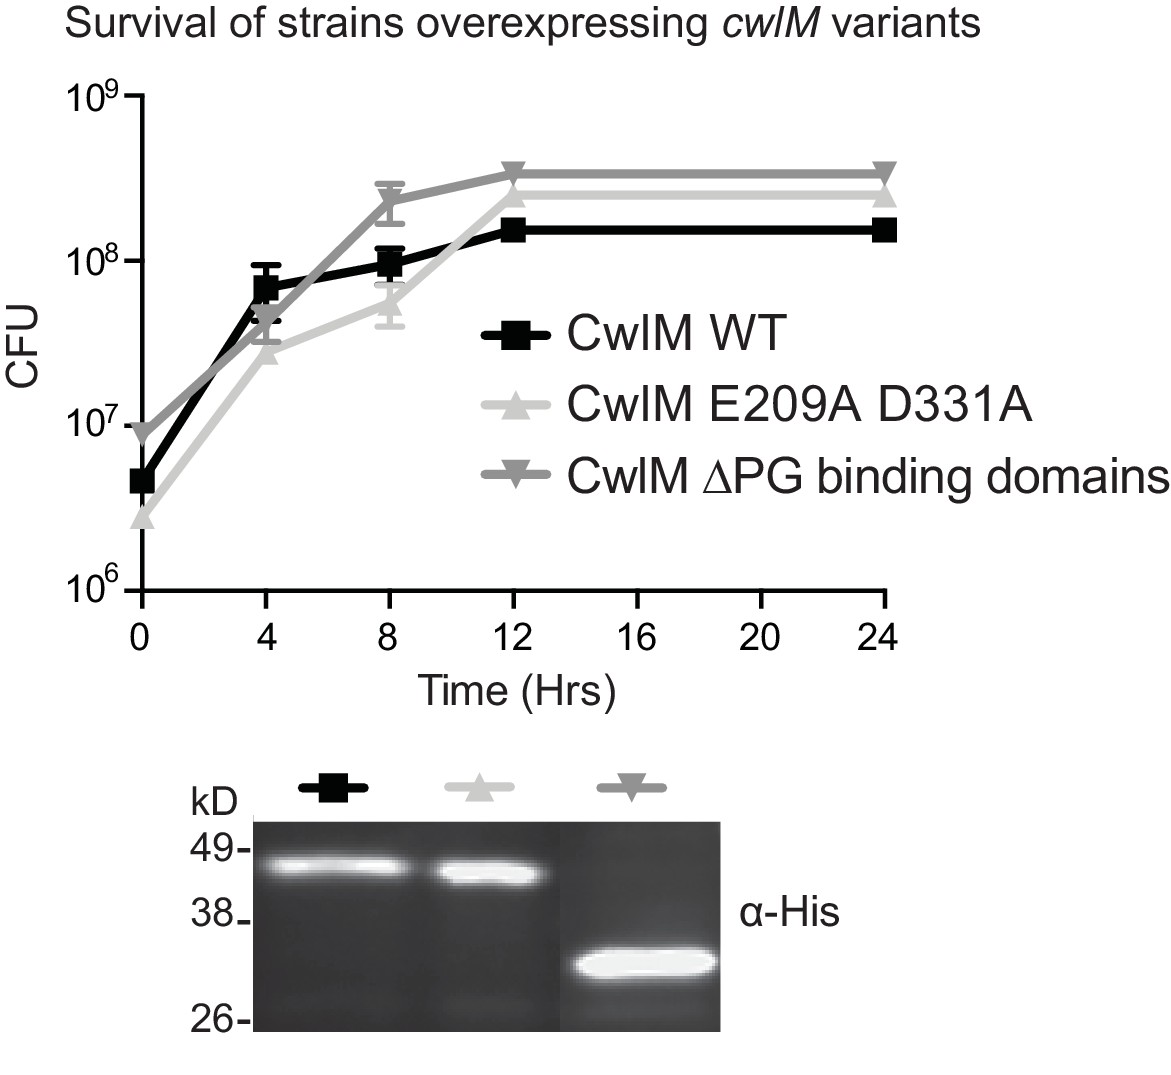
Overexpression of CwlM.
Colony forming units of Msmeg strains overexpressing wild-type (CB193), the amidase ablated allele of cwlM (CB194), and the amidase domain alone (CwlM ∆PG binding domains, CB202), and an α-His western blot showing that these proteins are expressed. Proteins were expressed from Atc-inducible promoters on episomal vectors.
Figure 2 with 1 supplement
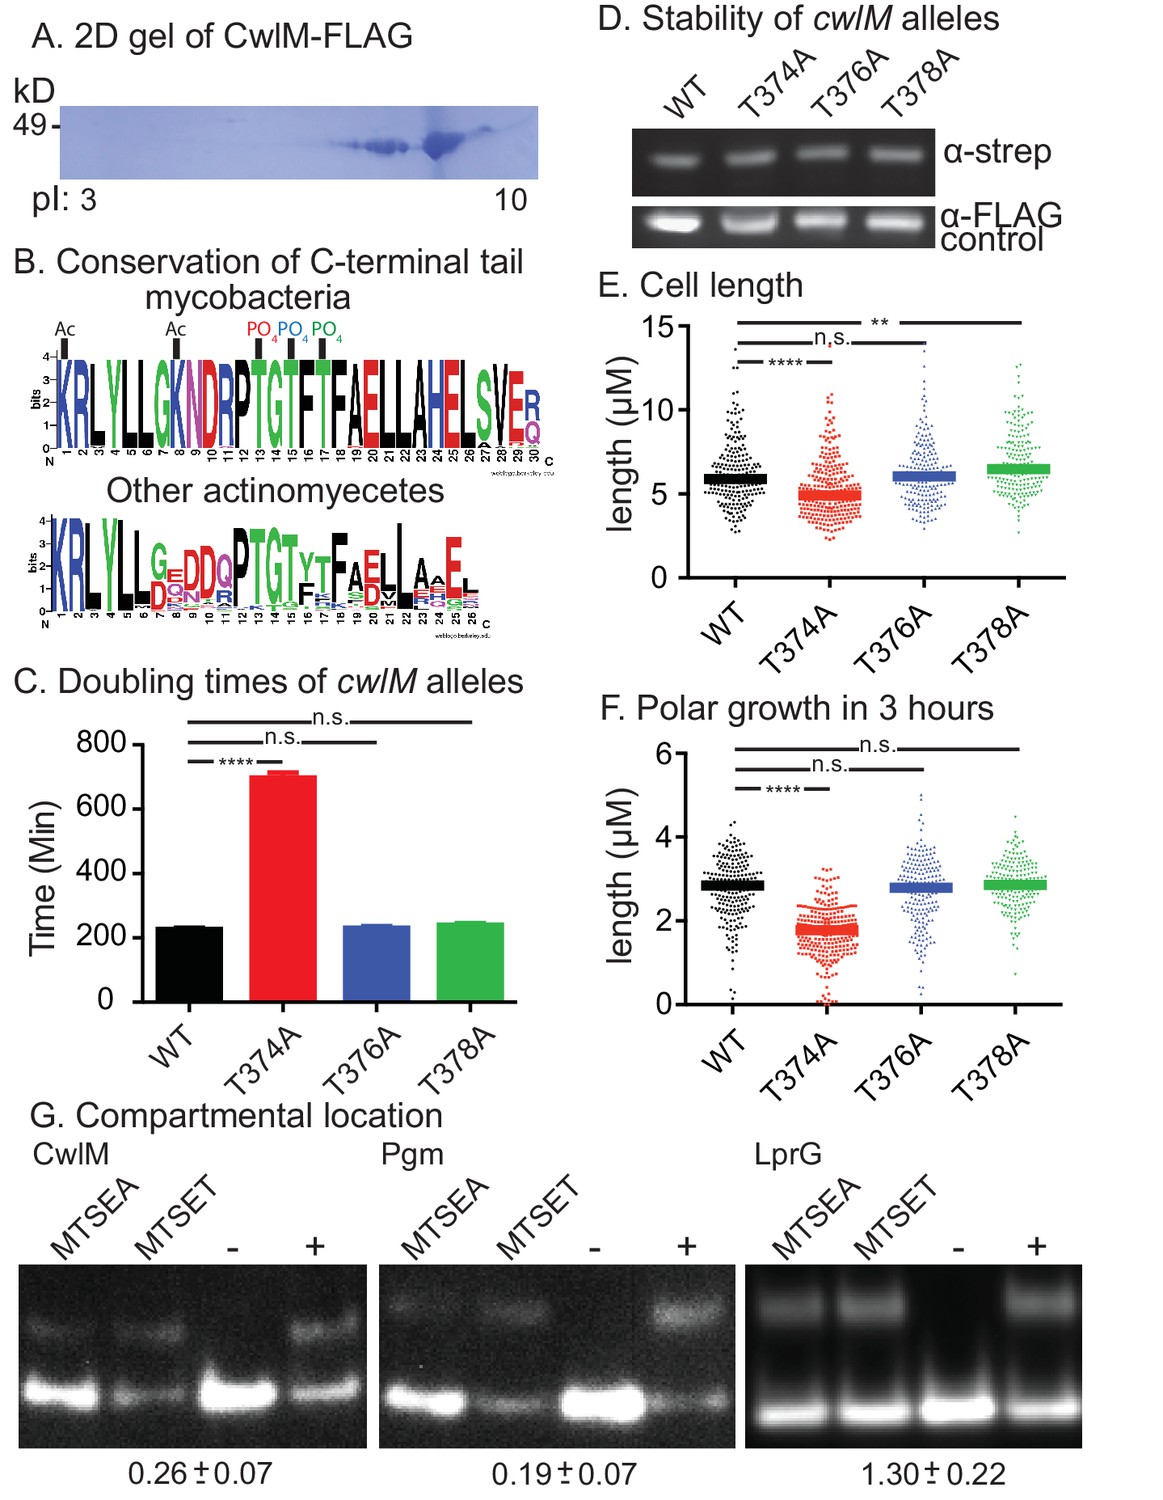
CwlM is phosphorylated and cytoplasmic.
(A) 2-D gel of CwlM-FLAG from Msmeg (CB100) with the isoelectric point (pI) indicated on the bottom. (B) Weblogo diagrams of the C-terminus of CwlM homologues. Acetylation (Ac) and phosphorylation (PO4) sites are indicated. The colors of the three phosphates match the colors of the corresponding phospho-ablative strains in C, E and F. (C) Doubling times of L5::cwlM-FLAG WT (CB300) and phospho-ablative mutants (T374A = CB300; T376A = CB345; T378A = CB348). All multiple comparisons throughout were performed by One-way ANOVA with a Dunnett multiplicity correction. The adjusted p values for each mutant compared to WT are: T374A =< 0.0001; T376A = 0.88; T378A = 0.15. (D) α-strep western blot of L5::cwlM-strep WT (CB663) and phospho-ablative mutants (CB666, 669, 672). A background band on the same blot probed with α-FLAG is used as a control. Westerns of the L5::cwlM-FLAG strains could not be used because of high background. (E) Cell length of 200–300 cells from L5::cwlM-FLAG WT and phospho-ablative mutants. The adjusted p values for each mutant compared to WT are: T374A =< 0.0001; T376A = 0.99; T378A = 0.01. (F) Length of the longer unstained pole of cells in (E). Cells were stained with ARD and grown for three hours before imaging. The adjusted p values for each mutant compared to WT are: T374A =< 0.0001; T376A = 0.59; T378A = 0.36. (G) Substituted cysteine accessibility. α-strep western of cells with strep-tagged Pgm (CB886, MSMEG_4579, cytoplasmic control), lprG (CB706, Rv1411, periplasmic control) and CwlM1cys (CB457) that were cysteine-blocked with MTSEA (membrane permeable) or MTSET (membrane impermeable) then alkylated at unblocked cysteines. Control samples: (−) = not alkylated or blocked, (+) = alkylated but not blocked. % alkylation (%alk.) = high band/ total for each sample. The periplasmic localization score = (%alk.MTSEA/% alk.MTSET) and is indicated below the gel for each protein ± the 95% confidence interval from two biological replicates. Scores < 0.5 are cytoplasmic, near 1 are periplasmic.
Figure 2—figure supplement 1
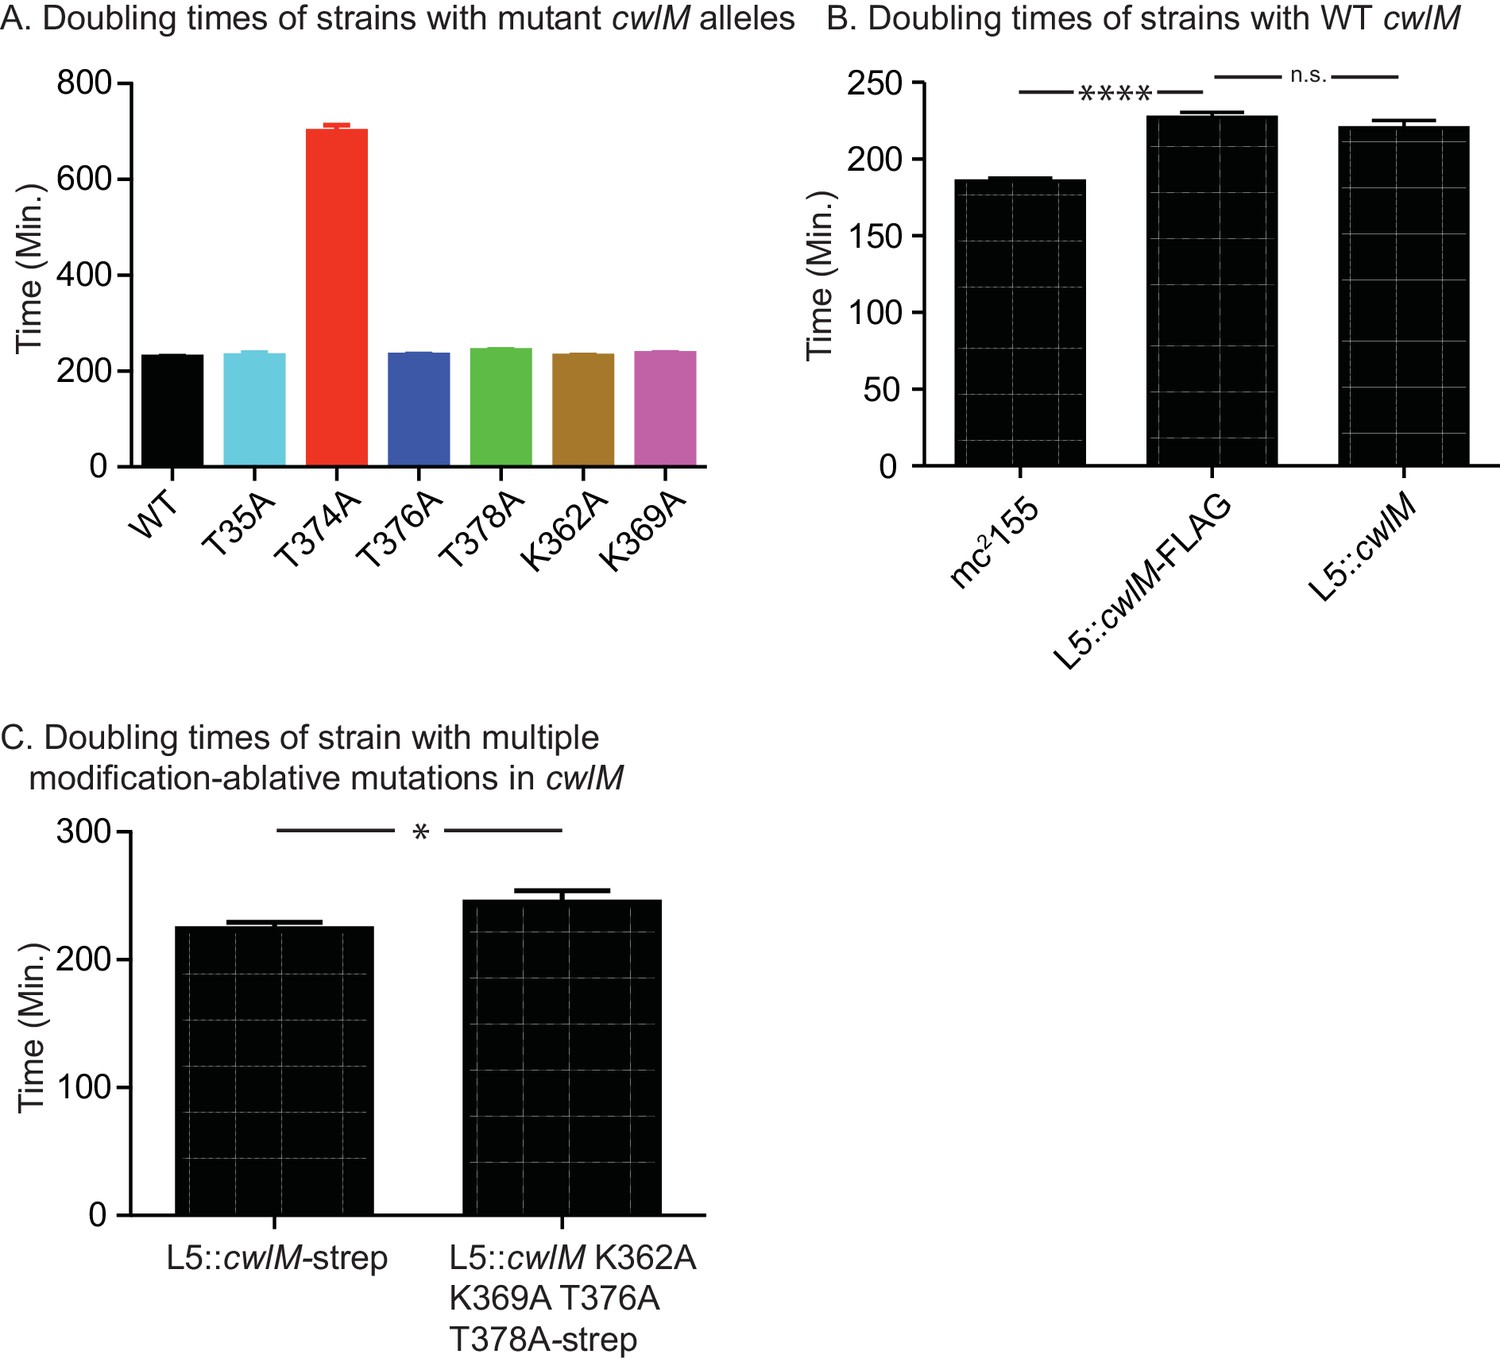
Growth rates of strains with different cwlM alleles.
(A) Doubling times of ∆cwlM Msmeg strains with different cwlM-FLAG alleles at the L5 phage integrase site. WT = CB300; T35A = CB265; T374A = CB319; T376A = CB345; T378A = CB348; K362A = CB351; K369A = CB354. p values for each mutant against the WT were calculated with the students t test: all p values were insignificant except T374A > 0.0001. (B) Doubling times of wild-type M. smegmatis mc2155 (CB1), mc2155 ∆cwlM L5::cwlM-FLAG (CB300) and mc2155 ∆cwlM L5::cwlM (CB236). p values: CB1 vs. CB300 > 0.0001; CB300 vs. CB236 = 0.8. (C) Doubling times of mc2155 ∆cwlM L5::cwlM-strep (CB663) and mc2155 ∆cwlM L5::cwlM K362A K369A T376A T378A-strep (CB675), p value = 0.033.
Figure 3 with 1 supplement
CwlM is phosphorylated by PknB.
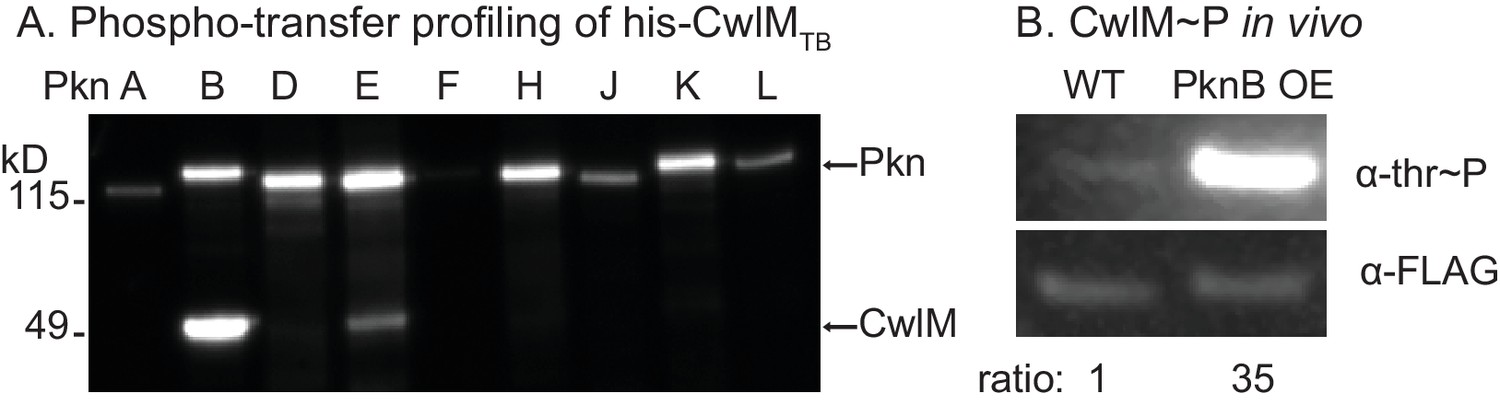
(A) α-thr~p western blots of in vitro kinase reactions with the kinase domains of 9 STPKs from Mtb fused to MBP and his-CwlM from Mtb. Reactions were stopped at 2 min. Longer time points are in Figure 3-figure supplement 1B. (B) α-thr~p and α-FLAG western blot of lysates from a strain expressing CwlM-FLAG in a PknBTB overexpression (CB418) background. PknBTB was uninduced or induced for 30 min with 100 ng/ml Atc. Ratio = signal of (α-thr~p / α-FLAG)PknB OE / (α-thr~p / α-FLAG)uninduced. Experiments in (A) and (B) were both performed twice, representative images are shown.
Figure 3—figure supplement 1
Phosphorylation of CwlM.
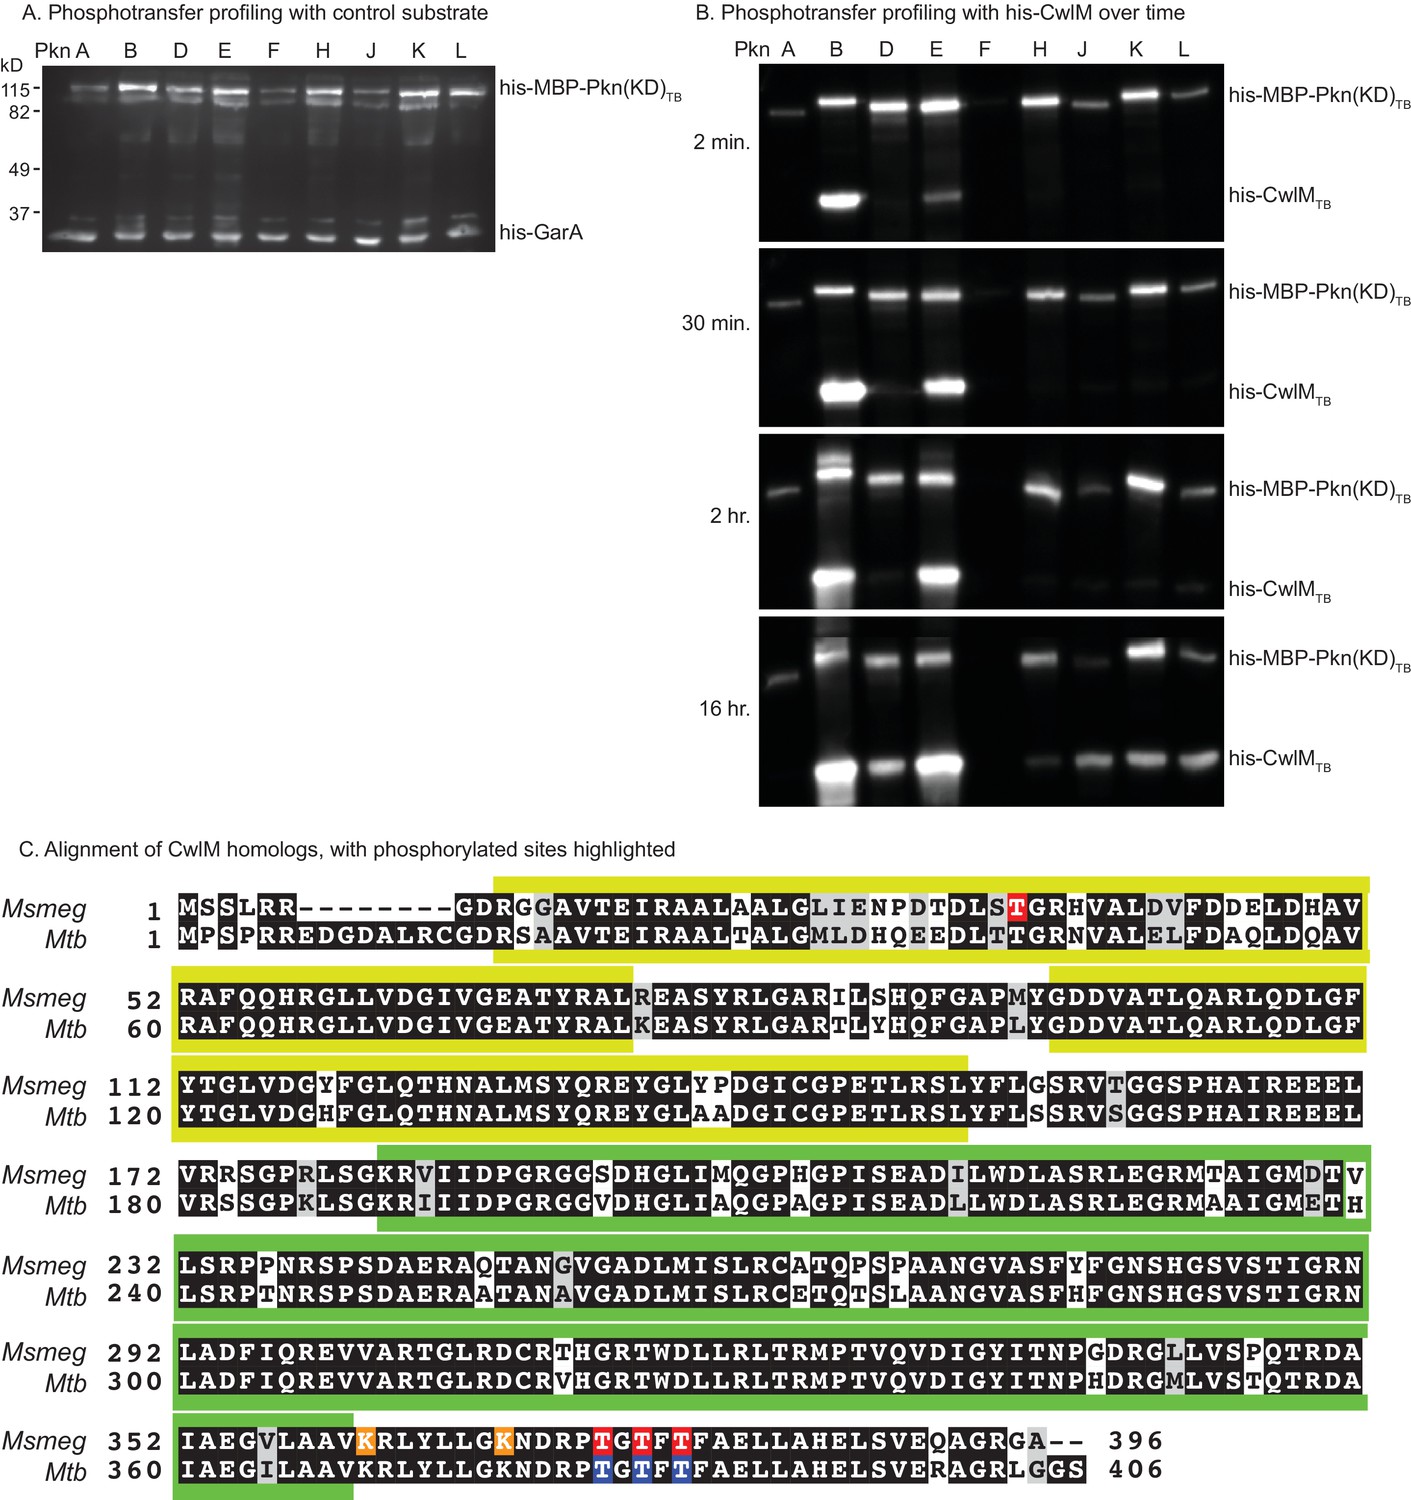
(A) α-phospho-threonine western blot of kinase reactions of the kinase domains (KD) of STPKs from Mtb fused to his-MBP incubated overnight at room temperature with his-GarATB, a non-specific substrate. (B) α-phospho-threonine western blot of kinase reactions of his-CwlMTB incubated with the kinase domains of STPKs from Mtb fused to his-MBP. (C) Alignment of CwlM from Mtb and Msmeg. Yellow boxes indicate the position of the PG binding 1 domains, green boxes indicate the position of the PG amidase domain. Residues highlighted in red were found to be phosphorylated in CwlM-FLAG pulled down from Msmeg cell lysates. Residues in orange were acetylated in these same lysates. Residues highlighted in blue were found to be phosphorylated on his-CwlMTB expressed and purified from E. coli and incubated with his-MBP-PknB(KD)TB. All the modifications were identified by mass spectrometry.
Figure 4 with 1 supplement
CwlM binds to and regulates MurA.
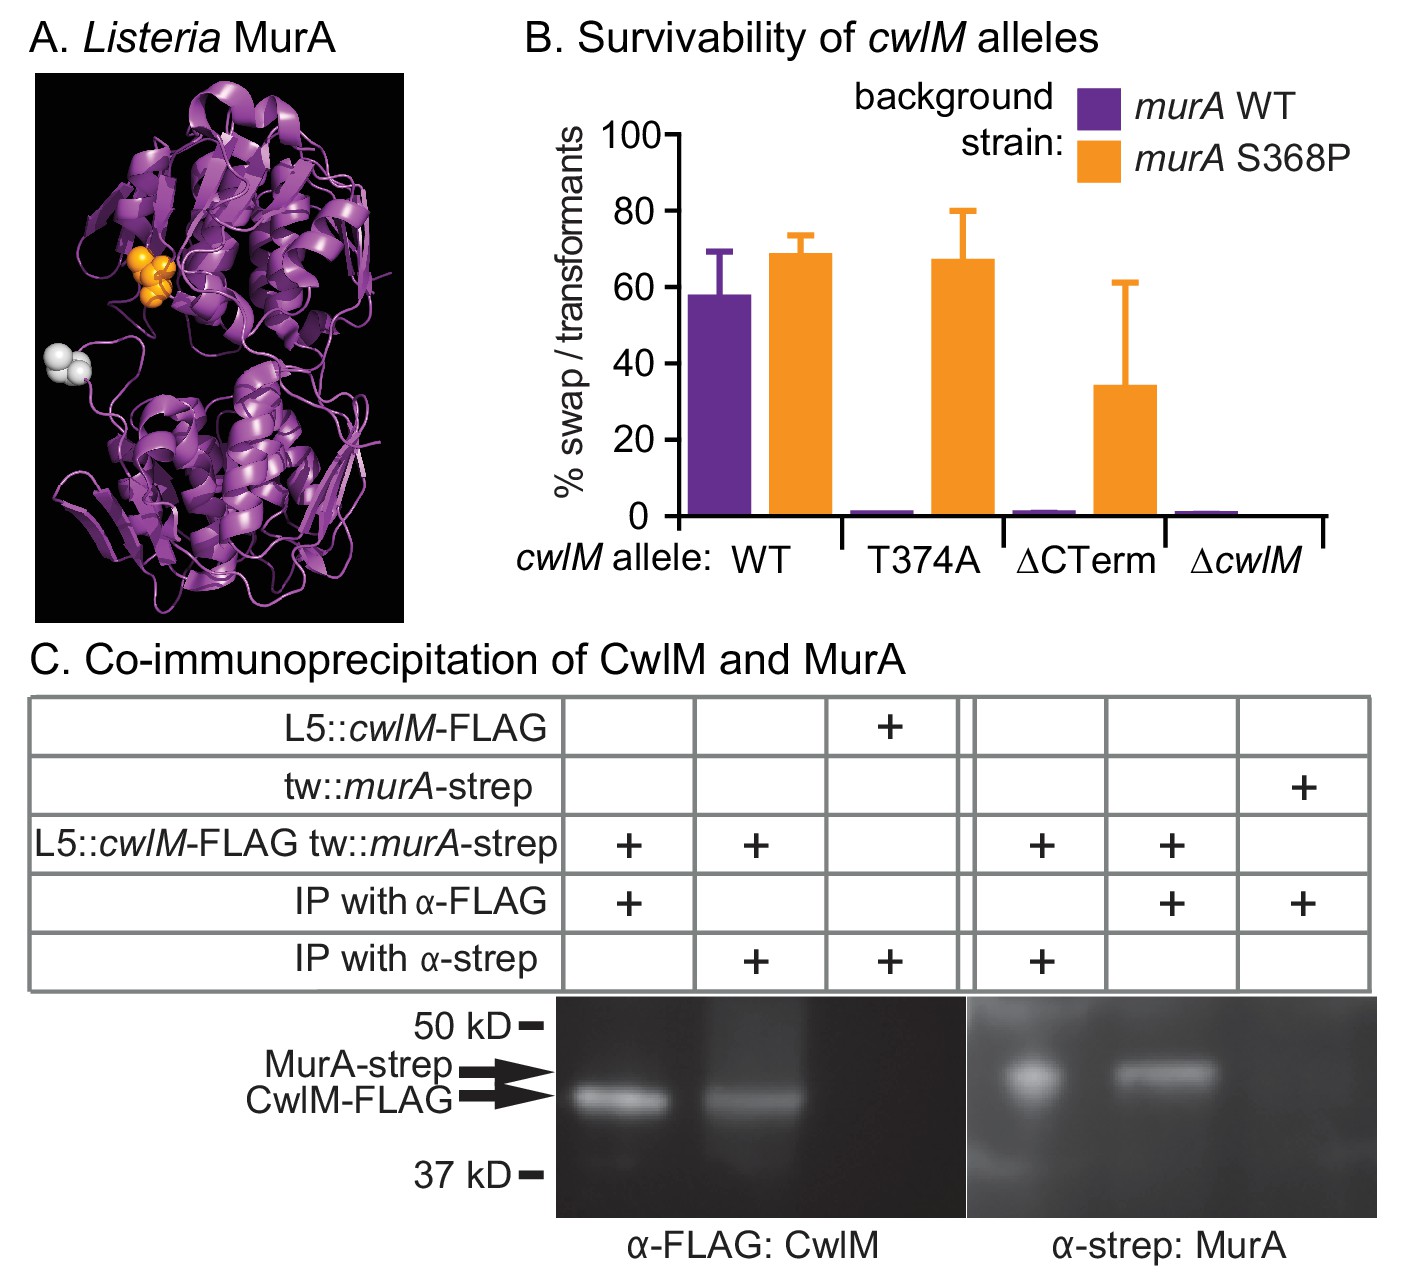
(A) Crystal structure of MurA from L. monocytogenes (Halavaty et al., 2011). Orange: alanine that corresponds to S368 in Msmeg and Mtb MurA; gray: catalytic cysteine (aspartate in Msmeg and Mtb.). (B) Fitness of cwlM alleles in murA WT (CB737) and S368P (CB762) backgrounds, assessed by the percentage of colonies in which the WT cwlM allele was replaced by the indicated allele (WT = pCB277; T374A = pCB255; ∆CT = pCB557; ∆cwlM = pCB558). Four biological replicates of each transformation were performed, and 96–198 colonies were counted for each replicate. The Sidak correction for multiple comparisons was used to calculate p values using one-way ANOVA. The adjusted p values among the murA WT strains were calculated compared to cwlM WT: T374A =< 0.0001; ∆CT =< 0.0001; ∆cwlM =< 0.0001. The adjusted p values among the murA S368P strains were calculated compared to cwlM WT: T374A = 0.99; ∆CT = 0.006; ∆cwlM =< 0.0001. (C) α-FLAG and α-strep western blots of immunoprecipitates from the indicated strain (top three rows, from top: CB300, CB737, CB779) with the indicated antibody-conjugated beads (bottom two rows). The pulldown was performed twice, a representative image is shown.
Figure 4—figure supplement 1
Growth rates of strains with different cwlM and murA regulatory alleles.
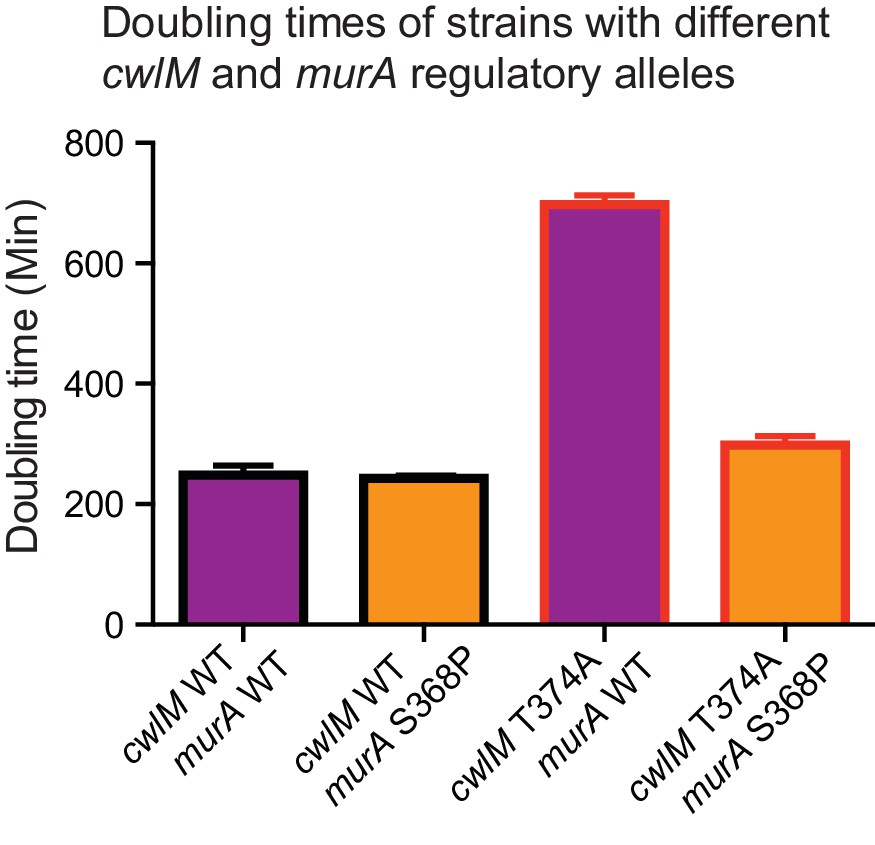
Doubling times of strains. cwlM WT murA WT = CB779; cwlM WT murA S368P = CB782; cwlM T374A murA WT = CB319; cwlM T374A murA S368P = CB785. In the experiment described in Figure 4, we were not able to attain any cwlM T374A murA WT transformants, so the strain with this genotype is not isogenic with the other strains presented here. We were only able to attain colonies with the cwlM T374A murA WT genotype when the L5 allele swap was conducted in such a way that the correct swap was genetically forced. CB319 and the other strains presented in Figure 2 were made by using a parental strain (CB233) in which the only copy of cwlM was under the control of an Atc-inducible promoter on an L5 vector that contained the tetR gene: this strain is Atc-dependent, because TetR will repress transcription of cwlM unless Atc is added. The alternate alleles of cwlM were under the control of Atc-inducible promoter on L5-integrating vectors that do not contain the tetR gene; they were transformed into CB233 and plated on plates that do not contain Atc. If the original L5 vector remains at the L5 site in addition to the new vector with the alternate allele, the TetR expressed from the original vector will repress transcription of both alleles of cwlM and cause cell death: thus, the loss of the original vector is forced, and we were able to recover colonies even with very slow growth rates. In the transformations described in Figure 4, resulting in strains CB779, 782 and 785, there was no tetR on either of the L5 vectors; thus, the swap was not forced, and at least half of the colonies from any transformation had both the original L5 vector with WT cwlM and the newly-transformed vector.
Figure 5 with 1 supplement
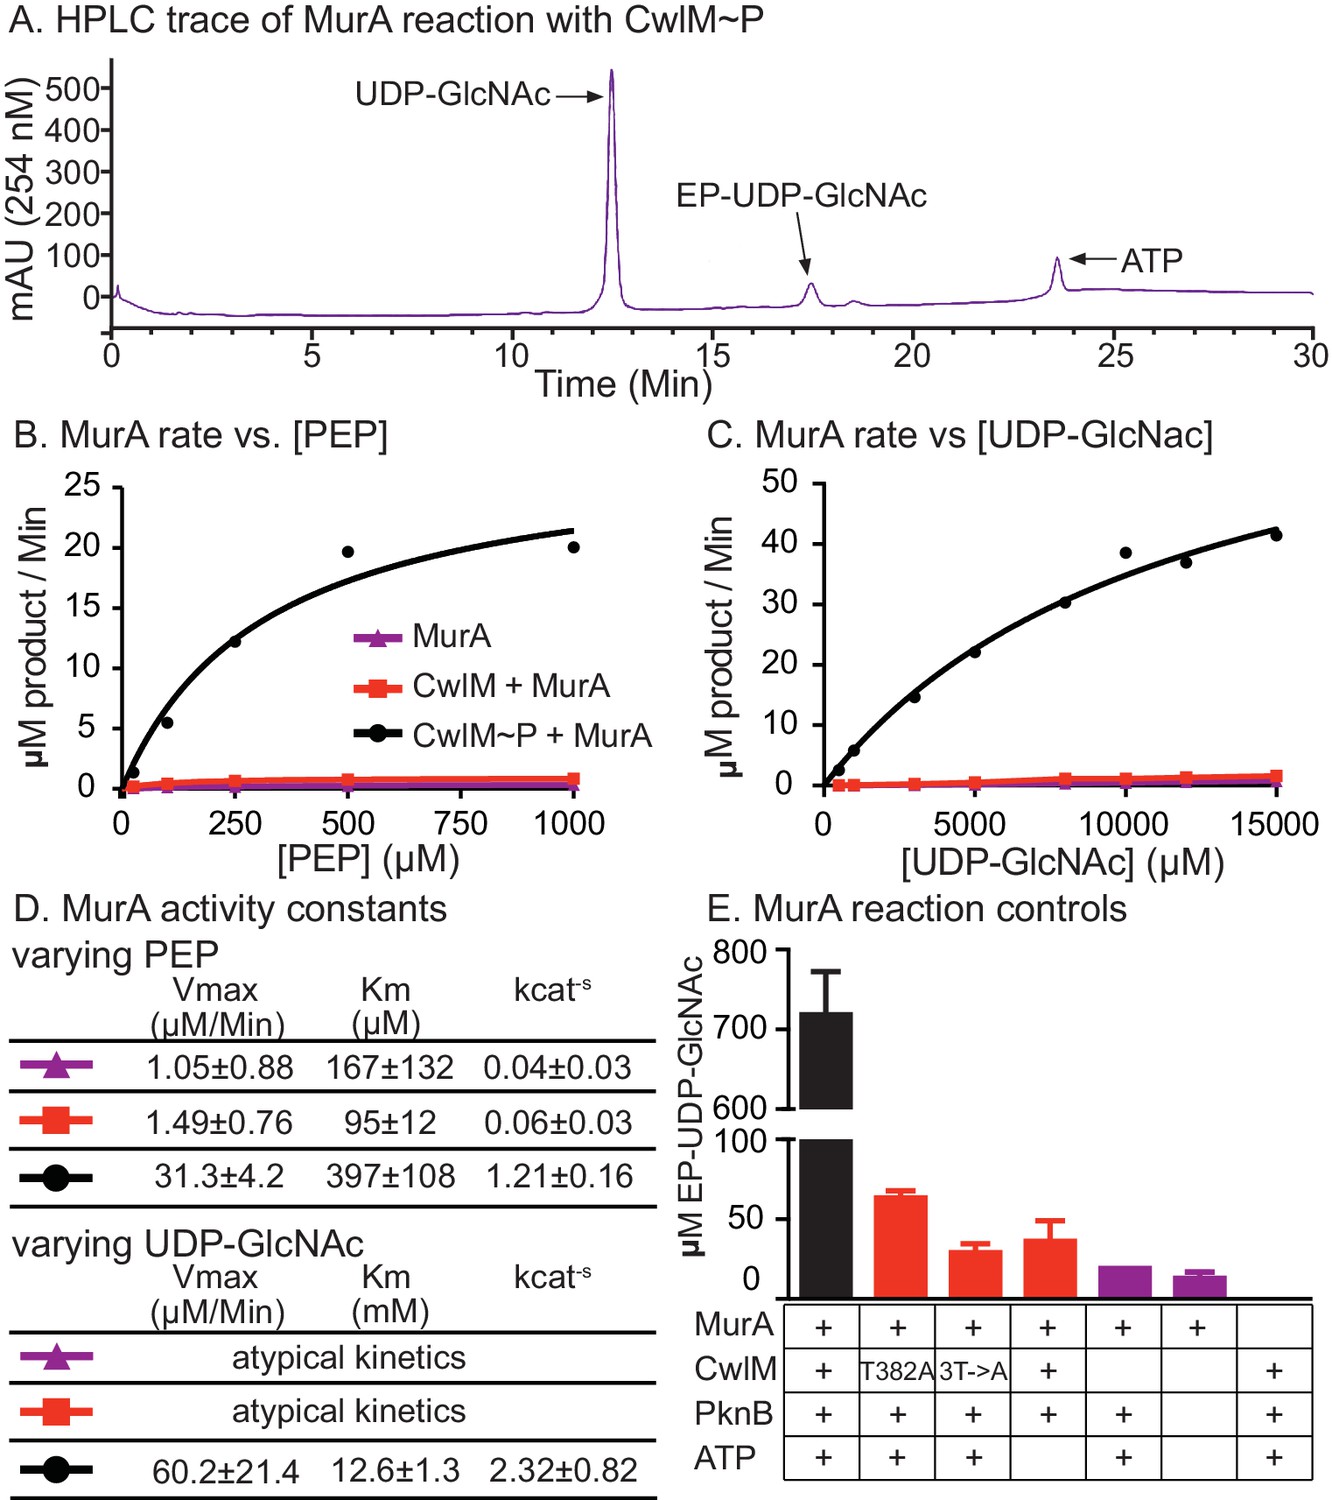
CwlM~P activates MurA in vitro.
(A) An HPLC trace from the MurATB kinetic assays, with substrate UDP-GlcNAc and product EP-UDP-GlcNAc indicated. Assays were done on his-MurATB alone, his-MurATB with equimolar his-CwlMTB~P in an active kinase reaction (+ATP) with his-MBP-PknBTB(KD) (a his-Maltose binding protein fusion to the kinase domain (KD) of PknB from Mtb), or his-MurATB with his-CwlMTB in an inactive kinase reaction (-ATP) with his-MBP-PknBTB(KD). (B) Rate of MurA activity vs. the concentration of phosphoenol pyruvate (PEP). Lines are the fit to the Michaelis Menten model. (C) Rate of MurA activity vs. the concentration of UDP-GlcNac for each MurA reaction condition. MurA and MurA+CwlM did not follow Michaelis Menten kinetics, (lines only connect the dots), for MurA+CwlM~P the line is the Michaelis Menten fit. The assays shown in (B) and (C) were done twice with two separate preps of his-MurATB and his-CwlMTB. Data from one replicate is shown here, full data in Figure 5 - figure supplement 1A–D. (D) Michaelis Menten kinetic constants from experiments in (B) and (C). Constants are the average ± the 95% confidence interval from the two replicates. (E) Amount of EP-UDP-GlcNAc produced after 30 min at 37°C in reactions with 2 mM PEP and 15 mM UDP-GlcNAc and his-MurATB at 20 µg/ml; his-CwlMTB at 20.2 µg/ml; his-MBP-PknBTB(KD) at 2 µg/ml and ATP at 1 mM where indicated. his-CwlMTB was incubated with his-MBP-PknBTB and ATP for 1 hr at RT before initiating the MurA reaction. T382A indicates that the singly-phosphoablative mutant protein his-CwlMTB T382A was used. 3T->A indicates that the triply-phosphoablative mutant protein his-CwlMTB T382A T384A T386A was used. Experiment was performed 2 times.
Figure 5—figure supplement 1
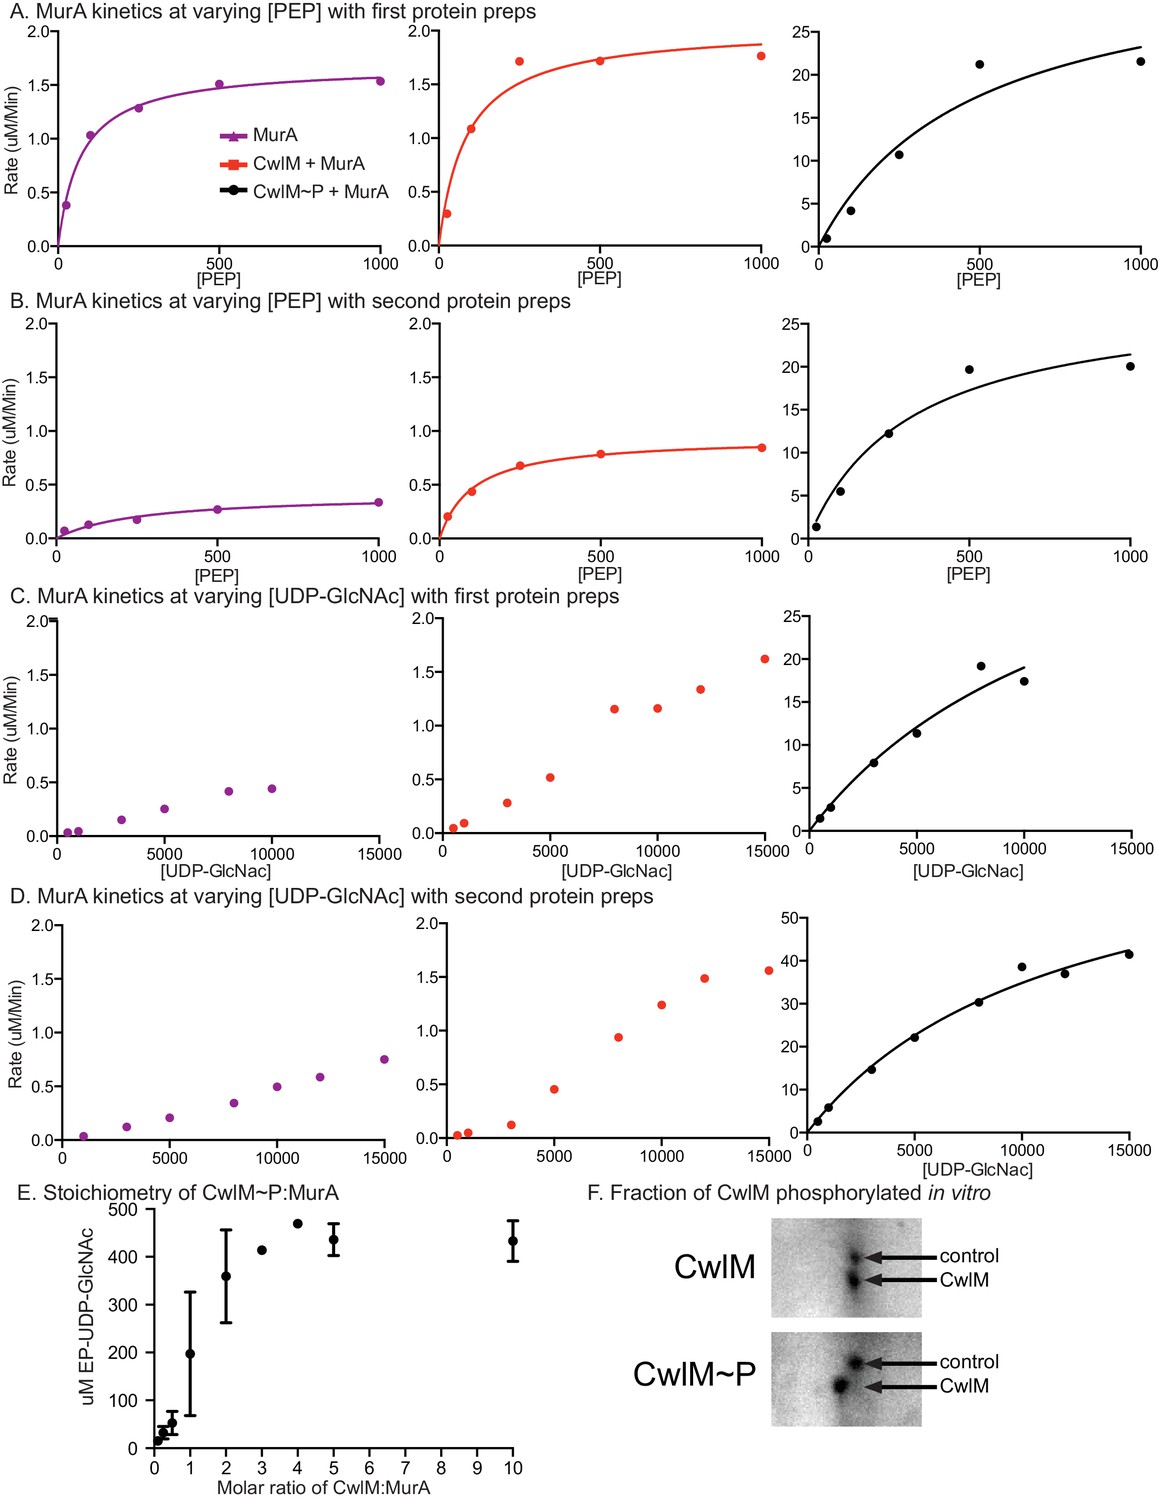
MurA enzyme kinetics.
Rates of MurA activity vs. [PEP] concentration with (A) the first preparation of his-MurATB and his-CwlMTB. (B) the second prep. Rates of MurA activity vs. [UDP-GlcNAc] concentration with (C) the first preparation of his-MurATB and his-CwlMTB and (D) the second prep. Data in ABC and D were fit to the Michaelis Menten formula where possible, the lines indicate this fit. In C and D, the data for MurA alone and MurA +CwlM could not be fit to the Michaelis Menten formula. These reactions apparently operate under atypical kinetic parameters. (E) Concentration of EP-UDP-GlcNAc formed in a 30 min incubation at 37°C of 2 mM PEP, 15 mM UDP-GlcNAc, 20 µg/ml his-MurATB and his-CwlMTB~P in an active kinase reaction at a range of CwlM:MurA molar ratios. (F) Two-dimensional gel of purified His-CwlMTB after 1 hr incubation with his-MBP-PknBTB in the absence (top) or presence (bottom) of ATP. The shift of the entire CwlM spot to a higher pI indicates that ~100% of the protein is phosphorylated.
Figure 6 with 1 supplement
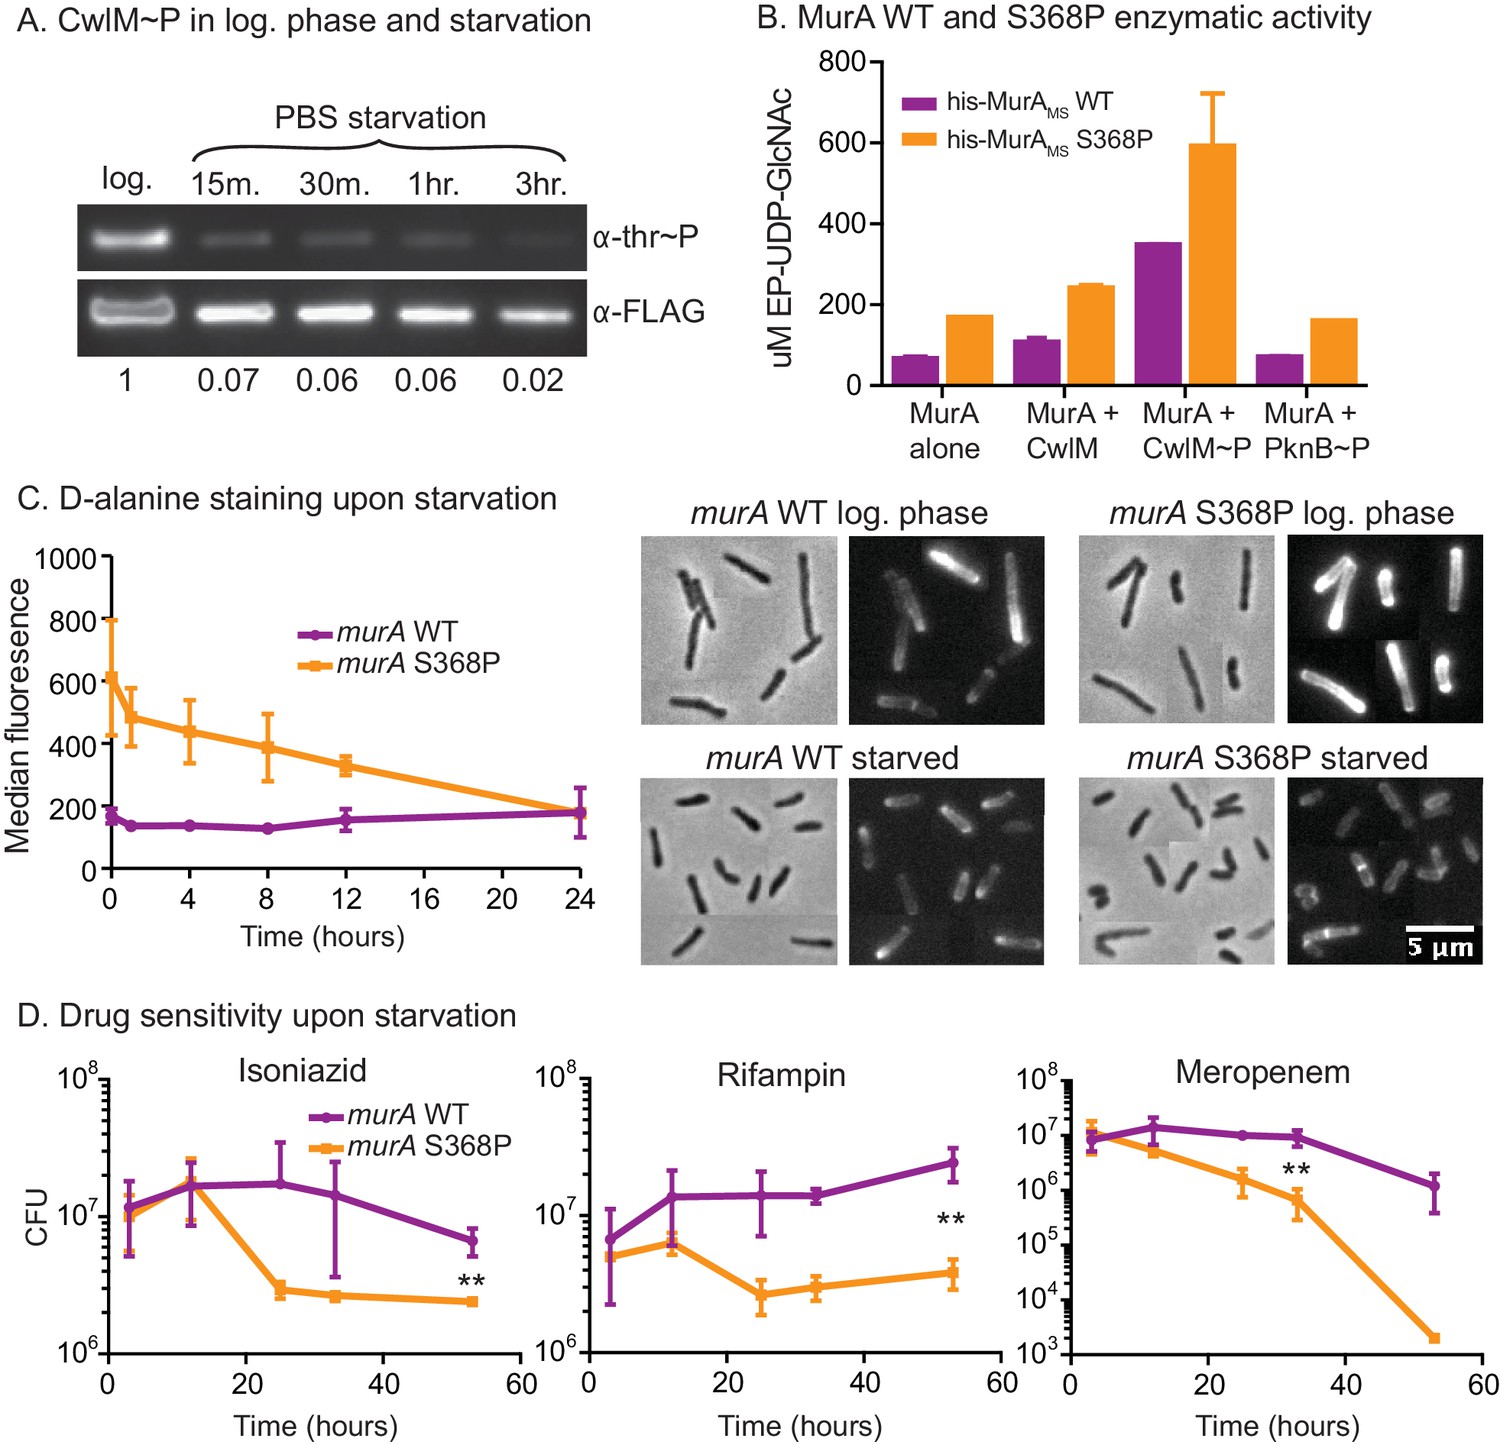
MurA is downregulated in starvation, contributing to drug tolerance.
(A) α-thr~P western blot showing the level of CwlM phosphorylation in the cwlM::FLAG strain (CB100) in log. phase and upon starvation in PBS. Ratio = signal of (α-thr~p / α-FLAG)starvation / (α-thr~p / α-FLAG)log phase(B) Amount of EP-UDP-GlcNAc produced after 30 min in a reaction with 20 µg/ml of his-MurAMSWT or his-MurAMSS368P, 2 mM PEP, 15 mM UDP-GlcNAc and either no or equimolar his-CwlMTB or his-CwlMTB~P. (C) Fluorescent intensity of WT (CB779) and murA S368P (CB782) cells pulse stained with TADA in log. phase HdB culture (t = 0) and at time points after initiation of starvation in PBS+tween 80, as measured by flow cytometry. The median fluorescence for 10K+ cells is shown. On the right are representative images of cells from the t = 0 (log. phase) and t = 24 (starved) time points. Phase and red fluorescent images of each are shown. The images were taken with identical exposure settings and the brightness and contrast was adjusted to identical levels. Pictures of several cells from images processed identically were pasted together. The scale bar applies to all the images. (D) Colony forming units per ml of strains with the murA WT (CB779) and S368P (CB782) alleles after transfer to PBS+tween80 starvation media and treatment with 100 µg/ml isoniazid, 20 µg/ml meropenem or 50 ug/ml rifampin. The p value for the indicated time point in each experiment was calculated by the student’s t test. Isoniazid = 0.0087; meropenem = 0.0082; rifampin = 0.0067.
Figure 6—figure supplement 1
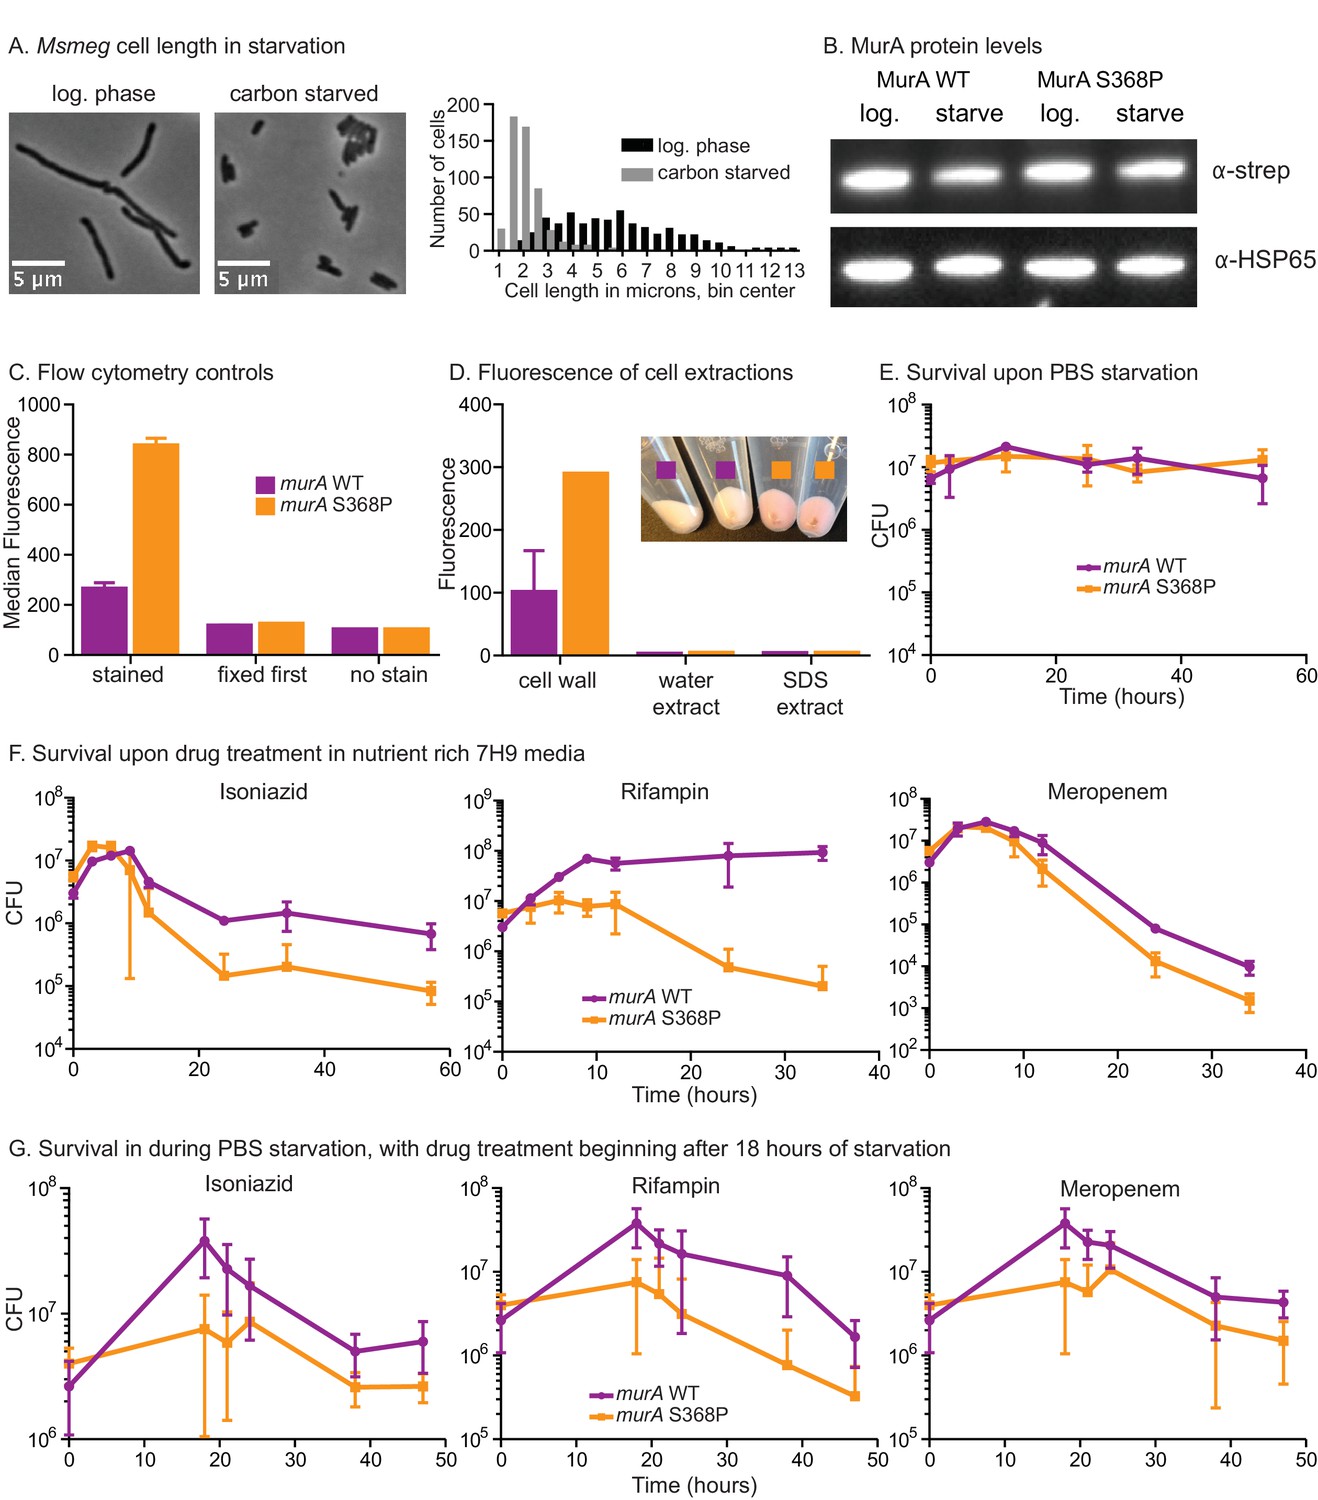
Phenotypes of murA S368P.
(A) Phase micrographs and quantification of Msmeg mc2155 (CB1) cell lengths in log. phase 7H9 and after 5 hr in HdB-C carbon starvation media. 500 cells from single cultures were measured for each condition. p<0.0001 by the student’s t test. (B). α-strep and α–Hsp65 western blots of A280-normalized lysates from murA WT (CB779) and S368P (CB782) cultures starved for four hours in Hdb-C. The murA allele in both these strains has a C-terminal strep tag. (C) Controls for flow cytometry. Cells were grown in HdB as in the t = 0 time point of Figure 6C, and either stained and then fixed as in Figure 6C, or fixed first and then stained, or fixed but not stained, and then subjected to flow cytometry. The median fluorescence for 10K+ cells is shown. (D) Fluorescence intensity of TADA stained murA WT and murA S368P cell fractions. Cells were extracted first with water and then SDS. The remaining cell wall pellets were photographed (inset), and all fractions measured by fluorimetry. Two replicates of each culture were used. (E) Colony forming units (CFU) of murA WT and S368P strains after being grown to log phase in 7H9, then pelleted and resuspended in PBS+tween80. (F) CFU of murA WT and S368P strains grown to log phase in 7H9 then treated with either 50 µg/ml isoniazid, 20 µg/ml rifampin or 5 µg/ml meropenem. (G) Colony forming units of murA WT and S368P strains after being grown to log phase in 7H9, then pelleted and resuspended in in PBS+tween80. At the 18 hr time point either 100 µg/ml isoniazid, 40 µg/ml rifampin or 20 µg/ml of meropenem was added. Error bars represent the standard deviation.
Figure 7
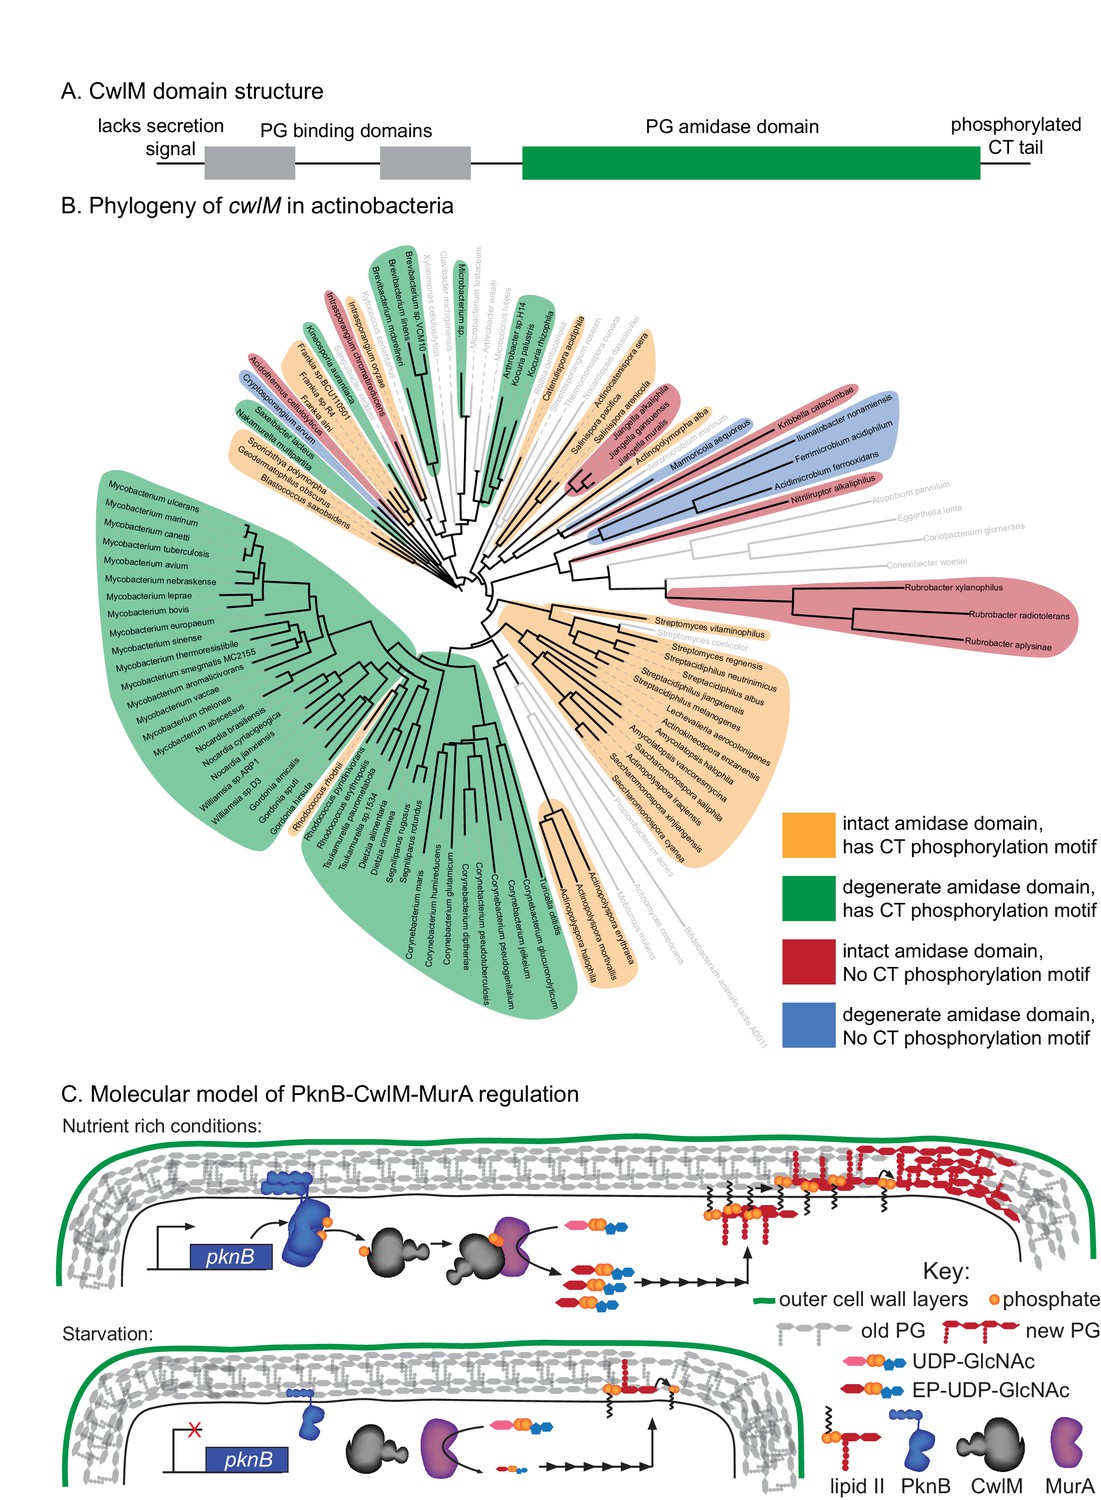
Phylogenetics and model for the PknB-CwlM-MurA regulatory pathway.
(A) Domain structure of CwlM from mycobacteria. (B) Phylogenetic analysis of cwlM in the actinobacteria. Tree is based on a 16S rRNA alignment for each species. Species indicated in gray do not contain cwlM homologues, and are representatives of larger clades. All homologues lack a predicted secretion signal. The conservation of an intact or degenerate amidase active site and the presence of a PTG or TGT phosphorylation motif are indicated by color. (C) Model for the regulation of MurA. In nutrient rich conditions PknB phosphorylates CwlM, which can then promote the activity of MurA, resulting in increased flux through the PG biosynthetic pathway (indicated by the series of arrows) and promoting cell growth. In starvation, PknB is poorly expressed, CwlM is not phosphorylated, and MurA is therefore not activated, resulting in reduced production of PG precursors, which helps to halt cell growth.
Additional files
-
Supplementary file 1
Strain information and table of MurA kinetics across species.
(a) Strains. Strains used, with strain number, abbreviated name used in the text and full genotype. (b) Plasmids. Plasmids used, with original reference for parent plasmid, and strain cross-reference. (c) Primers. Primers used to construct each strain. Those beginning with ‘p’ are plasmids, others are recombineered alterations on the chromosome. (d) Kinetic parameters of MurA proteins pulled from the literature.
- https://doi.org/10.7554/eLife.14590.016
Download links
A two-part list of links to download the article, or parts of the article, in various formats.
Downloads (link to download the article as PDF)
Open citations (links to open the citations from this article in various online reference manager services)
Cite this article (links to download the citations from this article in formats compatible with various reference manager tools)
A cytoplasmic peptidoglycan amidase homologue controls mycobacterial cell wall synthesis
eLife 5:e14590.
https://doi.org/10.7554/eLife.14590


