The anticancer natural product ophiobolin A induces cytotoxicity by covalent modification of phosphatidylethanolamine
- Harvard University, United States
- Howard Hughes Medical Institute, United States
- Rockefeller University, United States
Figures
Figure 1 with 4 supplements
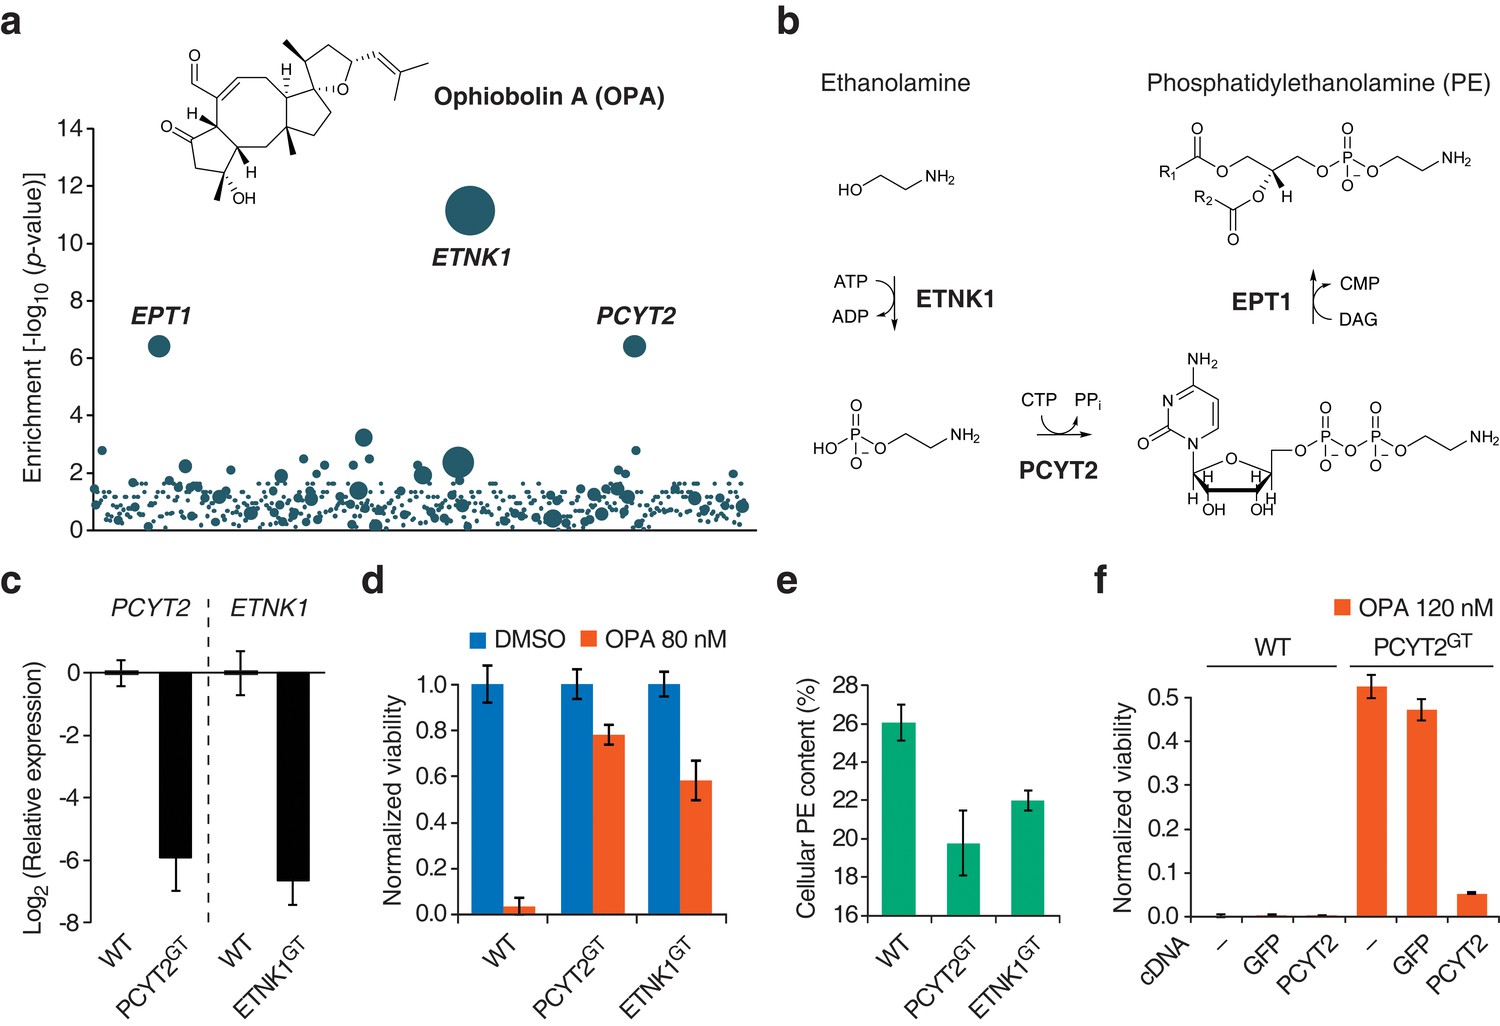
Identification of a genetic interaction between ophiobolin A (OPA) and the Kennedy pathway using a loss-of-function genetic screen in the near-haploid human cell line KBM7.
(a) A collection of loss-of-function mutants generated in KBM7 cells using retroviral insertional mutagenesis was treated with 388 nM OPA. Resistant clones were allowed to expand for 3 weeks and retroviral insertion sites were identified by high-throughput sequencing. For each gene, an enrichment factor (p-value) was calculated to quantify the enrichment of inactivating insertions in the pool of resistant clones compared to the number existing before selection. Each bubble represents a gene and the diameter of the bubble is proportional to the number of unique insertion sites in the pool of resistant clones (for ETNK1, N = 11). Genes are ordered on the x axis by chromosomal location (Figure 1—source data 1). (b) The Kennedy pathway: de novo synthesis of phosphatidylethanolamine. (c–e) Characterization of KBM7 clonal cell lines resistant to OPA treatment with inactivating mutations in either PCYT2 or ETNK1, referred to as PCYT2GT and ETNK1GT. (c) Quantification of relative PCYT2 and ETNK1 mRNA levels by RT-qPCR, normalized to levels in wild-type KBM7 (WT). (d) Cell viability measurement after 72 hr of treatment with OPA (or DMSO vehicle) using a luciferase-based assay quantifying ATP content. The viability of each vehicle-treated cell line was normalized to 1. (e) Determination of cellular phosphatidylethanolamine (PE) content by total lipid extraction, separation of phospholipids by thin layer chromatography and quantification of phospholipids by phosphorus content analysis. PE content is displayed as a percentage of total phospholipids. (f) Expression of PCYT2 in PCYT2GT cells restores OPA sensitivity. Constructs expressing either PCYT2 or GFP (control) were delivered to WT or PCYT2GT cells by lentiviral transduction. The viability of each cell line was assayed using a luciferase-based assay quantifying ATP content after 72 hr of treatment with OPA (or DMSO vehicle). '—' denotes non-transduced cell lines. (c–f) Results were obtained from three independent experiments (c and e) or from assays performed in triplicate (d and f) and data represent mean values ± standard deviation.
-
Figure 1—source data 1
Source data for the ophiobolin A (OPA) loss-of-function KBM7 screen.
- https://doi.org/10.7554/eLife.14601.004
Figure 1—figure supplement 1
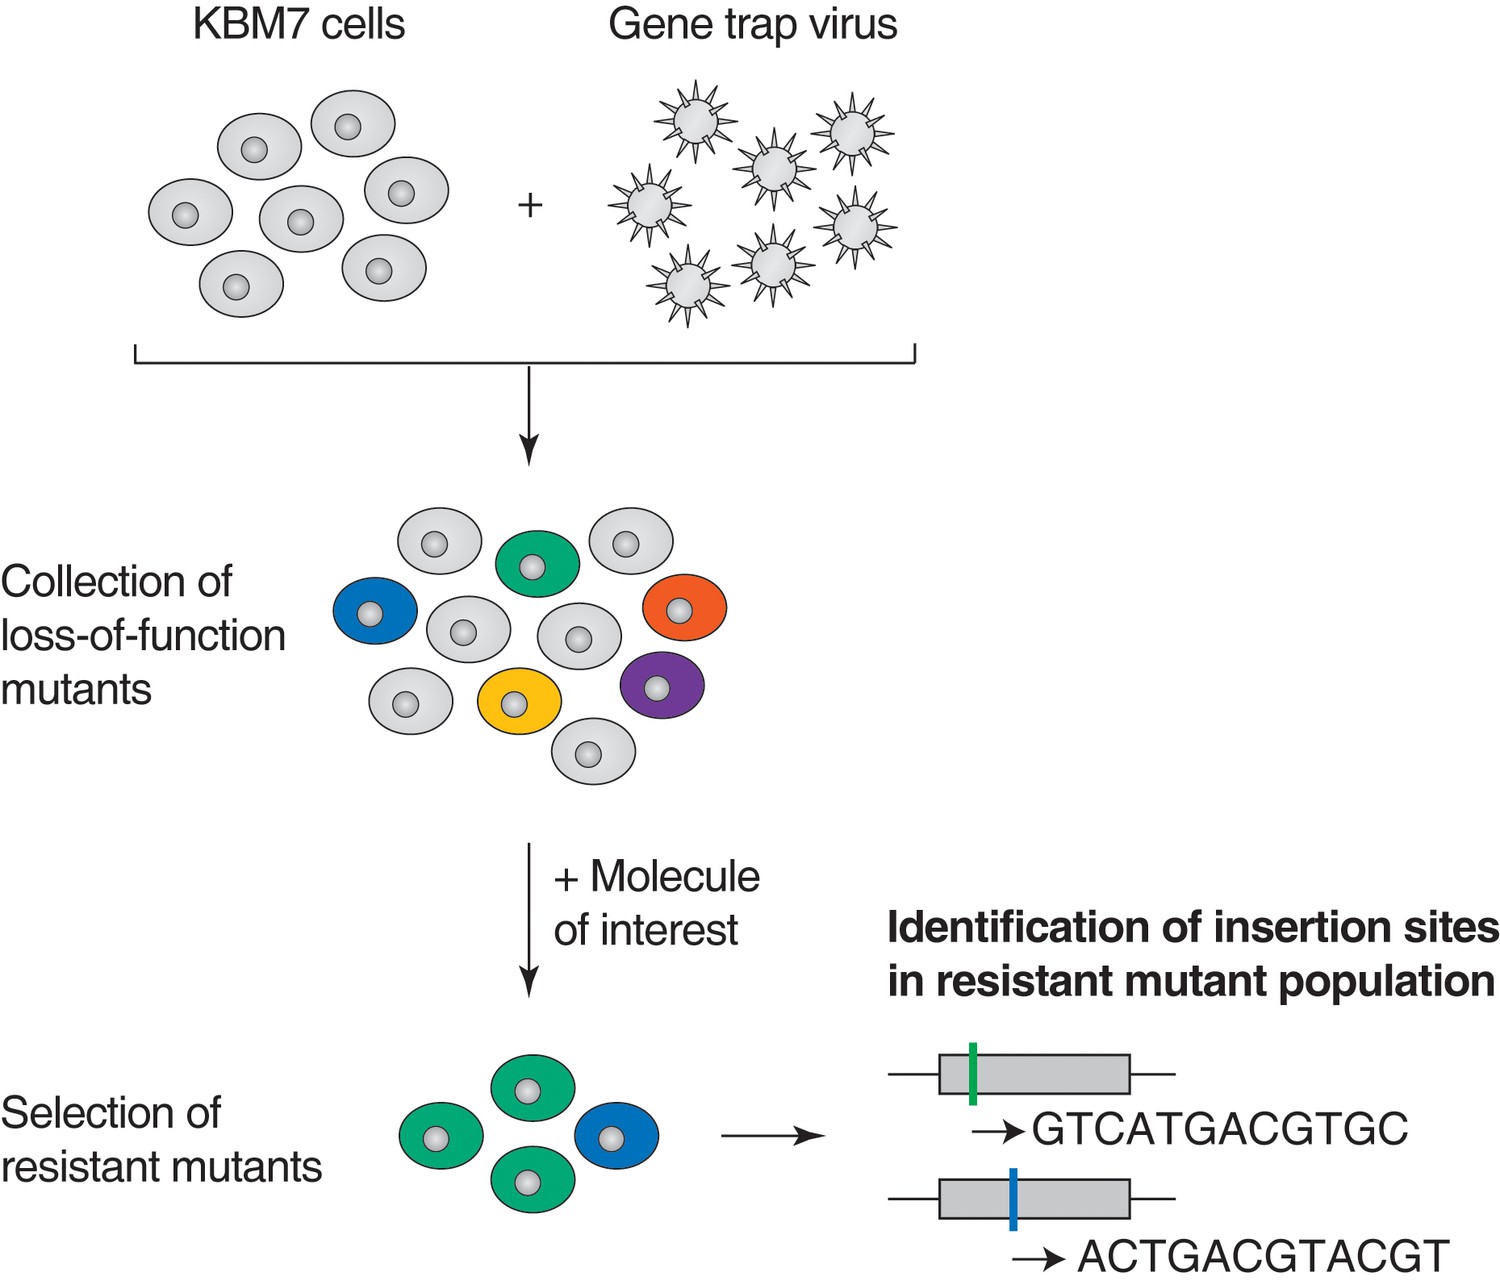
Illustration of loss-of-function genetic screens in haploid human KBM7 cells (Carette et al., 2009, 2011).
Near-haploid KBM7 cells are infected with a gene-trap retrovirus to generate random insertions. Insertions in exonic regions or in the sense orientation in intronic regions typically cause loss-of-function mutations. Mutagenized KBM7 cells are treated with a toxic dose of a molecule of interest and resistant clones are allowed to expand into colonies. Retroviral insertion sites in the pooled resistant population are identified by amplification of flanking genomic DNA by inverse PCR, high-throughput sequencing, and mapping to the human genome. For each gene locus, an enrichment p-value is calculated using Fisher's exact test by comparing the number of unique inactivating insertions in the pool of resistant cells to the number of unique inactivating insertions in mutagenized cells before selection. The location of retroviral insertion sites was analyzed in 5 million mutagenized cells before selection (representing 5% of the number of cells used per screen) and 142,800 unique insertions were identified, 38,628 of which were gene inactivating mutations (Materials and methods). This collection of 38,628 unique inactivating insertions was used in the calculation of enrichment p-values (Figure 1—figure supplement 1—source data 1).
-
Figure 1—figure supplement 1—source data 1
Source data for the characterization of mutagenized KBM7 cells before selection (control library).
- https://doi.org/10.7554/eLife.14601.006
Figure 1—figure supplement 2
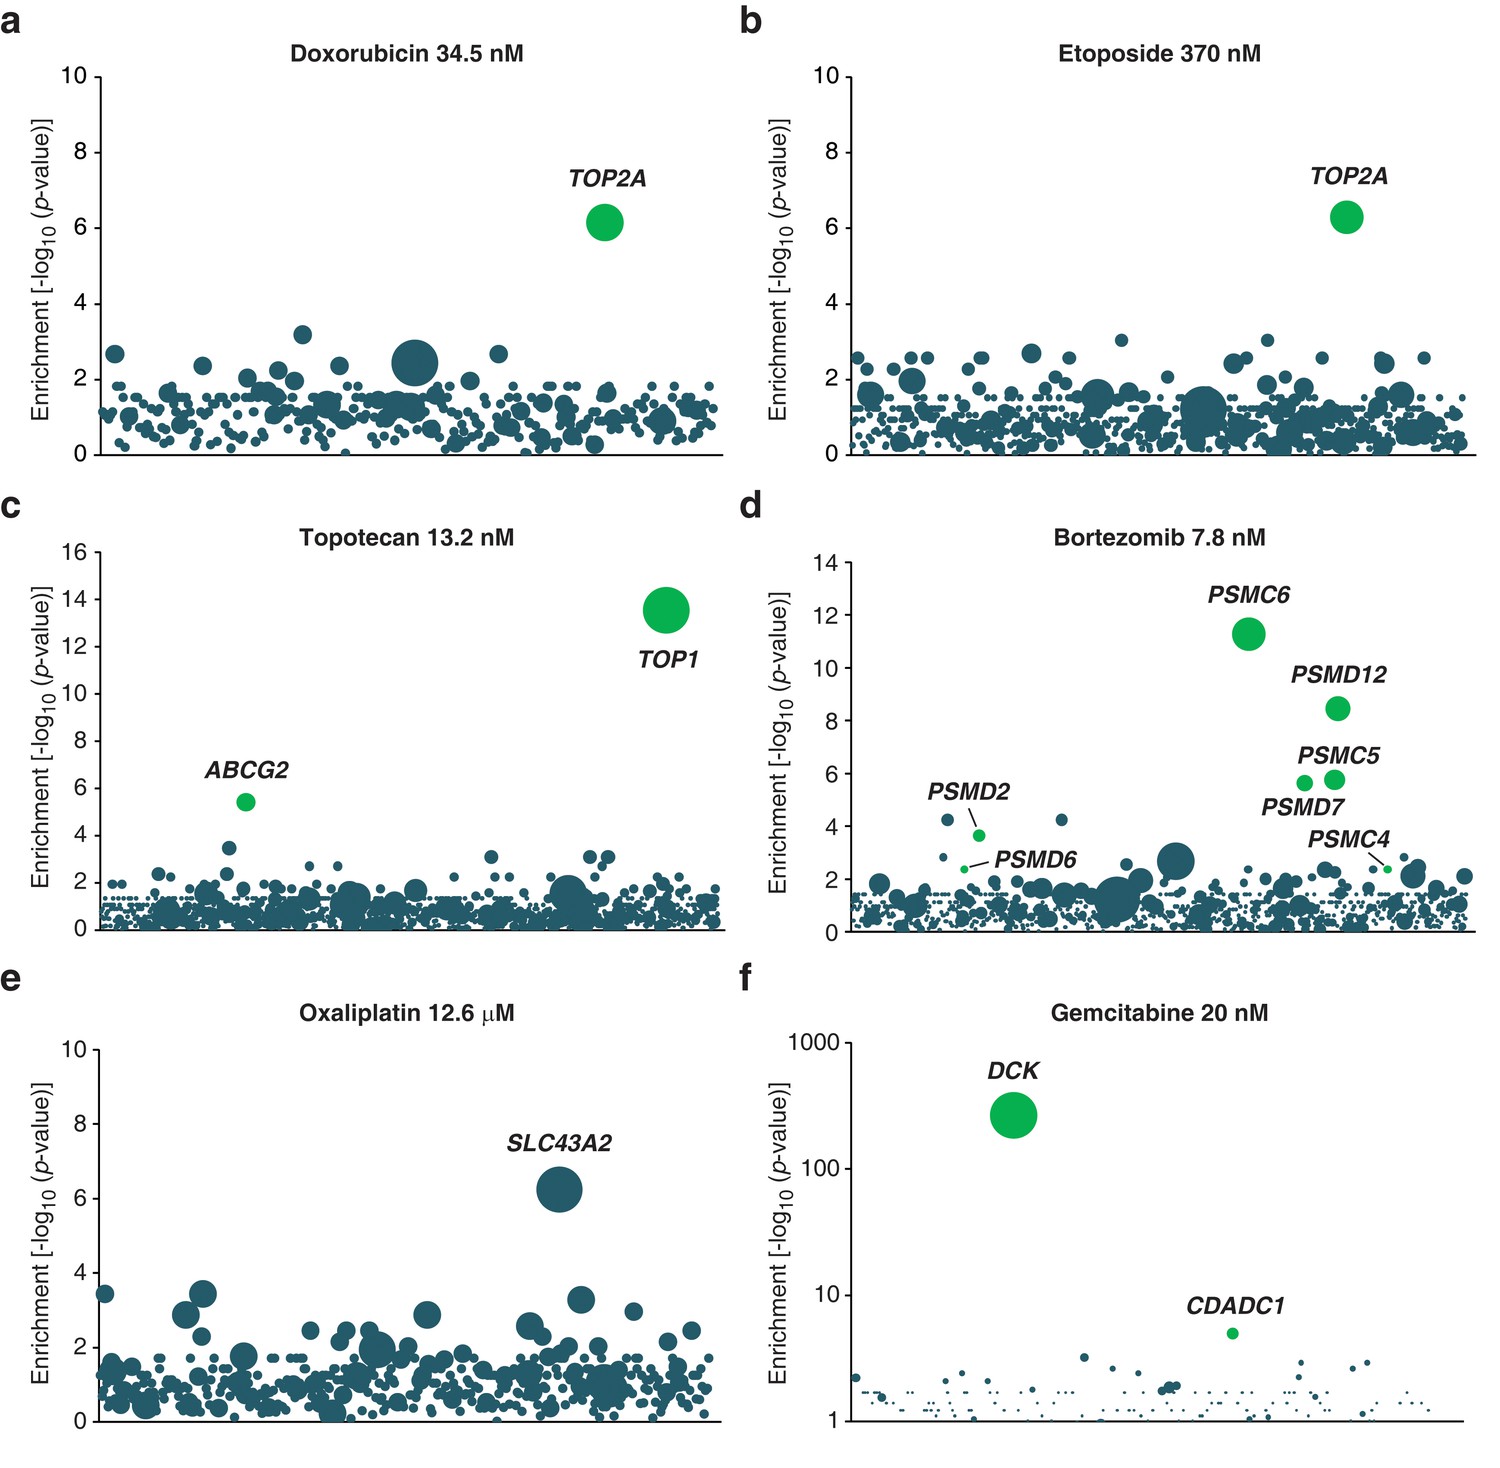
Validation of KBM7 loss-of-function screens using anticancer drugs with well-characterized mechanisms of action.
(a–f) Loss-of-function genetic screens were performed and displayed as described in Figure 1a. Cells were treated with anticancer drugs at the concentration specified in each panel. Green bubbles represent genes known to be involved in the mechanism of action of the drug tested and the diameter of the bubble is proportional to the number of unique insertion sites in the pooled resistant clones (doxorubicin, TOP2A: N = 4; etoposide, TOP2A: N = 5; topotecan, TOP1: N = 10; bortezomib, PSMC6: N = 8; oxaliplatin, SLC43A2: N = 5; gemcitabine, DCK: N = 161). Genes with a total of less than 50 sequencing reads were not displayed in the bubble plots. (a) The screen with doxorubicin uncovered TOP2A, which encodes topoisomerase IIA, the direct target of doxorubicin (Tewey et al., 1984). (b) The screen with etoposide uncovered TOP2A, consistent with its known mechanism of action (Montecucco and Biamonti, 2007). (c) The screen with topotecan identified its known direct target (Pommier, 2006), type I topoisomerase (TOP1), as well as ABCG2. It is known that overexpression, not inactivation, of this transporter causes resistance to topotecan (Mao and Unadkat, 2015). In the pooled resistant clones, retroviral integration sites clustered to the beginning of the ABCG2 transcript and most were actually found upstream of the transcription start site (TSS). A topotecan-resistant clone (ABCG2GT) with a retroviral site 400 bp upstream of the TSS of ABCG2 was isolated and the expression level of ABCG2 was determined by RT-qPCR (Materials and methods). ABCG2GT displayed a △△CT of 6.2 ± 0.3 compared to KBM7 indicating an increase in ABCG2 mRNA levels of up to 70-fold compared to KBM7 (mean values of three independent experiments ± standard deviation). (d) The screen with bortezomib, a proteasome inhibitor (Adams, 2004), identified proteasome subunits (PSMC6, PSMD12, PSMC5, PSMD7, PSMD2). (e) The screen with oxaliplatin, a DNA crosslinker, identified SLC43A2, a solute carrier that transports neutral amino acids into cells (Bodoy et al., 2013), suggesting that SLC43A2 facilitates the transport of oxaliplatin into cells consistent with the known role of solute carriers in the transport of anticancer drugs (Li and Shu, 2014). (f) The screen with gemcitabine, a deoxycytidine analog, identified DCK and CDADC1. Deficiency of DCK is associated with gemcitabine resistance (Bergman et al., 2002) and CDADC1 is a cytidine and dCMP deaminase known to be involved in resistance to deoxycytidine analogs (Cai et al., 2008) (Figure 1—figure supplement 2—source data 1).
-
Figure 1—figure supplement 2—source data 1
Source data for anticancer drug loss-of-function KBM7 screens.
- https://doi.org/10.7554/eLife.14601.008
Figure 1—figure supplement 3
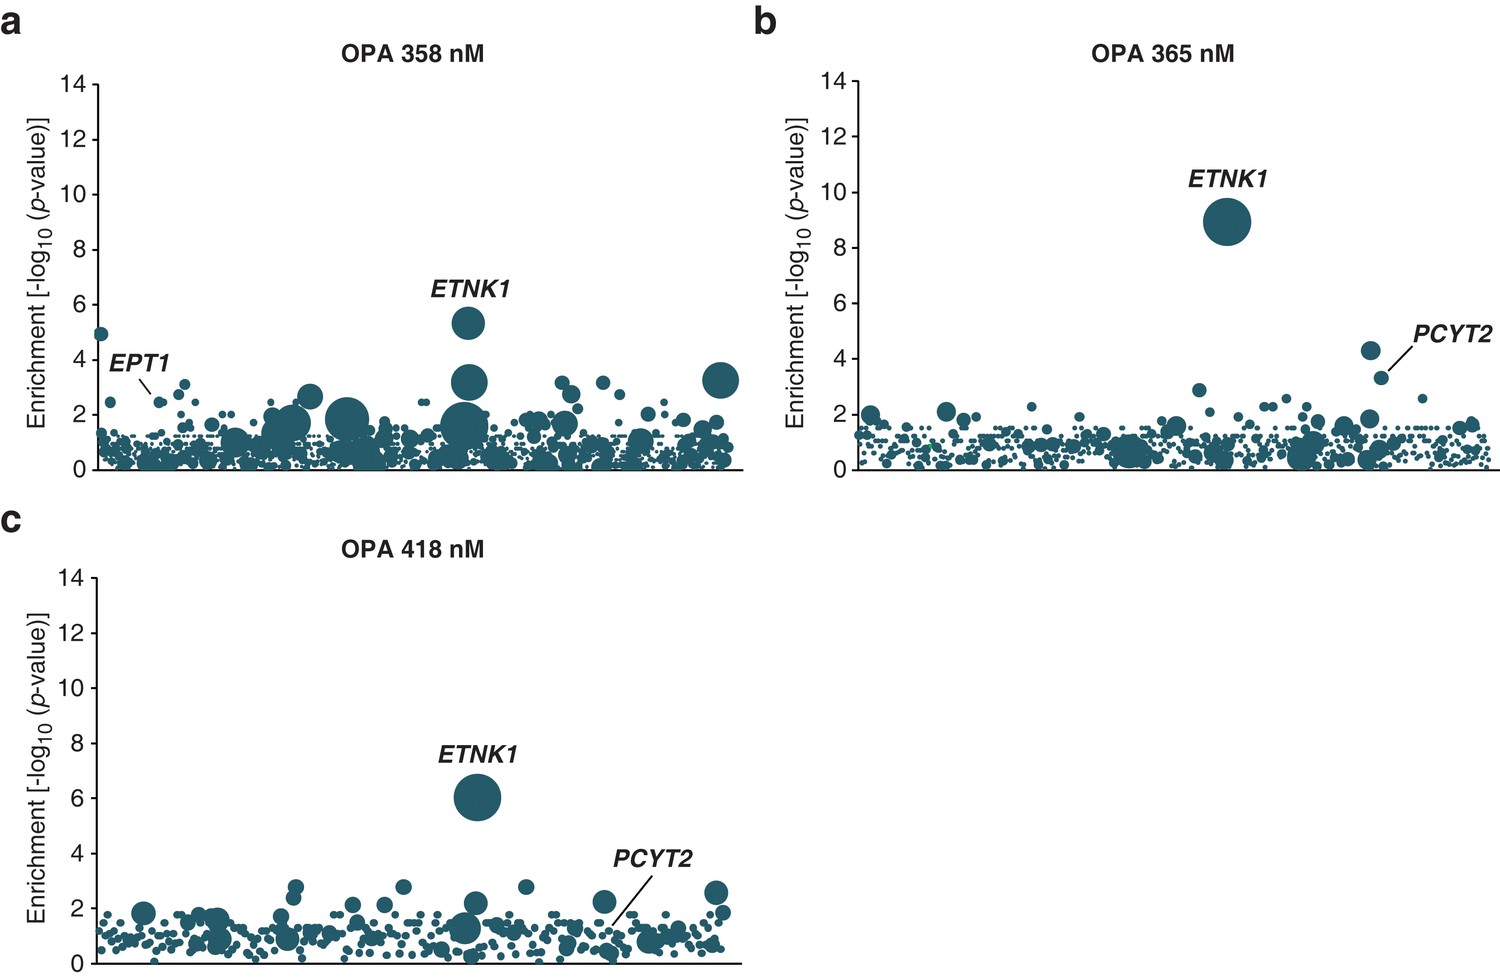
Loss-of-function genetic screens in KBM7 cells performed at three different concentrations of ophiobolin A (OPA) consistently identify genes in the Kennedy pathway.
(a–c) Screens were performed and analyzed as in Figure 1a, at the indicated concentrations of OPA. Each bubble represents a gene and the diameter of the bubble is proportional to the number of unique insertion sites in the pool of resistant clones (for OPA 358 nM, ETNK1: N=9; for OPA 365 nM, ETNK1: N=10; for OPA 418 nM, ETNK1: N=6) (Figure 1—figure supplement 3—source data 1).
-
Figure 1—figure supplement 3—source data 1
Source data for additional ophiobolin A (OPA) loss-of-function KBM7 screens.
- https://doi.org/10.7554/eLife.14601.010
Figure 1—figure supplement 4

Titration of the toxicity of ophiobolin A (OPA) towards KBM7 wild-type and gene-trapped cell lines, and additional data for complementation assays.
(a) Viability of wild-type KBM7 (WT), PCYT2GT, and ETNK1GT cell lines after treatment with OPA. Cells grown in standard conditions were treated with OPA (or DMSO vehicle) at the indicated concentration for 72 hr. Cell viability was quantified using a commercial luciferase-based assay measuring ATP content and the viability of each vehicle-treated cell line was normalized to 1. (b,c) Additional characterization of complemented PCYT2GT cells. Constructs expressing either PCYT2 or GFP (control) were delivered to WT or PCYT2GT cells by lentiviral transduction. '—' denotes non-transduced cell lines. (b) Quantification of relative PCYT2 mRNA levels by RT-qPCR in cell lines expressing the indicated cDNA, normalized to the level of PCYT2 mRNA in WT. (c) Determination of cellular phosphatidylethanolamine (PE) content in complemented cell lines by total lipid extraction, separation of phospholipids by thin layer chromatography, and quantification of phospholipids by phosphorus content analysis. The PE content of WT was normalized to 100%. (a–c) Results were obtained from assays performed in triplicate and data represent mean values ± standard deviation.
Figure 2
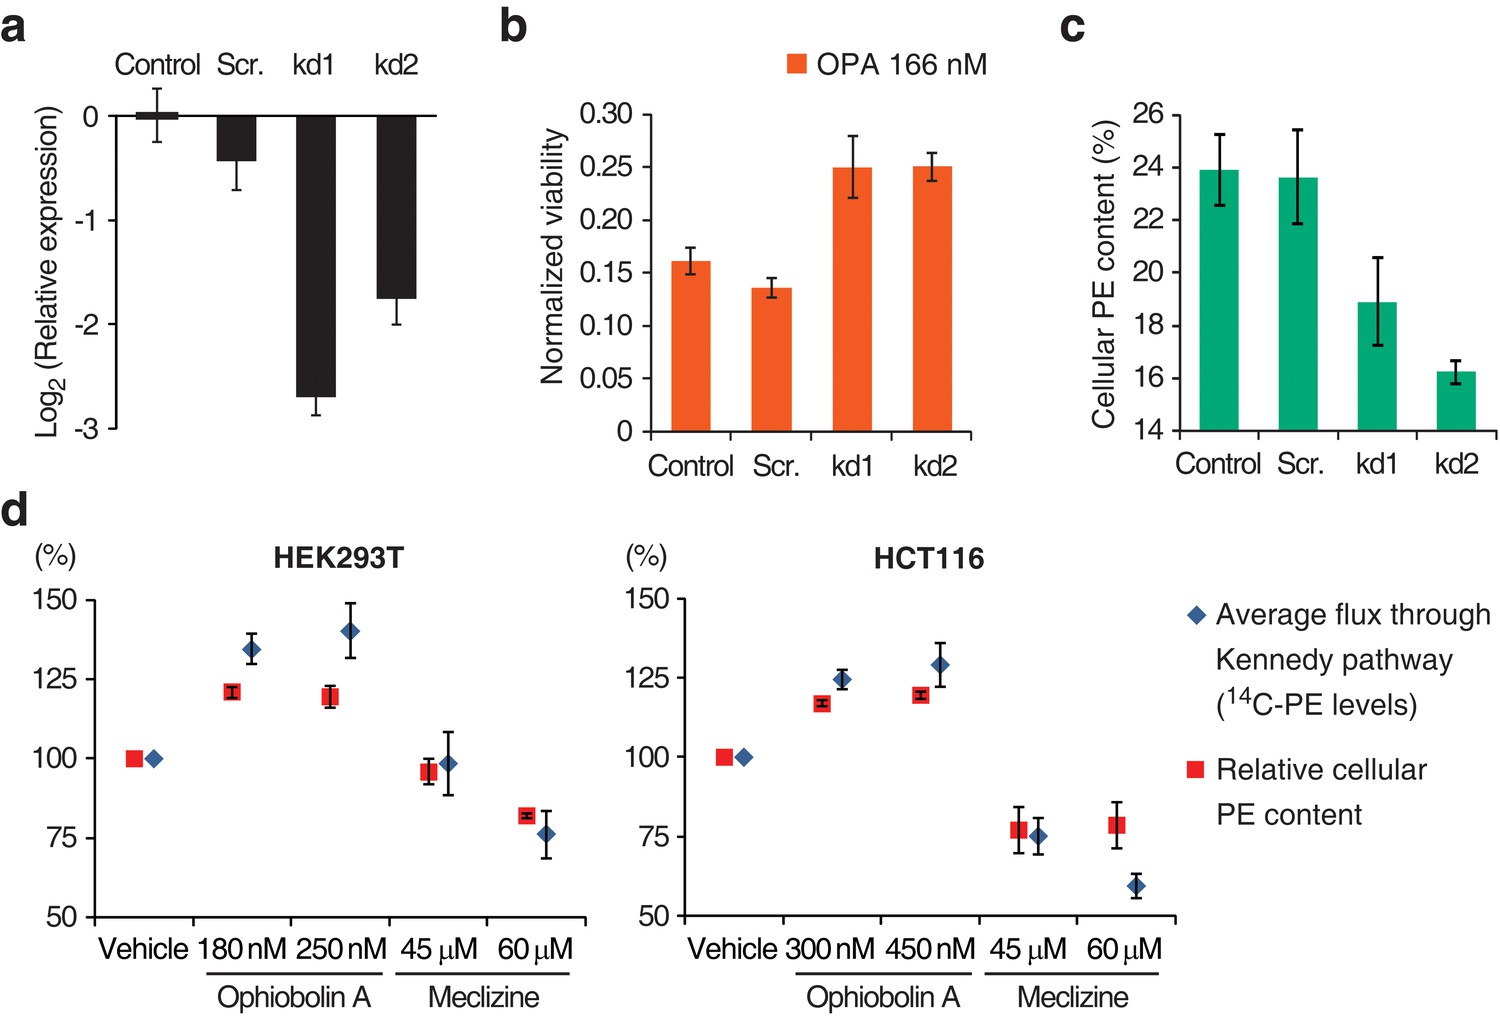
Interaction between the activity of the Kennedy pathway and ophiobolin A (OPA) cytotoxicity.
(a–c) shRNA knockdown of the Kennedy pathway in HEK293T cells leads to increased resistance to OPA toxicity. Constructs enabling stable expression of shRNAs against PCYT2 (kd1 and kd2), a scrambled shRNA (Scr.), or an empty vector control (Control) were delivered to HEK293T cells by lentiviral transduction. Results were obtained from assays performed on three independent transduced cell lines and data represent mean values ± standard deviation. (a) Quantification of relative PCYT2 mRNA levels by RT-qPCR, normalized to the level of PCYT2 mRNA in the control. (b) Cell viability measurement after 72 hr of treatment with OPA (or DMSO vehicle) using a luciferase-based assay quantifying ATP content. The viability of each vehicle-treated cell line was normalized to 1. (c) Determination of cellular phosphatidylethanolamine (PE) levels by total lipid extraction, separation of phospholipids by thin layer chromatography (TLC), and quantification of phospholipids by phosphorus content analysis. PE content is displayed as a percentage of total phospholipids. (d) OPA treatment activates the Kennedy pathway and increases PE content in HEK293T and HCT116 cells. Cells were treated with OPA, meclizine, or DMSO vehicle for 5 hr, then ethanolamine [1,2-14C] was added and the treatment was prolonged for an additional 24 hr. Total phospholipids were extracted and separated by silica gel TLC. PE contents were quantified as in (c) and the PE content of vehicle-treated cells was normalized to 100%. 14C-PE levels were quantified by liquid scintillation counting of silica scrapings and were normalized to total phospholipid content. Results were obtained from three independent experiments and data represent mean values ± standard error of the mean.
Figure 3 with 2 supplements

Ophiobolin A (OPA) reacts with the ethanolamine (Etn) head group of phosphatidylethanolamine (PE) via a Paal-Knorr reaction.
(a) Exogenous PE, but not phosphatidylcholine (PC) or phosphatidylserine (PS), added to growth medium quenches the cytotoxicity of OPA. Commercially available phospholipids extracted from chicken egg (PE and PC) or bovine brain (PS) (or vehicle) were added to 20 ng/μL (~25 μM) to the growth medium of HEK293T cells. Cells were subsequently treated with OPA (or DMSO vehicle) for 72 hr and cell viability was then quantified using a luciferase-based assay measuring ATP content. The viability of vehicle-treated cells in the absence of OPA was normalized to 1. (b) The primary amine of Etn is essential for OPA inactivation. A cell viability assay was performed as in (a) with Etn, O-phosphorylethanolamine (Phospho-Etn) and triethanolamine (Trietn). Only viabilities in 300 nM OPA are displayed and the viability of vehicle-treated cells in 300 nM OPA was normalized to 100%. Full plots are available in Figure 3—figure supplement 1b. (c) OPA was incubated with an excess of Etn (or ethanol control) in aqueous buffer. HEK293T cells grown in standard conditions were treated with the reaction product for 72 hr and cell viability was then quantified using a luciferase-based assay measuring ATP content. (a–c) Results were obtained from assays performed in triplicate and data represent mean values ± standard deviation. (d) Liquid chromatography-mass spectrometry (LC-MS) analysis in positive ion mode of the in vitro reaction of OPA (exact mass = 400.2614) with Etn (exact mass = 61.0528) shows formation of a single product at an m/z corresponding to an addition reaction minus two molecules of H2O. Both OPA and Etn were used as reactant controls and the total ion chromatograms of the three samples are displayed overlaid. The m/z of the most abundant ion is displayed above corresponding peaks. (e) OPA reacts with Etn to form a pyrrole-containing product detectable using Ehrlich's reagent. An in vitro reaction of OPA with Etn was mixed with Ehrlich's reagent and the absorbance of the resulting solution was measured between 450 and 700 nm. Reactions with DMSO (vehicle) instead of OPA and Trietn instead of Etn were used as negative controls. (f) Proposed reaction between PE and OPA.
Figure 3—figure supplement 1

Additional data for ophiobolin A (OPA) inactivation assays with exogenously added small molecules.
(a) Commercially available phospholipids (or vehicle) were added at 20 or 40 ng/μL (~25 or 50 μM) to the growth medium of HEK293T cells. Cells were subsequently treated with OPA (or DMSO vehicle) for 72 hr and cell viability was then quantified using a luciferase-based assay measuring ATP content. The viability of vehicle-treated cells in the absence of OPA was normalized to 1. For clarity, only cell viability data in the presence of OPA are displayed. (b) Full plots of the data displayed in Figure 3b. The viability of vehicle-treated cells in the absence of OPA was normalized to 1.0. (c) Assay performed as in (a) using synthetic DOPC (dioleoyl-PC), DOPE (dioleoyl-PE), and DOPS (dioleoyl-PS). (d) Assay performed as in Figure 3b, but using ethanolamine and serine. (e) OPA inactivation assays with 1,4-dicarbonyl scavengers, lysine, and ethanolamine. Assays were performed and displayed in a similar way as in (b) except that the exogenous molecules were preincubated with OPA in phosphate-buffered saline at 5× their final concentration for 2.5 hr before adding to the growth medium of HEK293T cells. (a–e) Results were obtained from assays performed in triplicate and data represent mean values ± standard deviation.
Figure 3—figure supplement 2
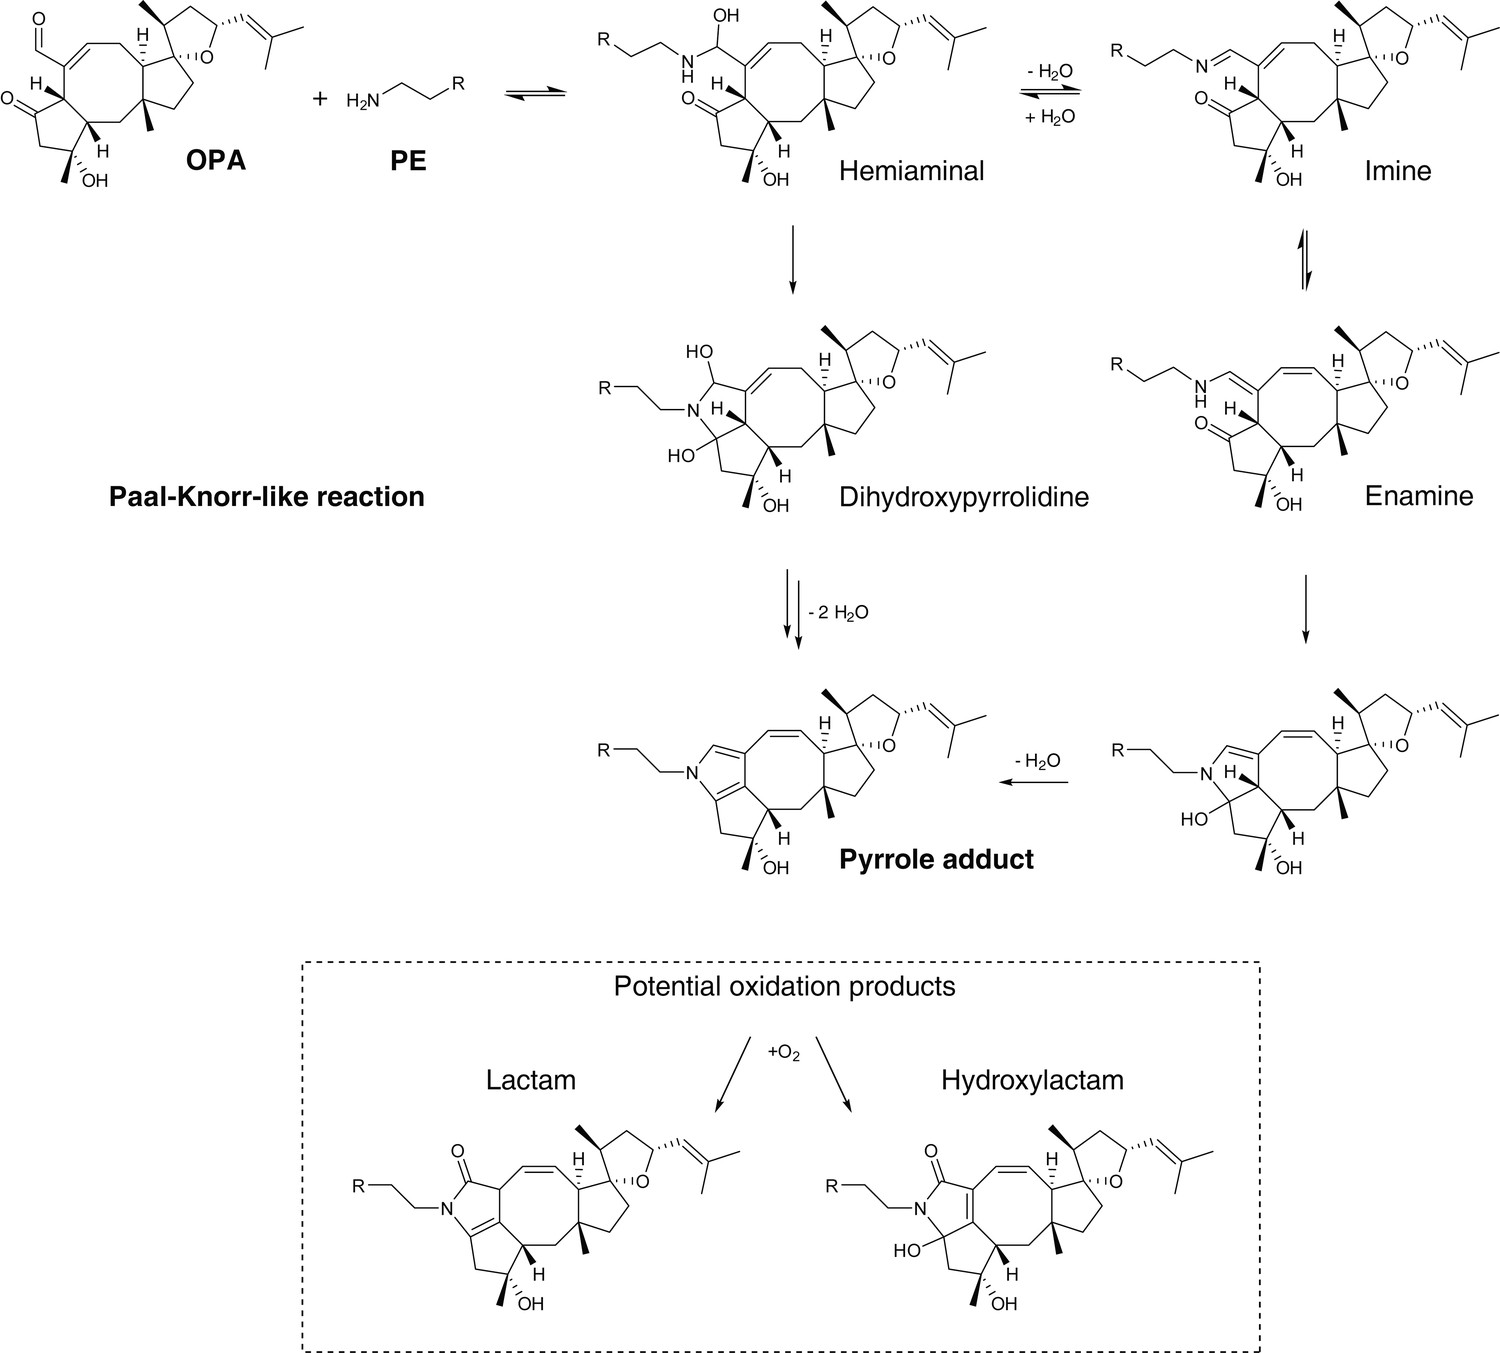
Proposed mechanism of covalent modification of phosphatidylethanolamine (PE) by ophiobolin A (OPA) through a Paal-Knorr-like reaction pathway (Bernoud-Hubac et al., 2004; Amarnath et al., 1991, 1995).
Addition of the amino group of PE onto the aldehyde moiety of OPA leads to formation of a hemiaminal. Based on the mechanism of the Paal-Knorr reaction and the specific reactivity of OPA, the reaction between PE and OPA is believed to proceed through two potential mechanisms: (i) elimination of a water molecule leading to formation of an imine and subsequent rearrangement to an enamine. Cyclization of the enamine followed by dehydration yields the final pyrrole-containing adduct. (ii) Cyclization of the hemiaminal leads to formation of a dihydroxypyrrolidine. A double elimination of water and double bond shift leads to the final pyrrole-containing adduct. In studies involving the formation of pyrrole adducts from the reaction of 4-oxohexanal and a primary amine, the reaction is known to proceed through the mechanism involving cyclization of the hemiaminal (Amarnath et al., 1995). Under certain conditions, pyrrole adducts are known to be oxidized and the two main expected products are the lactam and hydroxylactam derivatives (Sullivan et al., 2010). In addition, OPA contains an unsaturated aldehyde moiety which is known to readily react with thiols in a Michael addition reaction (Grimsrud et al., 2008). 4-Oxo-2-nonenal, a product of cellular lipid oxidation which has similar reactive functionalities as OPA, has been shown to readily react with N-acetylcysteine (Amarnath and Amarnath, 2015). Interestingly, initial Michael adduct formation of OPA with a thiol would not prevent a subsequent Paal-Knorr reaction with PE and furthermore these two sequential reactions could lead to protein-lipid crosslinking, a potential cause of cytotoxicity.
Figure 4 with 2 supplements
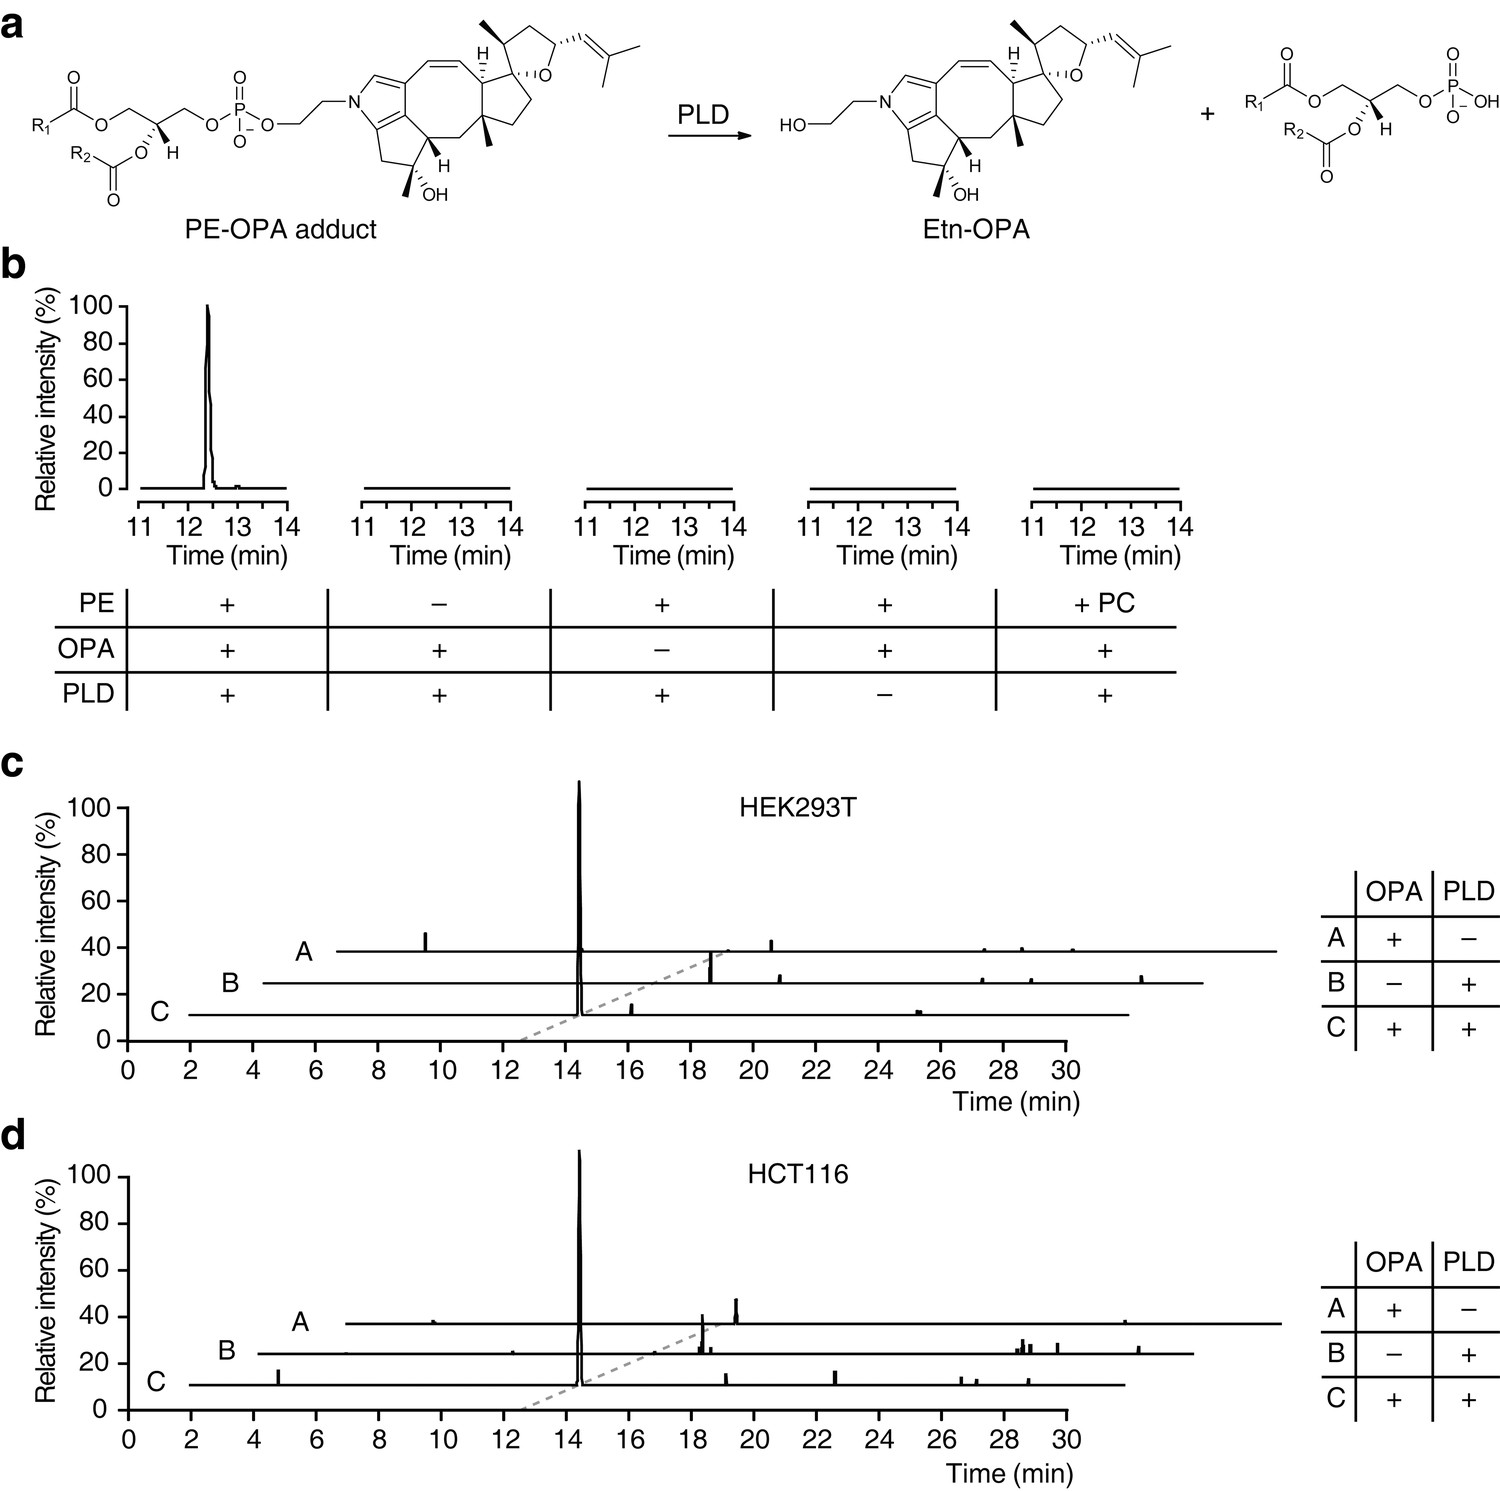
Ophiobolin A (OPA) forms a pyrrole-containing covalent adduct with phosphatidylethanolamine (PE) in human cells.
(a) Formation of PE-OPA adducts was detected by measuring the abundance of ethanolamine-OPA (Etn-OPA) after hydrolysis by phospholipase D from Streptomyces chromofuscus (PLD). (b) Extracted ion chromatograms (m/z = 426.2982–426.3024) of the liquid chromatography-mass spectrometry (LC-MS) analysis of in vitro reactions of PE with OPA and subsequent digestion with PLD. Control reactions include systematic replacement of each reagent by vehicle and replacement of PE with phosphatidylcholine (PC). (c–d) Extracted ion chromatograms (m/z = 426.2982–426.3024) showing the detection of PE-OPA adducts in lipids extracted from cells treated with OPA. (c) HEK293T cells grown in standard conditions were incubated with 250 nM OPA for 24 hr. Total cellular lipids were extracted in the presence of pentyl-pyridoxamine to quench unreacted OPA. Lipids were incubated with PLD and analyzed by LC-MS for the presence of Etn-OPA. Negative controls include replacement of OPA by DMSO vehicle or absence of PLD treatment. (d) Same as (c) but for HCT116 cells treated with 450 nM OPA. Full chromatograms and replicate experiments are available in Figure 4—figure supplement 1.
Figure 4—figure supplement 1
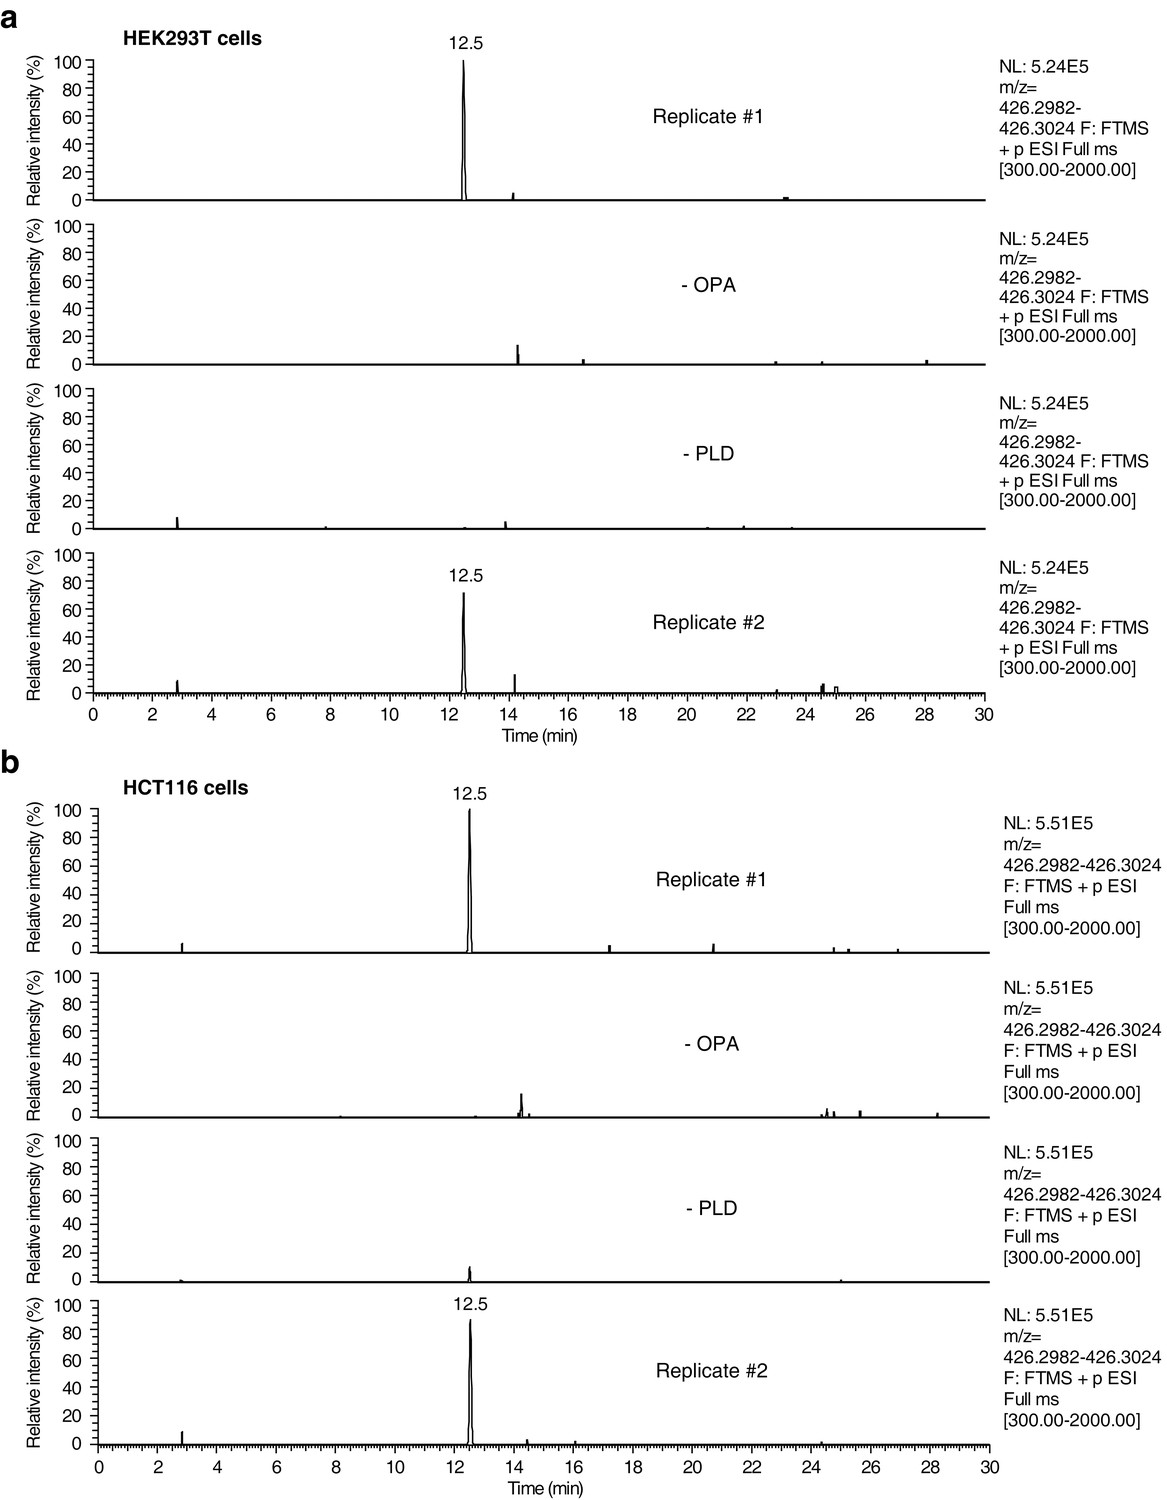
Raw data and replicate experiment for data represented in Figure 4c–d.
Extracted ion chromatograms (m/z = 426.2982–426.3024) showing the detection of phosphatidylethanolamine-ophiobolin A (PE-OPA) adducts in lipids extracted from cells treated with OPA. (a) HEK293T cells grown in standard conditions were incubated with 250 nM OPA for 24 hr. Total cellular lipids were extracted in the presence of pentyl-pyridoxamine to quench unreacted OPA and prevent any post-lysis reaction. Lipids were then incubated with phospholipase D (PLD) and analyzed by LC-MS for presence of Etn-OPA. Negative controls include replacement of OPA by DMSO vehicle (- OPA) or absence of PLD treatment (- PLD). (b) Same as (a) but for HCT116 cells treated with 450 nM OPA. Extracted ion intensity levels ('NL') were normalized to the peak of highest intensity.
Figure 4—figure supplement 2
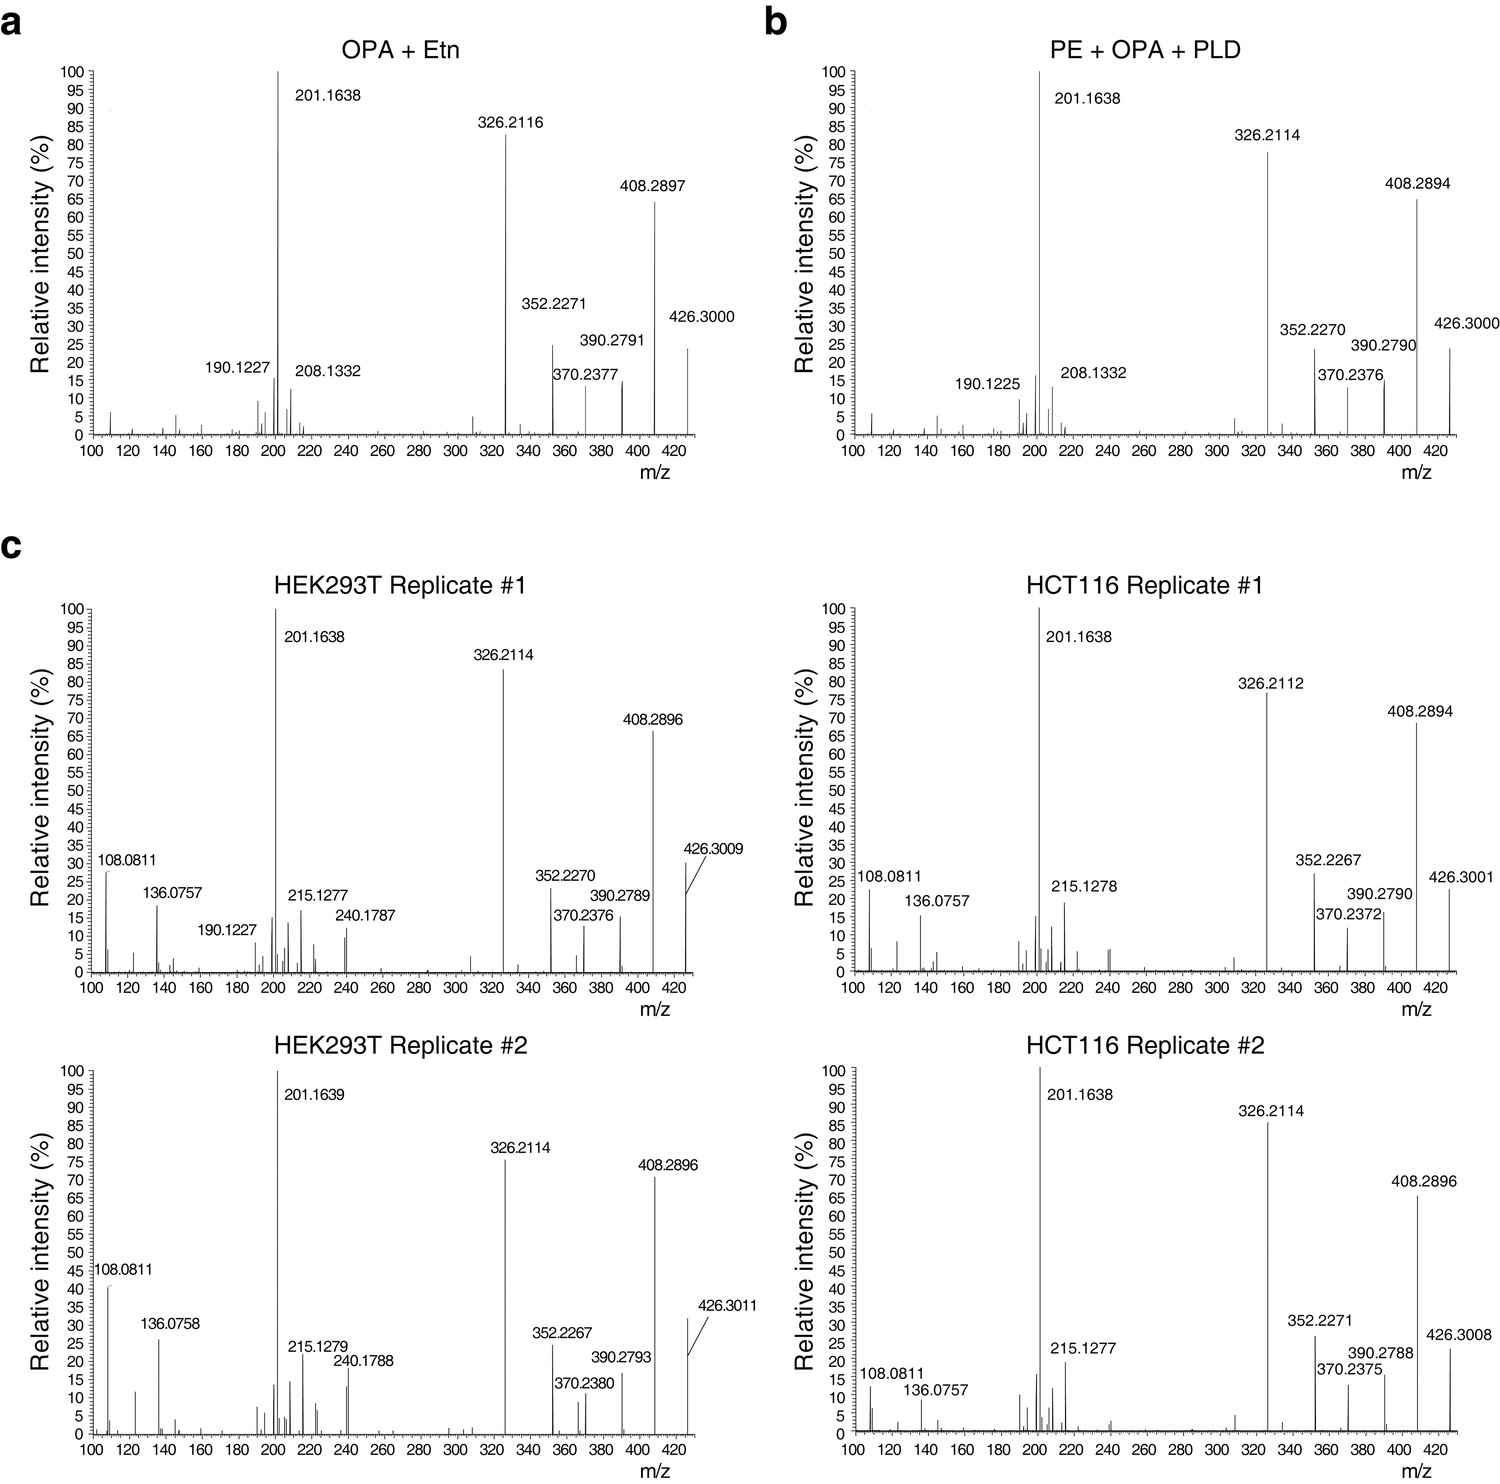
Higher-energy collisional dissociation (HCD) MS/MS fragmentation spectra of ethanolamine-ophiobolin A (Etn-OPA).
(a–c) Etn-OPA was unequivocally characterized by its exact mass, liquid chromatography retention time, and MS/MS fragmentation pattern. Ions at m/z = 426.30 and at a retention time of 12.5 min were fragmented by collision-induced dissociation to ensure an MS/MS spectrum consistent with that of Etn-OPA prepared by incubation of OPA with ethanolamine. [M+H]+ ions were targeted using dynamic exclusion at a normalized collision energy of 35 eV. (a) HCD spectrum of ion at m/z = 426.30 and at a retention time of 12.5 min in the experiment in Figure 3d involving in vitro reaction of OPA with ethanolamine. (b) HCD spectrum of ion at m/z = 426.30 and at a retention time of 12.5 min in the experiment in Figure 4b involving in vitro reaction of OPA with phosphatidylethanolamine (PE) and hydrolysis with phospholipase D (PLD). (c) HCD spectrum of ions at m/z = 426.30 and at a retention time of 12.5 min in the experiments in Figure 4c–d and Figure 4—figure supplement 1 involving PLD hydrolysis of phospholipids extracted from cells treated with OPA.
Figure 5
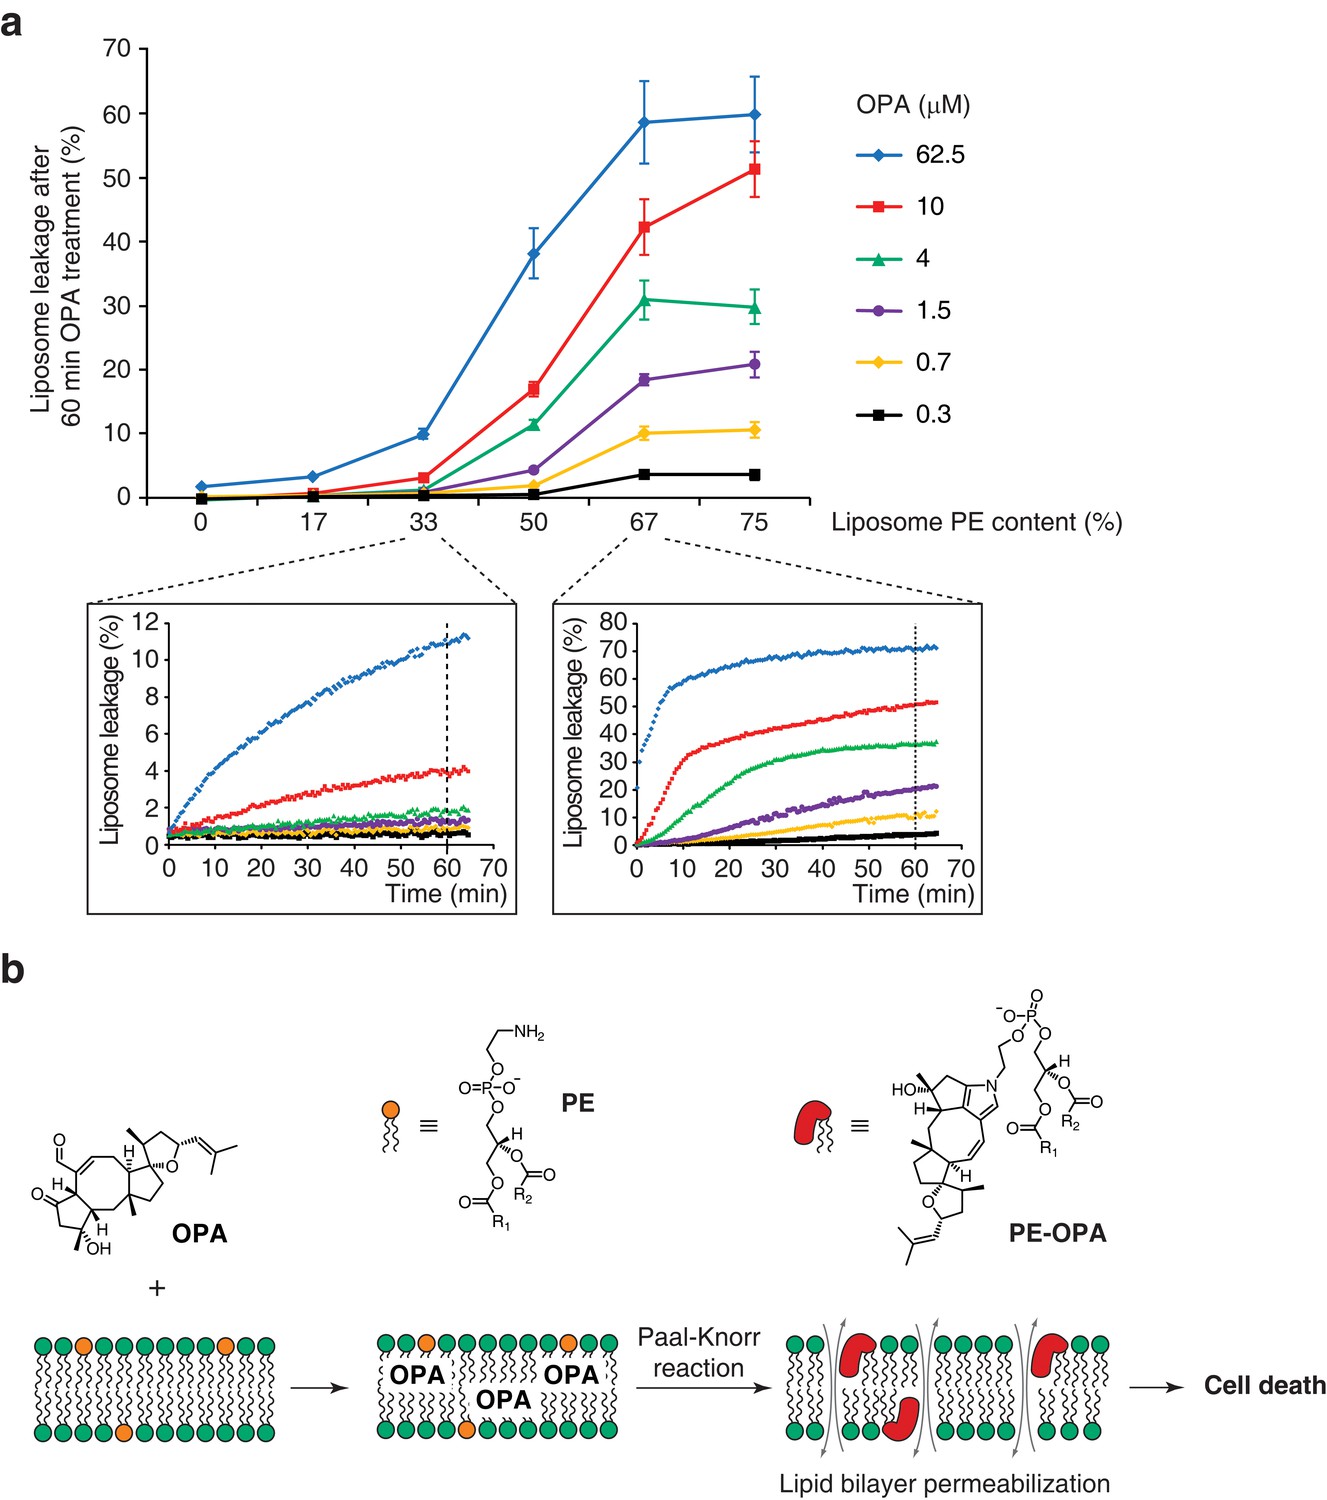
Ophiobolin A (OPA) induces leakage from liposomes.
(a) Effect of 60 min OPA treatment on the leakage of the fluorescent dye calcein from artificial liposomes composed of various ratios of phosphatidylethanolamine (PE) to phosphatidylcholine (PC). Large unilamellar vesicles (LUVs) composed of dioleoyl-PE and dioleoyl-PC, and encapsulating calcein were prepared by extrusion. Leakage assays were initiated by addition of OPA and were monitored by quantification of the fluorescence of calcein, which dequenches upon release from liposomes. OPA-induced liposome leakage was determined by normalization of fluorescence to a DMSO vehicle control (0% leakage) and to detergent-treated liposomes (100% leakage). Results were obtained from assays performed in triplicate and data represent mean values ± standard error of the mean. Inset plots display examples of the kinetics of leakage after OPA addition for two liposome preparations. (b) Proposed model of the mechanism of action of OPA in human cells. When applied to cells, OPA accumulates in the phospholipid bilayer of the plasma membrane as it is a lipophilic compound. Due to high local concentrations or the hydrophobic environment (or both), OPA efficiently reacts with the primary amine head group of phosphatidylethanolamine (PE) in a Paal-Knorr-like reaction. Formation of PE-OPA adducts changes the biophysical properties of PE by modifying its head group from small and polar to bulky and hydrophobic, leading to membrane permeabilization and ultimately cell death.
Additional files
-
Supplementary file 1
Oligonucleotides used in this study.
- https://doi.org/10.7554/eLife.14601.020
Download links
A two-part list of links to download the article, or parts of the article, in various formats.
Downloads (link to download the article as PDF)
Open citations (links to open the citations from this article in various online reference manager services)
Cite this article (links to download the citations from this article in formats compatible with various reference manager tools)
The anticancer natural product ophiobolin A induces cytotoxicity by covalent modification of phosphatidylethanolamine
eLife 5:e14601.
https://doi.org/10.7554/eLife.14601


