Co-expression of Foxa.a, Foxd and Fgf9/16/20 defines a transient mesendoderm regulatory state in ascidian embryos
- Sorbonne Universités, UPMC Univ Paris 06, CNRS, France
Figures
Figure 1
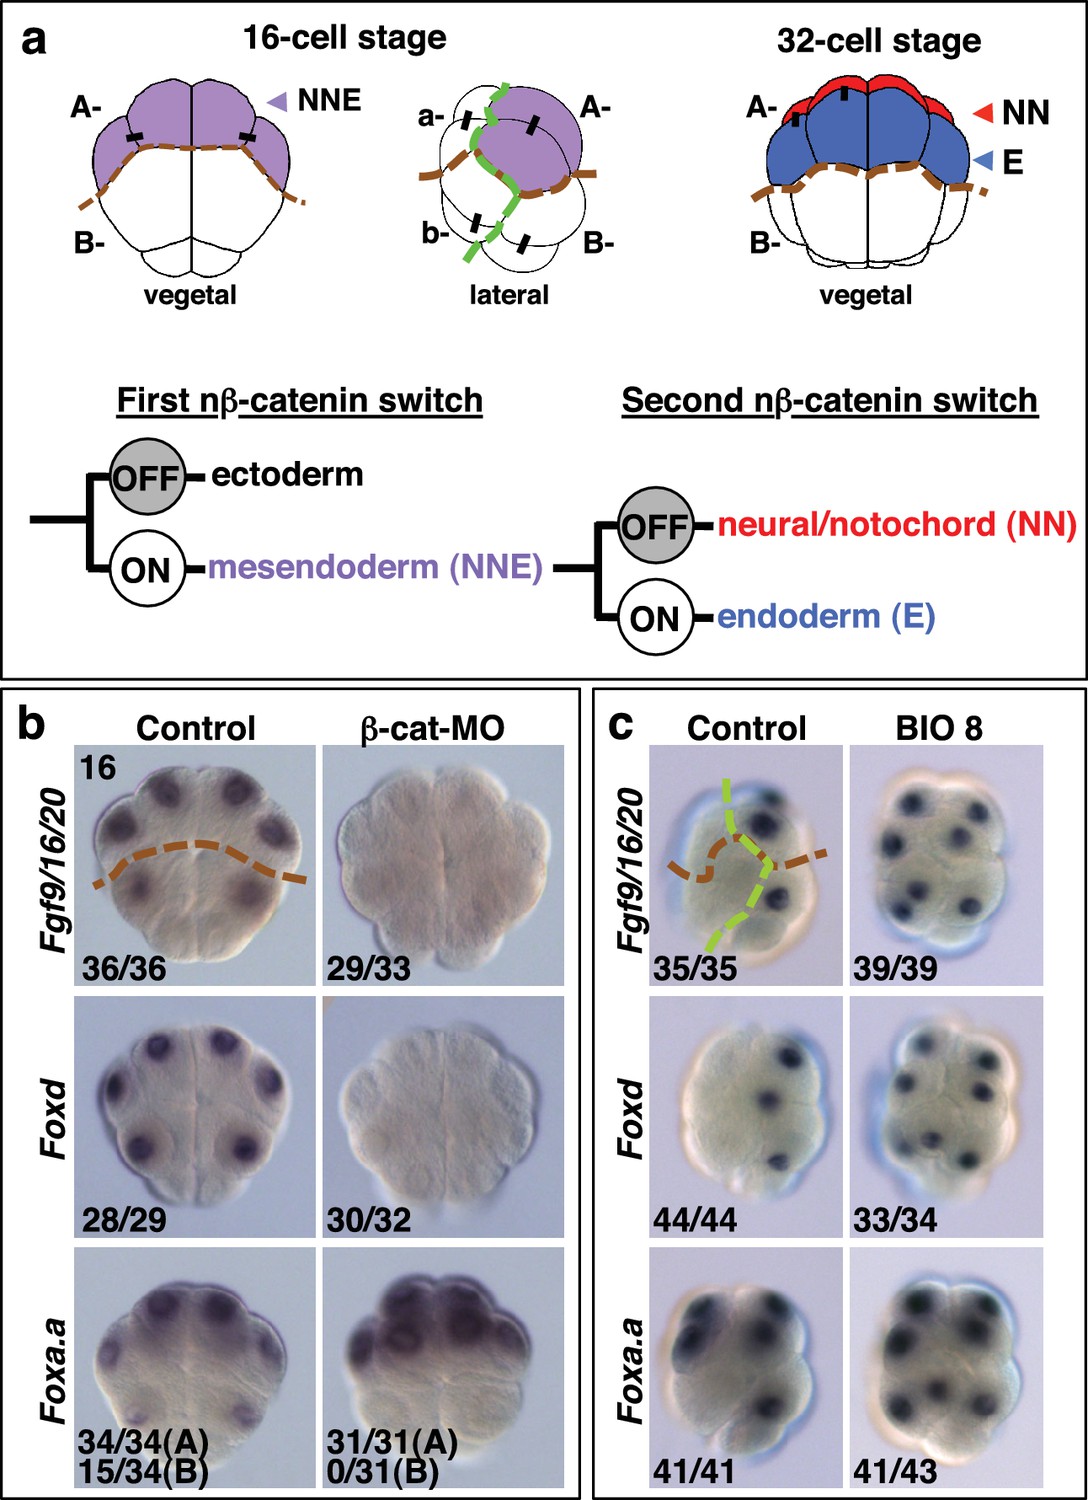
Foxa.a, Foxd and Fgf9/16/20 are candidate NNE lineage specification factors.
(a) Schematic drawings of embryos at the 16- and 32-cell stages. In this and all subsequent figures, where shown, a green dashed line separates the animal (ectoderm) from the vegetal (mesendoderm) hemispheres and a brown dashed line separates A- (A4.1) and a- (a4.2) lineages from B- (B4.1) and b- (b4.2) lineages. Different embryonic founder lineages are indicated on the drawings. NN and E cells are indicated in red and blue, respectively. Below the embryo drawings is a schematic representation of the two rounds of nβ-catenin-driven binary fate decisions that segregate firstly the mesendoderm lineages from the ectoderm lineages at the 16-cell stage and secondly segregate the mesoderm (NN) lineages from the endoderm (E) lineages at the 32-cell stage (Hudson et al., 2013). (b, c) Embryos analysed at the 16-cell stage for the marker indicated to the left of the panels following the treatment indicated above the panels [(b) vegetal pole view; (c) lateral view, vegetal pole to the right]. The numbers on the bottom-left corner of each panel indicate the proportion of embryos that the panel represents. The posterior most cells (at the bottom of the panels) are transcriptionally quiescent cells that will generate the germ line (Shirae-Kurabayashi et al., 2011). For Foxa.a expression in (b) control embryos showed expression in all four A-line (NNE) cells in 34/34 embryos, and in B-line cells, in 15/34 embryos, as indicated, whereas β-catenin-MO (β-cat-MO) injected embryos showed expression in NNE cells (31/31), but not B-line (0/31). Expression of Foxa.a in the four a-line precursors (not visible in the image) was not affected by β-catenin-MO injection.
Figure 2 with 2 supplements

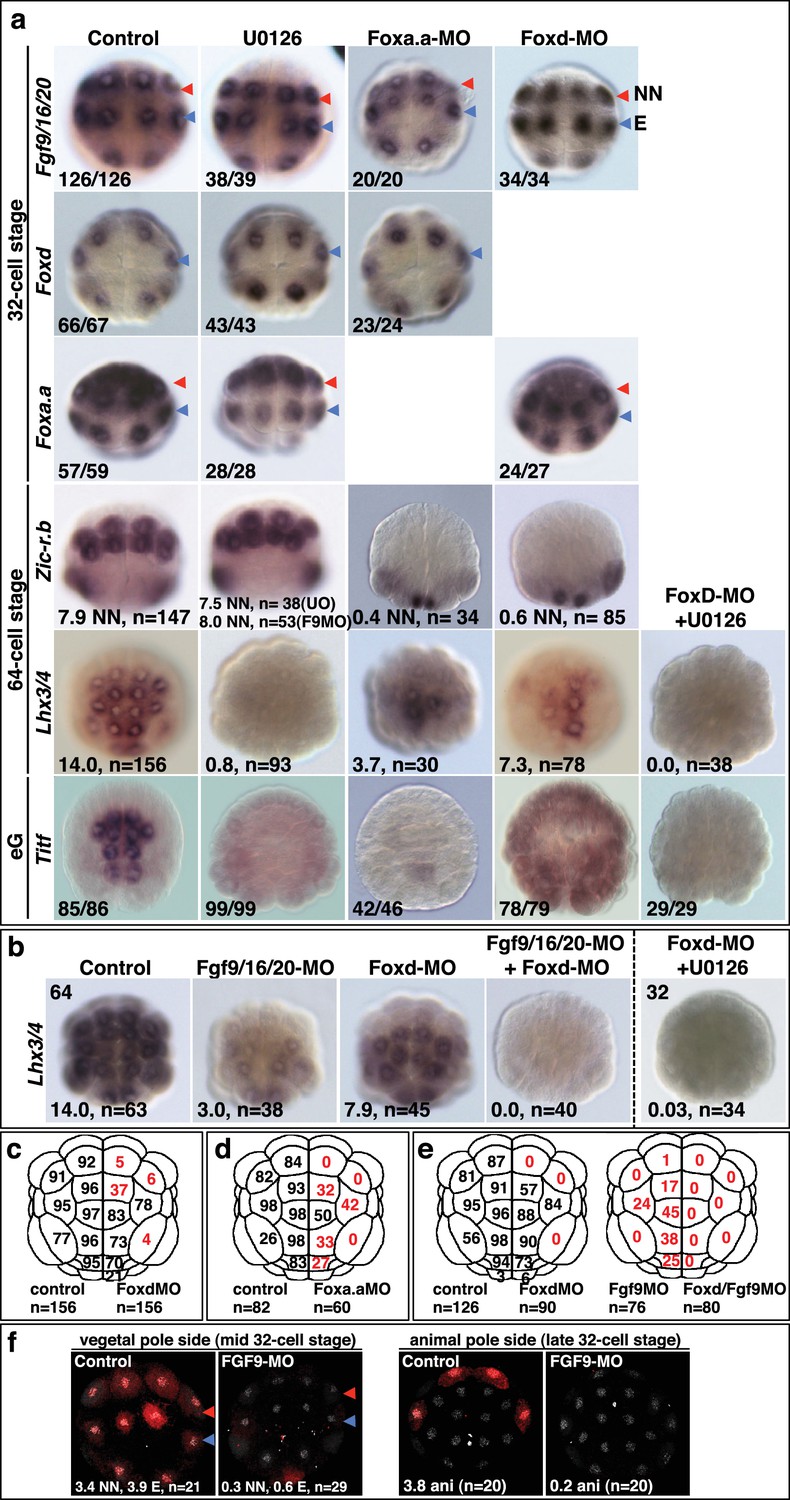
Foxa.a, Foxd and Fgf9/16/20 are required for initiation of NN and E gene expression.
(a) Embryos analysed at the 32-cell stage. The marker analysed is indicated on the left of the panels and the treatment indicated above the panels. The average number of NN (Zic-r.b) or E (Lhx3/4) cells expressing detectable levels of each gene is indicated. This remaining expression was generally weaker than control level expression. ‘n=’ represents the number of embryos analysed. (b) Expression of Efna.d under the conditions indicated. Embryos are shown in notochord-side view, animal pole up. The graph shows the average number of cells expressing Efna.d in different vegetal lineages at the 32-cell stage, as indicated by the key. All embryos showed ectoderm expression. The number of embryos analysed is indicated above the bars on the graph.
Figure 2—figure supplement 1
Foxa.a, Foxd and Fgf9/16/20 are required for initiation of NN and E gene expression.
(a–b) Embryos analysed at the 32-cell, 64-cell or early gastrula stage (eG), as indicated, for the marker indicated to the left of the panels and following the treatment indicated above the panels. Embryos in vegetal pole view. For the top three rows of panels, the proportion of embryos that the panel represents is shown. For Foxd expression, embryos were counted if at least five E cells show expression, regardless of level; for Fgf9/16/20 and Foxa.a, embryos were scored positive if at least three NN and three A-line E cells showed expression, regardless of level. Expression in other domains of the embryo were also not affected by these treatments, except for Foxd expression in NN cells which appeared slightly increased in U0126-treated embryos (control embryos displayed an average of 0.2 cells strong and 0.6 cells weak expression in NN cells, UO126-treated embryos displayed an average of 0.9 cells strong and 0.9 cells weak expression). 64-cell stage expression of Zic-r.b is presented as the average number of NN lineage cells with expression. The result for Fgf9-MO is included in the U0126 panel. Lhx3/4 is presented as the average number of cells expressing per embryo. For Titf, the numbers indicate the proportion of embryos that the panel represents. (c–e) The percentage of embryo halves showing detectable (strong and weak) Lhx3/4 expression in each vegetal lineage following the treatments indicated. n = the number of embryos halves scored. A 50% reduction in expression compared to controls is indicated in red. Note the preferential loss of marginal (notochord and mesenchyme lineage) expression compared to endoderm lineage expression following Fox gene inhibition. (f) ERK1/2 activation at the 32-cell stage depends on Fgf9/16/20. Anti-dpERK immunofluorescence was carried out on mid-32-cell stage embryos for vegetal dpERK detection and late 32-cell stage embryos for the animal cells. The average number of NN, E and animal cells per embryo exhibiting dpERK activity are shown. NN cells generally exhibited weaker ERK activity compared to E cells. ‘n=’ indicates the total number of embryos analysed.
Figure 2—figure supplement 2
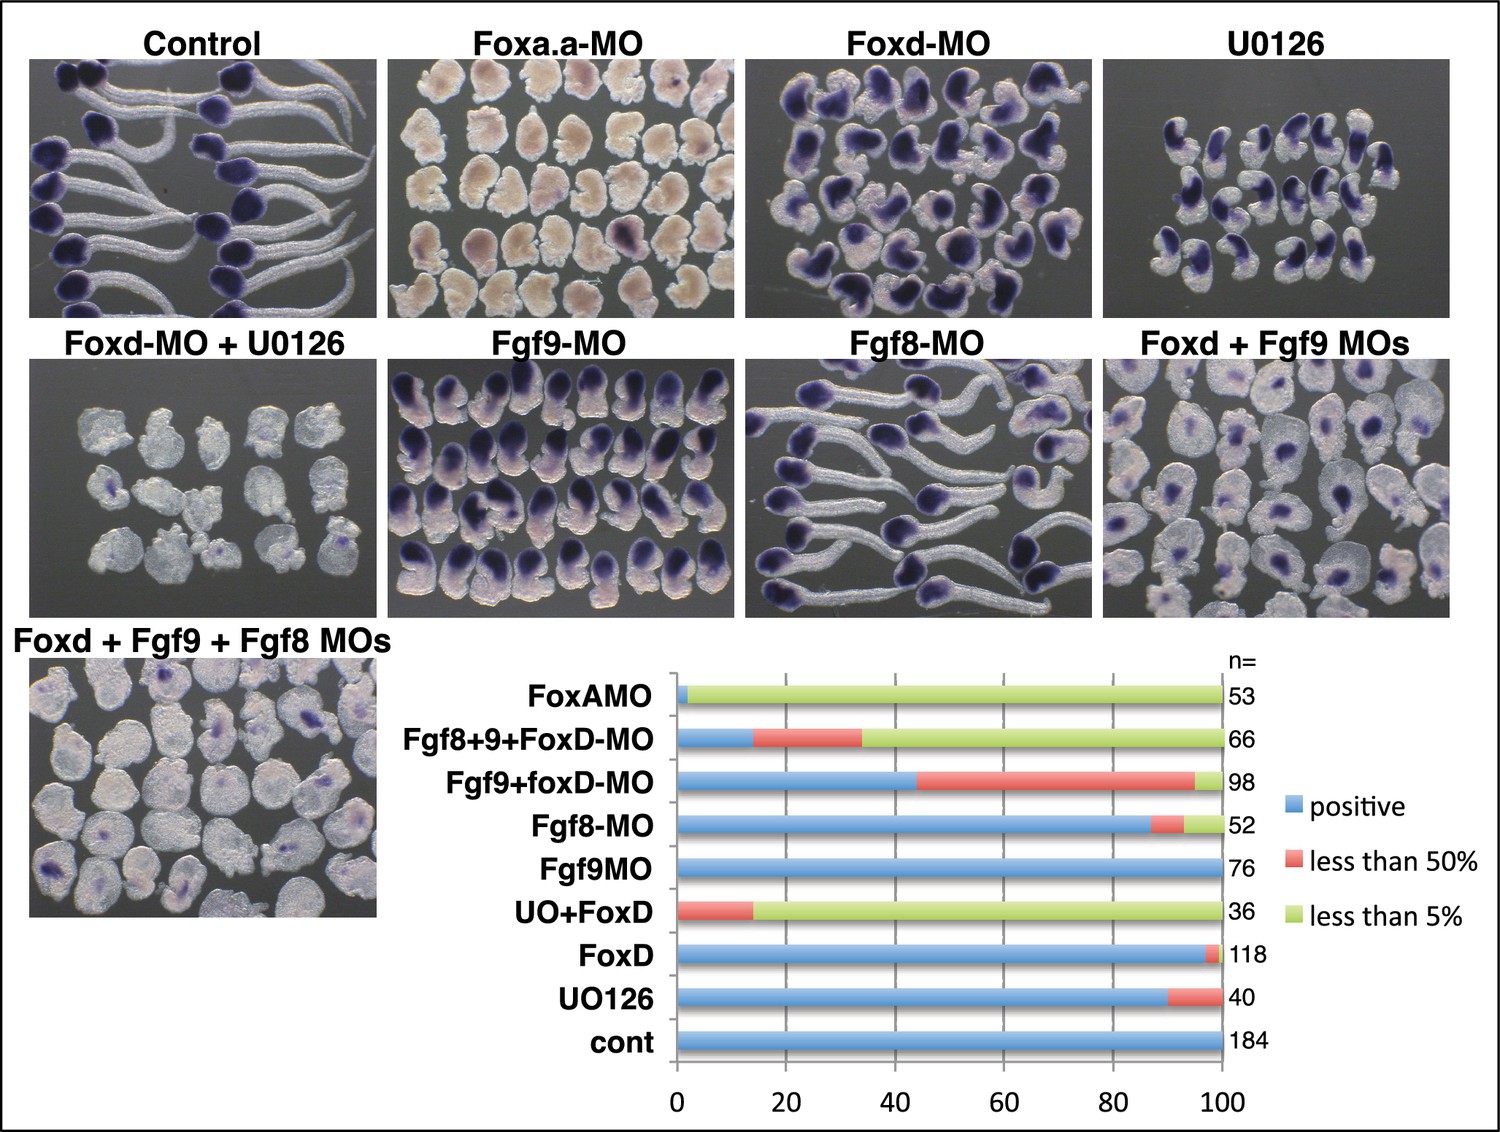
Endoderm formation under various conditions.
Detection of alkaline phosphatase activity under the conditions indicated above the panels. Fgf9=Fgf9/16/20; Fgf8=Fgf8/17/18. Endoderm is lost with Foxa.a-MO or a combination of Foxd-MO/U0126. Small amounts of endoderm remain in Foxd-MO/Fgf9-MO embryos. We have previously shown that Fgf8/17/18, expressed from the 64-cell stage, cooperates with Fgf9/16/20 during notochord induction (Yasuo and Hudson, 2007). Co-inhibition of Fgf9/16/20, Fgf8/17/18 and Foxd led to a stronger down regulation of alkaline phosphatase, suggesting that Fgf8/17/18 cooperates with Fgf9/16/20 during endoderm induction. The graphs shows the proportion of embryos (%) with strong and reduced (compared to control) alkaline phosphatase activity, as indicated on the key, following the treatments indicated on the left. ‘n=’ indicates the number of embryos analysed.
Figure 3 with 1 supplement
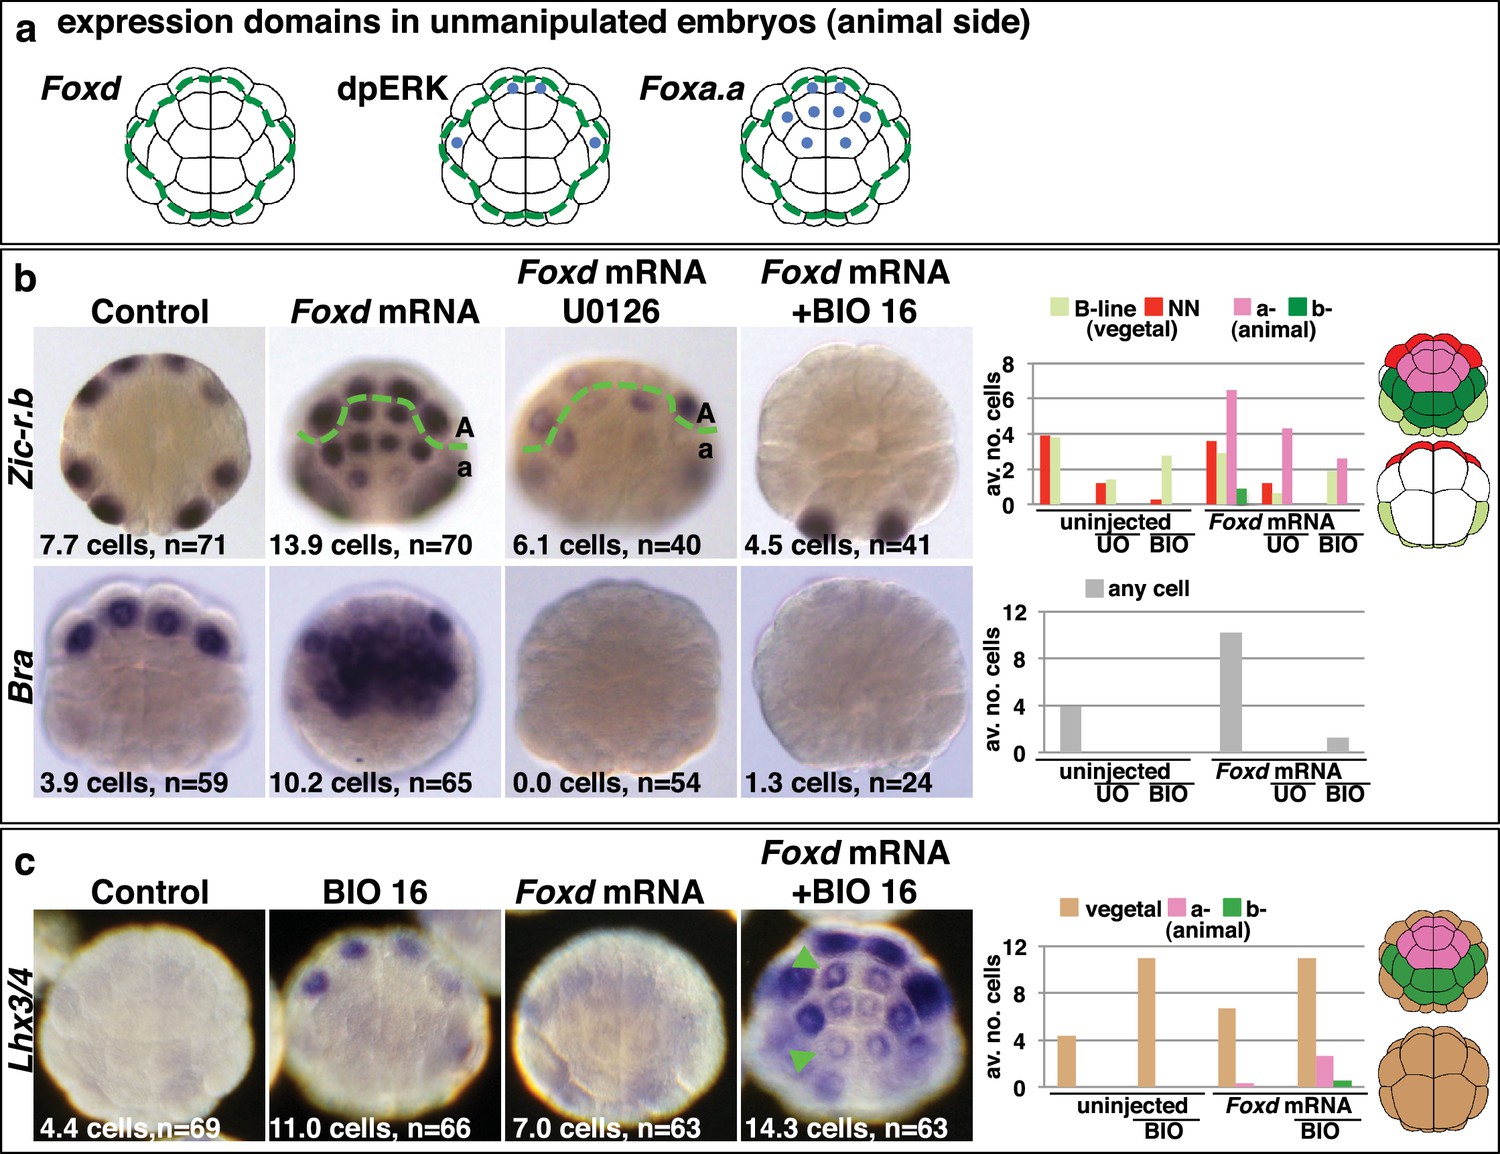
Creation of an ectopic Foxa.a, Foxd, FGF-signal overlap leads to ectopic mesendoderm formation.
(a) Schematics show endogenous ectodermal expression of Foxa.a, Foxd (no expression) and activation of ERK (dpERK), indicated by blue dots. (b–c) Treatment is indicated above the panels and marker analysed to the left. All embryos in animal pole view except control Bra (vegetal pole view). Numbers show the total average number of cells per embryo expressing each marker. n = total number of embryos analysed. The graphs show the average number of cells expressing each maker in the lineages indicated on the keys, following the treatments indicated of the x-axis. No Zic-r.b expression was detected in endoderm lineages. In (c), the green arrowheads highlight the eight a-lineage cells. For (b), representative panels of uninjected/UO-treated and uninjected/BIO-treated embryos are not shown. The numbers of these experiments are: for Zic-r.b- U0126 alone n = 40 (average number of cells 2.6), BIO-16 alone n = 40 (average number of cells 2.9) and for Bra- U0126 alone, n = 39 (average number of cells 0.0); BIO-16 alone n = 31 (average number of cells 0.0).
Figure 3—figure supplement 1

Foxd mRNA injection leads to repression of Efna.d and upregulation of Fgf9/16/20 in ectodermal cells at the 16-cell stage.
Treatment is indicated above the panels and gene expression analysed to the left of the panels. The arrowheads indicate weak ectopic expression. Numbers indicated the proportion of embryos that the panel represents. Foxa.a expression is not effected.
Figure 4
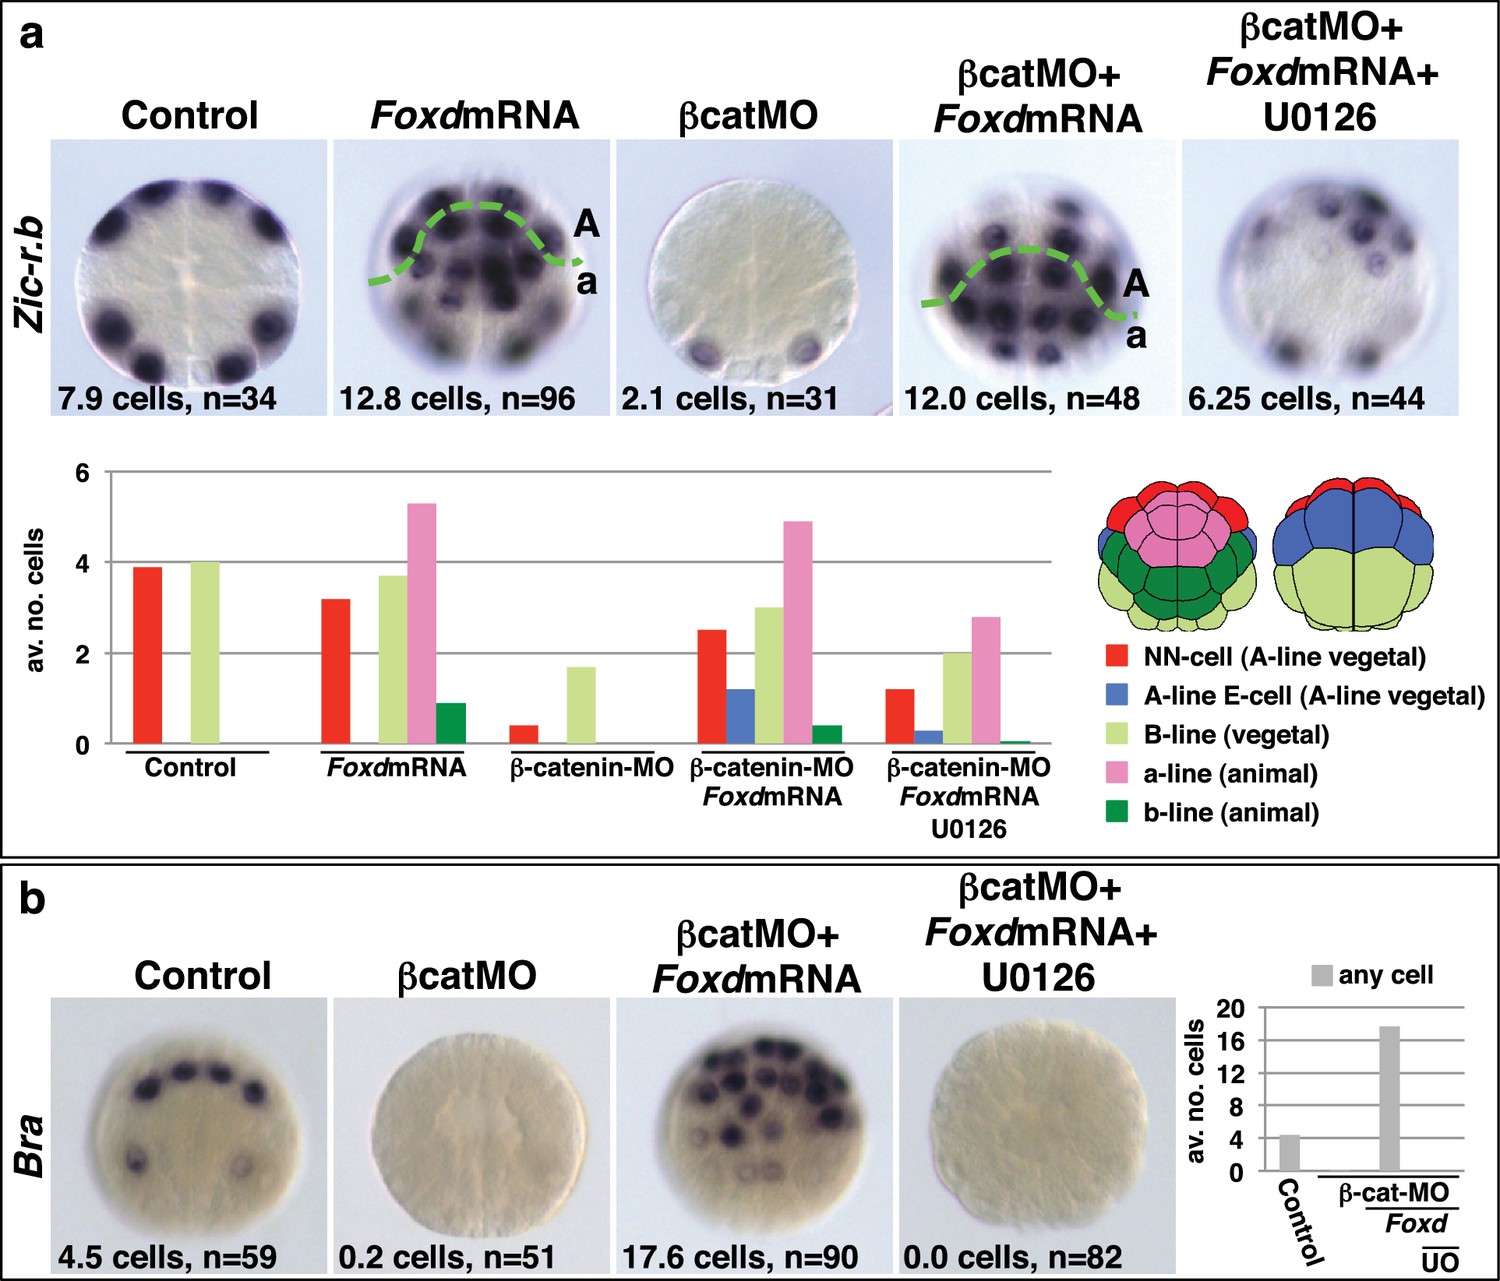
Foxd mRNA injection rescues mesoderm in β-catenin-MO injected embryos.
(a–b) Treatment is indicated above the panels and marker analysed to the left of the panels. The total average number of cells per embryo is indicated, ‘n=’ indicates the total number of embryos analysed for each treatment. The graphs show the average number of cells expressing each marker in the lineages indicated by the keys, following the treatments indicated.
Figure 5 with 2 supplements
Reprogramming the ectoderm lineage to mesendoderm.
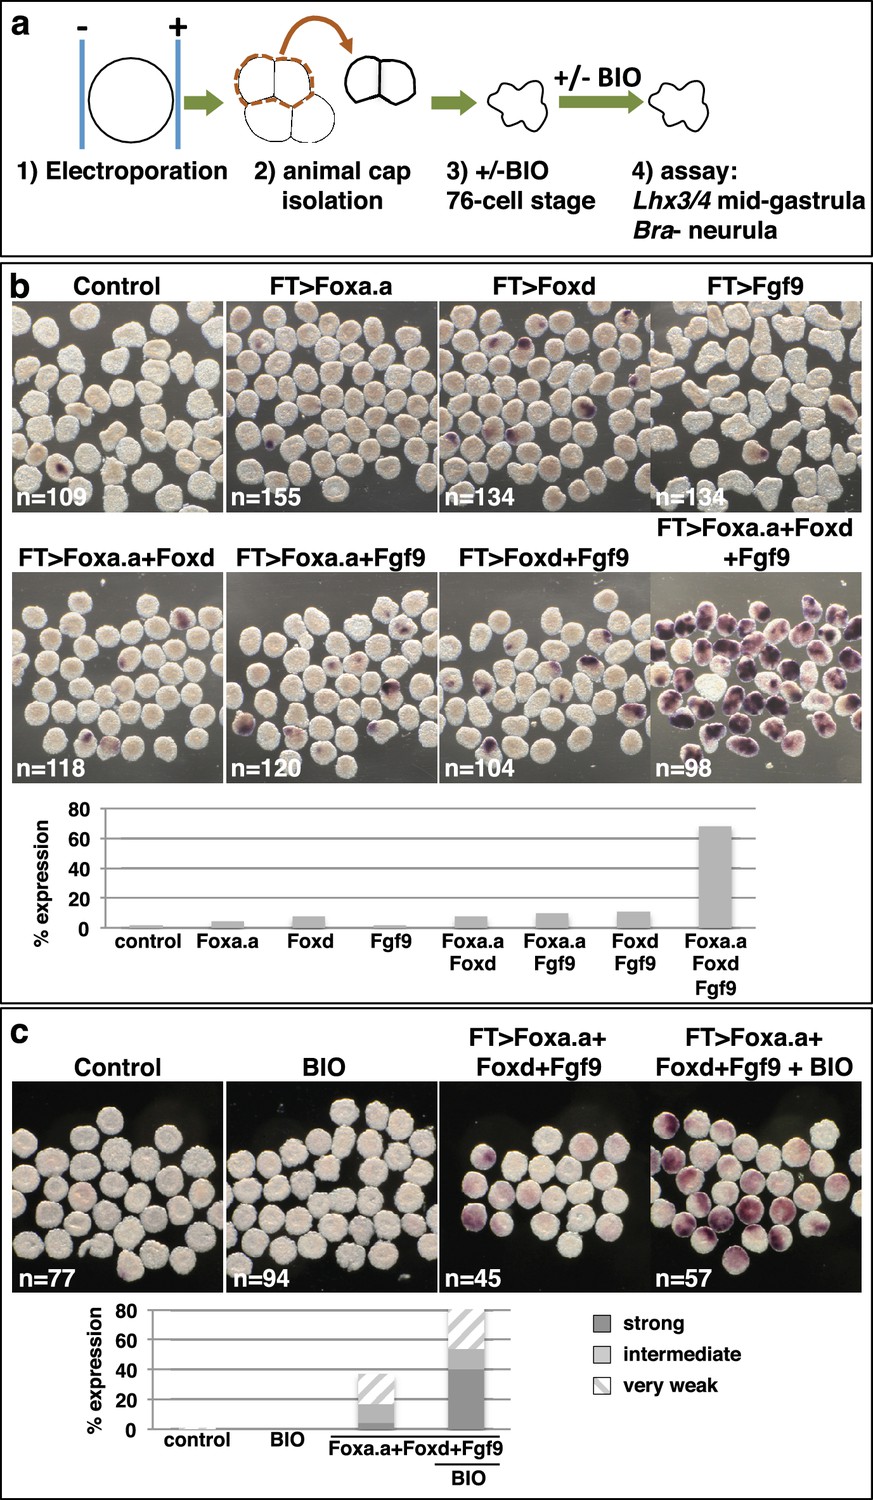
(a) Experimental scheme. Embryos were electroporated and the ectoderm lineage (animal cap) isolated at the eight-cell stage. Ectodermal explants were cultured until the mid-gastrula stage for Lhx3/4 expression or until the neurula stage for Bra expression. Optionally, explants were treated with BIO, when control sibling embryos reached the 76-cell stage, for approximately 1 hr prior to fixation (Lhx3/4 only). (b–c) Expression of Bra (b) and Lhx3/4 (c) in isolated ectodermal explants, following the treatments indicated above the panels. ‘n=’ represents the number of explants analysed. Graphs shows the percentage of explants with any level of Bra expression or level of Lhx3/4 expression indicated by the key, under various conditions (Foxa.a= pFT>Foxa.a; Foxd = pFT>Foxd; Fgf9= pFT>Fgf9/16/20; control = unelectroporated).
Figure 5—figure supplement 1

Reprogramming of ectoderm cells to mesendoderm fates.
32c=32-cell stage; 64c=64-cell stage; 76c=76-cell stage; 110c=110-cell stage; eG= early gastrula stage (approximately 3-row neural plate stage); 6R=6-row neural plate stage (mid-gastrula); neur = neurula stage. (a) Determining the onset of promoter activity of the Fucosyltransferase-like gene. The pFT>Foxd construct was electroporated and embryos were fixed at different developmental time points and assayed for Foxd expression in ectoderm cells by in situ hybridisation. The graph shows the percentage of embryos showing any level of Foxd expression in ectoderm cells in four independent experiments. The number of embryos counted per bar on the graph is indicated above the bar. nd = not done. On the right are shown examples of Foxd in situ hybridisations on electroporated embryos at the time points indicated. (b—c) FT>x3= pFT>Foxa.a + pFT>Foxd + pFT>Fgf9/16/20; FT>Tom= pFT>tdTomato (as a control electroporation); Cont. = unelectroporated embryos. (b) The ectoderm genetic programme is down-regulated in FT>x3 electroporated embryos. Electroporated embryos were analysed for Efna.d at the 32-cell stage, DllB at the 64-cell to 6-row neural plate stage, and Epi-1 at the neurula stage. The graph shows the percentage of embryos with ectoderm gene expression corresponding to 50% or more of control levels (estimated based on size of expression domain), under the conditions indicated by the key. nd= not done. (c) Zic-r.b is ectopically activated in non-neural ectoderm cells in FT>x3 electroporated embryos. The graph shows the percentage of embryos with any level of ectopic Zic-r.b expression in ectoderm cells, under the conditions indicated by the key. nd = not done.
Figure 5—figure supplement 2

Confirmation that BIO-treatment of ectoderm explants at the 76-cell stage results in nuclear localisation of β-catenin.
Explants were treated with BIO for 30 minutes and then immunostained with b-catenin antibodies and counterstained with DAPI. Panels show single z-slices of confocal images. Numbers indicate the number of interphase cells with nuclear b-catenin. A total of 11 ectoderm explants were counted for control and 15 for BIO-treated.
Figure 6
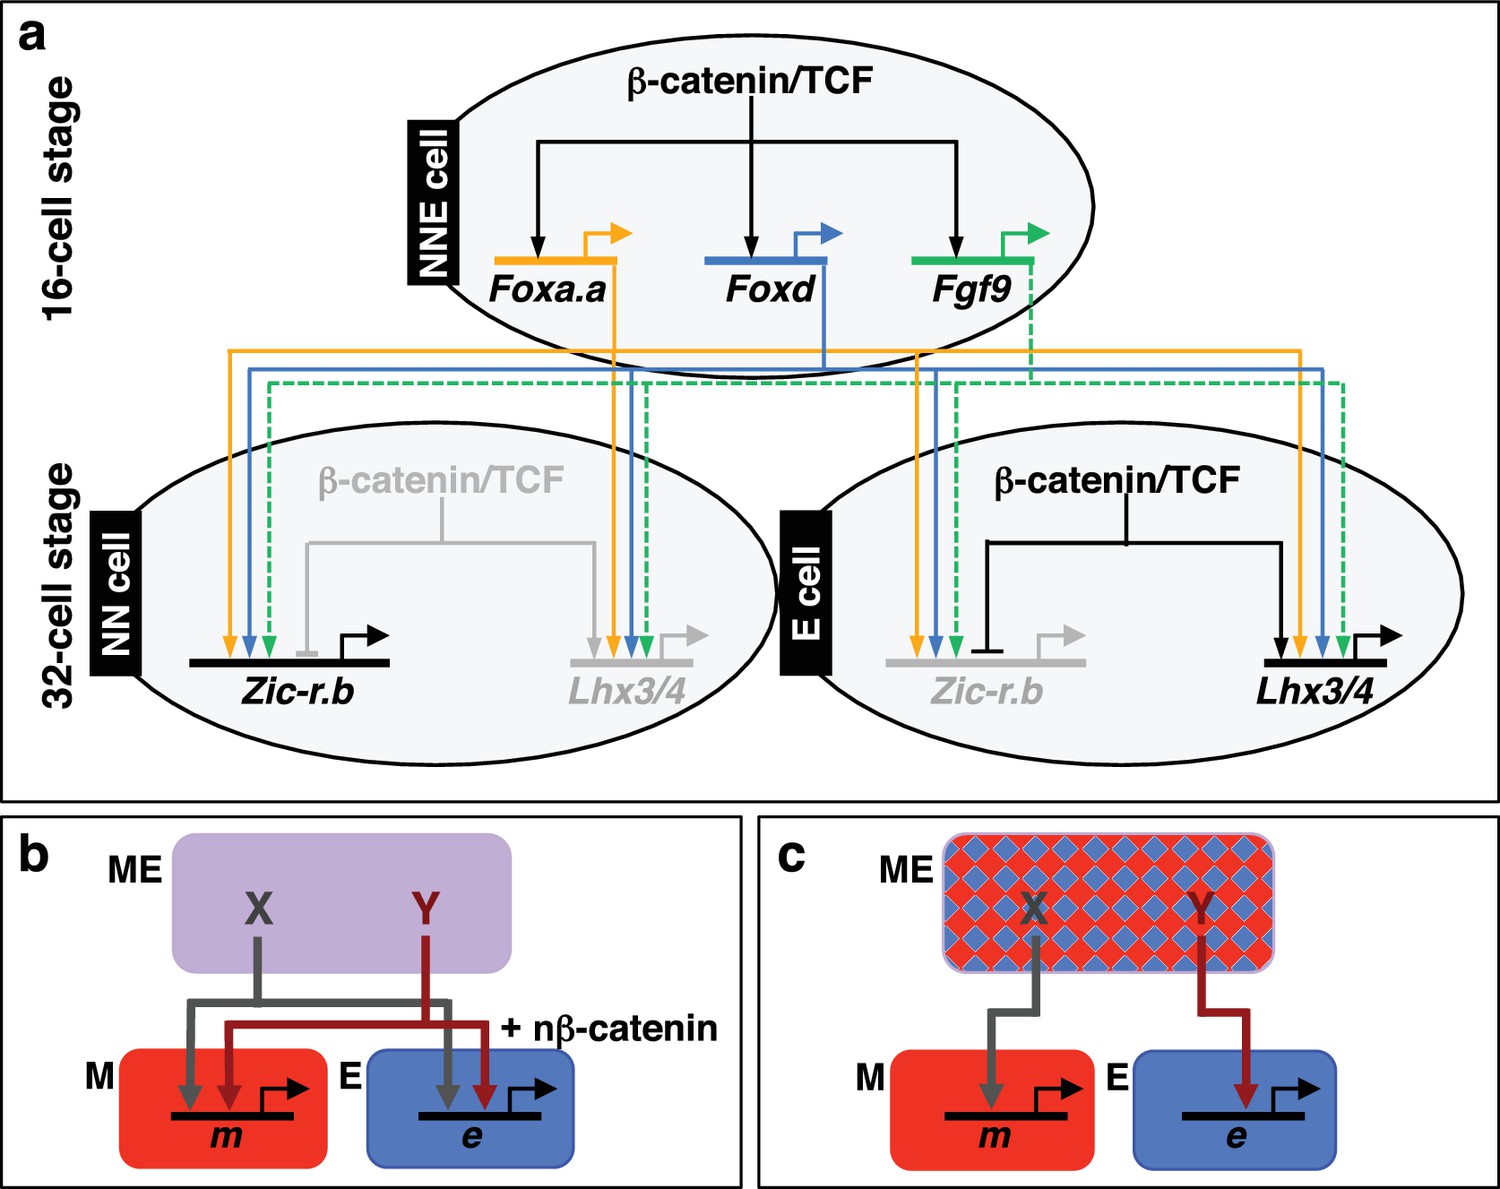
Gene regulatory model for segregation of NNE into NN and E lineages.
(a) Each factor induced by nβ-catenin activation at the 16-cell stage feeds into both the NN and E lineage genes. The dashed line for Fgf9/16/20 represents a signalling molecule (most likely mediated, at least in part, by Ets1/2 transcription factor (Table 1). Differential gene expression between NN and E cells is mediated by the second nβ-catenin-driven switch. (b–c) Schematic regulatory architectures during mesendoderm segregation. ME = mesendoderm lineage; M = mesoderm lineage; E = endoderm lineage; e = endoderm gene; m = mesoderm gene; X, Y = genes expressed in mesendoderm cells. (b) Ascidian and nematode mesendoderm regulatory architecture. (c) ‘Mixed-lineage’ mesendoderm regulatory architecture.
Tables
Table 1
Expression of Zic-r.b in NN cells and Lhx3/4 in E cells of 32-cell stage embryos, following inhibition of Fgf-signalling components.
| Control | U0126 | ETS1/2-MO | |
|---|---|---|---|
| Zic-r.b NN cell | 4.0 cells (n = 163) | 0.75 cells (n = 58) | 3.4 cells* (n = 74) |
| Lhx3/4 E cell | 3.9 cells (n = 153) | 2.1** cell (n = 45) | 0.7 cells (n = 92) |
-
* 44/74 embryos exhibited weaker levels of Zic-r.b expression compared to controls.
-
**Remaining expression was weaker than control levels of expression.
Download links
A two-part list of links to download the article, or parts of the article, in various formats.
Downloads (link to download the article as PDF)
Open citations (links to open the citations from this article in various online reference manager services)
Cite this article (links to download the citations from this article in formats compatible with various reference manager tools)
Co-expression of Foxa.a, Foxd and Fgf9/16/20 defines a transient mesendoderm regulatory state in ascidian embryos
eLife 5:e14692.
https://doi.org/10.7554/eLife.14692


