Olfactory channels associated with the Drosophila maxillary palp mediate short- and long-range attraction
- Max Planck Institute for Chemical Ecology, Germany
Figures
Figure 1 with 8 supplements
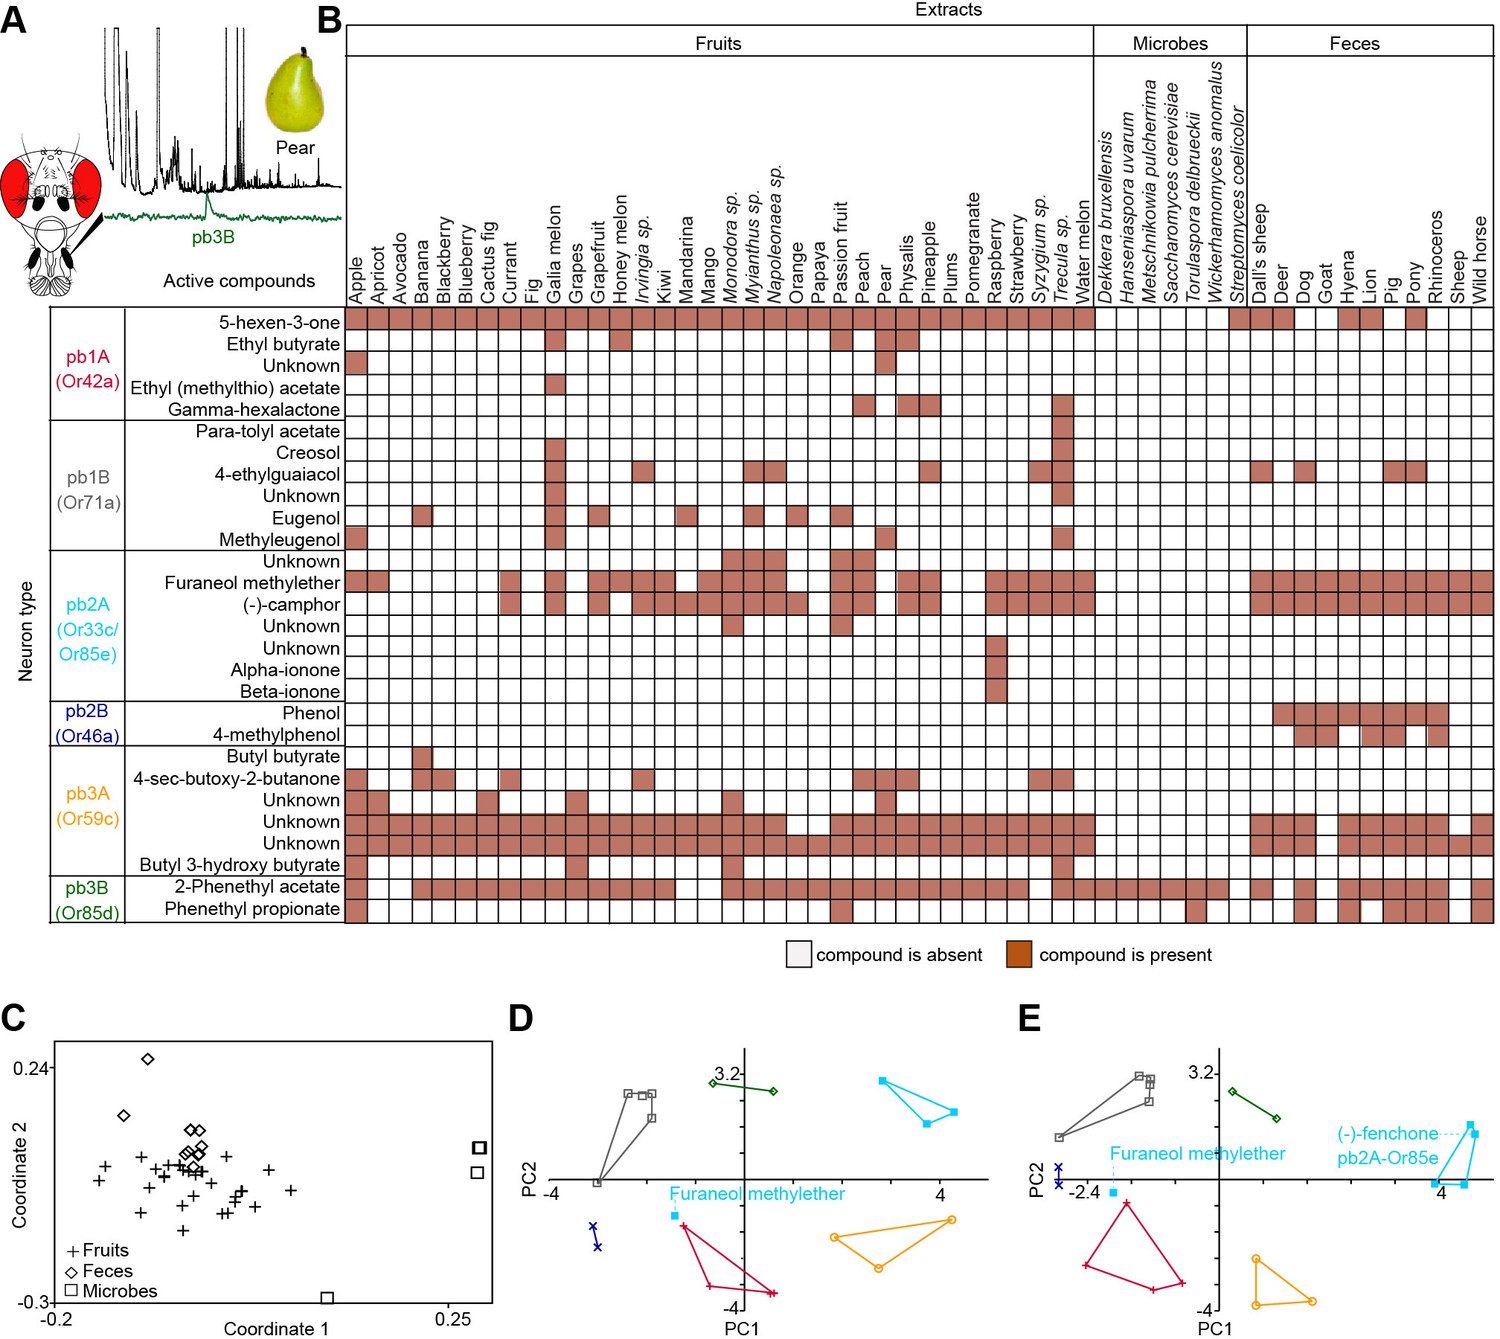
Screen for novel natural ligands for MP-OSNs.
(A) Representative gas chromatography-linked single sensillum measurement (GC-SSR) from pb3B (green trace) stimulated with headspace extract of pear (black trace). (B) Presence/Absence matrix of the physiologically active compounds identified from the different headspace extracts for each MP-OSN in the GC-SSR experiments (i.e. each filled box represents not only the presence of this odor in a specific fruit, but also a physiological response in GC-SSR recordings). (C) NMDS plot based on a presence/absence matrix for the active peaks across the tested samples. (D) PCA plot showing the distribution of the ligands recognized by MP-OSNs in a 32-dimensional odor space. PC1 and PC2 explain 23% and 22% of the variance, respectively. (E) PCA plot showing the distribution of the ligands recognized by MP-OSNs and (-)-fenchone (the main ligand of Or85e-expressing OSNs) in a 32-dimensional odor space. PC1 and PC2 explain 24% and 21% of the variance, respectively.
-
Figure 1—source data 1
Presence and absence data as well as physicochemical properties of all tested odor samples, that were used to calculate the NMDS plot and the PCAs in Figure 1.
- https://doi.org/10.7554/eLife.14925.003
Figure 1—figure supplement 1

Responses of pb1A OSNs type to physiologically active compounds in different extracts.
https://doi.org/10.7554/eLife.14925.004
Figure 1—figure supplement 2
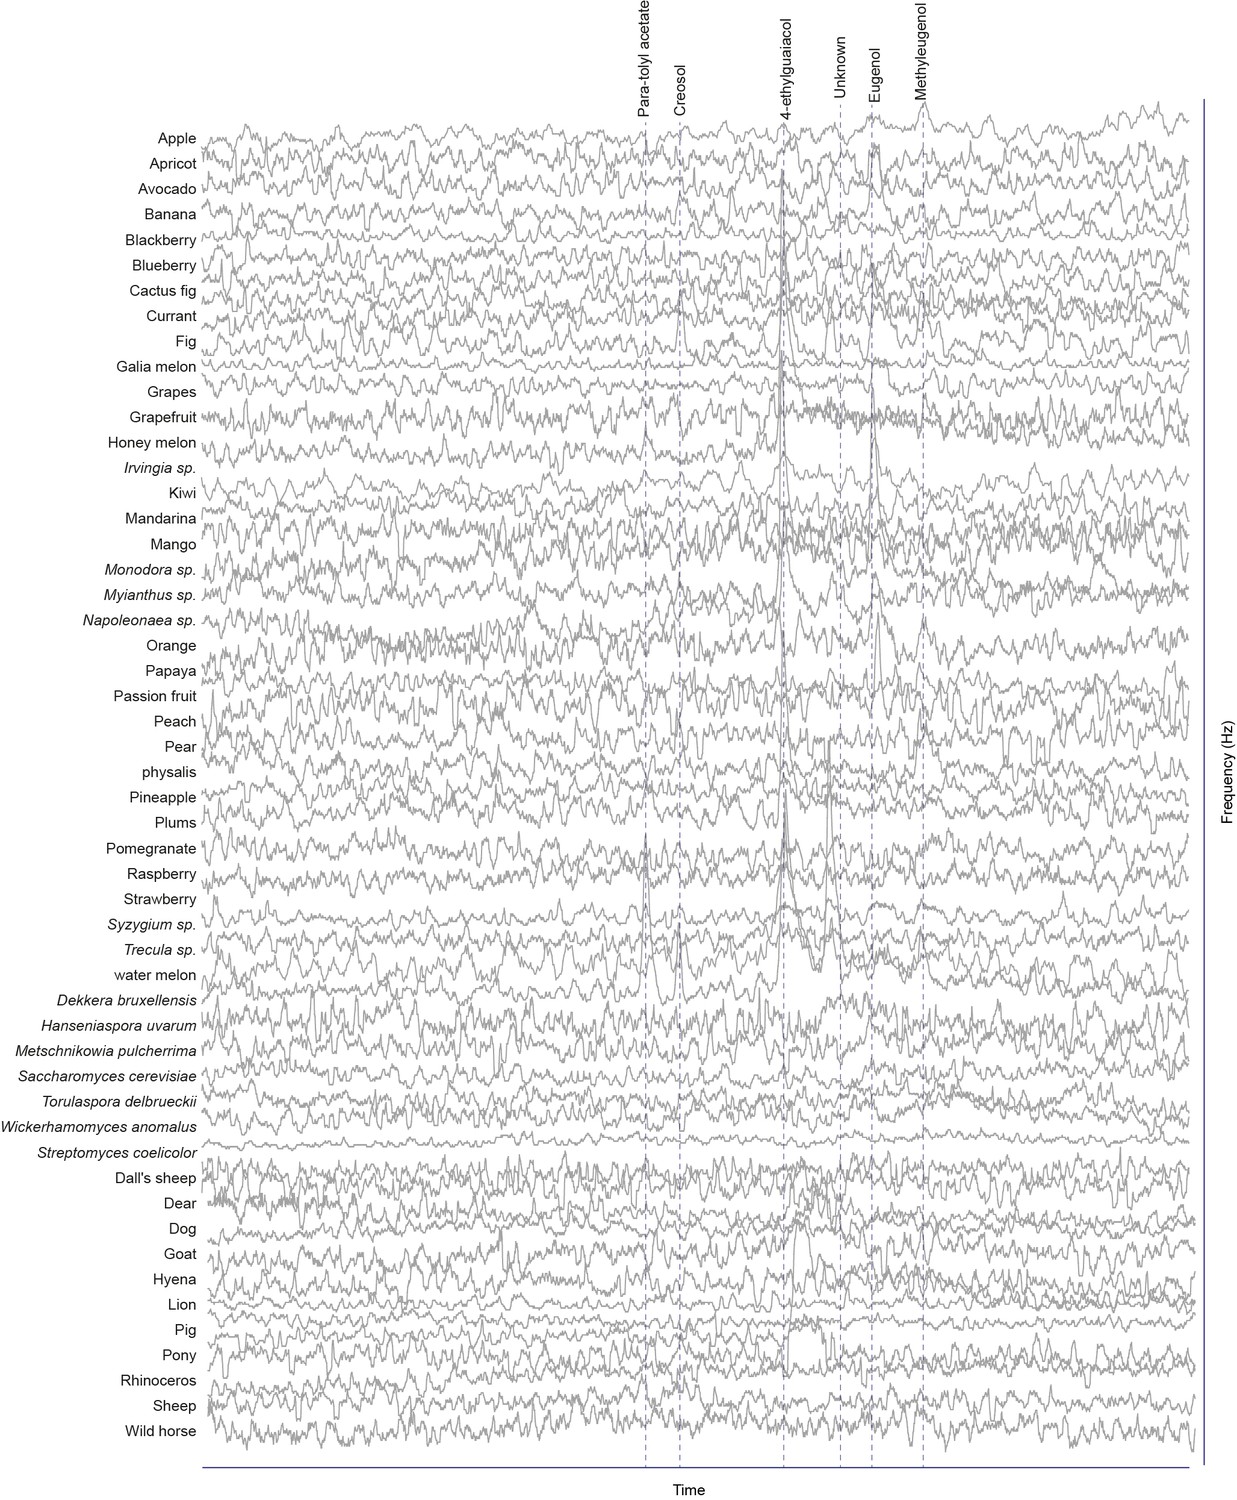
Responses of pb1B OSNs type to physiologically active compounds in different extracts.
https://doi.org/10.7554/eLife.14925.005
Figure 1—figure supplement 3
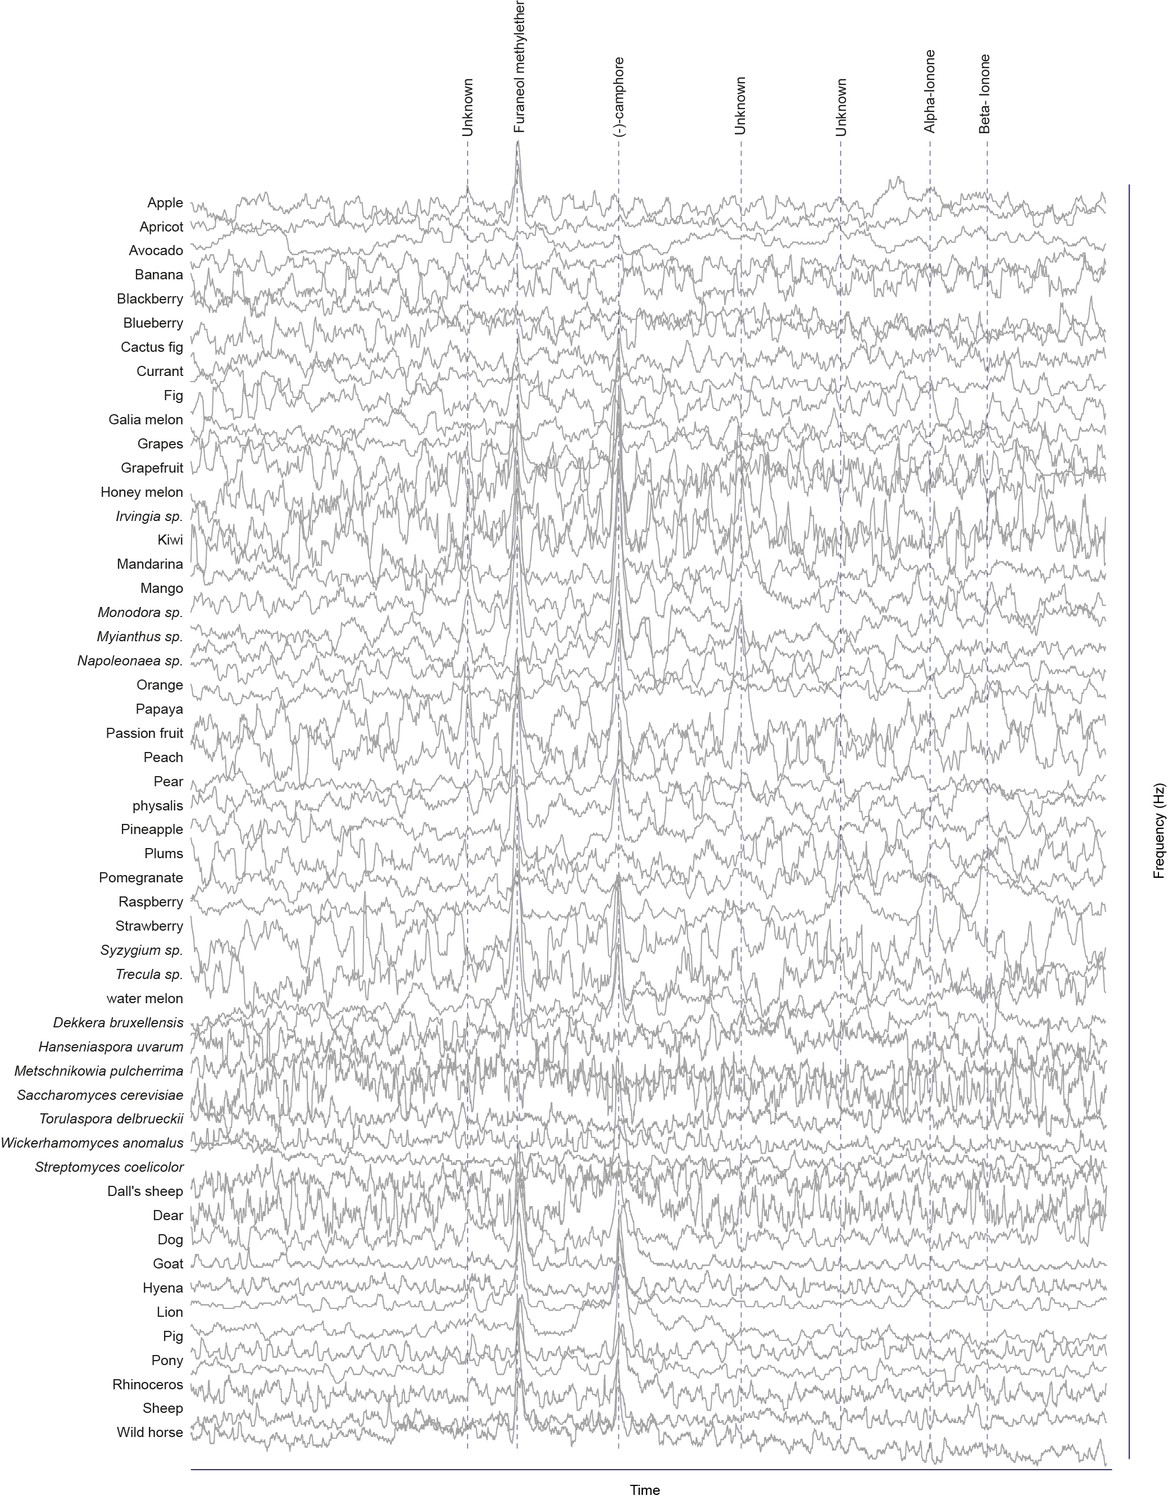
Responses of pb2A OSNs type to physiologically active compounds in different extracts.
https://doi.org/10.7554/eLife.14925.006
Figure 1—figure supplement 4
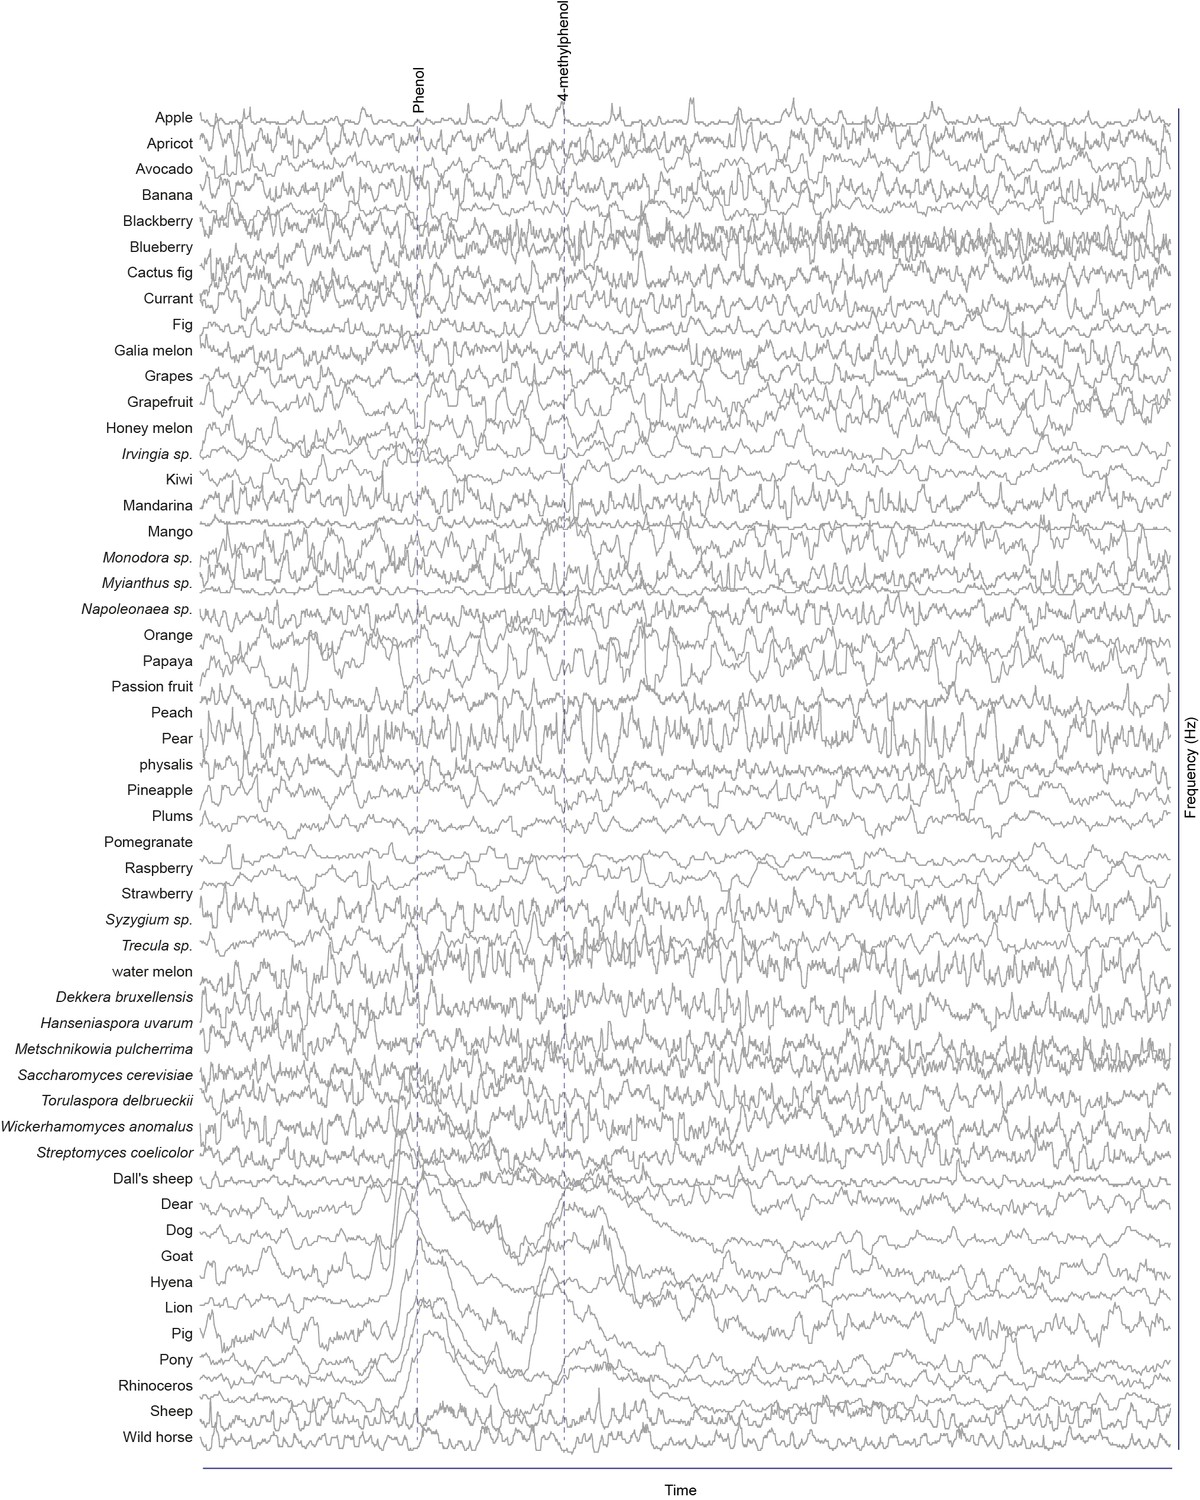
Responses of pb2B OSNs type to physiologically active compounds in different extracts.
https://doi.org/10.7554/eLife.14925.007
Figure 1—figure supplement 5
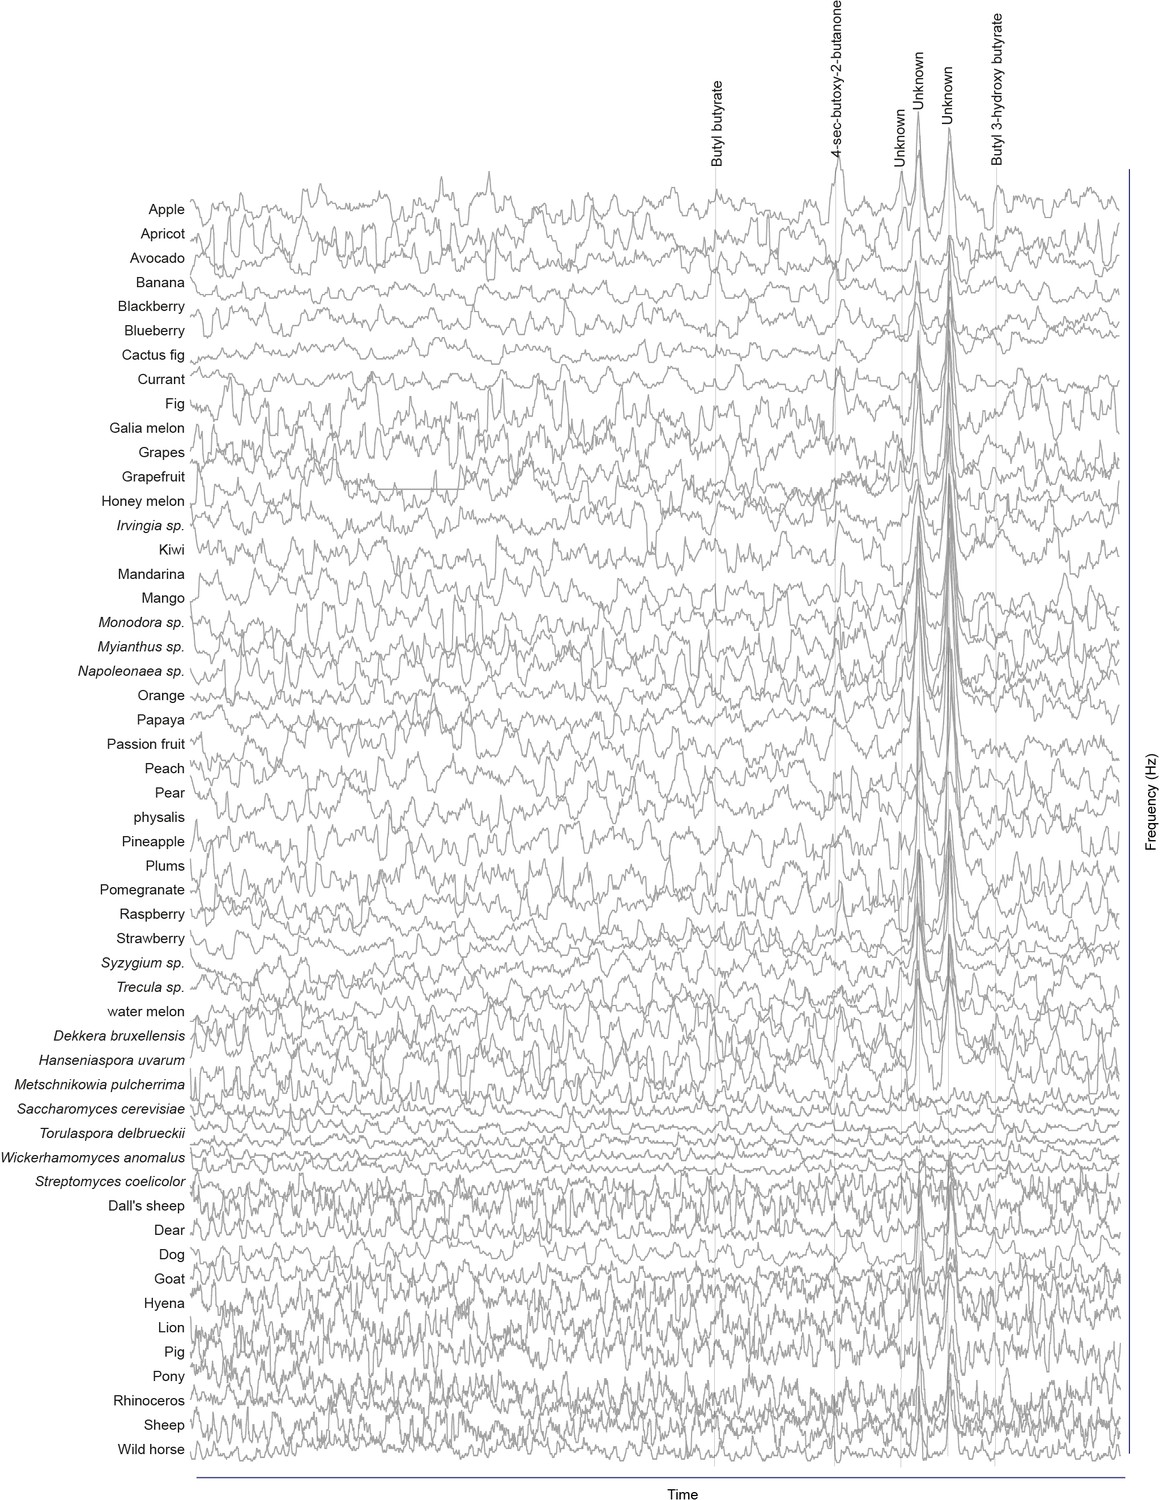
Responses of pb3A OSNs type to physiologically active compounds in different extracts.
https://doi.org/10.7554/eLife.14925.008
Figure 1—figure supplement 6

Responses of pb3B OSNs type to physiologically active compounds in different extracts.
https://doi.org/10.7554/eLife.14925.009
Figure 1—figure supplement 7
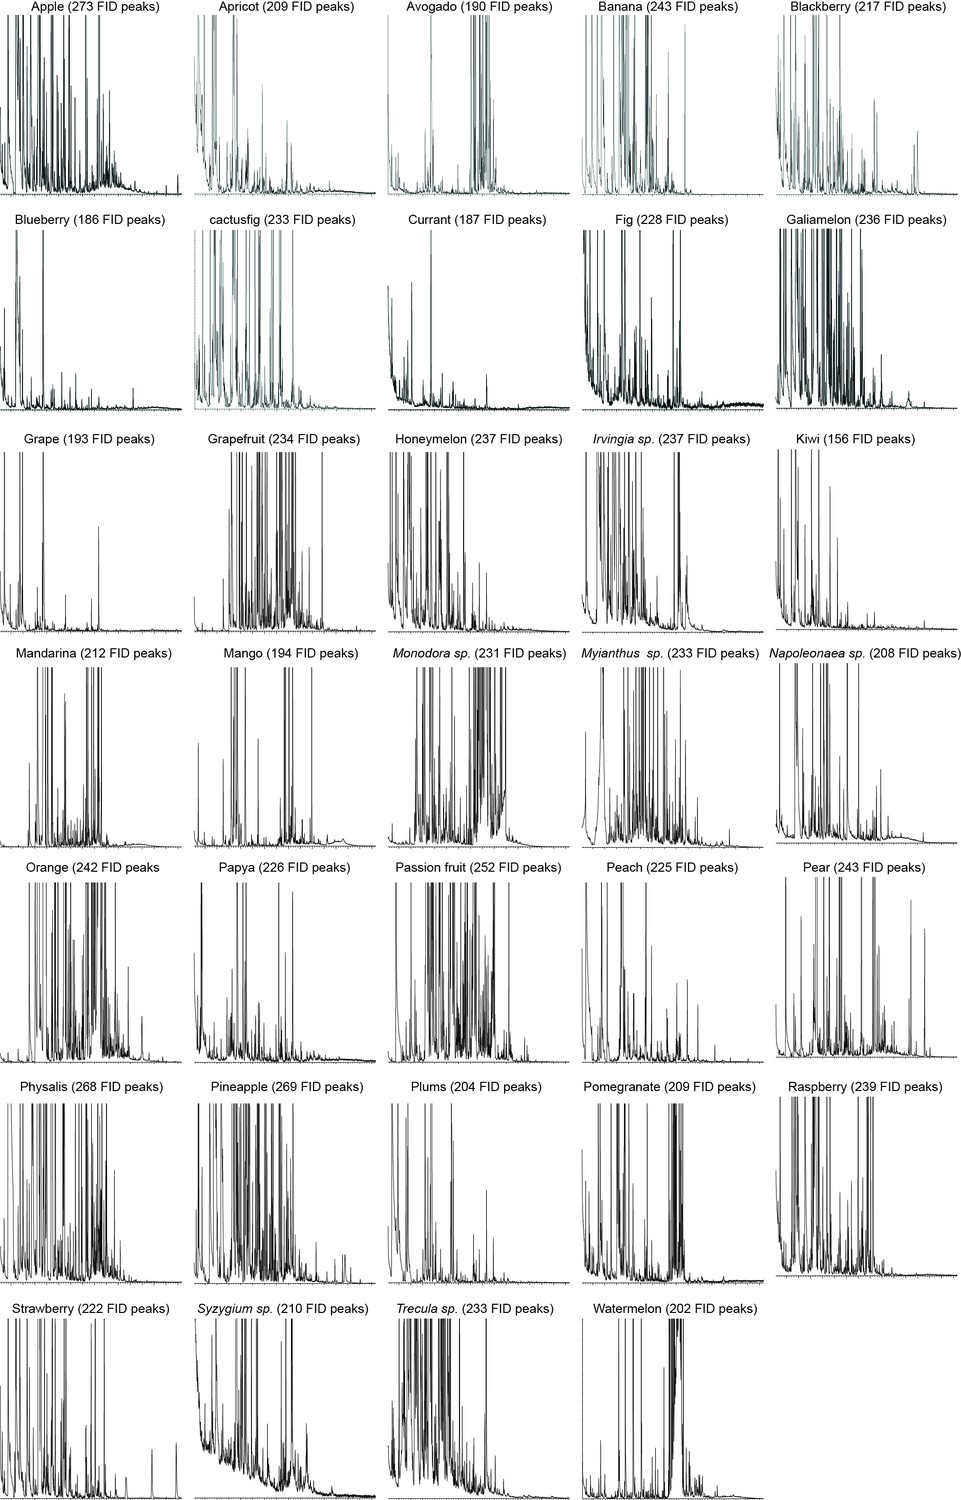
GC-MS chromatographs showing number of FID peaks in each fruit sample.
https://doi.org/10.7554/eLife.14925.010
Figure 1—figure supplement 8

GC-MS chromatographs showing number of FID peaks in each microbial (A) and fecal (B) sample.
https://doi.org/10.7554/eLife.14925.011
Figure 2

SSR dose-response curves for each MP-OSN stimulated with its physiologically active compounds (n = 5).
Error bars represent SEM.
-
Figure 2—source data 1
Raw data for all dose-dependency curves presented in Figure 2.
- https://doi.org/10.7554/eLife.14925.014
Figure 3
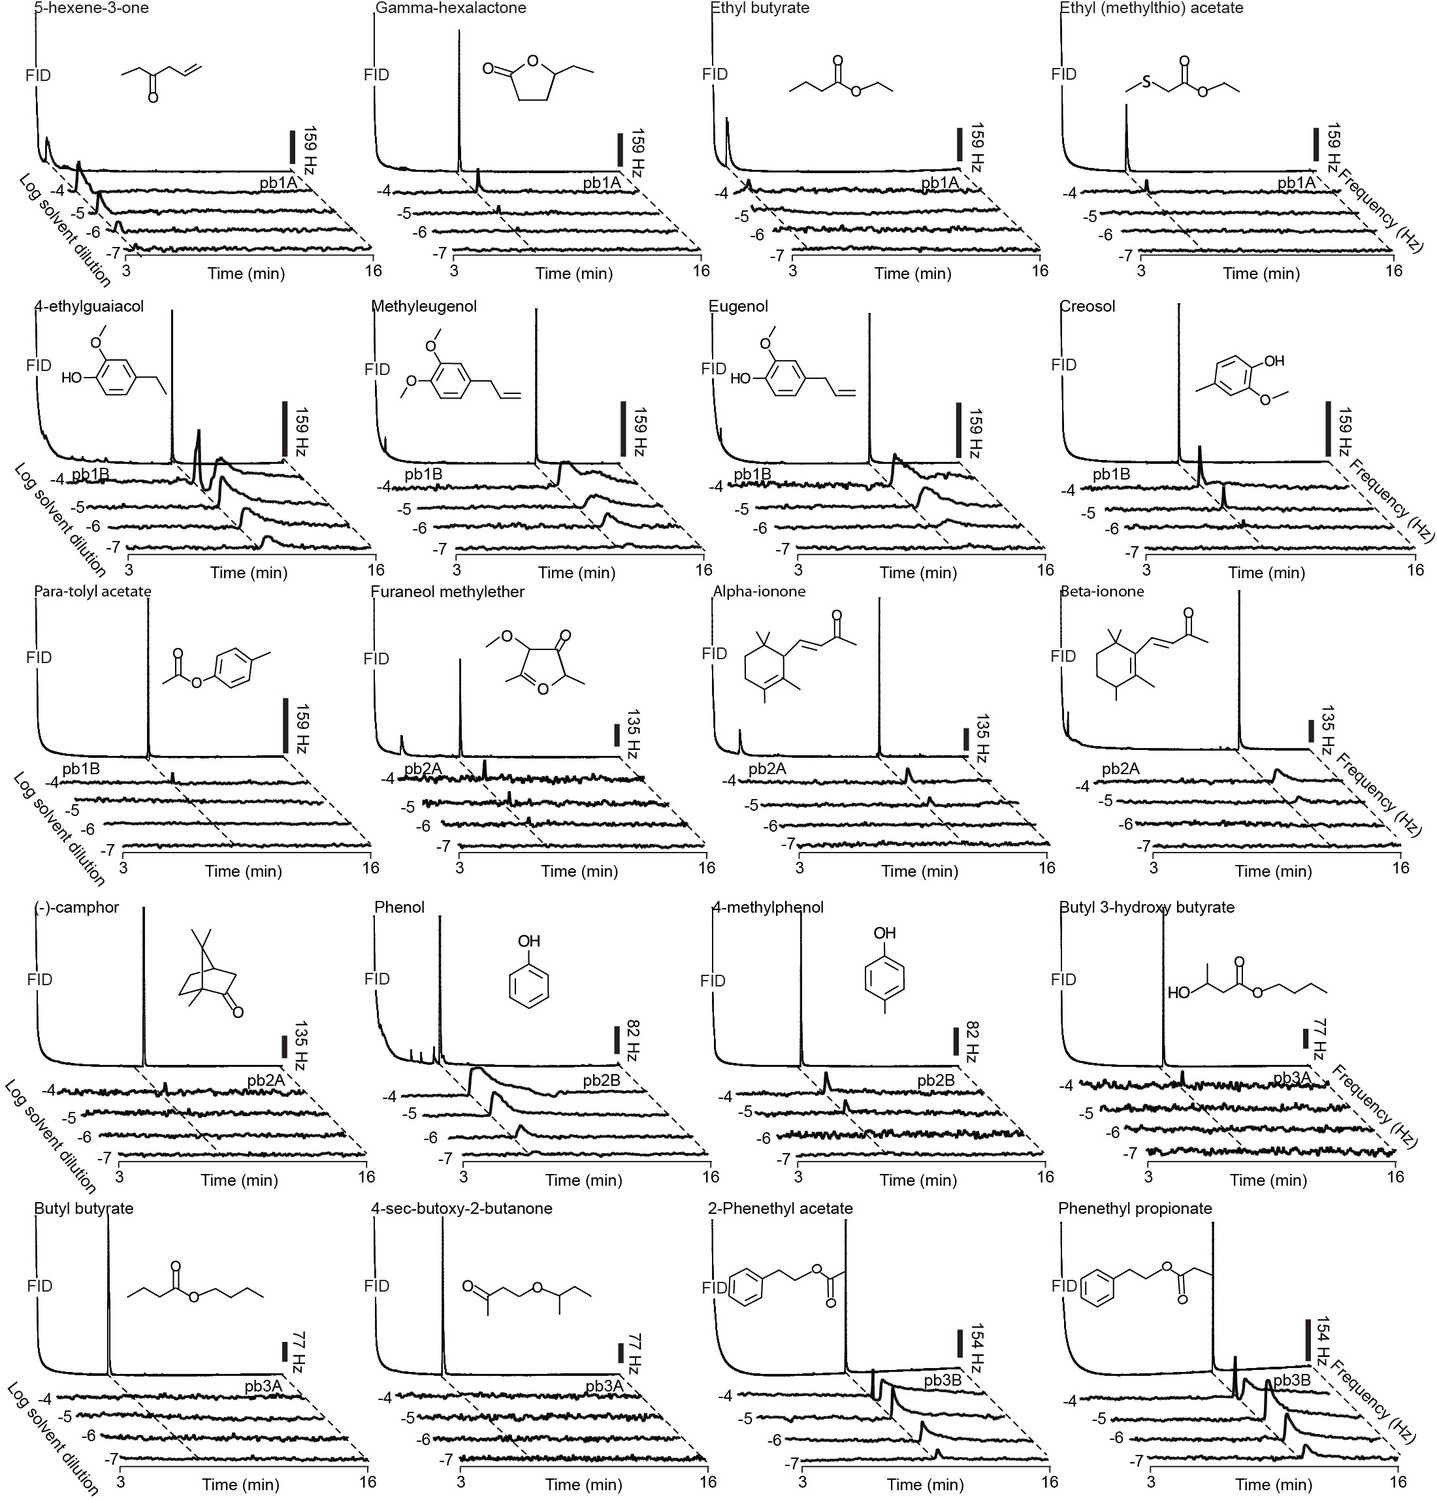
Representative GC-SSR dose-response traces for each MP-OSN stimulated with its physiologically active compounds (n = 3).
Scale bars represent the neuronal firing rate [hz].
-
Figure 3—source data 1
Raw data for all GC-SSR results presented in Figure 3.
- https://doi.org/10.7554/eLife.14925.016
Figure 4 with 1 supplement

MP-OSNs are dedicated to detect specific chemical compounds.
(A) Presence/Absence matrix of the GC-SSR responses of the MP-OSNs best activators across the Ant-OSNs (n = 3, dilution, 10–4 in hexane). Asterisks denote the total response of a sensillum type when spike sorting of OSNs failed. (B) Representative traces of GC-SSR dose response relationship from ab2A, ab9A, ab9B and ab10A OSNs (n = 3). Scale bars represent the neuronal firing rate [hz]. (C) SSR dose-response curves. Error bars represent SEM. The symbols ** and *** indicate statistically significant differences between OSN types with p<0.001, and p<0.0001, respectively (two-tailed Independent Samples T Test, n = 5).
-
Figure 4—source data 1
Raw data of the comparison of antennal and palp OSN-responses to the best ligands of palp OSNs presented in Figure 4.
- https://doi.org/10.7554/eLife.14925.018
Figure 4—figure supplement 1
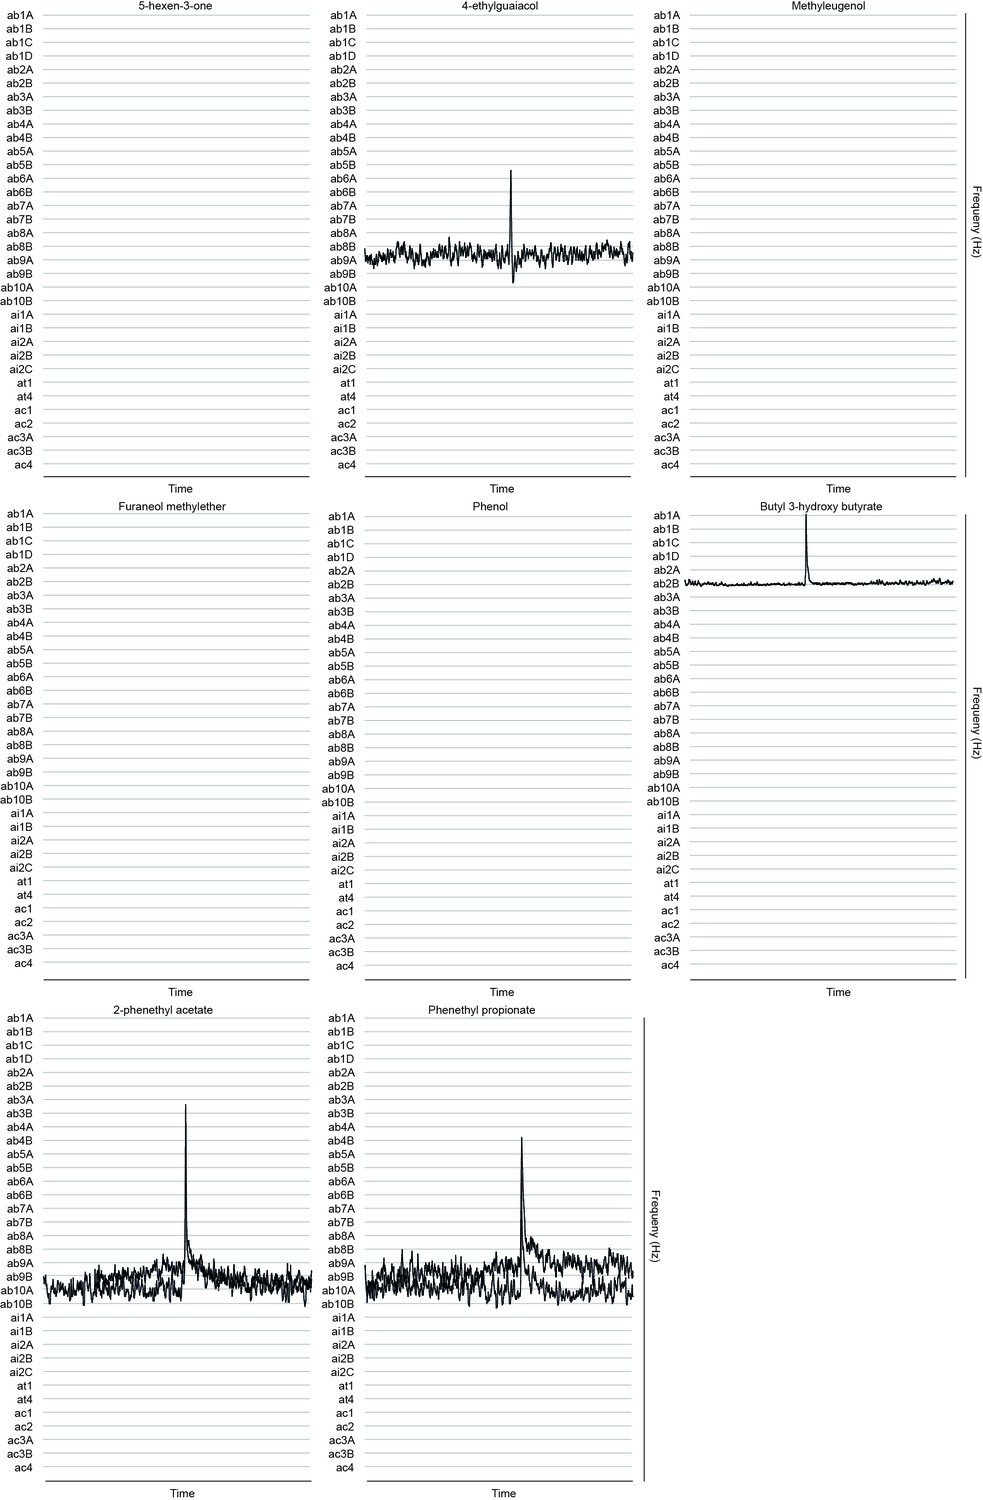
Responses of Ant-OSNs to palp best activators.
https://doi.org/10.7554/eLife.14925.019
Figure 5 with 2 supplements

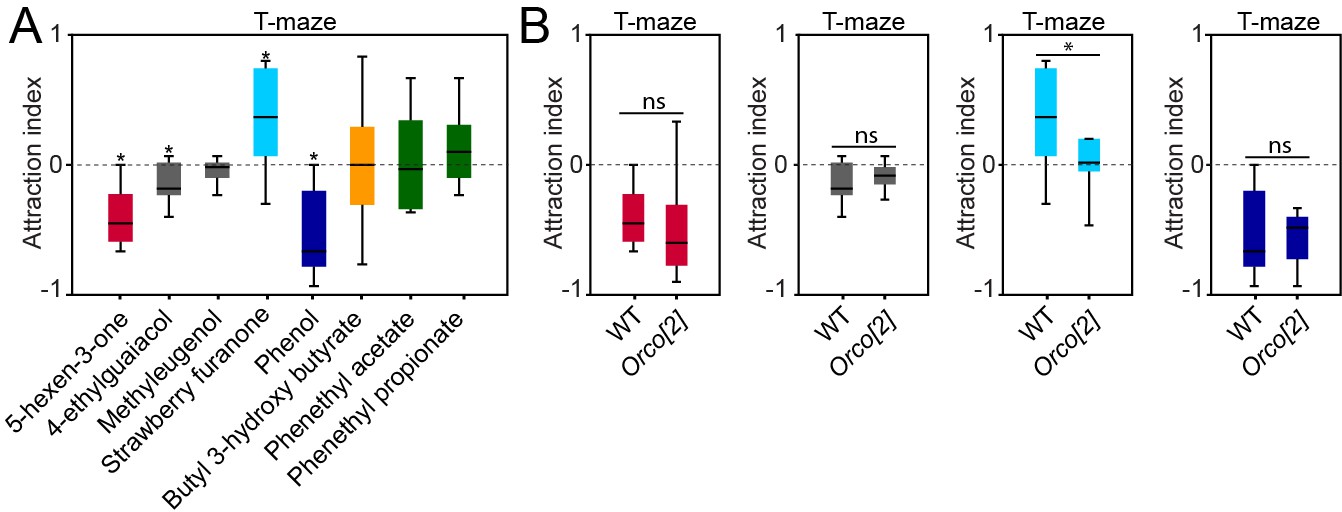
Contribution of the maxillary palp to the behaviors evoked by the palp best activators.
(A) Behavioral responses of WT flies to the palp best activators (10–4 dilution used for trap and T-maze experiments, and 10–2 dilution used for wind tunnel experiments). For T-maze and trap assays, the symbol * indicates significant differences from the solvent control (p<0.05, Wilcoxon signed rank test, n = 10). For wind tunnel assays, different letters indicate significant differences between groups (p<0.05, Kruskal Wallis test with Dunn’s multiple comparison, n = 10). (B) Behavioral responses of WT and Orco[2] flies to the behaviorally active compounds (10–4 dilution used for trap and T-maze experiments and 10–2 dilution used for wind tunnel experiments). The symbols *, ** and *** indicate statistically significant differences between the attraction indices of the genotypes with p<0.01, p<0.001, and p<0.0001, respectively (two-tailed Mann-Whitney U test, n = 10). (C) Behavioral responses of WT (Ant+, MP+), palp-amputated flies (Ant+, MP-) and antenna-amputated flies (Ant-, MP+) to the behaviorally active compounds (10–4 dilution used for trap and T-maze experiments and 10–2 dilution used for wind tunnel experiments). The symbols *, ** and *** indicate statistically significant differences between groups with p<0.01, p<0.001, and p<0.0001, respectively; ‘ns’ indicates no significant differences between groups (Kruskal Wallis test with Dunn’s multiple comparison for selected groups, n = 10). (D) Behavioral responses of flies with a killed or silenced specific MP-OSN population, the corresponding parental lines, and WT flies. Different letters indicate significant differences between groups (Kruskal Wallis test with Dunn’s multiple comparison). Black line: median; boxes: upper and lower quartiles; whiskers: minimum and maximum values.
-
Figure 5—source data 1
Raw data of all behavioral experiments with D. melanogaster presented in Figure 5.
- https://doi.org/10.7554/eLife.14925.022
Figure 5—figure supplement 1
Behavioural effects of palp odors on WT and Orco[2] flies.
(A) Behavioral responses of WT flies to the palp best activators at 10–2 dilution in T-maze experiments. The symbol * indicates that data are significantly different from the solvent control (p<0.05, Wilcoxon signed rank test, n = 10). Whiskers represent the minimum and maximum values. (B). Behavioral responses of WT and Orco[2] flies to the the behaviorally active compounds at 10–2 dilution in T-maze two-choice experiments. The symbol * indicates significant differences between groups with p<0.01 (two-tailed Independent Samples T Test, n = 10). ‘ns’ indicates no statistically significant differences between groups (p>0.05, two-tailed Independent Samples T Test, n = 10). Black line: median; boxes: upper and lower quartiles; whiskers: minimum and maximum values.
-
Figure 5—figure supplement 1—source data 1
Raw data of all behavioral experiments with D. melanogaster and palp activating odors at high concentration presented in Figure 5—figure supplement 1.
- https://doi.org/10.7554/eLife.14925.024
Figure 5—figure supplement 2
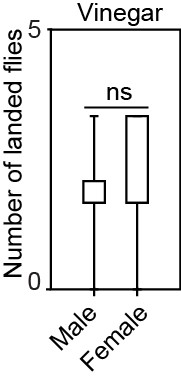
Behavioral responses of male and female WT flies to 10% vinegar in wind tunnel experiments. ‘ns’ indicates no statistically significant differences between groups (p>0.05, two-tailed Mann-Whitney U Test, n = 10).
Black line: median; boxes: upper and lower quartiles; whiskers: minimum and maximum values.
-
Figure 5—figure supplement 2—source data 1
Raw data of wind-tunnel experiments performed with female and male D. melanogaster presented in Figure 5—figure supplement 2.
- https://doi.org/10.7554/eLife.14925.026
Figure 6
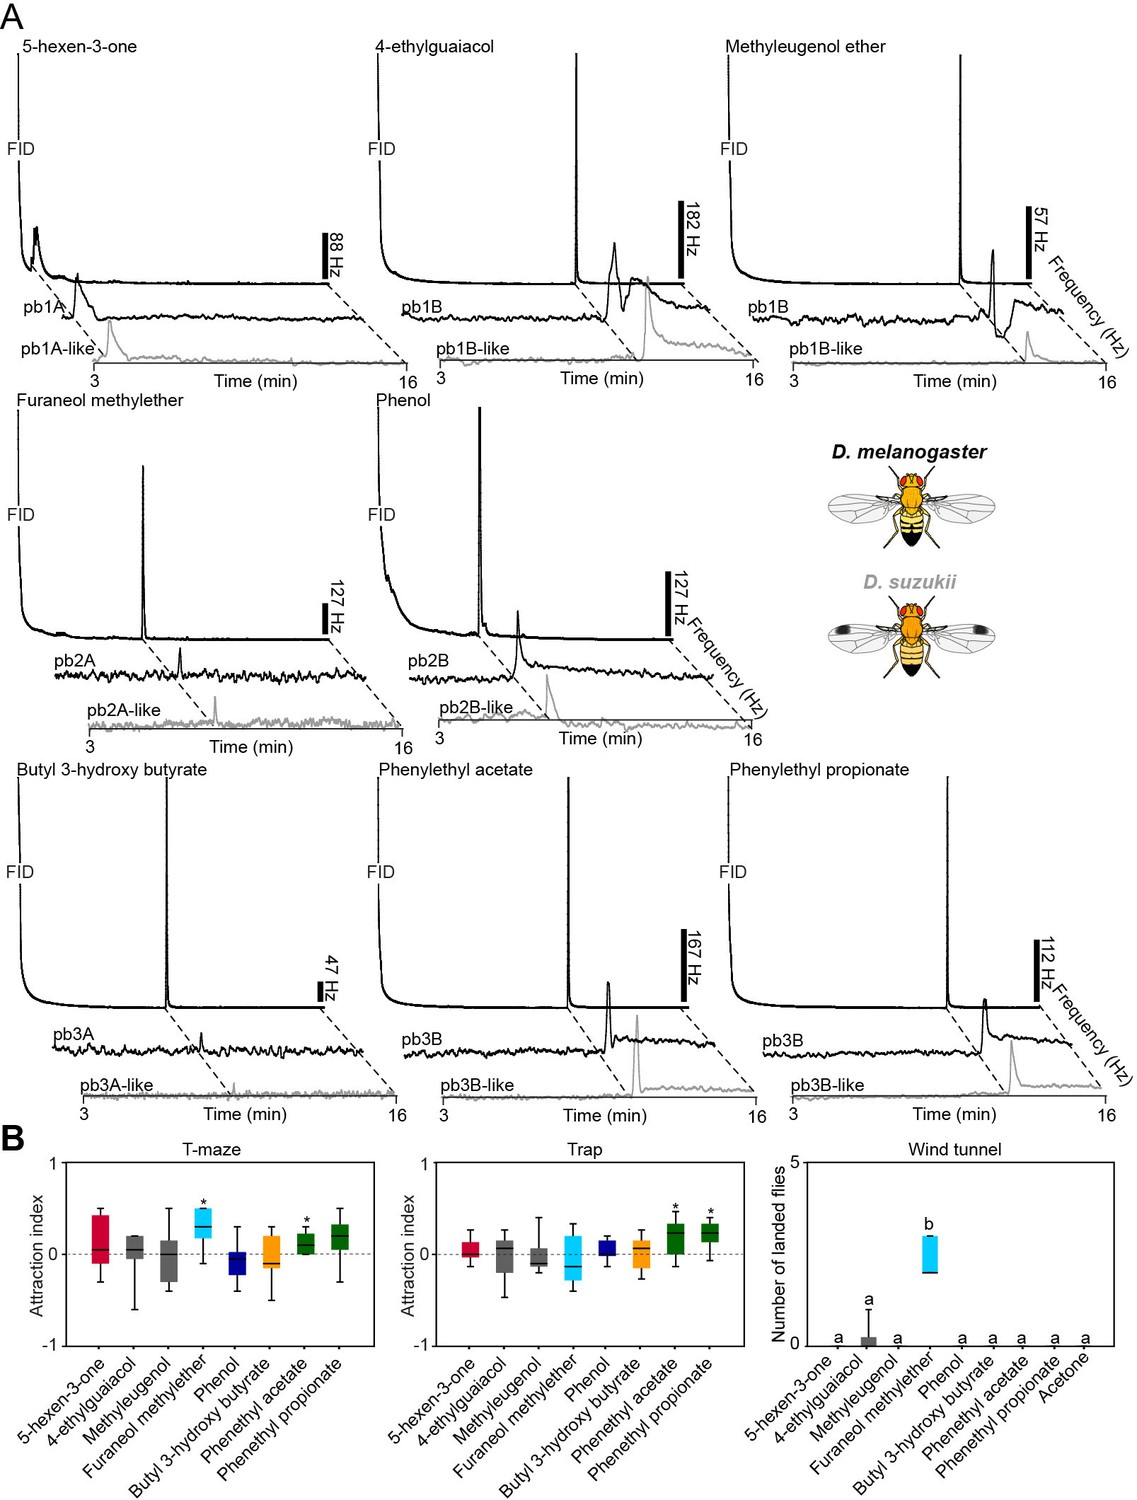
Organization, detection, and or genes of MP-OSNs are conserved in D. suzukii.
(A) Representative GC-SSR traces from palp OSNs in D. suzukii and D. melanogaster, stimulated with the palp best ligands (dilution 10–4) (n = 3). (B) Behavioral responses of D. suzukii to D. melanogaster palp best activators (10–4 dilution used for trap and T-maze assays, and 10–2 dilution used for wind tunnel experiments). For T-maze and trap assays, the symbol * indicates significant differences from the solvent control (p<0.05, Wilcoxon signed rank test, n = 10). For wind tunnel assays, different letters indicate statistically significant differences between groups (p<0.05, Kruskal Wallis with Dunn’s multiple comparison). Black line: median; boxes: upper and lower quartiles; whiskers: minimum and maximum values.
-
Figure 6—source data 1
Raw data of physiological and behavioral responses of D. suzukii presented in Figure 6.
Raw data of D. melanogaster results from the same figure can be found in Figure 3—source data 1.
- https://doi.org/10.7554/eLife.14925.028
Tables
Table 1
List of physiologically active compounds identified for MP-OSNs including their Chemical Abstract Service numbers (CAS no.).
| Compound | CAS no. |
|---|---|
| 5-hexen-3-one | 24253-30-3 |
| Ethyl butyrate | 105-54-4 |
| Ethyl (methylthio) acetate | 4455-13-3 |
| Gamma-hexalactone | 695-06-7 |
| Para-tolyl acetate | 140-39-6 |
| Creosol | 93-51-6 |
| 4-ethylguaiacol | 2785-89-9 |
| Eugenol | 97-53-0 |
| Methyleugenol | 93-15-2 |
| Furaneol methylether | 4077-47-8 |
| (-)-camphor | 464-48-2 |
| Alpha-ionone | 127-41-3 |
| Beta-ionone | 14901-07-6 |
| Phenol | 108-95-2 |
| 4-methylphenol | 106-44-5 |
| Butyl butyrate | 109-21-7 |
| 4-sec-butoxy-2-butanone | 106-44-5 |
| Butyl 3-hydroxy butyrate | 53605-94-0 |
| 2-Phenethyl acetate | 103-45-7 |
| Phenethyl propionate | 122-70-3 |
Table 2
Best activators of MP-OSNs.
Palp OSN | Odorant | Chemical structure | Detection threshold |
pb1A | 5-hexen-3-one |  | 10-7 |
pb1B | 4-ethylguaiacol/Methyleugenol |  | 10-7 |
pb2A | Furaneolmethylether |  | 10-6 |
pb2B | Phenol |  | 10-7 |
pb3A | Butyl 3-hydroxy butyrate |  | 10-4 |
pb3B | 2-Phenethyl acetate/Phenethyl propionate | 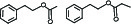 | 10-7 |
Additional files
-
Supplementary file 1
Gene sequences.
- https://doi.org/10.7554/eLife.14925.029
Download links
A two-part list of links to download the article, or parts of the article, in various formats.
Downloads (link to download the article as PDF)
Open citations (links to open the citations from this article in various online reference manager services)
Cite this article (links to download the citations from this article in formats compatible with various reference manager tools)
Olfactory channels associated with the Drosophila maxillary palp mediate short- and long-range attraction
eLife 5:e14925.
https://doi.org/10.7554/eLife.14925


