Heterogeneity and stochastic growth regulation of biliary epithelial cells dictate dynamic epithelial tissue remodeling
- Institute of Molecular and Cellular Biosciences, The University of Tokyo, Japan
Figures
Figure 1 with 3 supplements
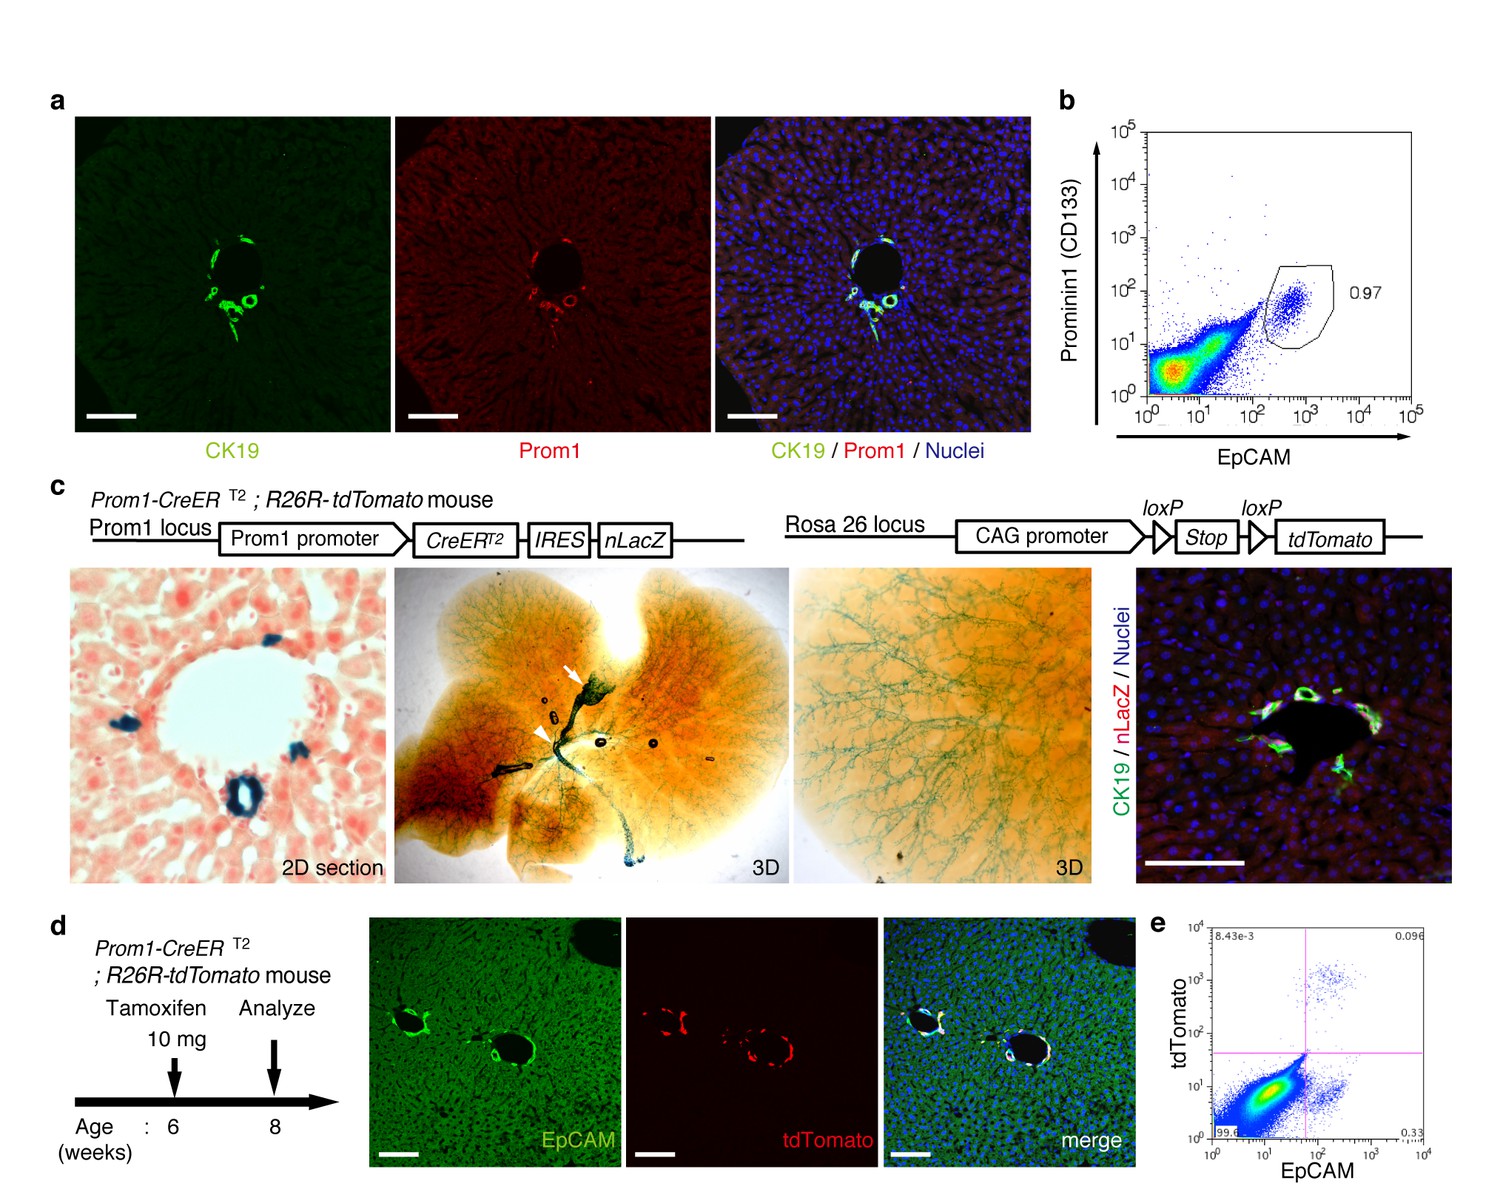
Visualization and lineage labeling of BECs using Prominin1 (Prom1) expression.
(a) Immunofluorescent (IF) staining for CK19 and Prom1 in the adult mouse liver (scale bars, 100 μm). (b) Representative expression pattern of Prom1 and EpCAM by fluorescence-activated cell sorting (FACS) analysis. Each dot or point represents an individual cell. The colors (pseudo-colors) indicate the density of dots (i.e., cells), corresponding to increasing numbers of events from blue to red. The outlying (and outlined) group highlights the EpCAM+ Prom1+ double positive population, indicating that these markers are co-expressed with each other. Successive gates were applied for DAPI-, forward and side scatter (FSC/ SSC), and pulse width (not shown). (c) Prom1-CreERT2;R26R-tdTomato mice were used to allow the detection of Prom1+ cells on the basis of LacZ expression. X-gal staining was performed on tissue sections (left panel) and whole liver samples (middle panels). The latter was cleared with benzyl-alcohol and benzyl-benzoate (BABB) after staining. The intra-hepatic biliary tree, as well as the extra-hepatic bile duct (white arrowhead), and the base of the gallbladder (white arrow) were visualized. Liver sections were also stained with anti-LacZ and anti-CK19 antibodies (right panel). (d and e) Lineage labeling in the Prom1-CreERT2;R26R-tdTomato mouse liver after tamoxifen administration (scale bars, 100 μm). (d) Immunostaining of liver section. (e) Representative FACS plot pattern of labeled cells. Successive gates were applied for DAPI-, FSC/SSC, pulse width and EpCAM+ (not shown). All experiments were performed with at least four biological replicates.
Figure 1—figure supplement 1
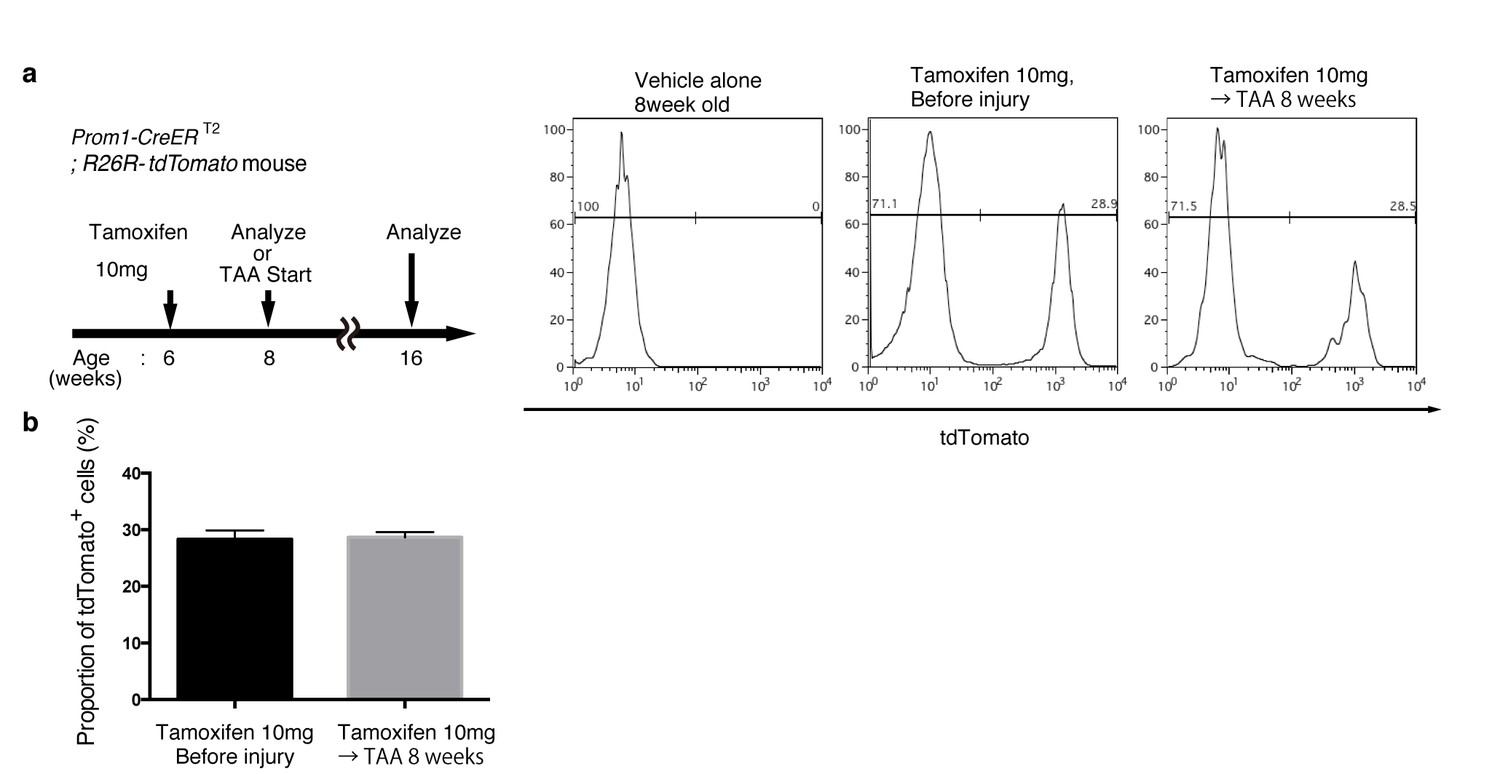
Quantification of lineage-labeled cells in Prom1-CreERT2; R26R-tdTomato mice.
(a) BEC labeling ratio in the Prom1-CreERT2;R26R-tdTomato mice was evaluated by FACS analysis. Left panel shows the experimental design. Two weeks after tamoxifen administration, the mice were subjected to analysis either directly (Before injury) or after 8 weeks of thioacetamide (TAA) injury. Non-parenchymal cells were collected from the dissociated liver and stained with anti-EpCAM antibody. FACS gates were applied sequentially as follows: DAPI- (live cells), FSC and SSC, pulse width, and EpCAM+. No labeled cell was detected in the mice treated with vehicle alone (No tamoxifen). Before and after tamoxifen administration, tdTomato+ cells were detected only in the EpCAM+ population (not shown). (b) Quantification of the labeled BEC populations. No significant difference was observed between those before and after the TAA injury. The data represent the mean ± SEM for the results of five different experiments for each condition. p=0.70 (un-paired Student’s t-test).
Figure 1—figure supplement 2
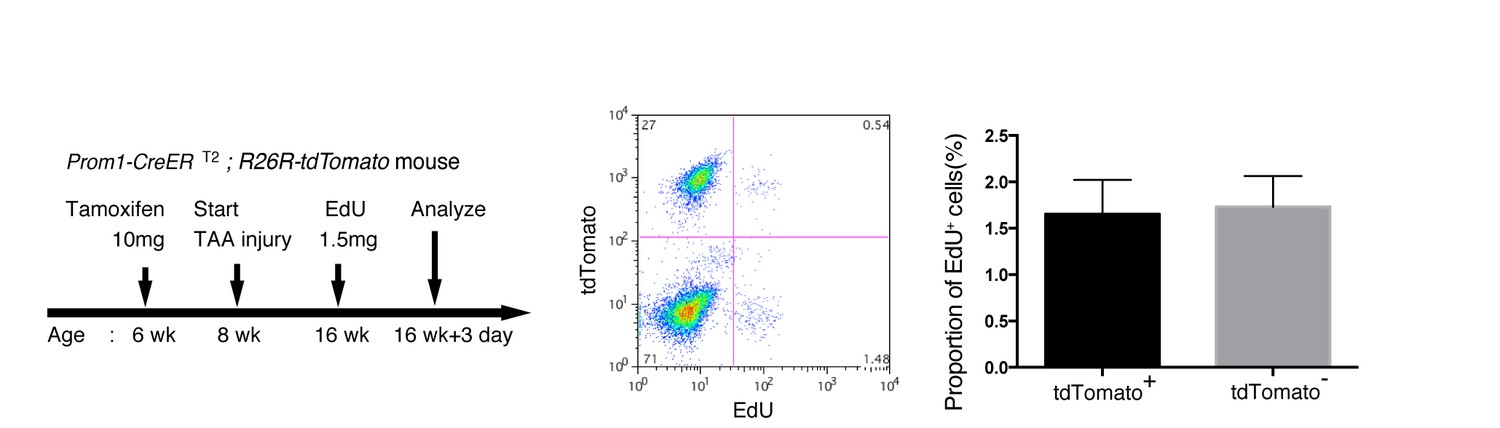
EdU uptake assay in lineage-labeled cells in Prom1-CreERT2;R26R-tdTomato mice.
EdU uptake assay was performed to examine the proliferative characteristics of lineage-labeled and non-labeled BECs. After tamoxifen administration (10 mg/20 g body weight), the Prom1-CreERT2;R26R-tdTomato mice were subjected to TAA injury for 8 weeks, injected intraperitoneally with EdU (1.5 mg/20 g body weight), and then analyzed. For FACS analysis, successive gates were applied for DAPI-, FSC/SSC, pulse width, and EpCAM+ (not shown). No significant difference was observed between the labeled (tdTomato+) and non-labeled (tdTomato-) BECs. The data represent the mean ± SD for five mice each. p=0.58 (paired Student’s t-test).
Figure 1—figure supplement 3

No labeled cells were detected in the absence of tamoxifen in Prom1-CreERT2;R26R-tdTomato mice.
(a and b) Leaky labeling in the Prom1-CreERT2;R26R-tdTomato mice was evaluated by FACS analysis. Left panel shows the experimental design. The mice were analyzed in the presence (a) or absence (b) of TAA injury after 8 weeks. Non-parenchymal cells were collected from the dissociated liver and stained with anti-EpCAM antibody. FACS gates were applied sequentially as follows: DAPI- (live cells), FSC/SSC, pulse width, and EpCAM+. No labeled cell was detected in either condition. Experiments were performed with three biological replicates and representative results are shown.
Figure 2 with 2 supplements
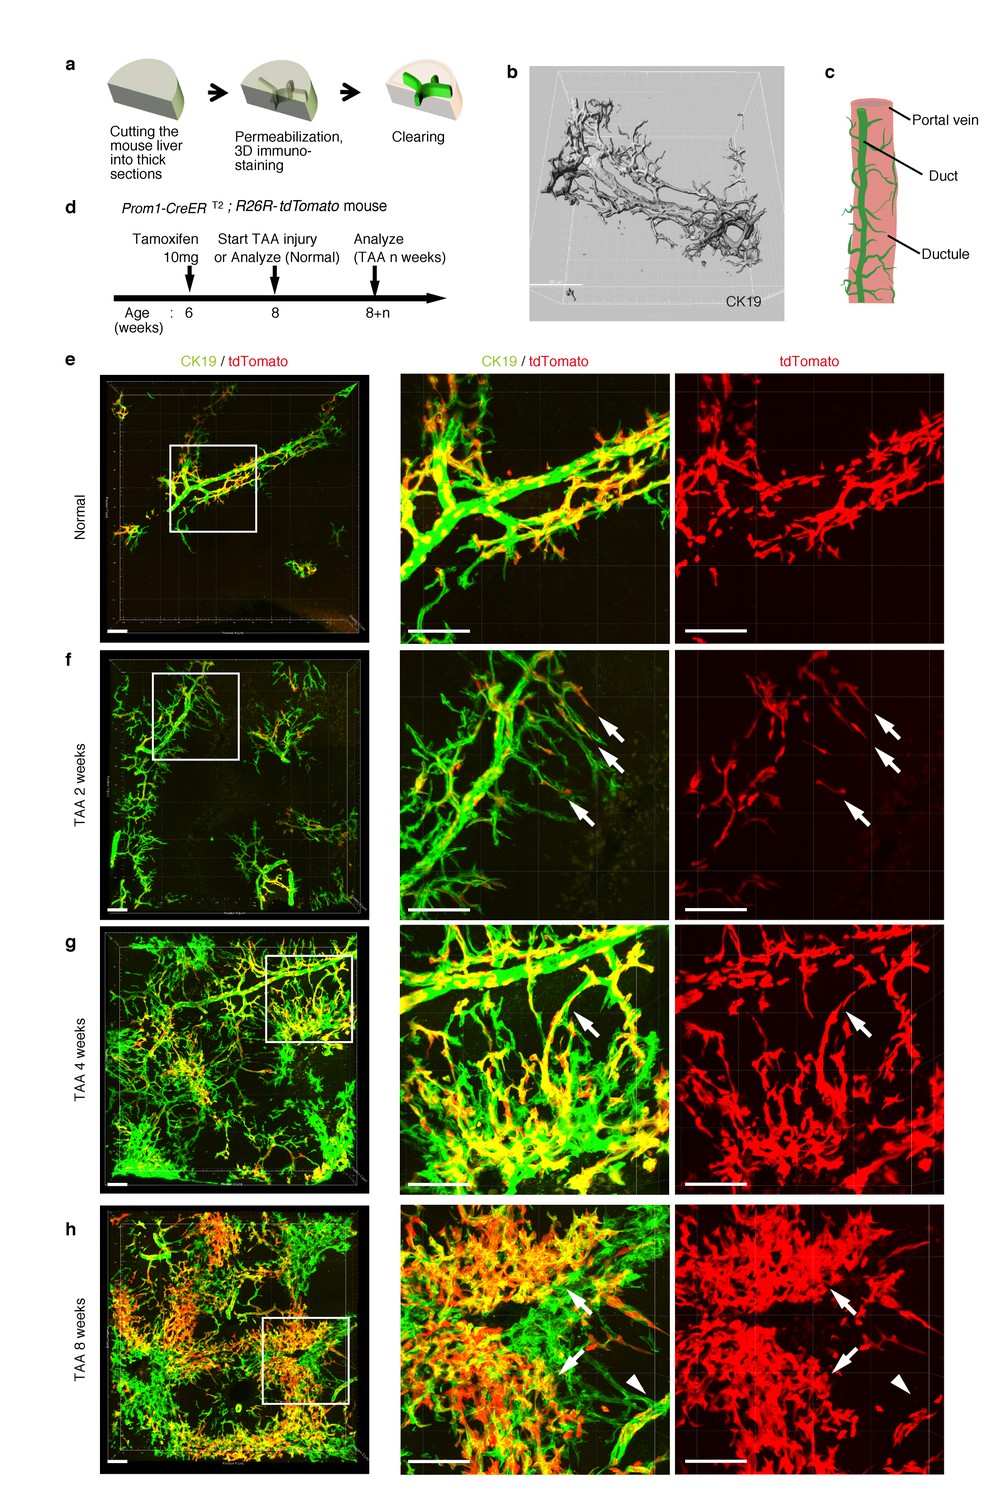
Pre-existing BECs contribute to the nascent biliary epithelial tissue structure upon injury.
(a) Schematic illustration of the 3D imaging method used to observe biliary tree structures. (b) 3D imaging view of the normal biliary tree structure revealed by anti-CK19 immunostaining. Z-stacked images were acquired by confocal microscopy and reconstructed by IMARIS software (normal shading mode). (c) Schematic model for the biliary tree structure under the normal condition. (d) Experimental scheme. (e–h) 3D reconstructed images of the biliary tree revealed by anti-CK19 immunostaining (green), showing the distribution of the BEC lineage-labeled cells (red) in the expanded biliary structure. Serial z-stacked confocal images were tiled (3 x 3 tiles) automatically by automatic positioning stage and Olympus fluoview software. Data are displayed as maximum-intensity projections. A region indicated by a white box in the left panel is magnified in the middle and right panels. Scale bars represent 100 μm. (f) White arrows indicate that pre-existing BECs (tdTomato+ cells) are extending outward. (g) White arrows indicate a branch of the biliary tree that connects the biliary duct around the PV with newly formed biliary branches around the CV. (h) White arrows indicate clusters of labeled cells that are located around the CV. White arrowheads indicate that the duct compartment around the PV shows a uniform mosaic pattern. All experiments were performed with at least five biological replicates.
Figure 2—figure supplement 1
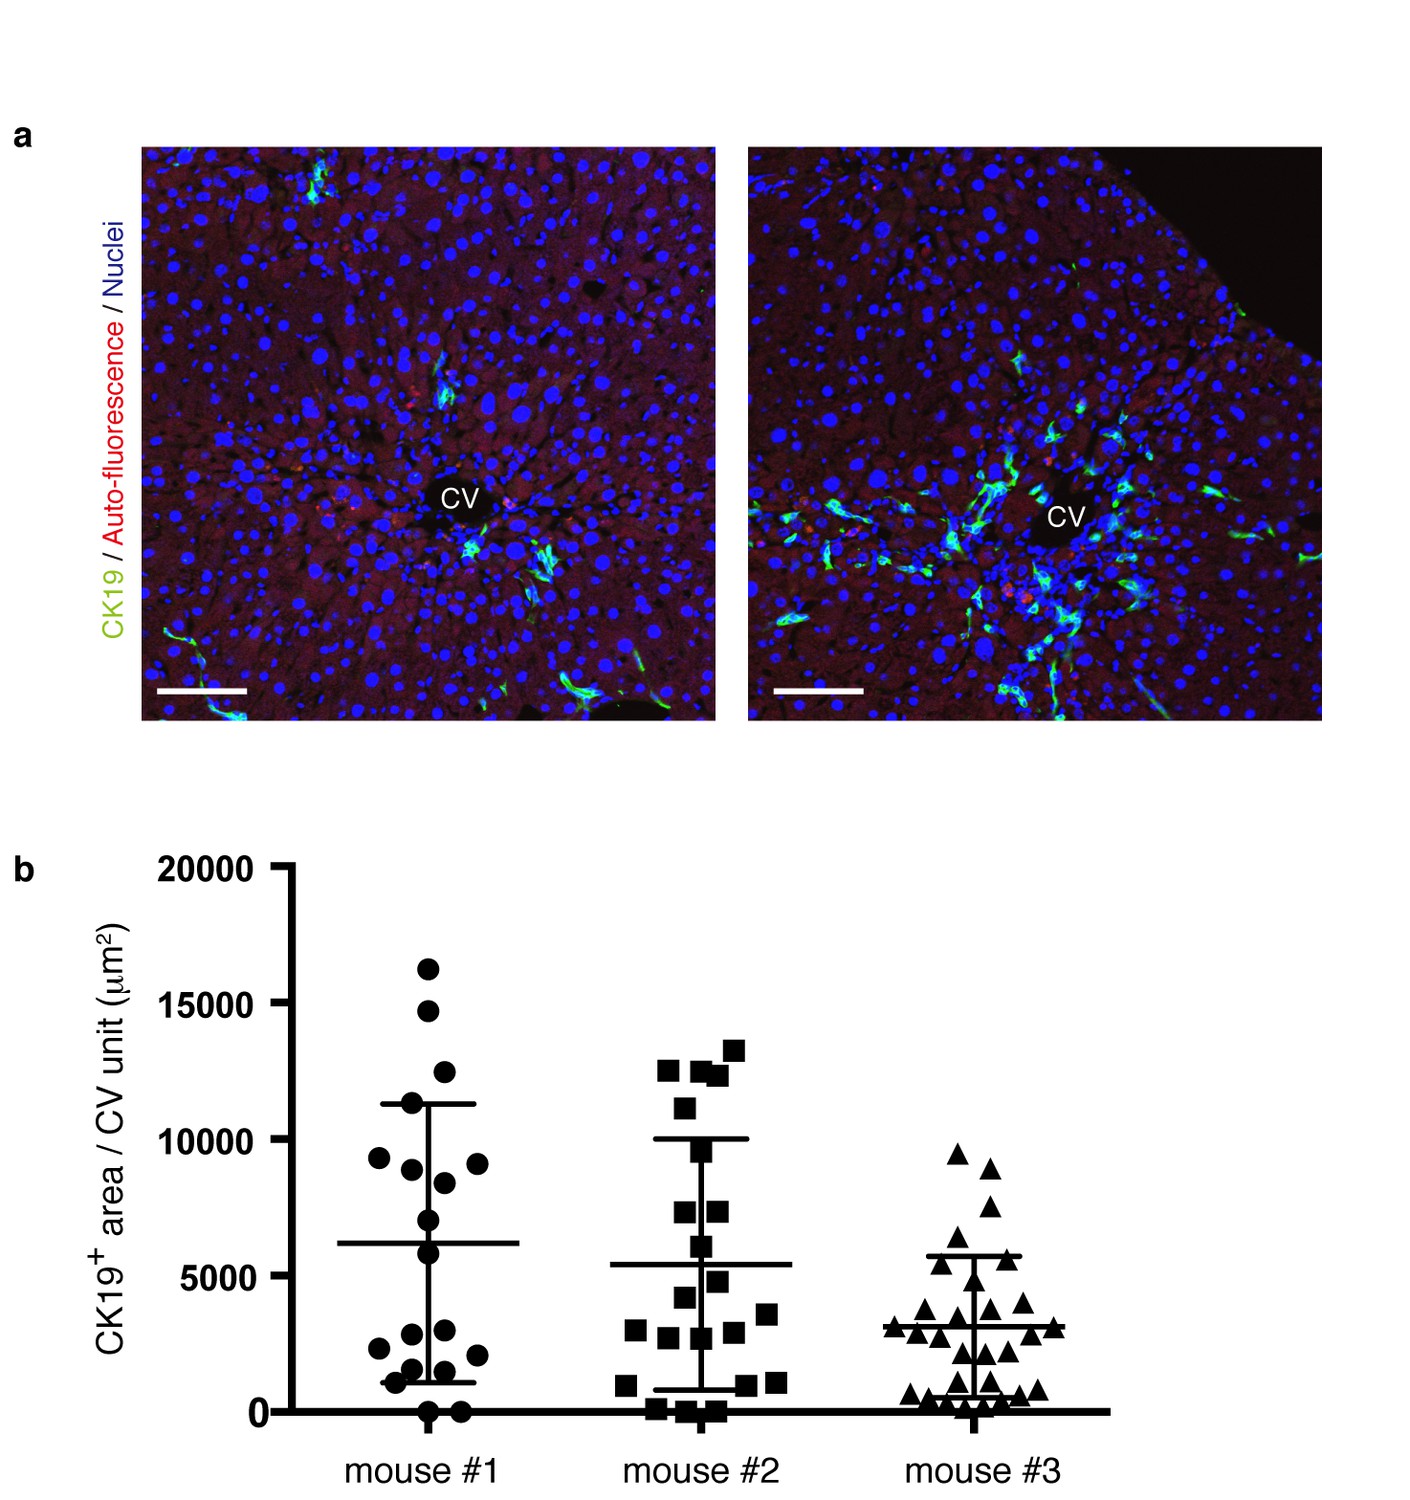
The level and distribution pattern of the ductular reaction in a microscopic view is highly diversified within a liver.
(a) Progression of the ductular reaction is not uniform microscopically. Sections were prepared from different regions of the same liver sample derived from a mouse treated with TAA for 6 weeks, and then immunostained with anti-CK19 antibody to reveal the biliary tree structure. Note that the level and distribution pattern of the ductular reaction appear considerably diversified even in the same liver when we focus on relatively small areas. (b) The area of CK19+ regions in different CV units (>18 per mouse) was quantified by using Volocity software and plotted to show highly divergent levels of biliary tree expansion in each liver. Three different mice treated with TAA for 6 weeks were analyzed.
Figure 2—figure supplement 2

Macroscopic view of the ductular reaction upon TAA injury over time.
The entire tissue structure of the biliary tree was visualized by whole-mount X-gal staining of the liver from the Prom1-CreERT2 mice harboring the nLacZ gene knocked-in to the Prom1 locus. Whole-liver samples were harvested, fixed, stained and cleared with clearing reagent. Images were acquired with a macro zoom microscope (Olympus MVX10). Green signals represent nuclei of the Prom1+ cells. Scale bars, 1 mm. (a) Prom1+ signals revealed the finely branching biliary tree structure under the normal condition. The duct and ductule units can be clearly recognized, delineating the PV. (b and c) Upon TAA-induced injury, fine branches of the biliary tree extend from around the PV outward to the liver parenchyma. (d and e) After extensive branching and proliferation, BECs (Prom1+ cells) occupied the entire liver lobule. Note that the ductular reaction proceeds in a relatively stereotyped manner throughout the liver.
Figure 3 with 2 supplements
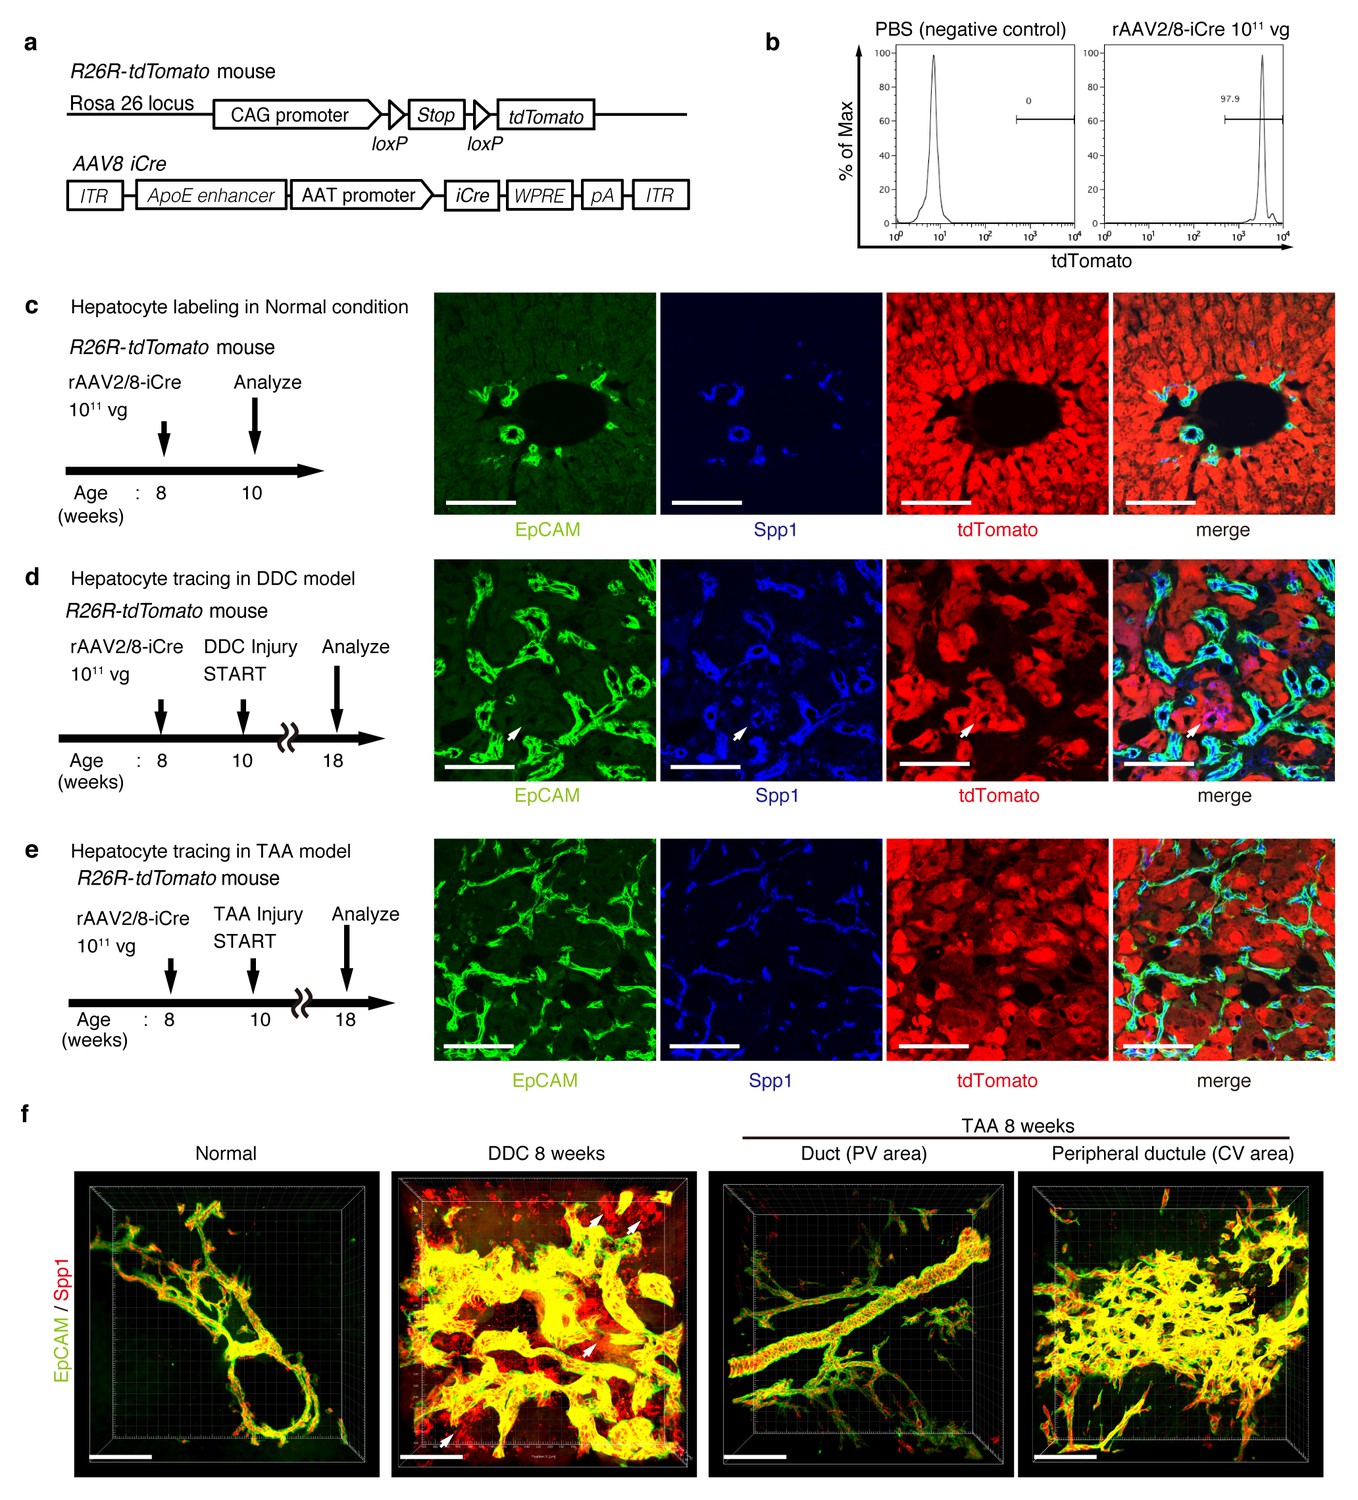
Lineage tracing of hepatocytes.
(a) R26R-tdTomato mice were used in combination with rAAV2/8-iCre for the labeling of hepatocytes. rAAV2/8-iCre is designed to transduce only hepatocytes. (b) Representative image of FACS analysis of hepatocytes labeled by rAAV2/8-iCre. These histogram images show the result of serial purification gates (FSC/SSC, pulse width, DAPI-). (c) Adult R26R-tdTomato mice were injected with rAAV2/8-iCre (1x10¹¹ vg /mouse). 2 weeks after injection, the mice were sacrificed and the livers were stained with anti-EpCAM and anti-Spp1 antibody (scale bar, 100 um). (d and e) Mice were injected with rAAV2/8-iCre (1011 vg /mouse) and then subjected to a 3,5-diethoxycarbonyl-1,4-dihydrocollidine (DDC) or TAA injury model. tdTomato+ Spp1+ EpCAM- cells were only observed in DDC-fed mouse liver sections (white arrows). Analysis was done with 5 mice per each injury model. More than 6 sections were made per mouse. (f) 3D imaging was performed with WT mice (normal state, DDC for 8 weeks, TAA for 8 weeks). Acquired z-stack data is displayed as maximum-intensity projection after contrast adjustment with IMARIS software. In the DDC liver, Spp1+ EpCAM- cells were observed (white arrow) around main biliary tubular structures that were composed of EpCAM+ cells.
Figure 3—figure supplement 1
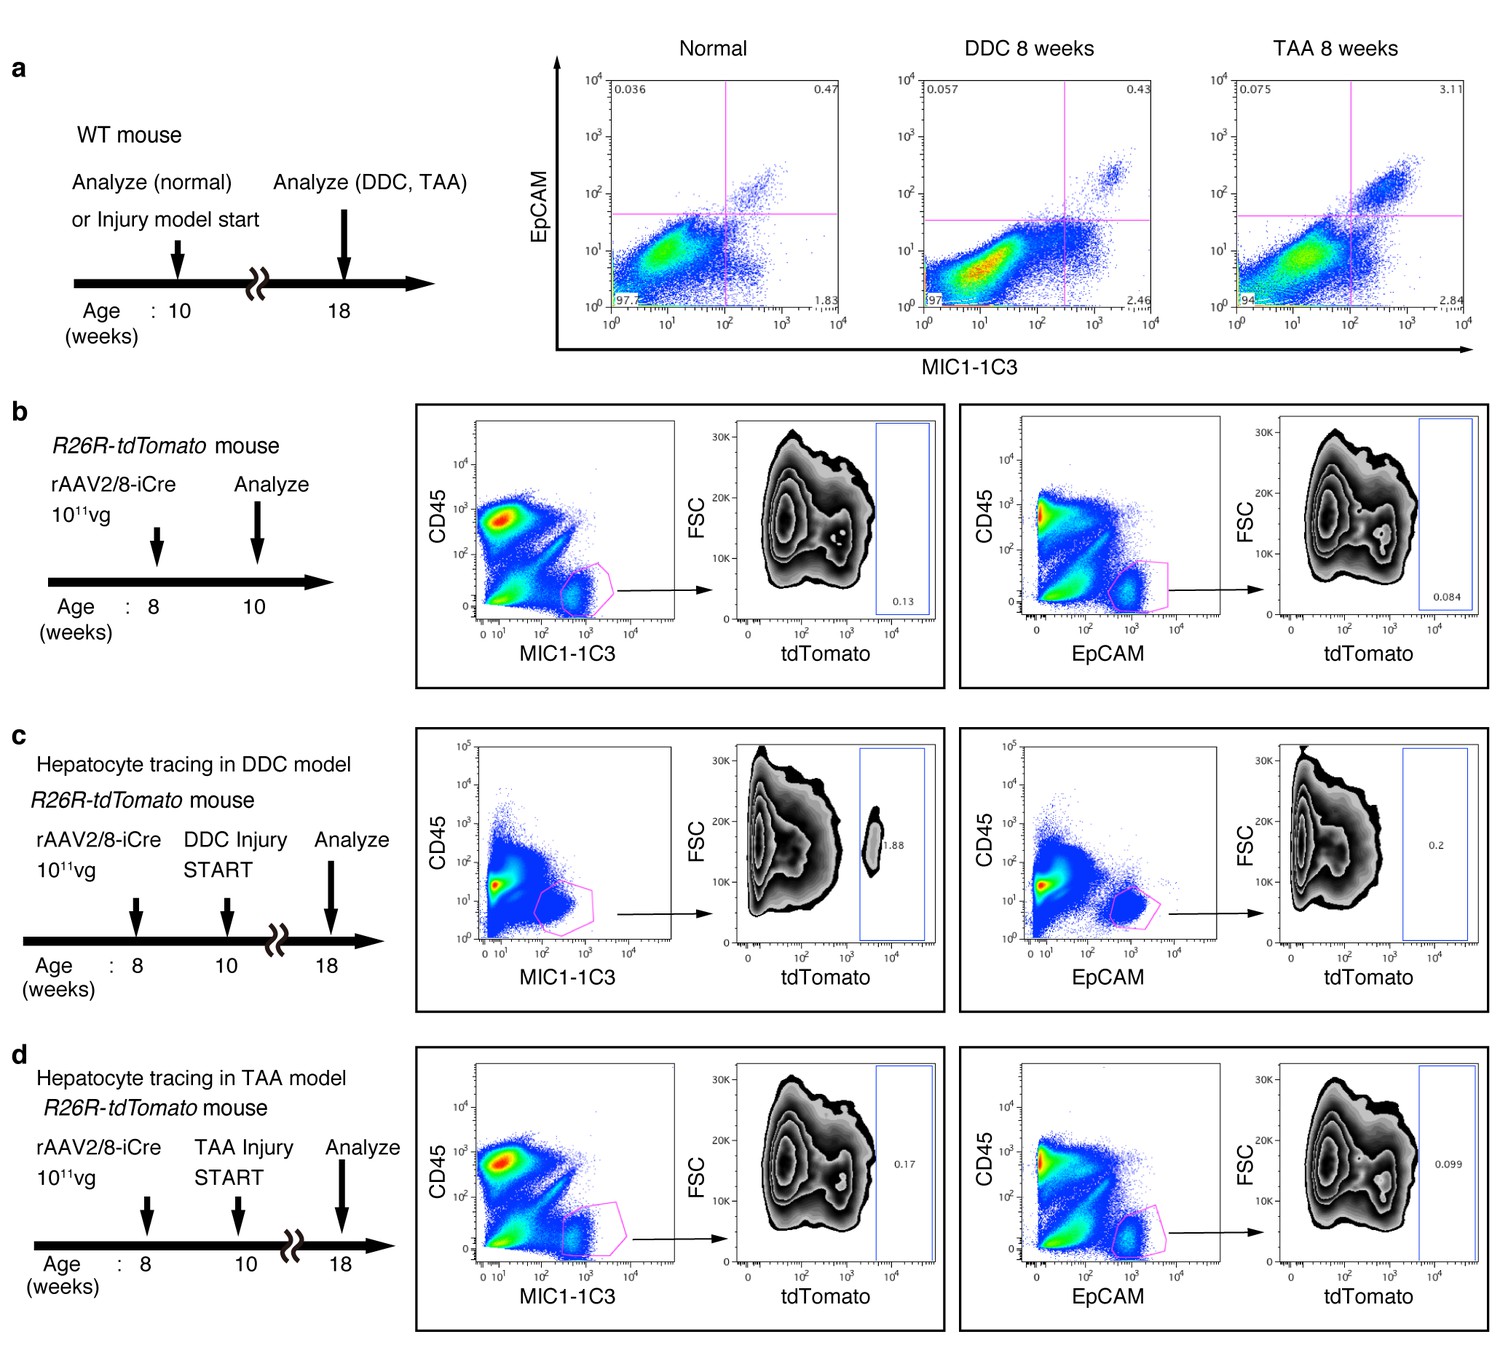
FACS analysis of hepatocyte-derived cells in the TAA and DDC models.
The experimental design is described on the left side of the figure. Hepatocytes of R26R-tdTomato mice were labeled with rAAV2/8-iCre. Dissociated liver cells were stained with anti-MIC1-1C3 antibody, anti-EpCAM antibody, anti-CD45 antibody and anti-Prom1 antibody. The results for Prom1 are not shown because they were essentially the same as those for EpCAM. All experiments were done more than three times to confirm reproducibility. Sequential FACS gates were applied; DAPI- (live cells), FSC/SSC, and pulse width. (a) All EpCAM+ cells were included in the MIC1-1C3+ cell population. (b) Before injury, almost no MIC1-1C3+ or EpCAM+ cells were labeled. (c) After DDC injury, a tdTomato+ population emerged in the MIC1-1C3+ population. Meanwhile almost no labeled cells emerged in the EpCAM+ population. (d) After TAA injury, almost no tdTomato+ cells appeared in MIC1-1C3+ population or in the EpCAM+ population. Experiments were performed with three biological replicates and representative results are shown.
Figure 3—figure supplement 2
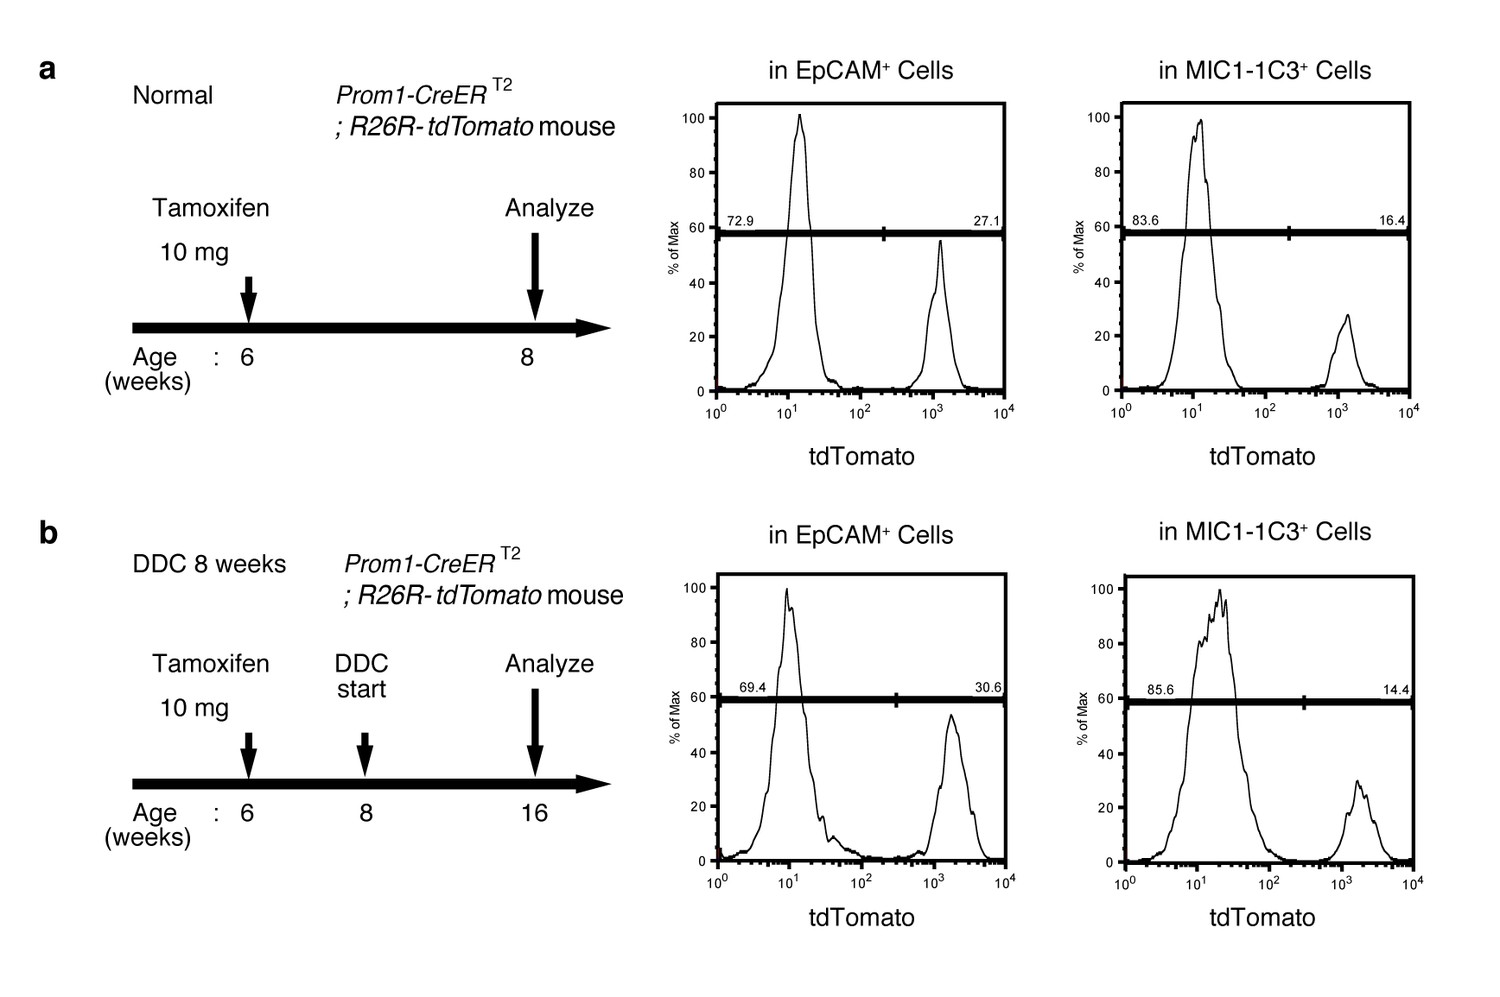
FACS quantification of labeled ratio in the Prom1-CreERT2; R26R-tdTomato mice before/after DDC injury.
(a and b) Labeling ratio in EpCAM+or MIC1-1C3+ cell populations in the Prom1-CreERT2;R26R-tdTomato mice was evaluated by FACS. The panels on the left show the experimental design. The mice were subjected to analysis DDC injury. Non-parenchymal cells were collected from the dissociated liver and stained with anti-EpCAM antibody or anti-MIC1-1C3 antibody. FACS gates were applied sequentially as follows: DAPI- (live cells), FSC/SSC, pulse width, CD45-, and EpCAM+ or MIC1-1C3+.
Figure 4 with 1 supplement
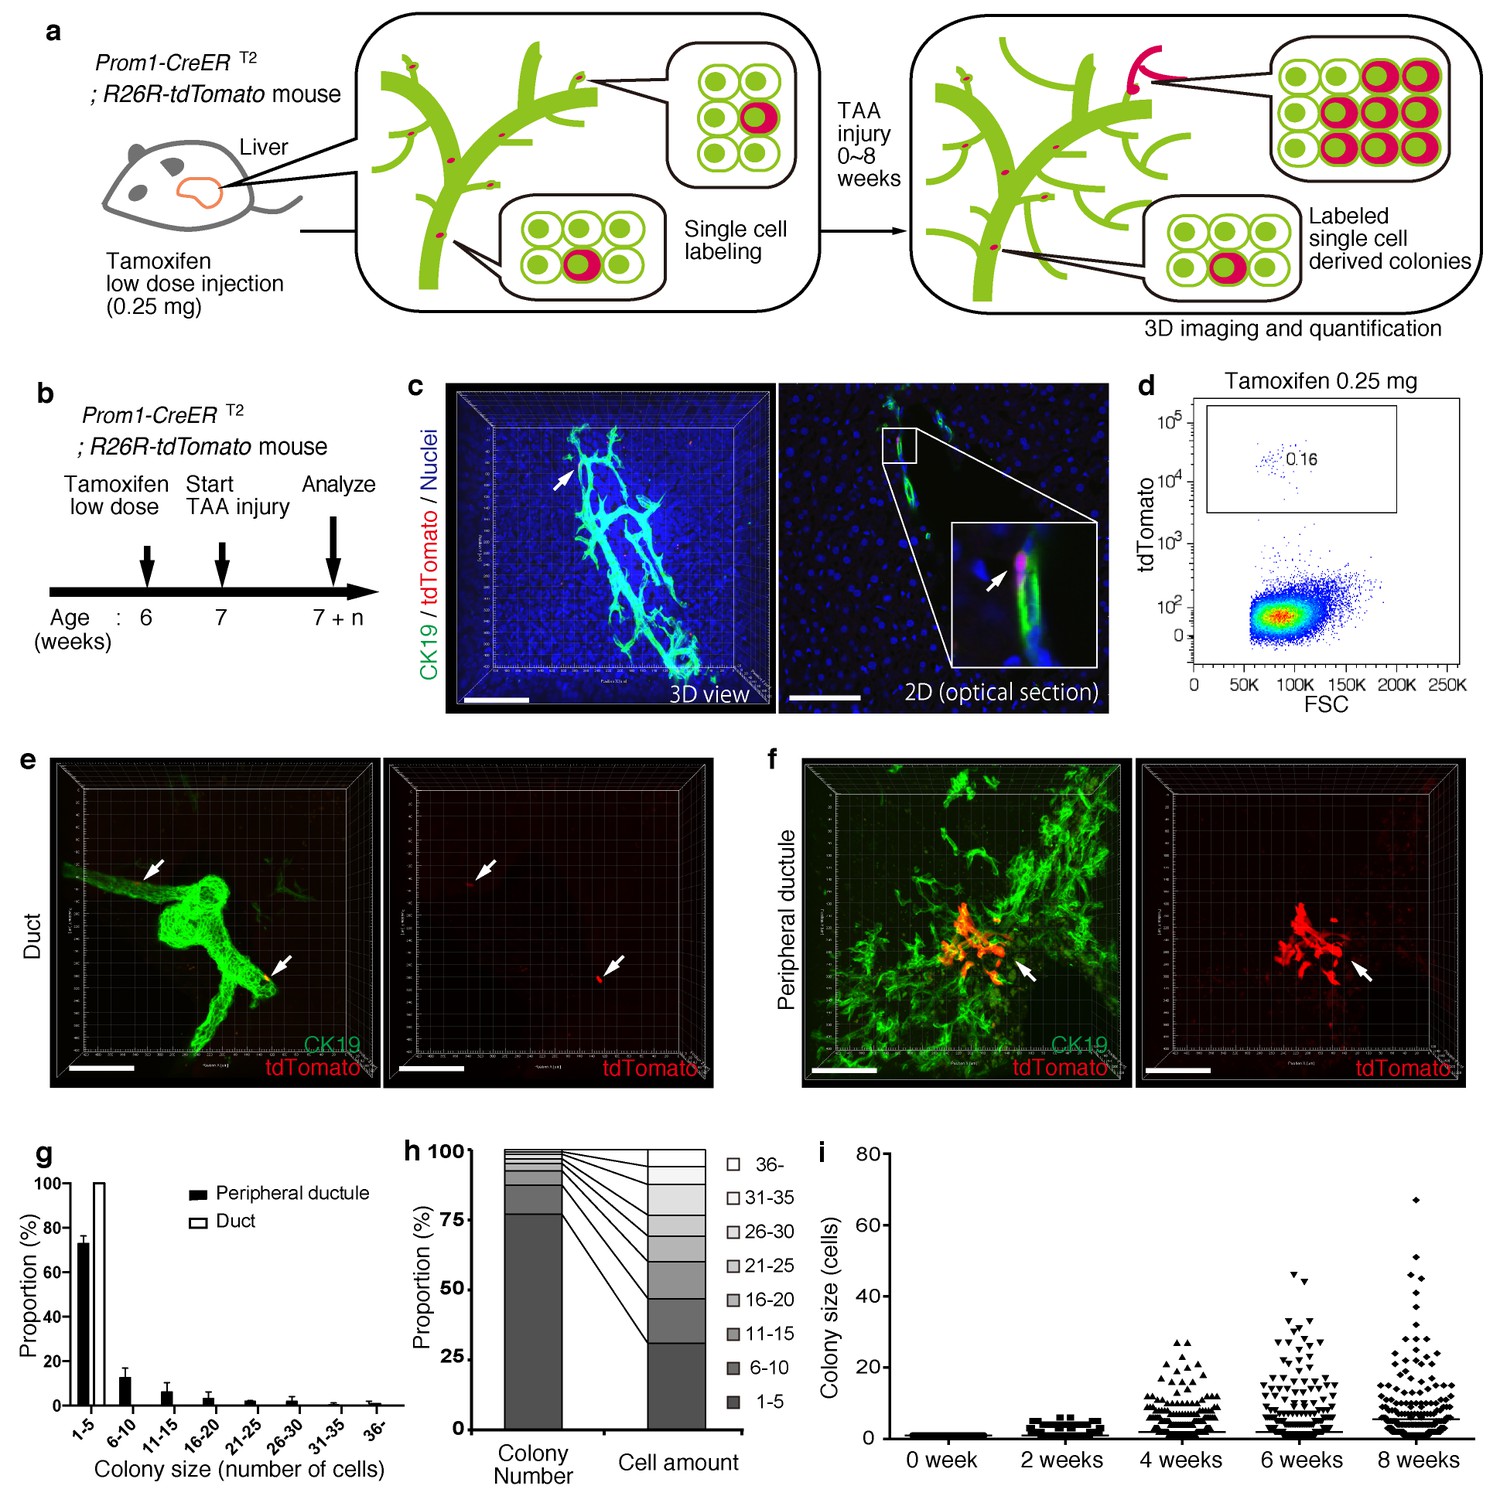
BECs exhibit heterogeneity in terms of proliferative capacity in vivo.
(a) Schematic diagram showing the rationale for quantitative in vivo single-BEC tracing. (b) Experimental design. (c) Upon administration of a very low dosage of tamoxifen (0.25 mg/kg body weight), liver samples were stained with anti-CK19 antibody and Hoechst33342. BEC labeling was introduced at the single-cell level (white arrows). A 3D image and an optical section corresponding to the same visual field are shown in the left and right panels, respectively (scale bars, 100 μm). (d) Quantification of the BEC-labeling efficiency after the low-dosage tamoxifen injection. For FACS analysis, successive gates were applied for DAPI-, FSC/SSC, pulse width and EpCAM+ (not shown). A representative plot pattern for 4 biological replicates is shown. (e and f) 3D images of labeled colonies after 6 weeks of TAA injury. Thick sections were stained with anti-CK19 antibody and 3D images were acquired with tdTomato+ colonies (white arrows) using confocal microscopy. The data are shown as maximum intensity projections. (e) Duct compartment around the PV area. (f) Peripheral ductule compartment around the CV area (scale bars, 100 μm). (g) Distribution of the quantified colony size at TAA 6 weeks (n = 5 mice, mean ± SD). The colonies were classified into two categories (duct and peripheral ductule) as described in the 'Materials and methods' section. (h) Relative numbers of colonies categorized by colony size as depicted in the legend to the right (left stacked bar chart), and the relative contribution of cell amounts from each colony category (right stacked bar chart) (calculated as follows: 100 x (sum of the cell numbers in a colony size)/(sum of all the counted cell numbers)). (i) Scatter plot of the colony size distribution over time. Data from five mice were pooled for each time point (total colony numbers counted were 257, 272, 304, 307 and 310 for the 0, 2, 4, 6 and 8 week samples, respectively). Horizontal lines show the mean of colony size. Images shown in panels (c), (e), and (f) are representative data for at least 5 biological replicates.
Figure 4—figure supplement 1
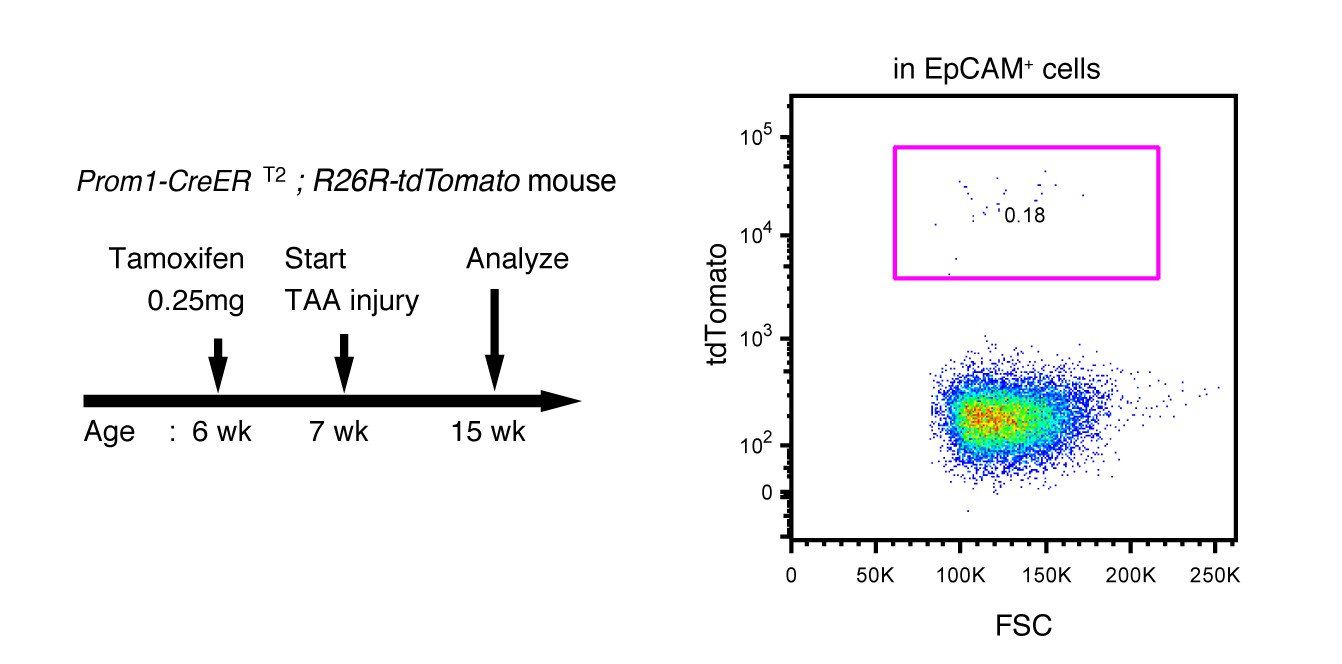
Labeling ratio in the Prom1-CreERT2; R26R-tdTomato mice was not changed after 8 weeks of TAA injury.
Left panel shows the experimental design. Mice were subjected to TAA injury after the low-dosage tamoxifen injection (0.25 mg/kg body weight). Before injury, the labeling ratio of BECs was less than 0.2% (around 0.18%) as shown in Figure 4d. Changes of labeling ratio were quantified after TAA injury. For FACS analysis, successive gates were applied for DAPI-, FSC/SSC, pulse width and EpCAM+ (not shown). Experiments were performed with 3 biological replicates and representative results are shown.
Figure 5 with 1 supplement
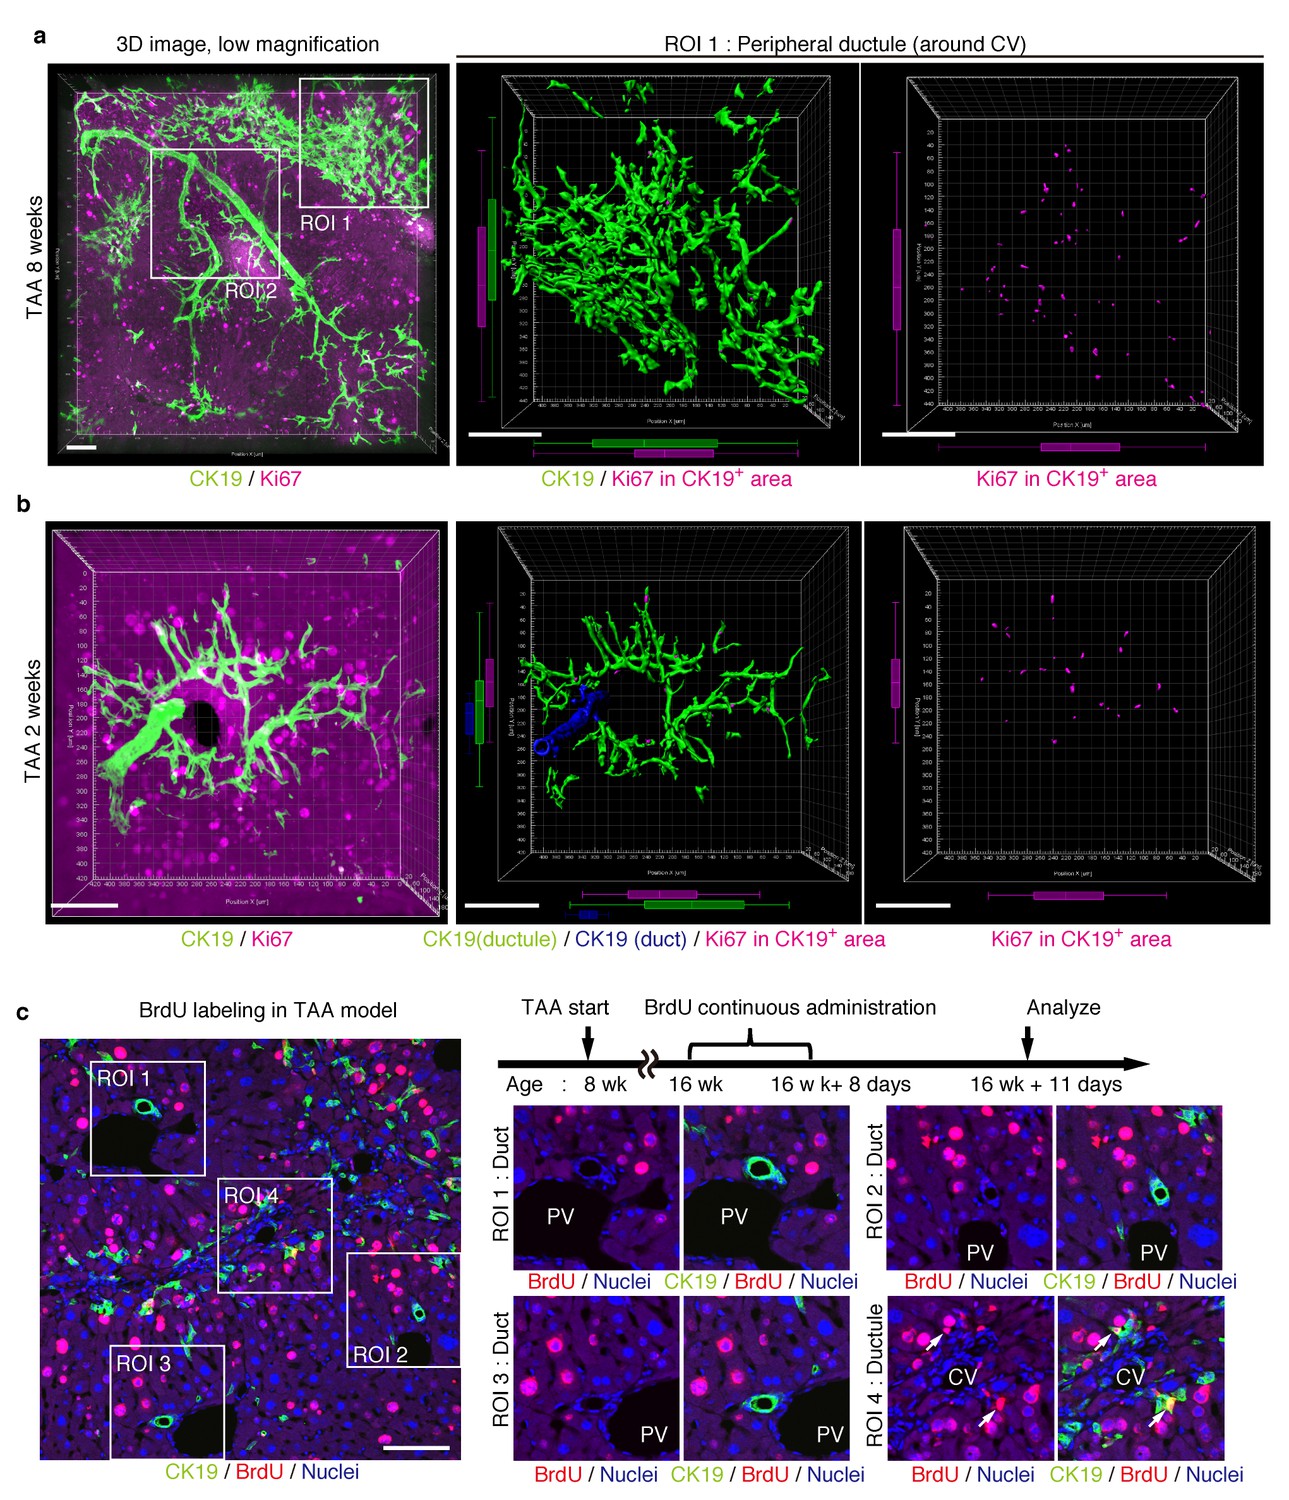
Proliferating BECs are scattered in the peripheral branching architectures in the biliary tree.
(a) 3D images of the biliary tree (CK19 immunostaining; green) and the cell cycle marker Ki67 (magenta) in TAA-injured liver samples. Middle and right panels show magnified views of the region of interest (ROI) 1 shown in the left panel, where CK19+ area and Ki67+ BECs therein were extracted using the IMARIS surface protocol. Distribution patterns of the CK19+ area and the Ki67+ CK19+ cells were calculated using the IMARIS vantage protocol after the signals were projected onto the background, and depicted in 2D box-and-whisker plots. (b) Liver samples at TAA 2 weeks were analyzed as in (a). Biliary structure is classified into duct compartment (shown in blue in the center image) and ductule (green). (c) Proliferating cells were labeled by continuous administration of BrdU for 8 days in the course of the TAA injury and were analyzed by anti-BrdU immunostaining (magenta). BrdU incorporation was observed in BECs residing in the peripheral ductule compartment (white arrows), but rarely in those in the duct compartment. All experiments were performed with at least 3 biological replicates.
Figure 5—figure supplement 1
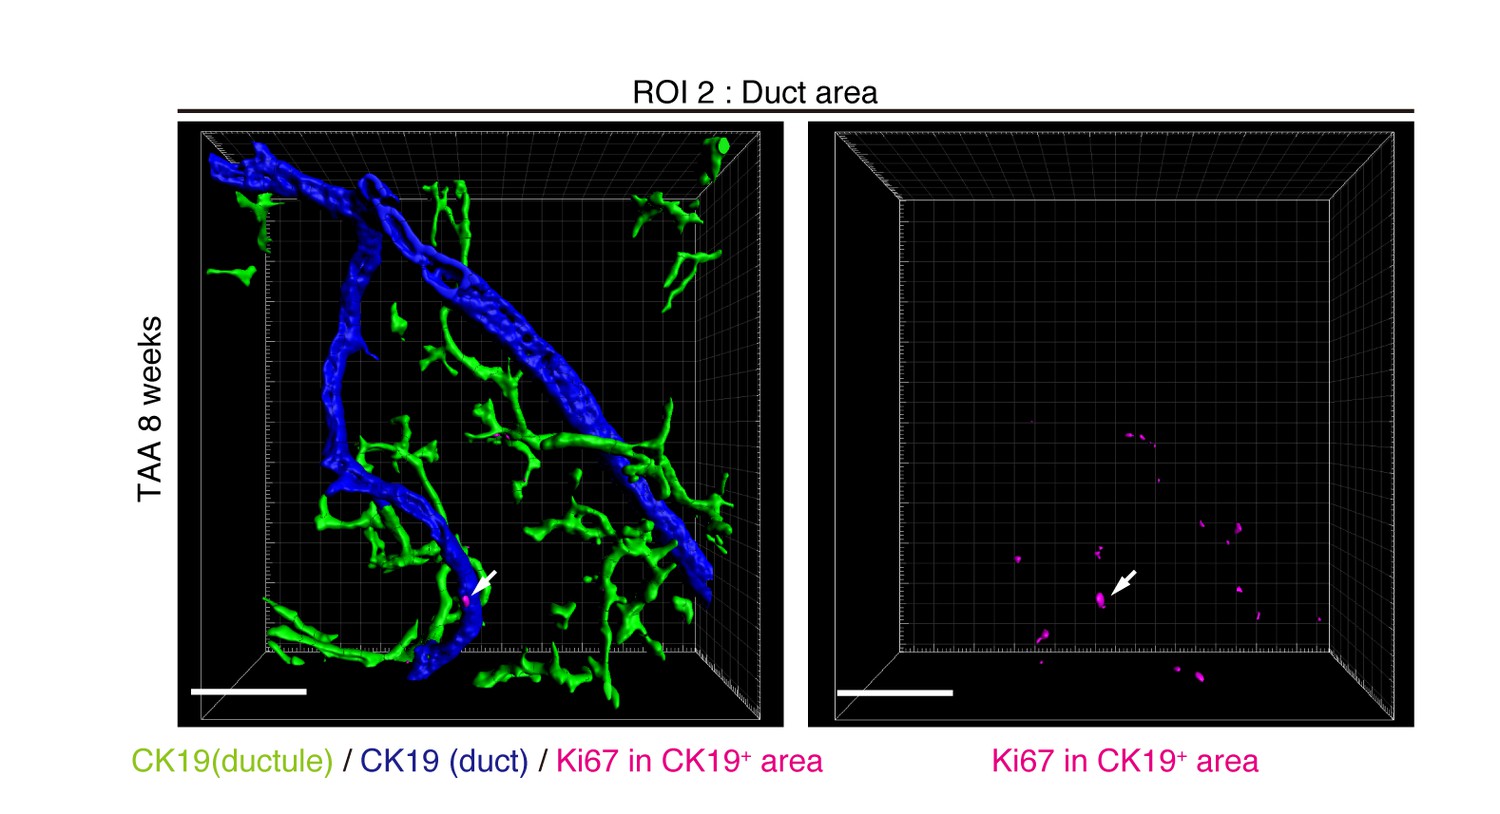
Distribution of Ki67+ BECs in the duct unit.
3D images corresponding to the ROI 2 area in Figure 5a represent the duct compartment of a mouse liver at TAA 6 weeks. Signals of 3D immunofluorescence for CK19 and Ki67 (magenta) were converted into 3D graphics using the surface protocol of the IMARIS software. The duct and ductule compartments are colored in blue and green in the left panel, respectively. Only one Ki67+ nuclei was found in the duct compartment, whereas there are many in the ductules.
Figure 6
BECs do not proliferate uniformly and can be subdivided into those in the proliferative state and those in the quiescent state.
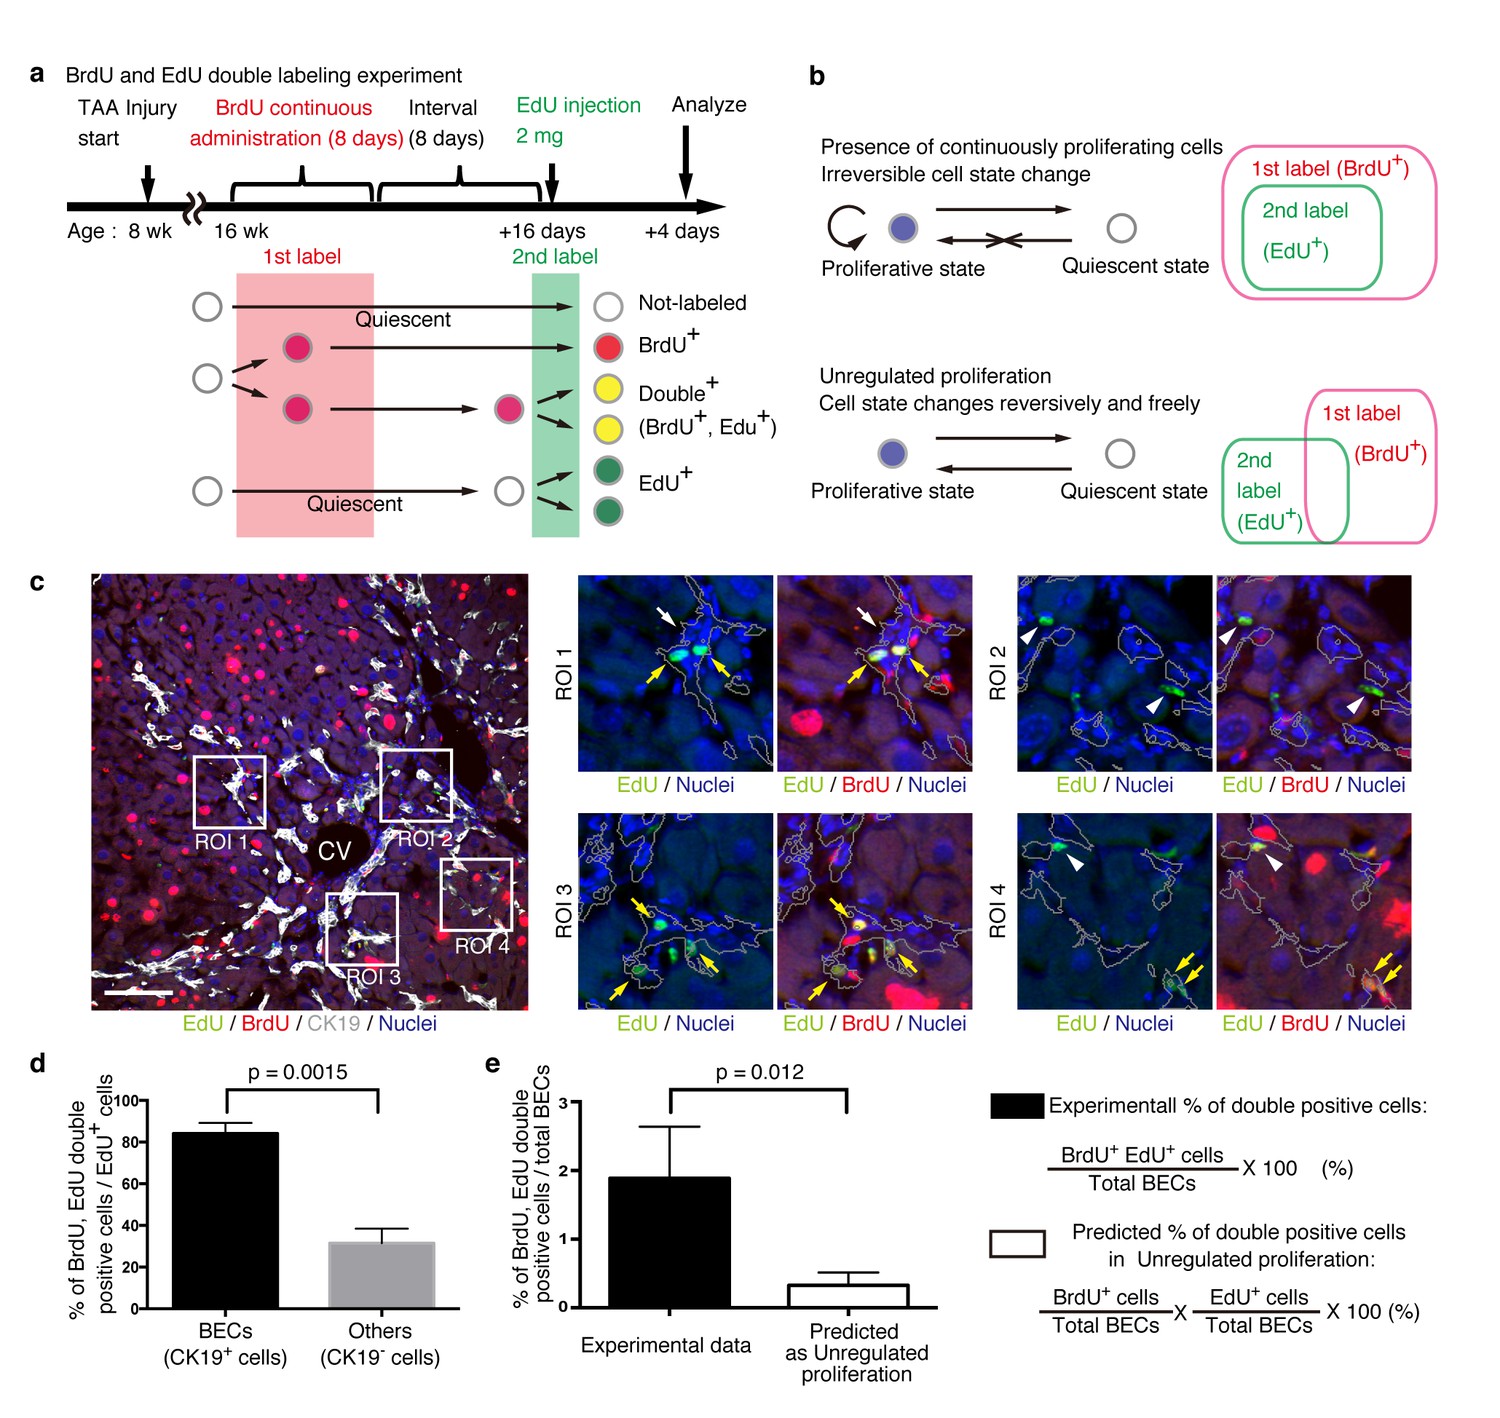
(a) Schematic diagram for the experimental design. At week 8 of the TAA injury model, mice were given BrdU via drinking water (0.8 mg/ml) for 8 days (1st label). After an interval of a further 8 days, the mice were intraperitoneally injected with EdU (2 mg/20 g body weight) for pulse labeling (2nd label). (b) Schematic diagram depicting two possible growth modes. In the top model, proliferative and quiescent cell populations can be distinguished by temporal state. This growth mode will give an experimental result in which the 2nd label+ cells are included within the 1st label+ cells. In the second model (bottom), the cells change their growth state in an unregulated manner, resulting in an un-biased labeling pattern. (c) Immunofluorescent staining results for BrdU and EdU incorporation together with CK19 immunostaining. Representative regions of interest (ROI 1–4) in the left panel are shown in the middle and right panels. In the magnified images, the boundaries of the CK19+ areas are delineated in gray lines. White arrowheads, EdU+ BrdU- cells; white arrows, non-labeled cells; yellow arrows, BrdU+ EdU+double-positive cells. Scale bar represents 100 μm. (d) Quantification of the BrdU+ EdU+ double-labeled cells. Data represents the mean ± SEM for 5 mice. (e) Comparison of the incidence of the BrdU+ EdU+ cells between the experimentally obtained data and the result predicted by the assumption that the BrdU and EdU labelings occur independently. p-value was calculated by two-tailed paired Student’s t-test. All experiments were performed with 5 biological replicates.
Figure 7 with 2 supplements
Mathematical modeling predicts the stochastic nature of the BEC proliferation.
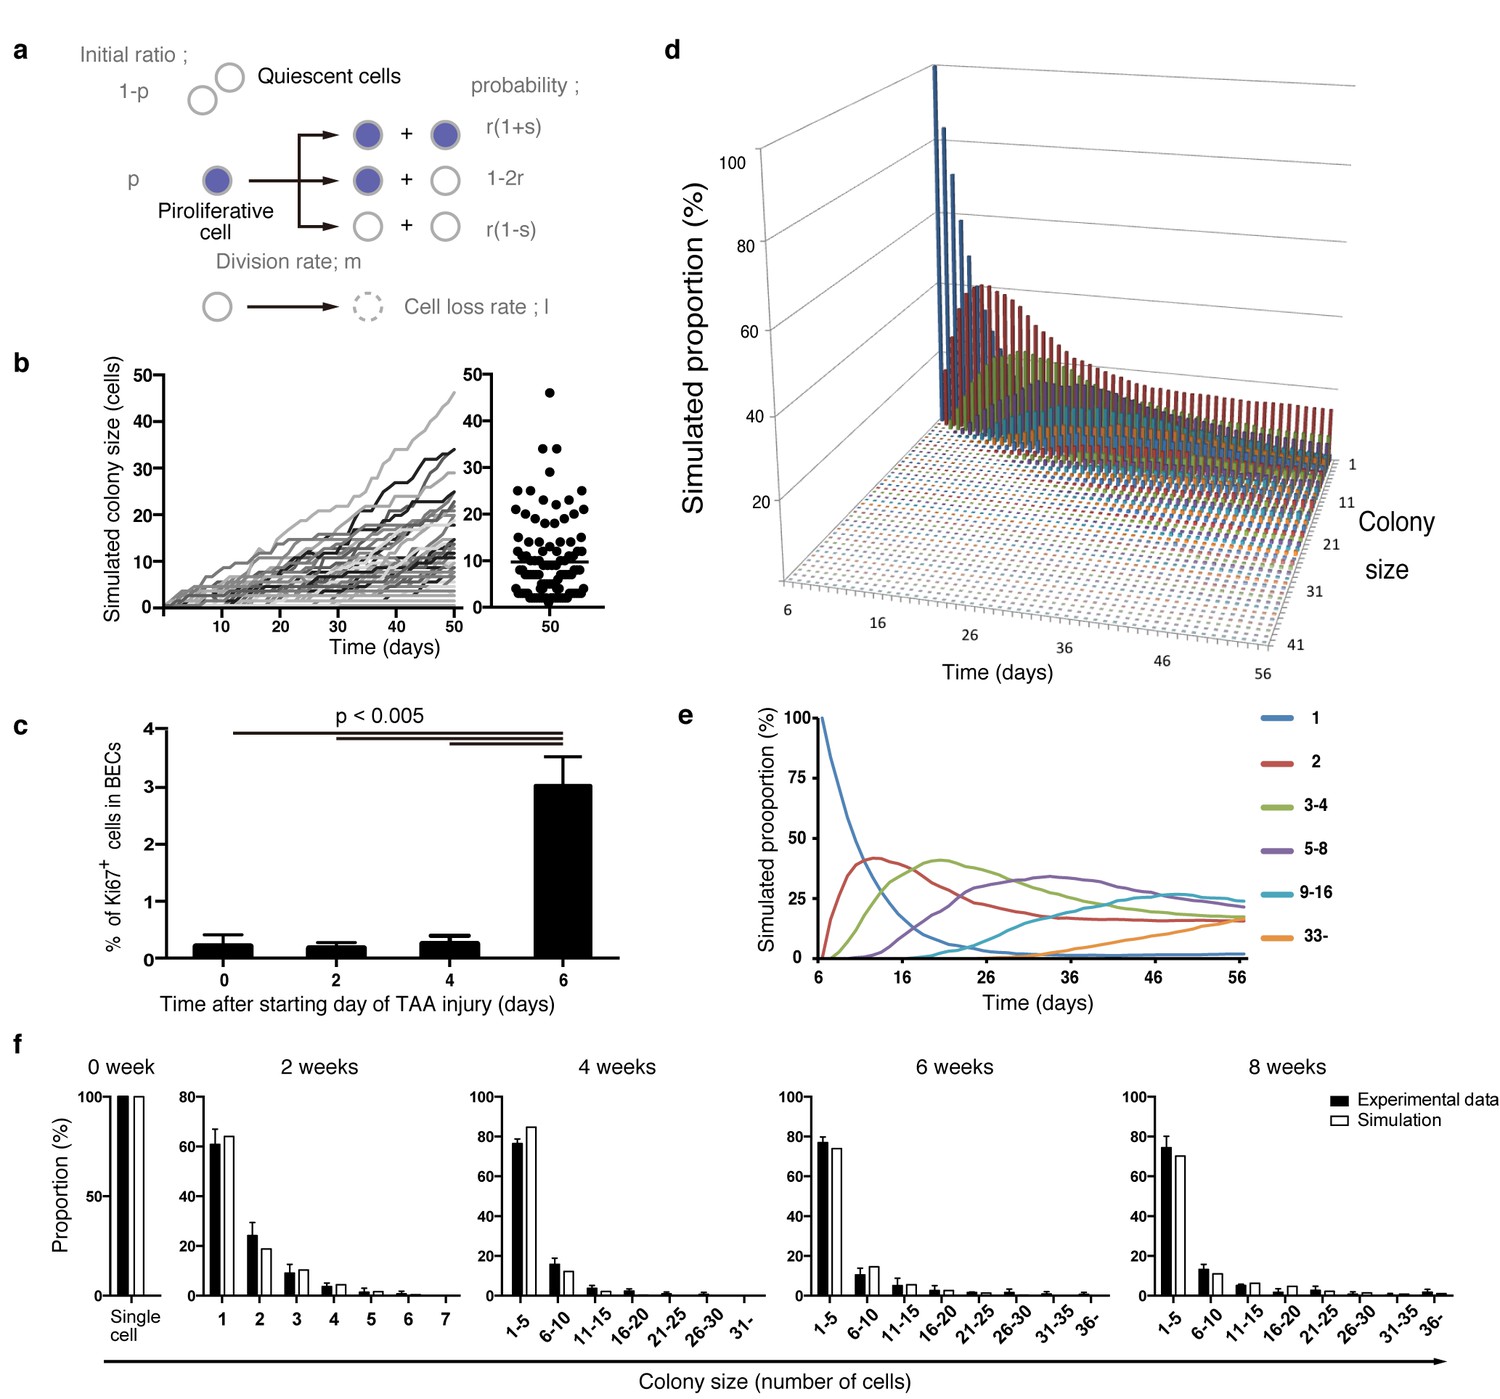
(a) Schematic diagram of the proposed growth model. We set five parameters. The parameter p represents the initial ratio of the cells in the proliferative state compared to total cells; m represents the probability that a cell will enter the cell cycle within one day. The frequency of each cell fate is defined by two parameters, r and s: r affects stability of colony size, whereas s represents imbalance of cell fate selection between proliferative and quiescent states. l represents the probability that a cell will be lost due to cell death (expressed as lost cells per total number of cells per day). (b–e) Monte Carlo simulation was performed using R software. (b) Consecutive changes in colony size over time are shown in the graph on the left. Each line represents a colony derived from a single proliferative cell. The scatter plot on the right corresponds to the colony-size distribution after 50 days of growth. (c) Quantitative data for Ki67+ BECs upon TAA injury revealed by immunostaining. Day 0 samples correspond to livers under normal conditions. A significant increase in Ki67+ cells among the BEC population was observed between 4 and 6 days after the start of injury (p<0.005, two-tailed paired Student’s t-test). Data represent mean ± SEM for 4 mice. (d and e) A simulated pattern for distribution of colony size and changes in this distribution for colonies derived from a single proliferative cell. Results are shown for a simulation when the parameters were set as follows: m = 0.175, r = 0.15, s = 0.06, and l = 0.001 (simulated cell number = 2000). (f) The quantified in vivo data alongside simulation results. The data simulating changes in colony size were constructed from the data for a single proliferative cell (d and e) compensated for the presence of quiescent cells (the initial ratio p=0.465). The experimental data were derived from the data sets used in Figure 4i.
Figure 7—figure supplement 1
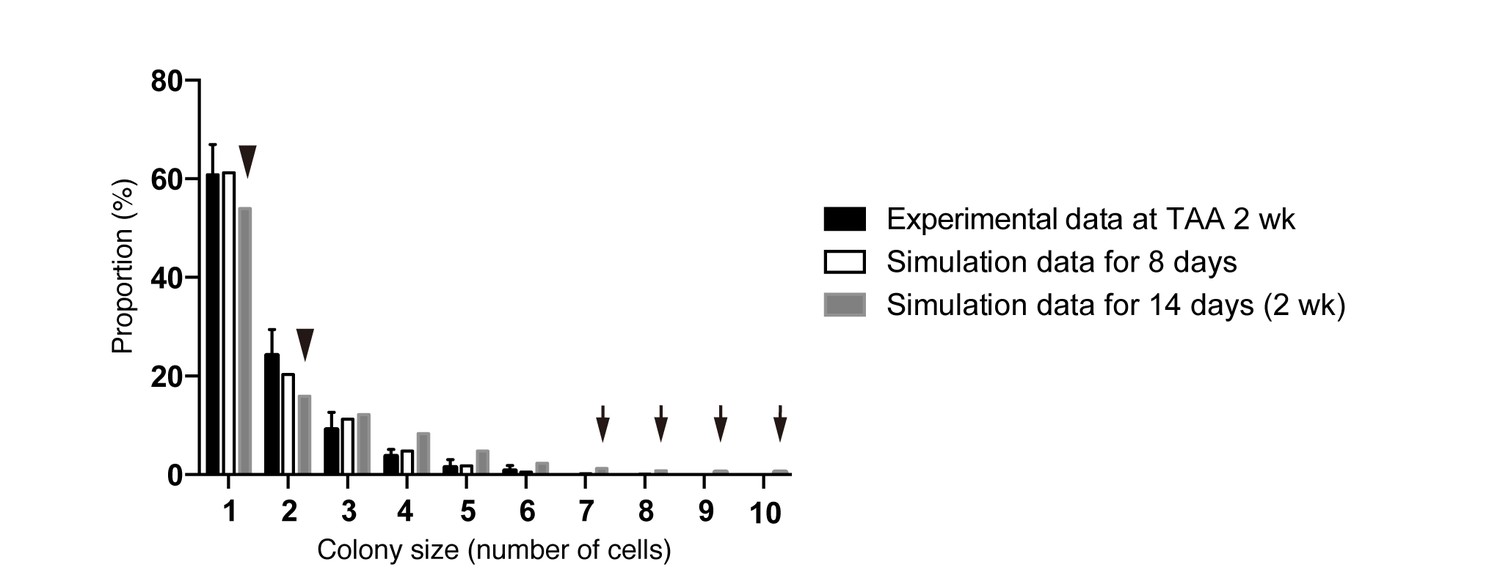
Discordance observed during the model-fitting process before taking account of the timing of the start of BEC proliferation upon injury.
Simulation data obtained from a model that is not adjusted for the proliferation start timing (gray bars) did not fit the experimental data for BEC colony formation in vivo (black bars). Early in the model-fitting process, the optimum model with the parameters set to best fit the data for colony-size distributions at 4, 6 and 8 weeks of injury showed a considerable discrepancy in fitting the data for 2 weeks of injury (black arrowheads and arrows). In particular, relatively large colonies were found only in the simulation data (black arrows). simulated data for 8 days of injury, albeit using the same model and parameters (white bars), showed better fit with the experimental data for 2 weeks of injury than did simulated data for 2 weeks of injury.
Figure 7—figure supplement 2
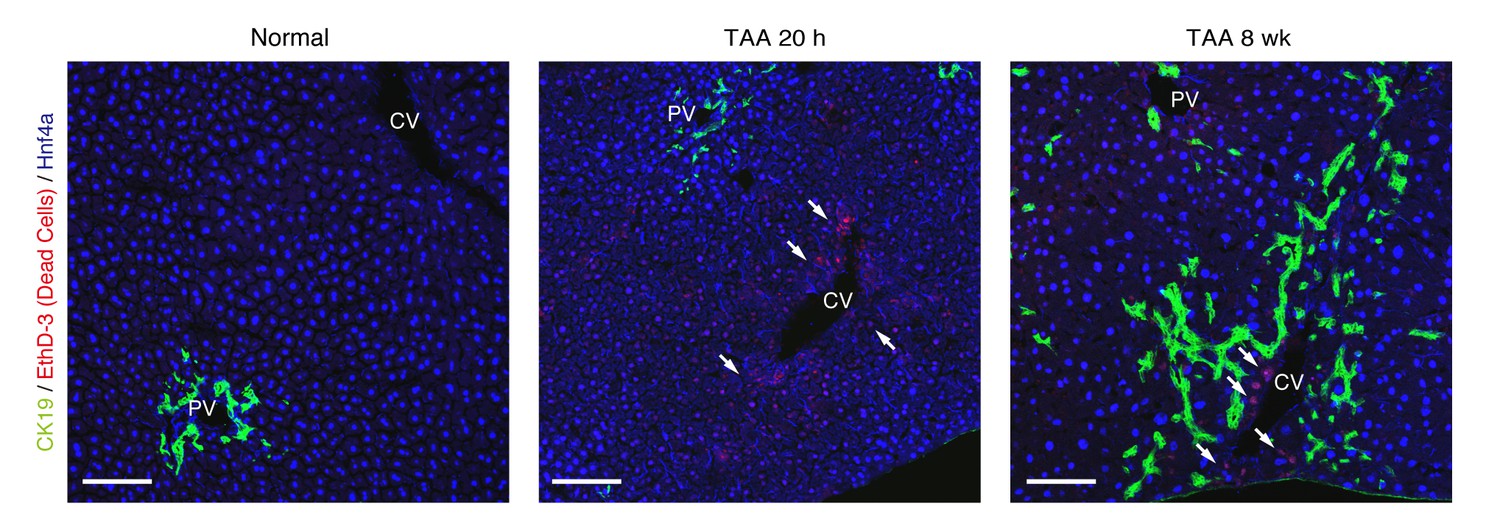
TAA causes death of hepatocytes around CV, but not death of BECs.
Cell death of BECs was analyzed using a cell-death detection method by in vivo administration of EthD-3. After staining with EthD-3 in vivo, liver tissue sections were prepared and immunostaining was performed with anti-CK19 antibody and anti-Hnf4a antibody. White arrows indicate dead cells. All signals of EthD-3 were merged with Hnf4a. Scale bar represents 100 μm.
Author response image 1
Tables
Table 1
List of antibodies used in this study.
| Antibody | Company/Source | Host animal | Method | Dilution |
| Prominin1/CD133 (APC-conjugated) | Biolegend (San Diego, CA) | Rat | FACS | 1:100 |
| Prominin1/CD133 (purified) | eBioscience (Santa Clara, CA) | Rat | IF | 1:100 |
| EpCAM (FITC-conjugated) | (Okabe et al., 2009) | Rat | FACS | 1:200 |
| EpCAM (purified) | BD Pharmingen (Franklin Lakes, NJ) | Rat | IF | 1:200 |
| CD45 (APC-conjugated or APC-Cy7-conjugated) | Biolegend | Rat | FACS | 1:200 |
| MIC1-1C3 | STEMGENT (Lexington, MA) | Rat | FACS | 1:200 |
| Spp1 | R&D systems (Minneapolis, MN) | Goat | IF | 1:200 |
| Cytokeratin 19 | (Tanimizu et al., 2003) | Rabbit | IF | 1:200 |
| Ki67 | eBioscience | Rat | IF | 1:200 |
| LacZ | Abcam (United Kingdom) | Chicken | IF | 1:200 |
| BrdU | Abcam | Rat | IF | 1:200 |
| Hnf4a | Santa Cruz (Dallas, TX) | Goat | IF | 1:200 |
Download links
A two-part list of links to download the article, or parts of the article, in various formats.
Downloads (link to download the article as PDF)
Open citations (links to open the citations from this article in various online reference manager services)
Cite this article (links to download the citations from this article in formats compatible with various reference manager tools)
Heterogeneity and stochastic growth regulation of biliary epithelial cells dictate dynamic epithelial tissue remodeling
eLife 5:e15034.
https://doi.org/10.7554/eLife.15034


