Instructed knowledge shapes feedback-driven aversive learning in striatum and orbitofrontal cortex, but not the amygdala
- National Institutes of Health, United States
- New York University, United States
- Columbia University, United States
- Peking University, China
- Princeton University, United States
- Nathan Kline Institute, United States
Figures
Figure 1
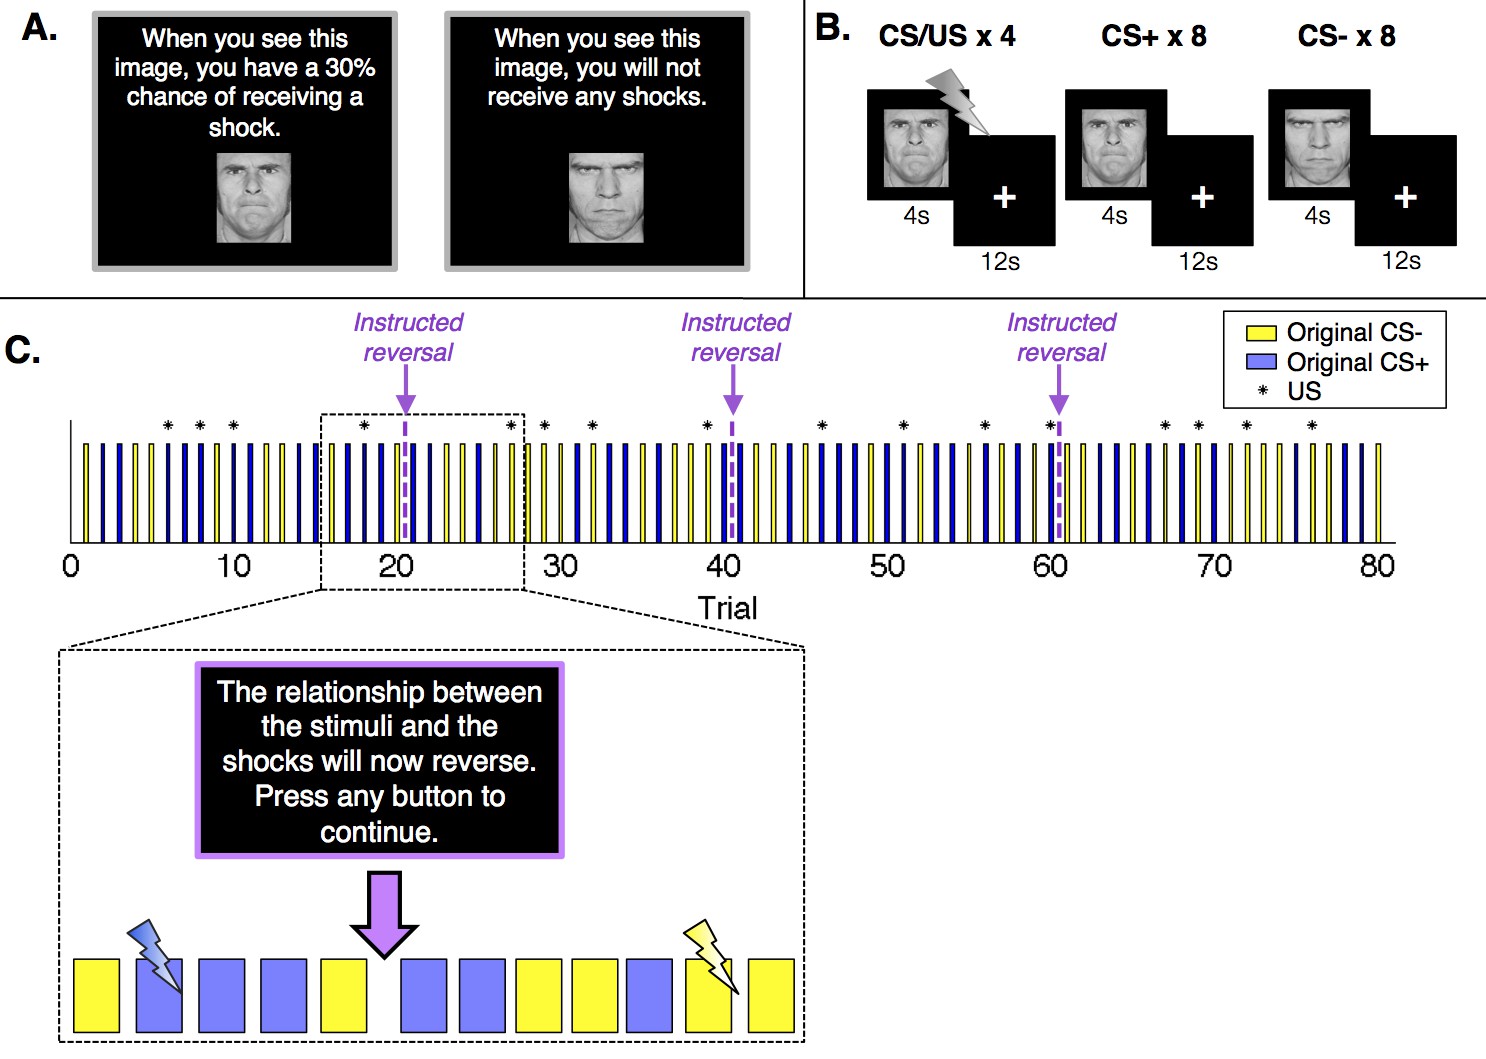
Experimental design.
(A) Prior to the conditioning phase of the experiment, participants in the Instructed Group saw each image and were informed about initial probabilities. Participants in the Uninstructed Group also saw the images prior to the experiment, but were not told about contingencies. (B) Participants in both groups underwent a Pavlovian fear conditioning task with serial reversals. There were three reversals across the duration of the task, leading to four continuous blocks of twenty trials. In each block, one image (the conditioned stimulus, or CS+) was paired with a shock (the unconditioned stimulus, or US) 30% of the time, leading to 4 reinforced trials and 8 unreinforced trials, whereas a second image (the CS-) was never paired with a shock. Images were presented for 4 s, followed by a 12-second inter-stimulus interval. (C) Upon each reversal, the Instructed Group was informed that contingencies had reversed. Button presses were included to ensure participants were paying attention to the instructions but had no effect on the task itself or task timing. Instructions were always immediately followed by at least two unreinforced presentations of each CS before the new CS+ was paired with a shock. The figure presents one of two pseudorandom trial orders used during the experiment (see Materials and methods).
Figure 2
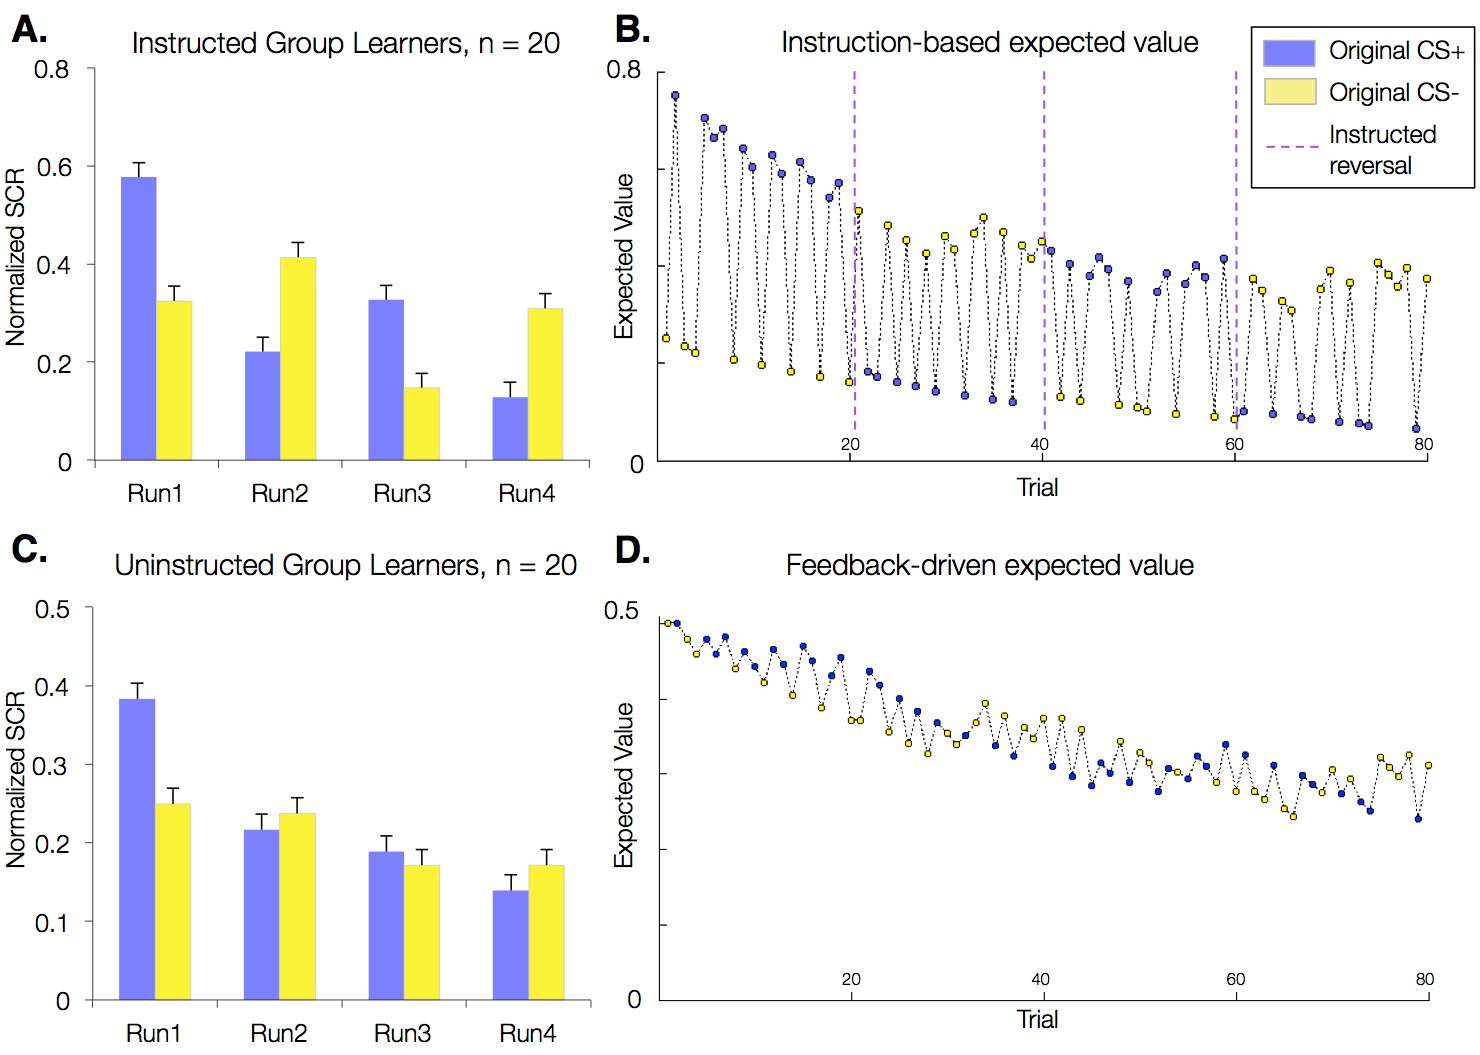
Effects of instructions on skin conductance responses (SCR) and aversive learning.
Mean normalized skin conductance responses (SCRs) as a function of group and condition. Both groups showed significant reversals of SCR responses throughout the task (p<0.001; Table 1), and effects were larger in the Instructed Group (see Table 1). Error bars reflect within-subjects error. (A) Mean SCR in the Instructed Group as a function of original contingencies. Runs are defined relative to the delivery of instructions. (B) Dynamics of expected value based on fits of our modified Rescorla-Wagner model, fit to SCR in the Instructed Group. Fitted model parameters were consistent with SCR reversing almost entirely in response to instructions (ρ = 0.943). This timecourse was used in fMRI analyses to isolate regions involved in instruction-based learning. (C) Mean SCR in the Uninstructed Group as a function of original contingencies. A new run is defined when the previous CS- is paired with a shock. (D) Dynamics of expected value based on the model fit to SCR from the Uninstructed Group. This timecourse was used in fMRI analyses to isolate regions involved in feedback-driven learning in both groups.
Figure 3 with 3 supplements
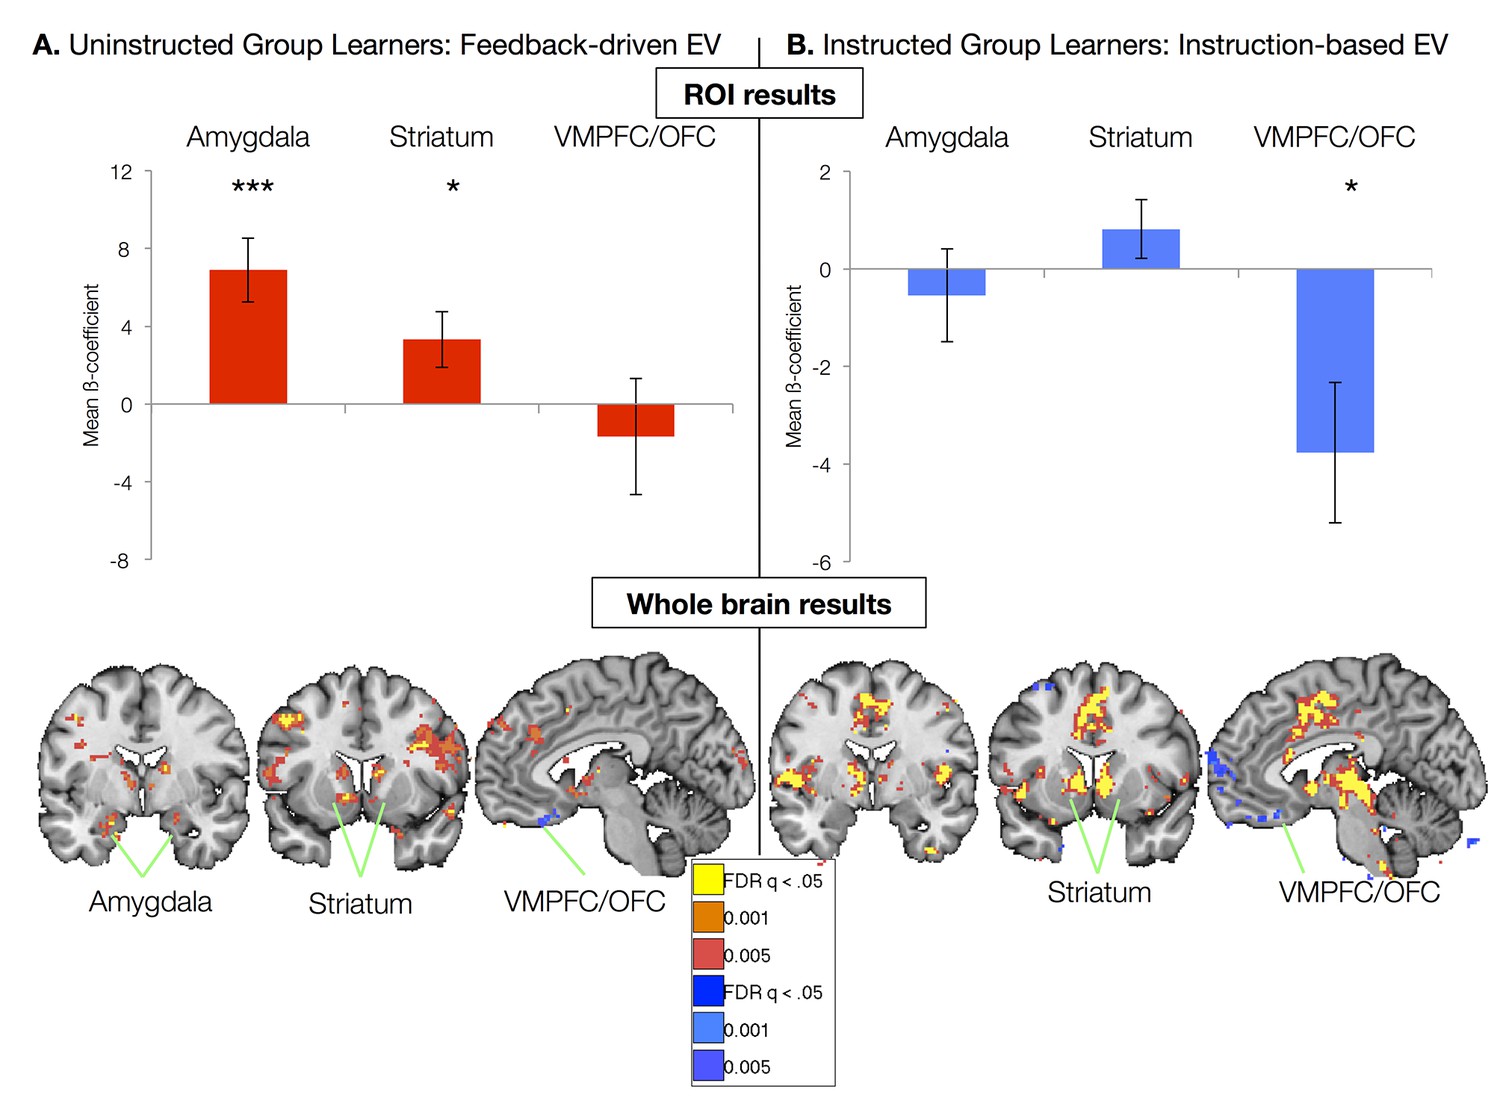
Neural correlates of expected value.
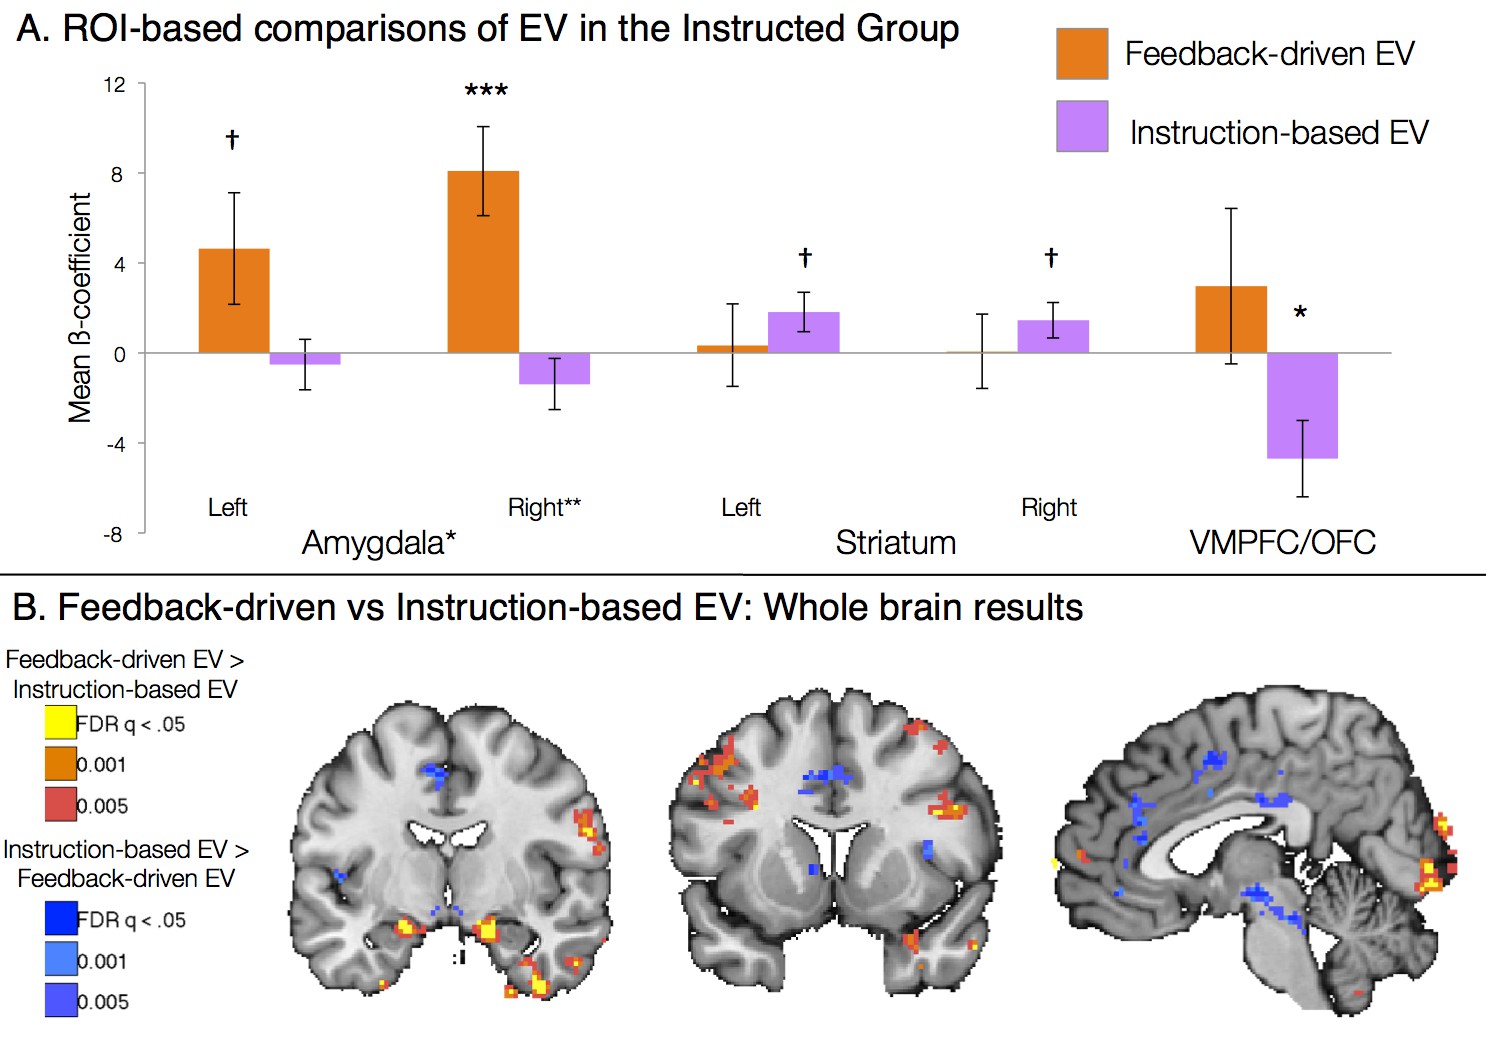
(A) Neural correlates of feedback-driven expected value (EV) were isolated by examining correlations between the timecourse depicted in Figure 2D and brain activation in response to cue onset in Uninstructed Group learners (n = 20). Top: ROI-based analyses (see Figure 3—figure supplement 3) revealed significant correlations with feedback-driven EV in the amydala and striatum. Error bars reflect standard error of the mean; ***p<0.001; *p<0.05. Bottom: Voxel-wise FDR-corrected analyses confirmed ROI-based results and revealed additional correlations in the VMPFC/OFC, as well as other regions (see Figure 3—figure supplement 1, Figure 3—figure supplement 1—source data 1, 2). (B) Neural correlates of instruction-based EV were isolated by examining correlations between the timecourse depicted in Figure 2B and brain activation in response to cue onset in Instructed Group learners (n = 20). Top: ROI-based analyses revealed a significant negative correlation with instruction-based EV in the VMPFC/OFC. Bottom: Voxel-wise analyses confirmed these results and revealed strong positive correlations in the bilateral striatum, as well as the dACC, insula, and other regions (see Figure 3—figure supplement 2 and Figure 3—figure supplement 2—source data 1 and 2). We did not observe any correlations between amygdala activation and instruction-based EV.
Figure 3—figure supplement 1
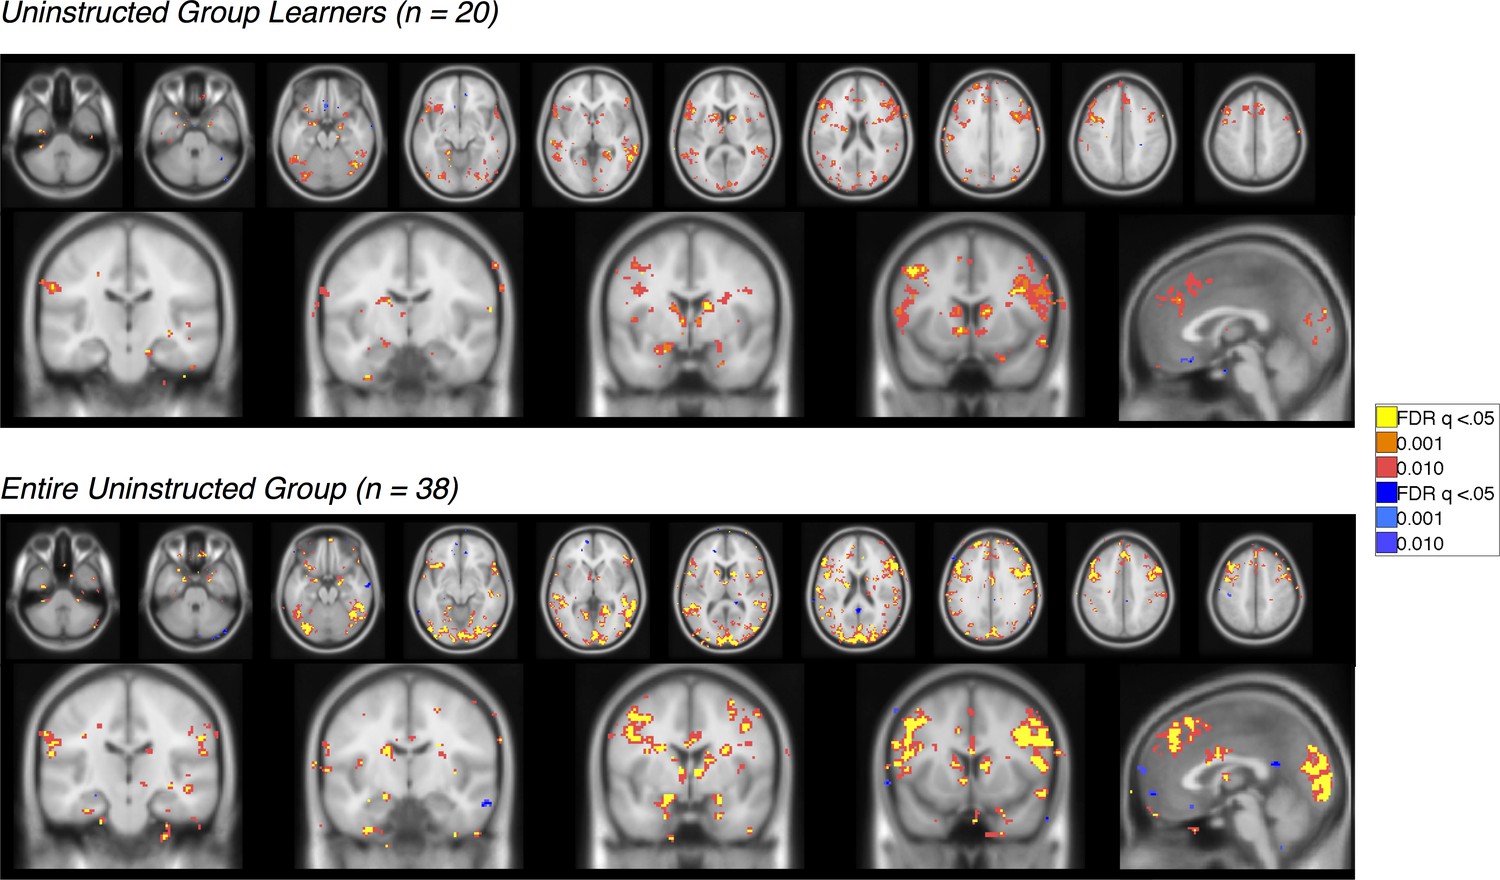
Feedback-driven EV in the Uninstructed Group.
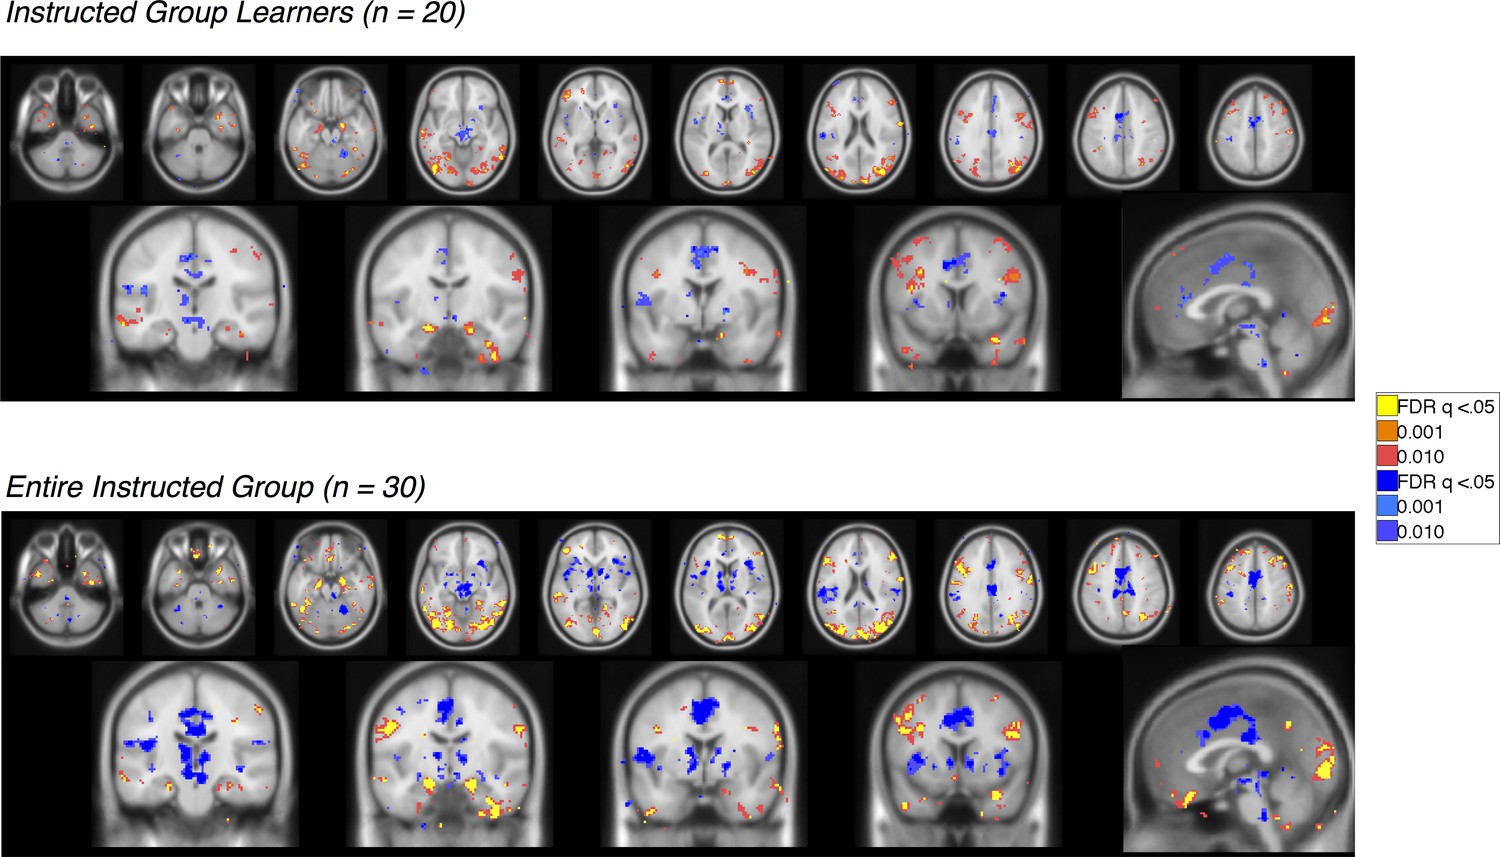
Voxelwise FDR-corrected results of neural correlates of feedback-driven EV in Uninstructed Group participants, based on the modified learning model fit to learners in the Uninstructed Group (across-subjects fits, see Materials and methods). Warm colors reflect positive correlations with EV, which was coded such that positive EV denotes expected shock. Cool colors reflect negative correlations. Top: Results in learners, or those individuals who showed differential SCR prior to the first reversal (n = 20). Bottom: Results across the entire Uninstructed Group (n = 38). For complete results in tabular format, please see 'Figure 3—figure supplement 1—source data 1' and 'Figure 3—figure supplement 1—source data 2'.
-
Figure 3—figure supplement 1—source data 1
Neural correlates of feedback-driven expected value (EV): Uninstructed Group Learners (n = 20).
This table presents brain regions that correlate with feedback-driven EV (derived from the across-subjects model fit to Uninstructed Group learners) within Uninstructed Group learners (n = 20). Results are whole-brain FDR-corrected (q < 0.05) and clusters are defined based on contiguity with voxels at uncorrected p<0.001 and p<0.01.
- https://doi.org/10.7554/eLife.15192.009
-
Figure 3—figure supplement 1—source data 2
Neural correlates of feedback-driven EV: Entire Uninstructed Group (n = 38).
This table presents brain regions that correlate with feedback-driven EV (derived from the across-subjects model fit to Uninstructed Group learners) within the entire Uninstructed Group (n = 38). Results are whole-brain FDR-corrected (q < 0.05) and clusters are defined based on contiguity with voxels at uncorrected p<0.001 and p<0.01.
- https://doi.org/10.7554/eLife.15192.010
Figure 3—figure supplement 2
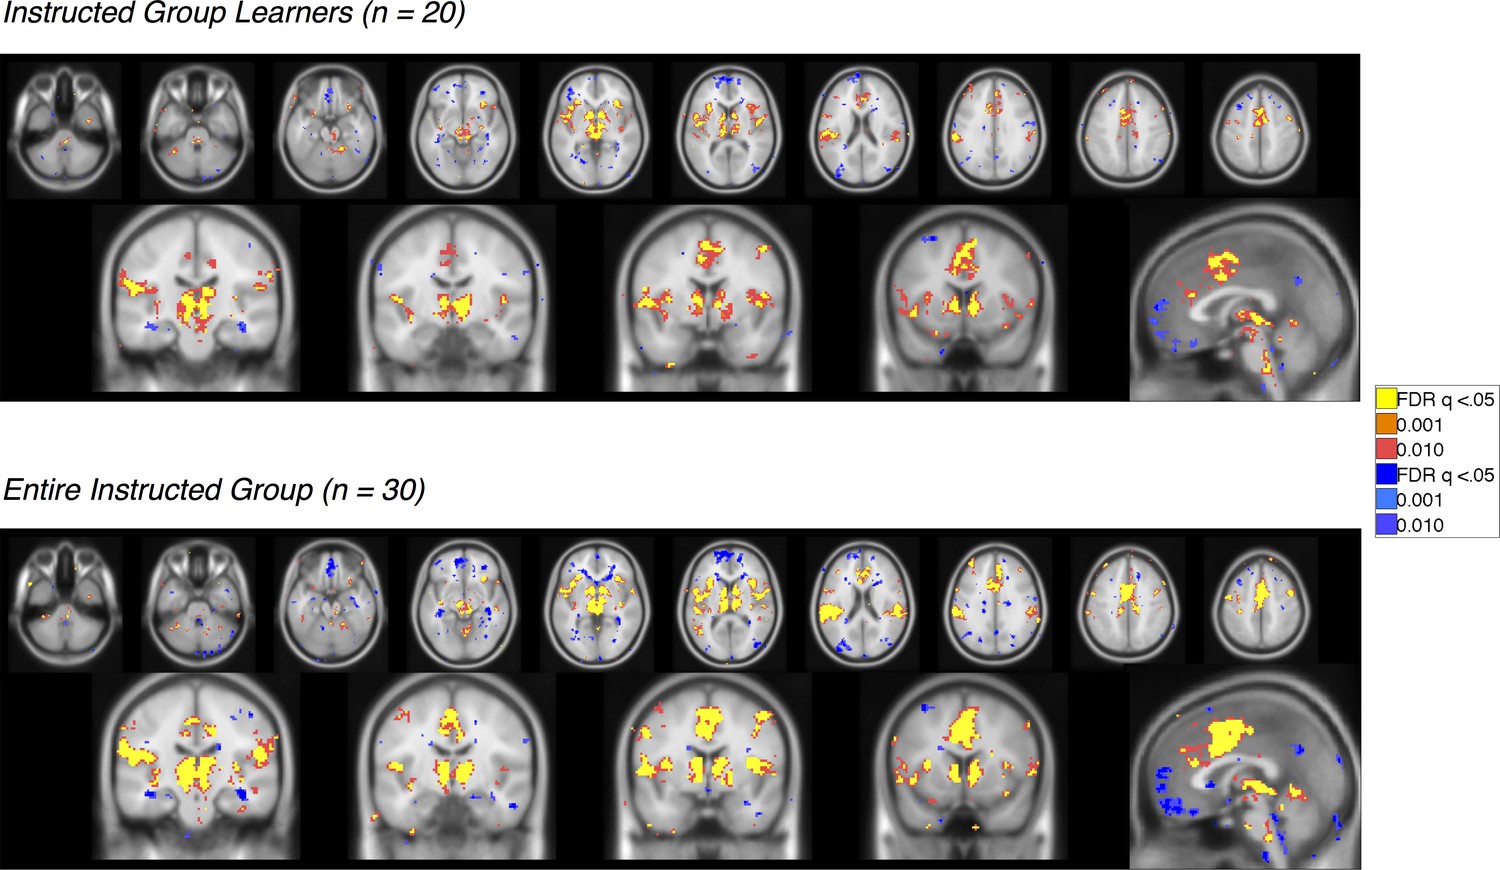
Instruction-based EV in the Instructed Group.
Voxelwise FDR-corrected results of neural correlates of instruction-based EV in Instructed Group participants, based on the modified learning model fit to learners in the Instructed Group (across-subjects fits, see Materials and methods). Warm colors reflect positive correlations with EV, which was coded such that positive EV denotes expected shock. Cool colors reflect negative correlations. Top: Results in learners, or those individuals who showed differential SCR prior to the first reversal (n = 20). Bottom: Results across the entire Instructed Group (n = 30). For complete results in tabular format, please see 'Figure 3—figure supplement 2—source data 1' and 'Figure 3—figure supplement 2—source data 2'.
-
Figure 3—figure supplement 2—source data 1
Neural correlates of instruction-based EV: Instructed Group Learners (n = 20).
This table presents brain regions that correlate with instruction-based EV (derived from the across-subjects model fit to Instructed Group learners) within Instructed Group learners (n = 20). Results are whole-brain FDR-corrected (q<0.05) and clusters are defined based on contiguity with voxels at uncorrected p<0.001 and p<0.01.
- https://doi.org/10.7554/eLife.15192.012
-
Figure 3—figure supplement 2—source data 2
Neural correlates of instruction-based EV: Entire Instructed Group (n = 30).
This table presents brain regions that correlate with instruction-based EV (derived from the across-subjects model fit to Instructed Group learners) within the entire Instructed Group (n = 30). Results are whole-brain FDR-corrected (q<0.05) and clusters are defined based on contiguity with voxels at uncorrected p<0.001 and p<0.01.
- https://doi.org/10.7554/eLife.15192.013
Figure 3—figure supplement 3

Regions of interest.
Regions of interest for ROI-based FMRI analyses. See Materials and methods for details of ROI selection.
Figure 4 with 1 supplement
Dissociable effects of instructed and feedback-driven learning in the Instructed Group.
(A) ROI-based effects of feedback-driven and instruction based EV signaling within Instructed Group learners from the model including both signals (see Materials and Methods). Direct model comparisons within Instructed Group learners revealed a significant effect of Model in the amygdala (p<0.05). VMPFC differences were marginal within learners (p = 0.11) and were significant when all Instructed Group participants were included in analyses (p<0.05). Error bars reflect standard error of the mean. ***p<0.001; *p<0.05; †p<0.10. (B) Voxelwise direct comparison between feedback-driven and instruction based EV signaling within the Instructed Group. Regions in warm colors, including bilateral amygdala (left), showed preferential correlations with feedback-driven EV. Regions in cool colors, including left caudate (middle), dorsal anterior cingulate and medial prefrontal cortex (right), showed higher correlations with instruction-based EV. Additional regions that showed significant differences as a function of model are presented in Figure 4—figure supplement 1, Figure 4—figure supplement 1—source data 1 and 2.
Figure 4—figure supplement 1
Feedback-driven vs instruction-based EV in the Instructed Group.
Voxelwise FDR-corrected results of direct comparison between feedback-driven and instruction based EV signaling within the Instructed Group. Feedback-driven EV is based on the model fit to the Uninstructed Group learners, while instruction-based EV is based on fit to the Instructed Group learners. Regions in warm colors showed preferential correlations with feedback-driven EV, while regions in cool colors showed higher correlations with instruction-based EV. Top: Results in learners, or those individuals who showed differential SCR prior to the first reversal (n = 20). Bottom: Results across the entire Instructed Group (n = 30). For complete results in tabular format, please see 'Figure 4—figure supplement 1—source data 1' and 'Figure 4—figure supplement 1—source data 2.'
-
Figure 4—figure supplement 1—source data 1
Feedback-driven vs instruction-based EV: Instructed Group Learners (n = 20).
This table presents brain regions that show preferential correlations with either feedback-driven or instruction-based EV, based on direct contrasts between the two signals. Analyses are restricted to Instructed Group learners (n = 20). Results are whole-brain FDR-corrected (q < 0.05) and clusters are defined based on contiguity with voxels at uncorrected p<0.001 and p<0.01.
- https://doi.org/10.7554/eLife.15192.017
-
Figure 4—figure supplement 1—source data 2
Neural correlates of instruction-based EV: Entire Instructed Group (n = 30).
This table presents brain regions that show preferential correlations with either feedback-driven or instruction-based EV, based on direct contrasts between the two signals. Analyses include the entire Instructed Group (n = 30). Results are whole-brain FDR-corrected (q < 0.05) and clusters are defined based on contiguity with voxels at uncorrected p<0.001 and p<0.01.
- https://doi.org/10.7554/eLife.15192.018
Figure 5 with 3 supplements
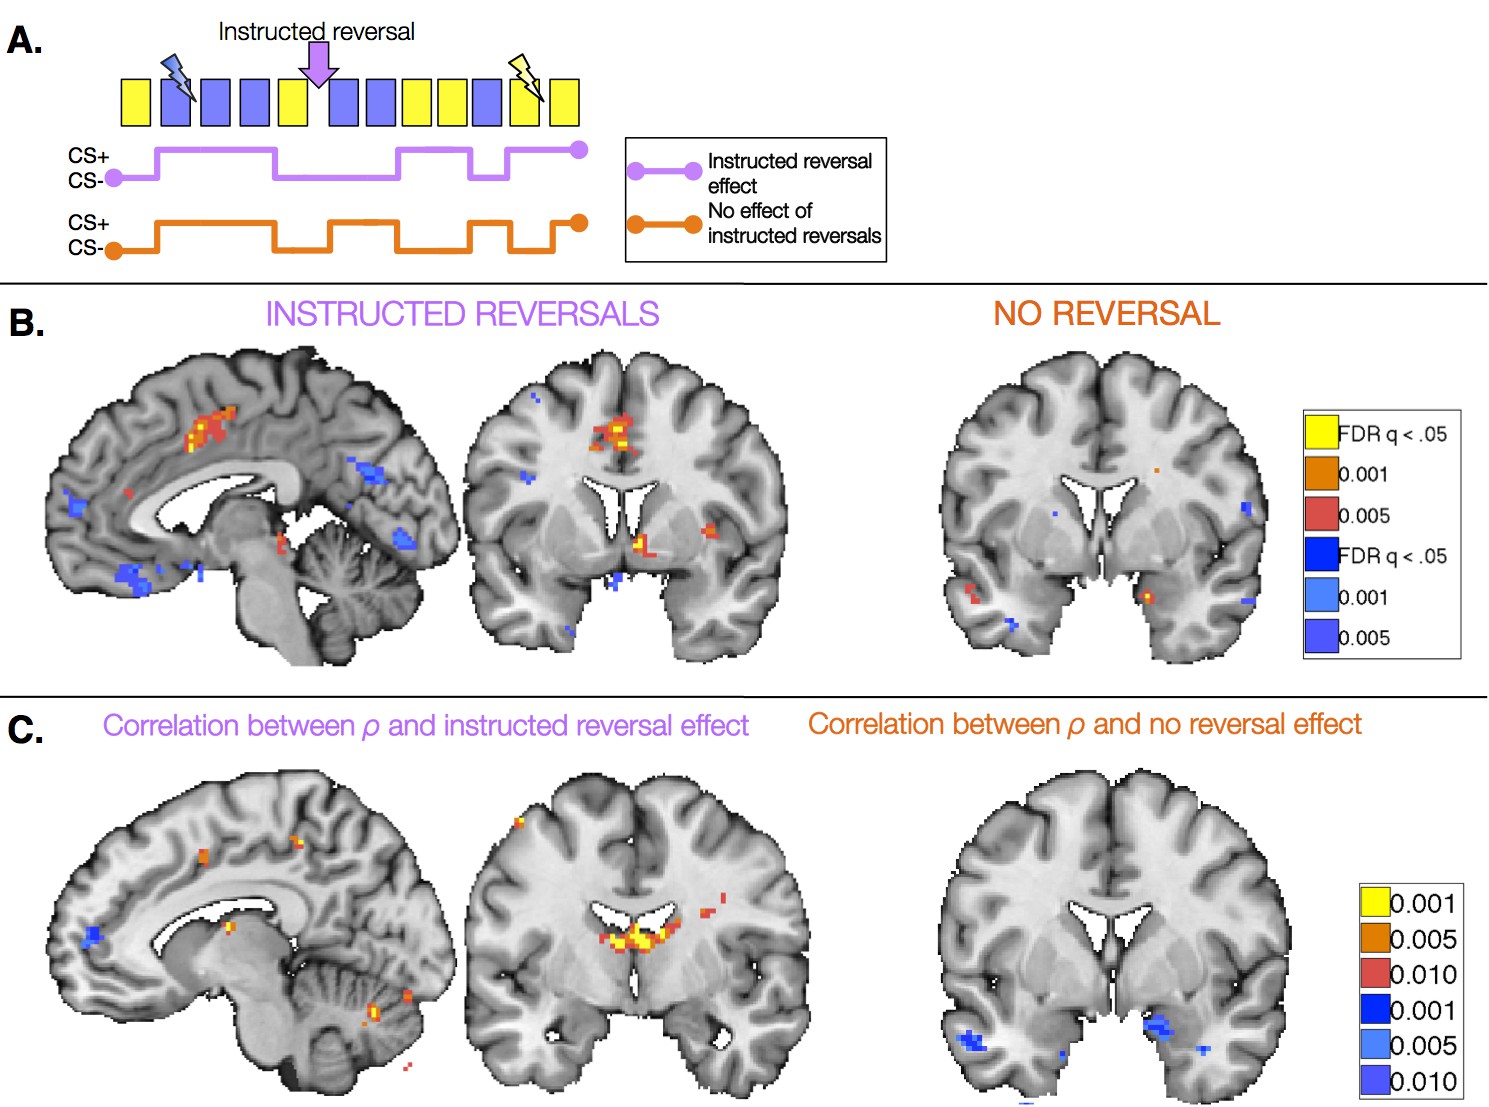
Task-based effects of instructed reversals and relationship with modeled behavior.
(A) We examined responses in the Instructed Group surrounding the three instructed reversals to dissociate regions that are sensitive to instructions from those that learn from feedback and seem to be insensitive to instructions. Regions that are sensitive to instructions should show differential responses that reverse immediately upon instruction. The lavender timecourse depicts this pattern with greater activation on CS+ trials (blue) than CS- trials (yellow) prior to instruction, and the opposite pattern after instructions are delivered. Regions that update from aversive feedback and show no effect of instructed reversals would follow the orange timecourse, with greater activation to the previous CS+ than CS- both pre- and post-instruction. This feedback-driven pattern does not update until the new CS+ has been reinforced. (B) A number of regions showed differential responses that reversed upon instruction, including the right VS and VMPFC/OFC (left; see also Figure 5—figure supplement 1, Figure 5—figure supplement 1—source data 1 and 2). The VS showed greater activation to the current CS+ relative to the current CS-, whereas the VMPFC/OFC showed deactivation to the CS+. The right amygdala showed differential activation that did not reverse with instructions (right). Additional regions that did not reverse with instructions are presented in Figure 5—figure supplement 2, Figure 5—figure supplement 2—source data 1 and 2. (C) We conducted brain-behavior correlations to explore the relationship between neural activity in the period surrounding instructions and the magnitude of each individual’s behavioral response to instructions. We tested for correlations between each individual’s ρ parameter (based on within-subjects fits) and the magnitude of the reversal effect using an exploratory threshold of p<0.001, uncorrected. We observed significant correlations between ρ and the magnitude of instructed reversals in dACC (left) and the bilateral caudate tail and thalamus (right), as well as bilateral DLPFC (see Figure 5—figure supplement 3), suggesting that those individuals who showed stronger reversals in SCR also showed stronger reversals in these regions. In addition, we found that the individuals who showed the least evidence for updating with instructions also showed the largest non-reversing differential responses in the right amygdala (right). Full results of brain-behavior correlations are reported in Figure 5—figure supplement 3 and Figure 5—figure supplement 3—source data 1.
Figure 5—figure supplement 1
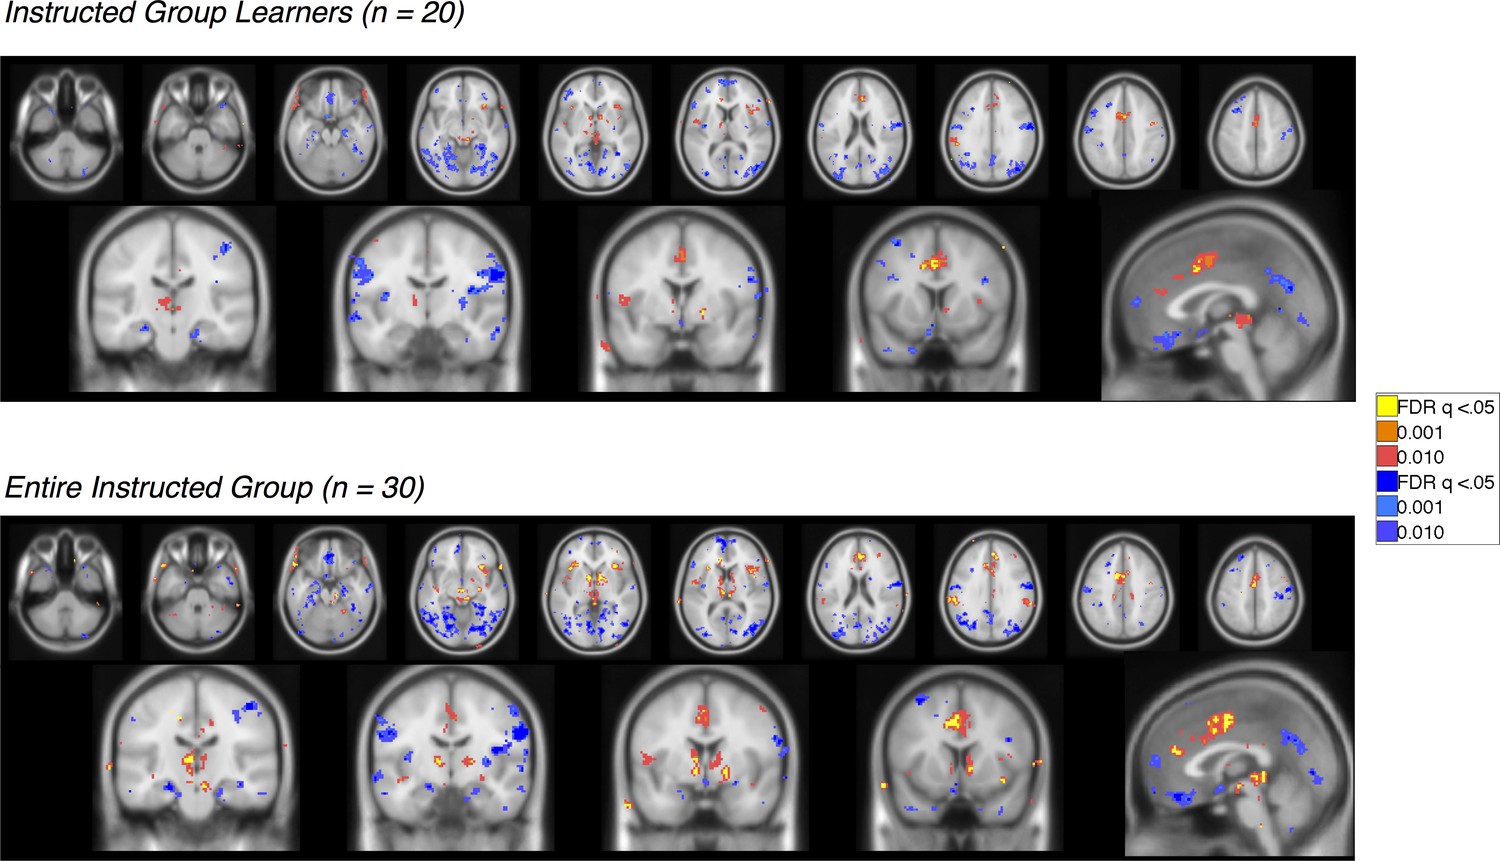
Immediate reversal with instructions (CS [previous CS+ > previous CS-] x Phase [Pre - Post] interaction) Voxelwise FDR-corrected results of regions that show immediate reversals with instructions in the Instructed Group, based on the window surrounding the delivery of instructions (see Materials and Methods).
Regions in warm colors showed greater activation to the current CS+ relative to the current CS-, while regions in cool colors show relatively greater activation to the CS- (or deactivation to the CS+). Top: Results in learners, or those individuals who showed differential SCR prior to the first reversal (n = 20). Bottom: Results across the entire Instructed Group (n = 30). For complete results in tabular format, please see 'Figure 5—figure supplement 1—source data 1' and 'Figure 5—figure supplement 1—source data 2.'
-
Figure 5—figure supplement 1—source data 1
Immediate reversal with instructions (CS x Phase interaction): Instructed Group Learners (n = 20).
This table presents brain regions whose differential responses (CS+ vs CS-) reversed immediately upon instruction. Regions that were positive in this contrast show greater activation with the current CS+ relative to the current CS-, whereas those that are negative show deactivation to the CS+ or increases with the CS-. Analyses are restricted to Instructed Group learners (n = 20). Results are whole-brain FDR-corrected (q<0.05) and clusters are defined based on contiguity with voxels at uncorrected p<0.001 and p<0.01.
- https://doi.org/10.7554/eLife.15192.021
-
Figure 5—figure supplement 1—source data 2
Immediate reversal with instructions (CS x Phase interaction): Entire Instructed Group (n = 30).
This table presents brain regions whose differential responses (CS+ vs CS-) reversed immediately upon instruction. Analyses include the entire Instructed Group (n = 30). Results are whole-brain FDR-corrected (q<0.05) and clusters are defined based on contiguity with voxels at uncorrected p<0.001 and p<0.01.
- https://doi.org/10.7554/eLife.15192.022
Figure 5—figure supplement 2
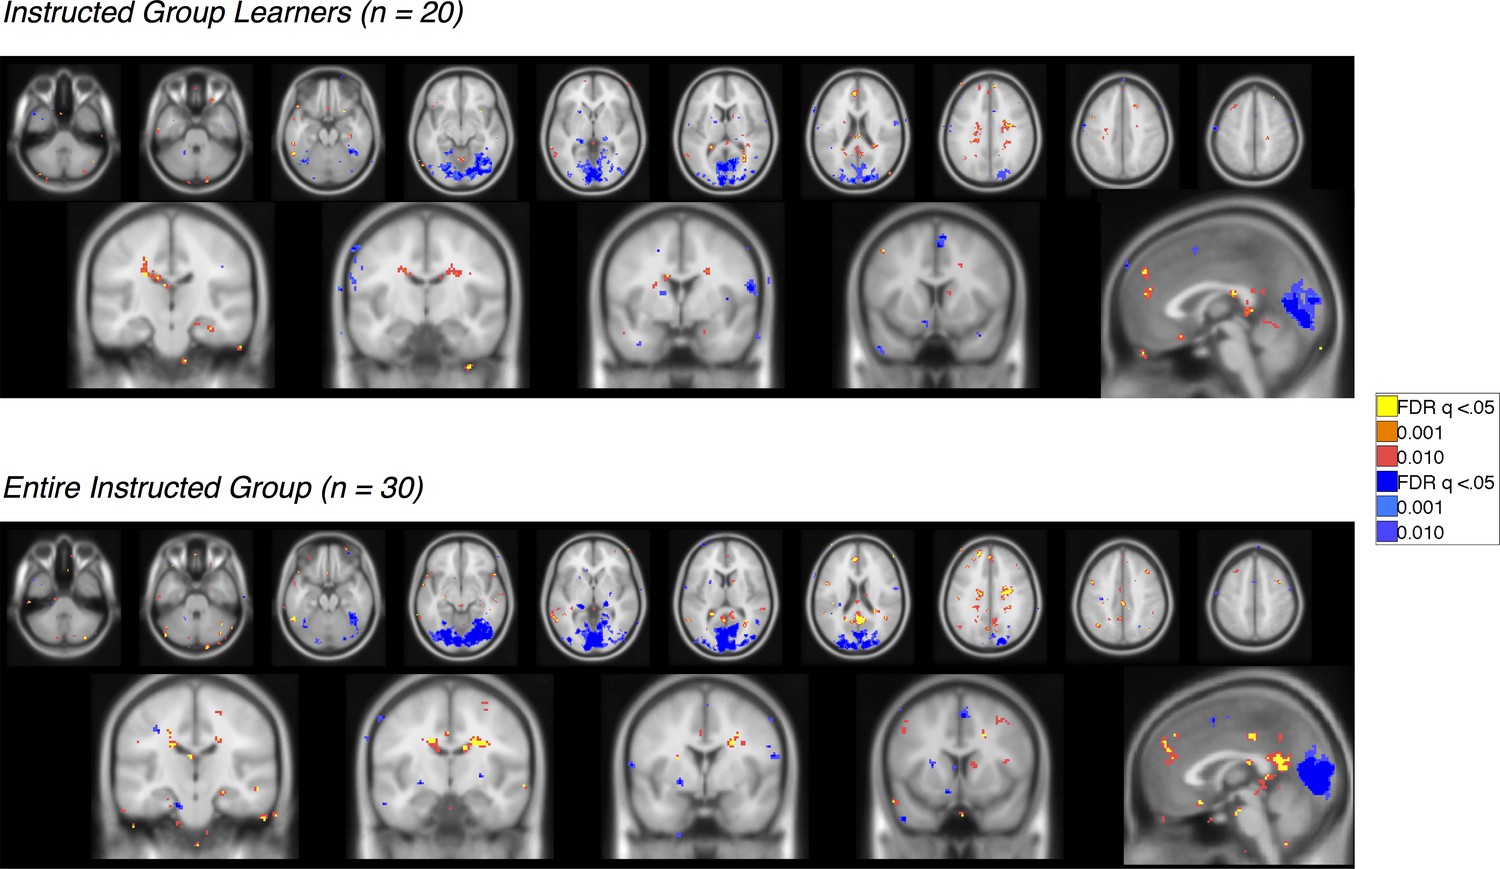
No reversal with instructions (main effect of CS without interaction; i.e.
[previous CS+ > previous CS-] ∪ [new CS- > new CS+]) Voxelwise FDR-corrected results of regions that show no evidence for reversal when instructions are delivered, based on continued differential responses pre- and post-instruction (see Materials and Methods). Regions in warm colors showed greater activation to the pre-instruction CS+ relative to the CS- both pre- and post-instruction, while regions in cool colors show relatively greater activation to the CS- (or deactivation to the CS+). Top: Results in learners, or those individuals who showed differential SCR prior to the first reversal (n = 20). Bottom: Results across the entire Instructed Group (n = 30). For complete results in tabular format, please see 'Figure 5—figure supplement 2—source data 1' and 'Figure 5—figure supplement 2—source data 2.'
-
Figure 5—figure supplement 2—source data 1
No reversal with instructions (main effect of CS without interaction): Instructed Group Learners (n = 20).
This table presents brain regions whose differential responses (CS+ vs CS-) did not reverse upon instruction in Instructed Group learners (n = 20). Regions that were positive in this contrast show greater activation to the pre-instruction CS+ relative to the CS- both pre- and post-instruction, whereas those that are negative show deactivation to the CS+ or increases with the CS-. Results are whole-brain FDR-corrected (q < 0.05) and clusters are defined based on contiguity with voxels at uncorrected p<0.001 and p<0.01.
- https://doi.org/10.7554/eLife.15192.024
-
Figure 5—figure supplement 2—source data 2
No reversal with instructions (main effect of CS without interaction): Entire Instructed Group (n = 30).
This table presents brain regions whose differential responses (CS+ vs CS-) did not reverse upon instruction in the entire Instructed Group (n = 30). Results are whole-brain FDR-corrected (q < 0.05) and clusters are defined based on contiguity with voxels at uncorrected p<0.001 and p<0.01.
- https://doi.org/10.7554/eLife.15192.025
Figure 5—figure supplement 3
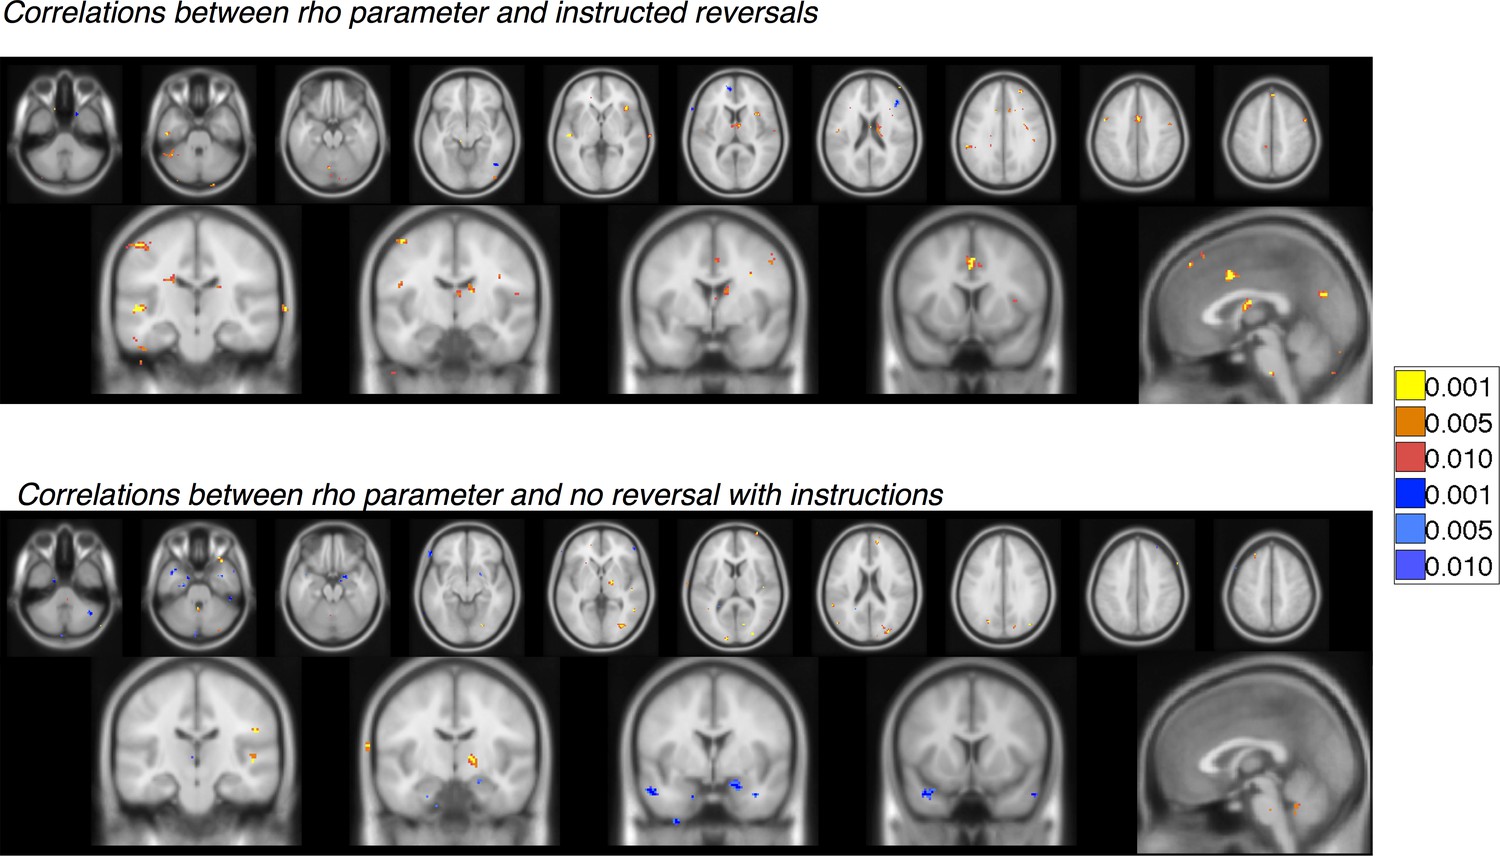
Correlations with instructed reversal (ρ) parameters.
Voxelwise FDR-corrected results of brain-behavior correlations that tested for correlations between each individual’s ρ parameter (based on within-subjects fits) and the magnitude of the reversal effect or absence of reversals using an exploratory threshold of p<0.001, uncorrected. Regions in warm colors show positive correlations between the magnitude of the instructed reversal parameter and the strength of reversal (Top) or sustained differential response (Bottom) in the region, while regions in cool colors show negative correlations. We focused on Instructed Group learners for these analyses. Top: Correlation between the instructed reversal parameter and immediate reversals with instructions (CS x Phase interactions). Bottom: Correlation between the instructed reversal parameter and the absence of instructed reversal (main effect of CS without reversal). For complete results in tabular format, please see 'Figure 5—figure supplement 3—source data 1' and 'Figure 5—figure supplement 3—source data 2.'
-
Figure 5—figure supplement 3—source data 1
Correlation between instructed reversal parameter (ρ) and instructed reversal effects: Instructed Group Learners (n = 20).
This table presents brain regions in which the ρ parameter correlated positively (warm) or negatively (cool) with the magnitude of the CS x Phase interaction, which indicates differential responses (CS+ vs CS-) that reverse upon instruction in Instructed Group learners (n = 20). Results are whole-brain FDR-corrected (q < 0.05) and clusters are defined based on contiguity with voxels at uncorrected p<0.001 and p<0.01.
- https://doi.org/10.7554/eLife.15192.027
-
Figure 5—figure supplement 3—source data 2
Correlation between instructed reversal parameter (ρ) and continued response to previous CS+ vs CS- (no reversal effect): Instructed Group Learners (n = 20).
This table presents brain regions in which the ρ parameter correlated positively (warm) or negatively (cool) with the magnitude of the sustained differential response in Instructed Group learners (n = 20). Results are whole-brain FDR-corrected (q < 0.05) and clusters are defined based on contiguity with voxels at uncorrected p<0.001 and p<0.01.
- https://doi.org/10.7554/eLife.15192.028
Figure 6 with 1 supplement

Relationship between dorsolateral prefrontal cortex response to instructions and instructed reversal effects.
(A) The left dorsolateral prefrontal cortex (DLPFC) showed group differences across all trials, with greater activation in the Instructed Group than the Uninstructed Group. (B) We extracted the magnitude of the DLPFC response to instructions for each individual within the Instructed Group. C) The magnitude of the DLPFC response to instructions was correlated with the magnitude of instructed reversals in VMPFC/OFC (left) and dorsal putamen (right). High DLPFC responders showed larger reversals, with putamen activation to the new CS+ relative to the new CS-and VMPFC/OFC deactivation to the new CS+ relative to the new CS-. See also Figure Supplement 1 and Figure 6—figure supplement 1—source data 1.
Figure 6—figure supplement 1

Correlations with left dorsolateral prefrontal cortex response to instructions.
Voxelwise FDR-corrected results of brain-behavior correlations that tested for correlations between each Instructed individual’s DLPFC response to instructions (see Figure 6) and the magnitude of the reversal effect or absence of reversals using an exploratory threshold of p<0.001, uncorrected. Regions in warm colors show positive correlations between the magnitude of the DLPFC response and the strength of reversal, while regions in cool colors show negative correlations. We focused on Instructed Group learners for these analyses (n = 20). For complete results in tabular format, please see 'Figure 6—figure supplement 1—source data 1'.
-
Figure 6—figure supplement 1—source data 1
Correlation between dorsolateral prefrontal response to instructions and instructed reversal effect: Instructed Group Learners (n = 20).
This table presents brain regions in which the DLPFC response correlated positively (warm) or negatively (cool) with the magnitude of the CS x Phase interaction, which indicates differential responses (CS+ vs CS-) that reverse upon instruction in Instructed Group learners (n = 20). Results are whole-brain FDR-corrected (q < 0.05) and clusters are defined based on contiguity with voxels at uncorrected p<0.001 and p<0.01.
- https://doi.org/10.7554/eLife.15192.031
Tables
Table 1
Group differences in differential SCRa.
| Analysis | Model | Intercept | Stimulus (Original CS+ > Original CS-) | Reversal effect (Original contingencies vs. Reversed contingencies) | Stimulus x Reversal Interaction (Current CS+ > Current CS-) | Time |
|---|---|---|---|---|---|---|
| All participants (n = 68) | Within-subjects effects, controlling for group (first level) | ß = 0.22 | n.s. (p = 0.06) | n.s. (p = 0.445) | ß = 0.04 | ß = -.07 |
| t = 12.37 | t = 5.82 | t = 10.59 | ||||
| p <0.0001 | p<0.0001 | p<0.0001 | ||||
| Effect of group (second level) | n.s. (p = 0.11) | n.s. (p = 0.15) | n.s. (p = 1.0) | ß = 0.03 | n.s. (p = 0.09) | |
| t = 3.98 | ||||||
| p = 0.0002 | ||||||
| Learners only (n = 40) | Within-subjects effects, controlling for group (first level) | ß = 0.27 | ß = 0.01 | n.s. (p = 0.95) | ß = 0.06 | ß = -.08 |
| t = 11.62 | t = 2.79 | t = 6.5 | t = -11.18 | |||
| p<0.0001 | p = 0.0082 | p<0.0001 | p<0.0001 | |||
| Effect of group (second level) | n.s. (p = 0.13) | n.s. (p = 0.20) | n.s.(p = 0.35) | ß = 0.04 | ß = -.02 | |
| t = 3.67 | t = -2.53 | |||||
| p = 0.0007 | p = 0.0157 | |||||
| Instructed Group learners (n = 20) | Entire task | ß = 0.30 | n.s. (p = 0.30) | n.s. (p = 0.55) | ß = 0.10 | ß = -0.09 |
| t = 8.93 | t = 5.35 | t = -9.26 | ||||
| p<0.0001 | p<0.0001 | p<0.0001 | ||||
| Entire task, second half of each run | ß = 0.27 | ß = 0.02 | ß = 0.04 | ß = 0.12 | n.s. (p = 0.69) | |
| t = 7.82 | t = 2.15 | t = 4.18 | t = 6.19 | |||
| p<0.0001 | p = 0.0314 | p<0.0001 | p<0.0001 | |||
| Trials following the first reversal | ß = 0.28 | n.s. (p = 0.65) | ß = -0.16 | ß = 0.09 | ß = -0.07 | |
| t = 6.89 | t = -2.36 | t = 4.19 | t = -5.05 | |||
| p<0.0001 | p = 0.0184 | p<0.0001 | p<0.0001 | |||
| Trials following the first reversal, second half of each run | ß = 0.22 | n.s.(p = 0.81) | n.s. (p = 0.30) | ß = 0.09 | n.s. (p = 0.09) | |
| t = 5.67 | t = 4.49 | |||||
| p<0.0001 | p<0.0001 | |||||
| Uninstructed Group learners (n=20) | Entire task | ß = 0.23 | ß = 0.01 | n.s. (p = 0.54) | ß = 0.03 | ß = -.06 |
| t = 7.30 | t = 2.09 | t = 4.58 | t = -6.10 | |||
| p<0.0001 | p = 0.0368 | p<0.0001 | p<0.0001 | |||
| Entire task, second half of each run | ß = 0.22 | ß = 0.02 | ß = 0.02 | ß = 0.04 | n.s.(p = 0.678) | |
| t = 6.86 | t = 3.18 | t = 2.44 | t = 5.45 | |||
| p<0.0001 | p = 0.0015 | p = 0.0149 | p<0.0001 | |||
| Trials following the first reversal | ß = 0.21 | n.s. (p = 0.58) | n.s. (p = 0.49) | ß = 0.01 | ß = -.04 | |
| t = 5.28 | t = 1.67 | t = -2.49 | ||||
| p<0.0001 | p = 0.0967 | p = 0.0127 | ||||
| Trials following the first reversal, second half of each run | ß = 0.19 | n.s. (p = 0.65) | n.s. (p = 0.21) | ß = 0.02 | ß = 0.03 | |
| t = 5.83 | t = 2.04 | t = 2.88 | ||||
| p<0.0001 | p = 0.0413 | p = 0.004 |
-
aThis table presents results of linear mixed models that included normalized skin conductance response (SCR) as a dependent measure. In the Instructed Group, contingencies and reversals are coded relative to instructed reversal. In the Uninstructed Group, contingencies and reversals are coded relative to reinforcement (i.e. reversals occur when the previous CS- is paired with a shock). Within groups, we analyzed SCRs across the entire task as well as following the first reversal (without the acquisition phase). We also examined responses within the second half of each run, as well as across all trials (including trials that immediately followed reversals).
Table 2
Quantitative model of instructed learning: Rescorla-Wagner modulated with instruction parameter (ρ).
| Group | Analysis type | α | ρ | Deviance |
|---|---|---|---|---|
| Instructed Group learners (n = 20) | Across-subjects analysis | 0.061 | 0.943 | 60.83 |
| Within-subjects analysis | M = 0.07, SD = 0.09 | M = 0.69, SD = 0.32 | M = 2.73, SD = 0.88 | |
| Uninstructed Group learners (n = 20) | Across-subjects analysis | 0.042 | 0 | 40.86 |
| Within-subjects analysis | M = 0.11, SD = 0.22 | M = 0.10, SD = 0.25 | M = 1.98, SD = 0.93 |
Download links
A two-part list of links to download the article, or parts of the article, in various formats.
Downloads (link to download the article as PDF)
Open citations (links to open the citations from this article in various online reference manager services)
Cite this article (links to download the citations from this article in formats compatible with various reference manager tools)
Instructed knowledge shapes feedback-driven aversive learning in striatum and orbitofrontal cortex, but not the amygdala
eLife 5:e15192.
https://doi.org/10.7554/eLife.15192


