A bend, flip and trap mechanism for transposon integration
- University of Edinburgh, United Kingdom
- EaStCHEM School of Chemistry, United Kingdom
Figures
Figure 1
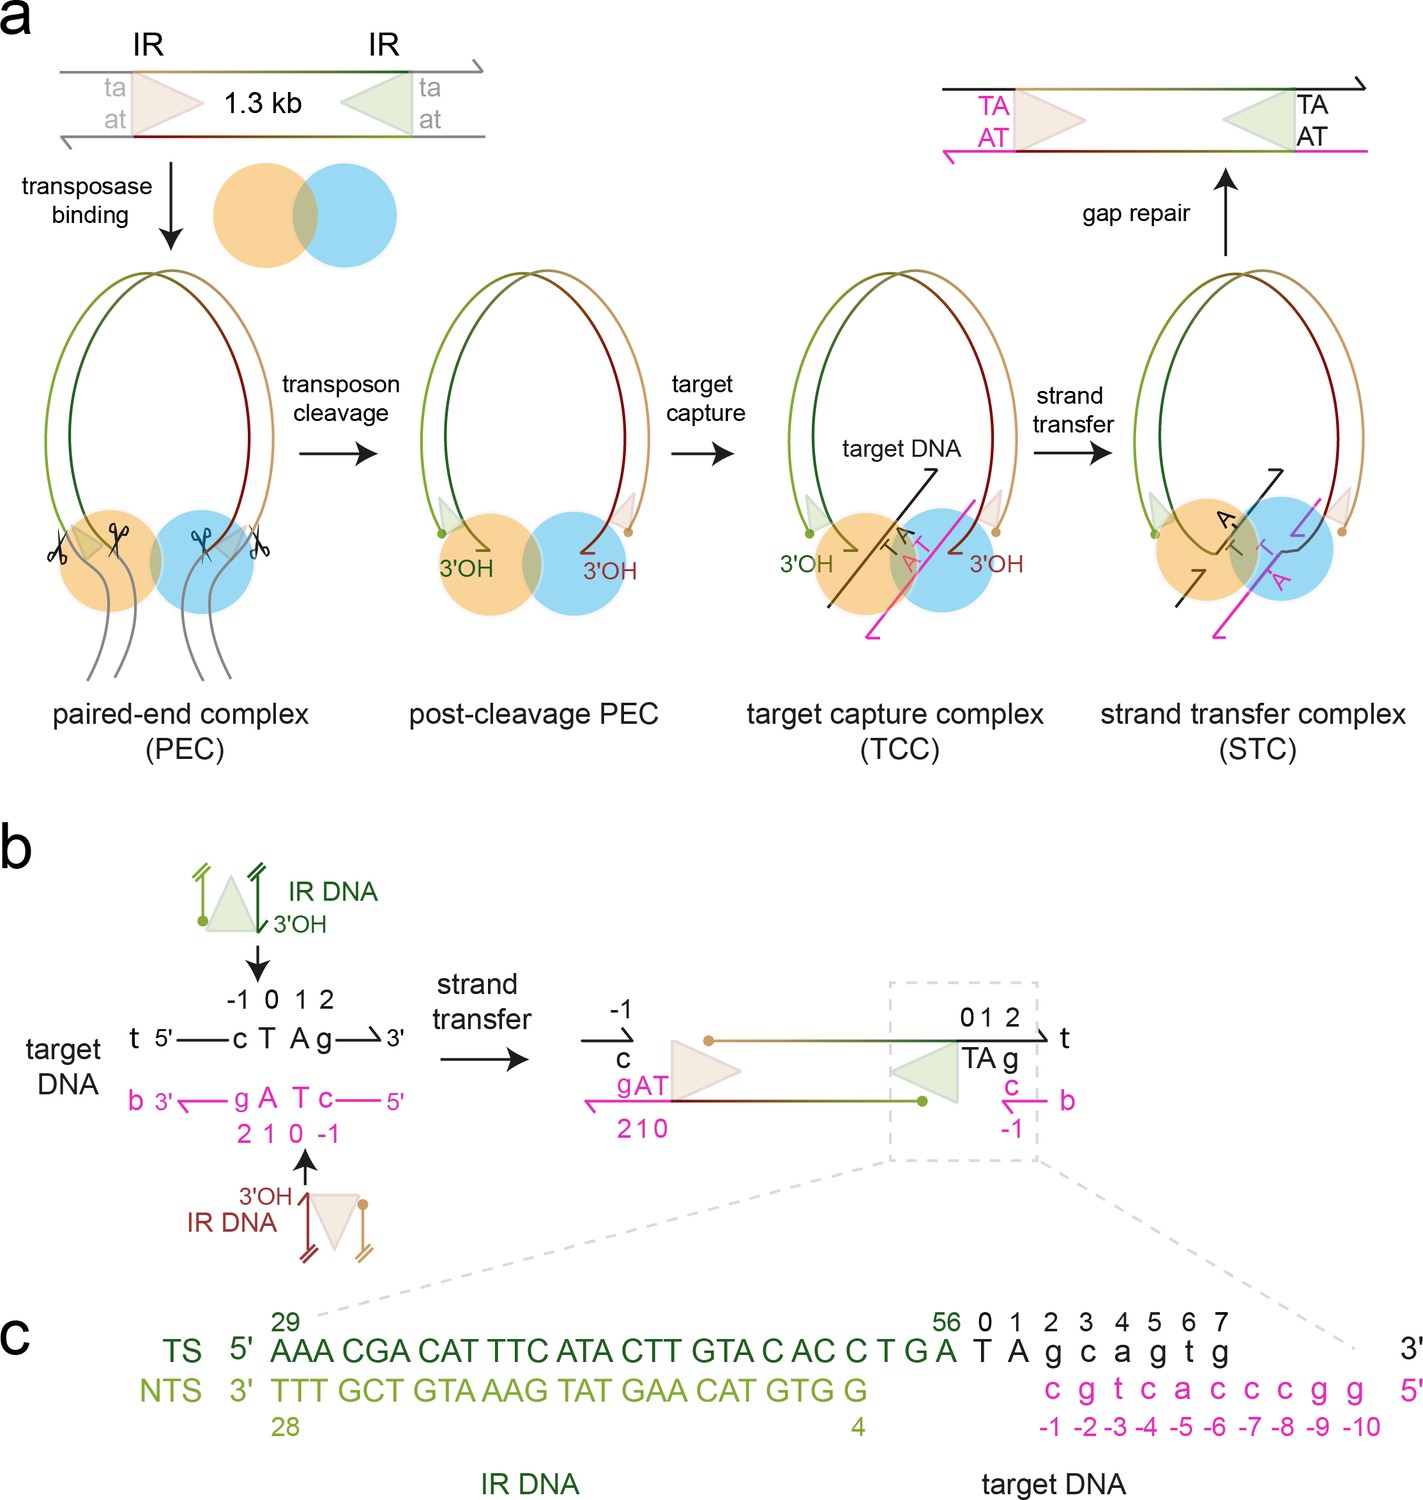
Mos1 transposition.
(a) Schematic of pathway and complexes formed. Each transposon end has a 28 bp IR sequence (triangle) flanked by the TA target site duplication. First and second strand cleavages (scissors) are staggered by three bp and generate a 5' phosphate (filled circle) on the non-transferred strand (NTS), 3 bases within the IR, and a 3'OH (arrow) at the transferred strand (TS) end, respectively. After target DNA capture, the transposon 3' ends integrate at a symmetrical TA sequence, resulting in a 5 nt gap. Gap repair duplicates the TA. (b) Mos1 strand transfer. The transposon 3'OHs attack the phosphodiester bond between T0 and C-1 on both the top (t, black) and bottom (b, magenta) target DNA strands, joining each TS to target DNA, separating the TA base pairs, and leaving a 3'OH at C-1. (c) Sequence and numbering of the DNA used to crystallise the STC; see also Table 1.
Figure 2 with 3 supplements
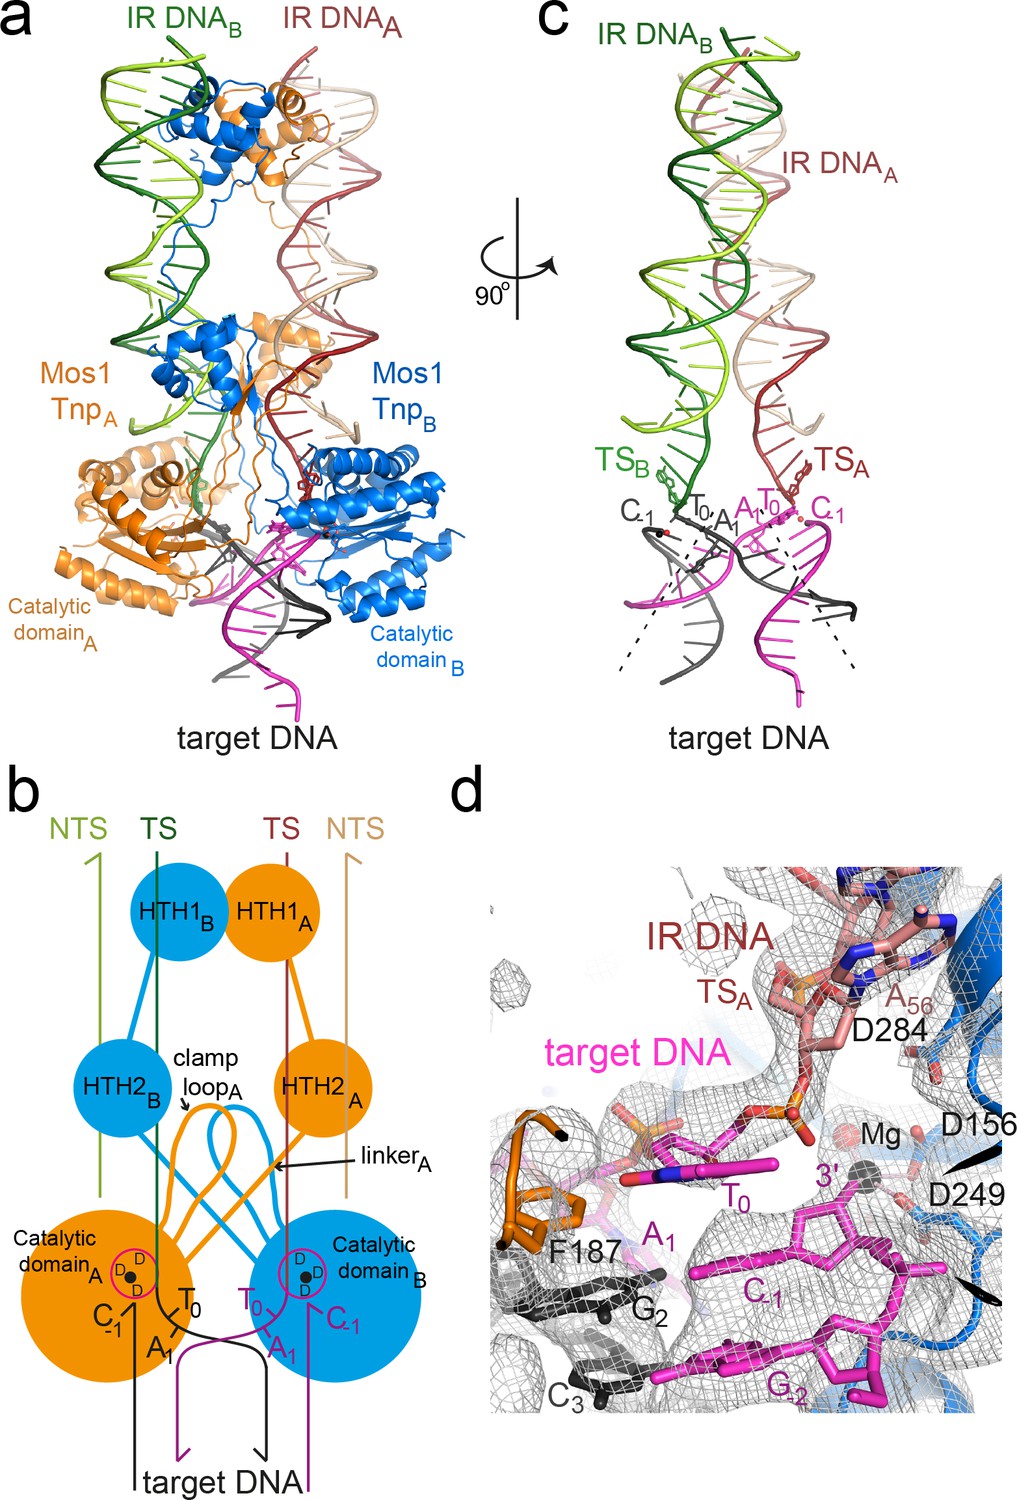
Architecture of the Mos1 strand transfer complex.
(a) Structure of the STC, with transposase subunits (orange and blue), IR DNA (orange and green) and target DNA (magenta and black). Figure 2—figure supplement 1 shows the crystal packing arrangement. (b) Schematic of the Mos1 STC. See Figure 2—figure supplement 2 for details of transposase DNA interactions. (c) DNA components of the STC: target DNA is bent and each IR TS connects at the 3' end to a target DNA strand. (d) The active site of catalytic domain B, showing the product of strand transfer into the bottom target strand (magenta). The simulated annealing composite omit 2Fo-Fc electron density map (grey mesh) is contoured at 1.2σ. The single Mg2+ is coordinated by D249, D156 and the 3'OH of C-1.
Figure 2—figure supplement 1
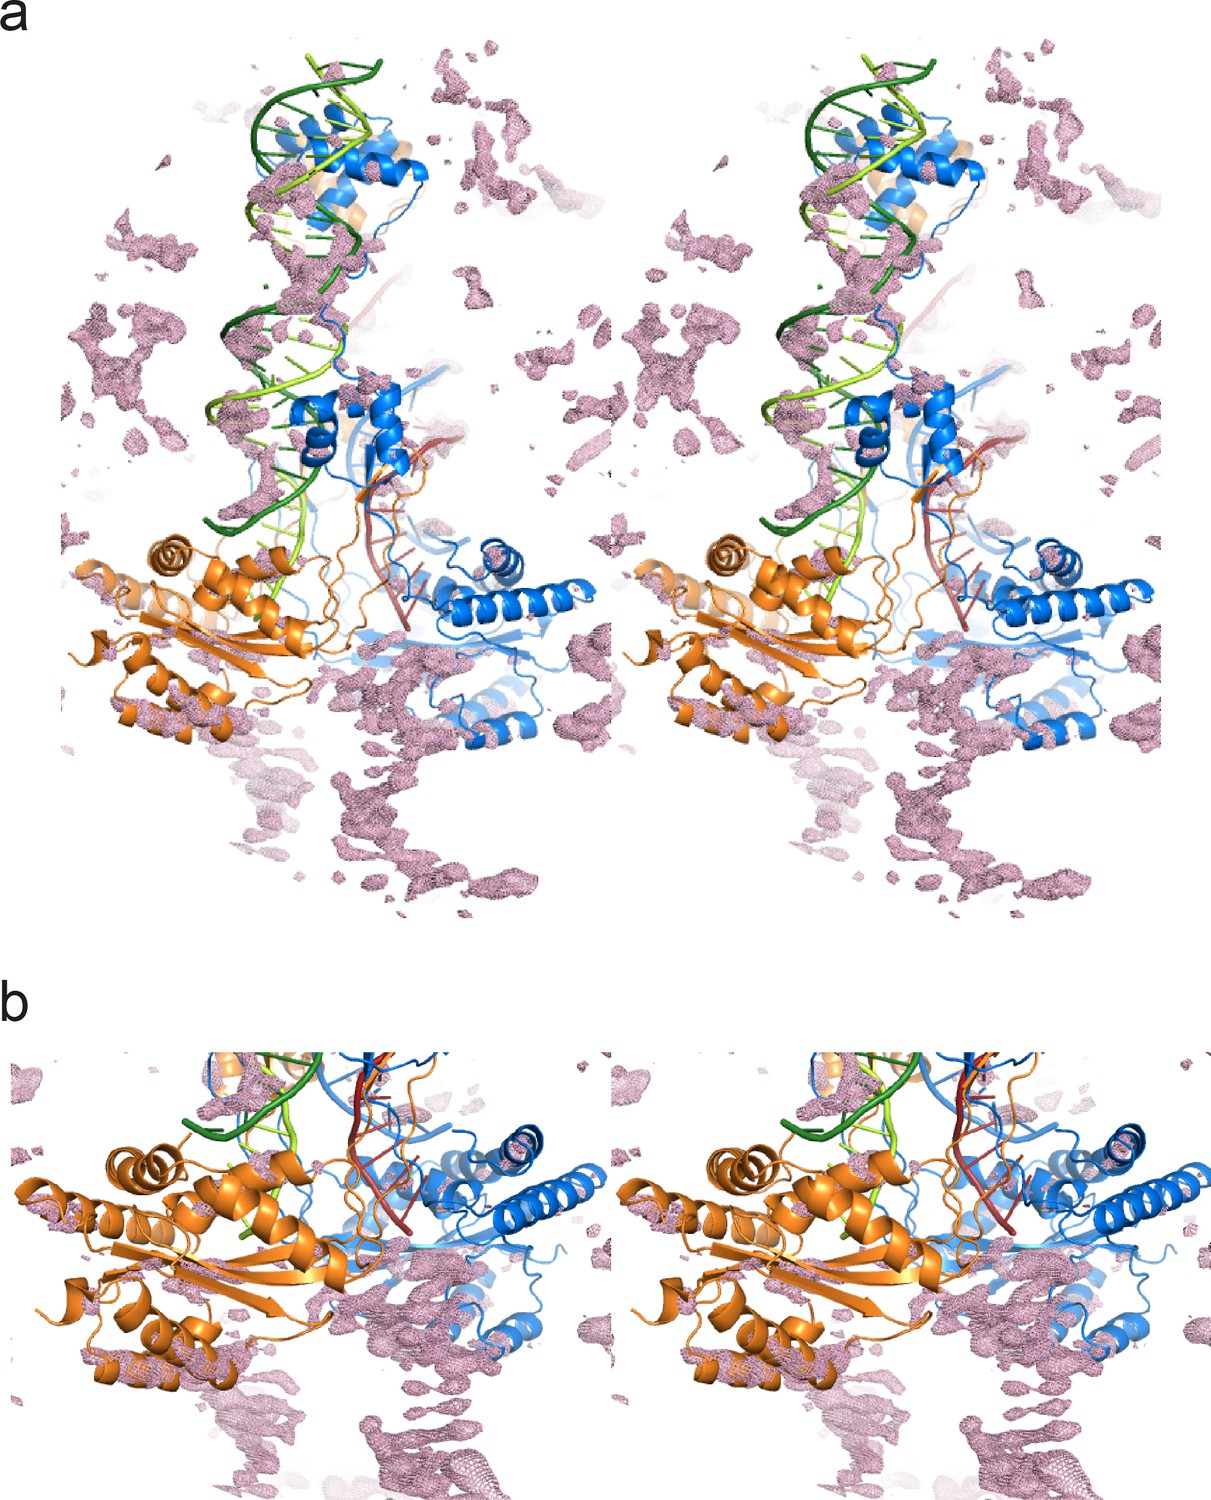
Stereo views of the difference electron density after molecular replacement.
The Fo-Fc electron density (at 2.3σ) is plotted as a pink mesh with the molecular replacement model: the Mos1 PEC structure (3HOS, chains A to F). (a) Full view of one Mos1 PEC molecule, and (b) close-up view of the catalytic domains and the TSs. Transposase subunits (chains A and B) are shown as ribbons and the IR DNA duplexes (chains C to F) as ladders.
Figure 2—figure supplement 2
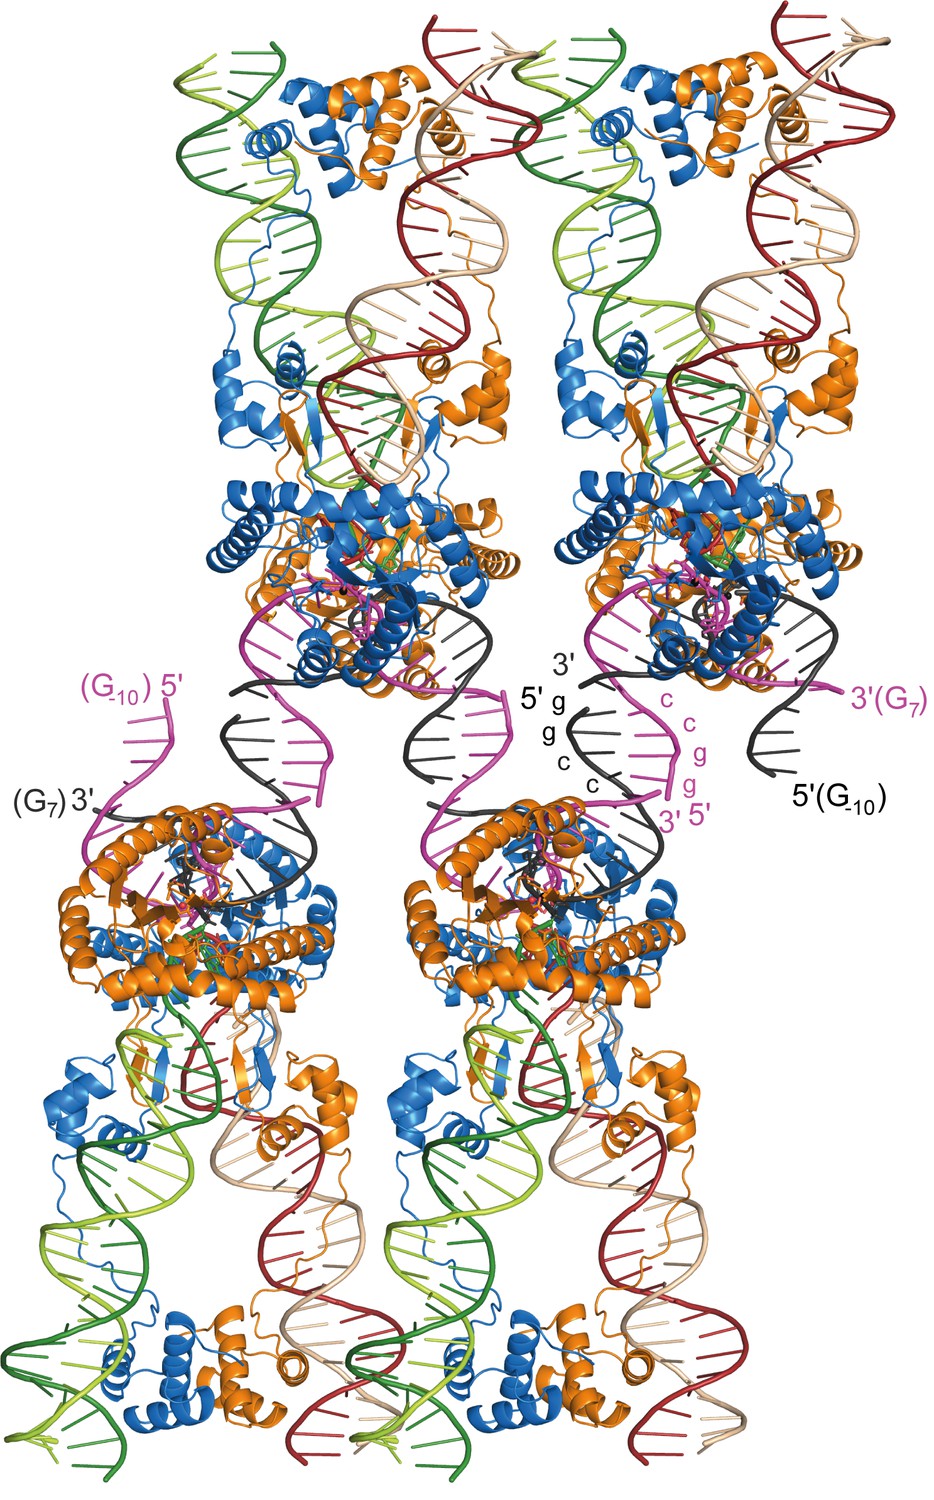
Packing arrangement and DNA interactions in the Mos1 STC crystal lattice.
Four copies of the Mos1 STC are shown. The 5' end of each target DNA strand has a 4 nt overhang, with the self-complementary sequence GGCC, which base pairs with a symmetry related overhang in an adjacent STC molecule.
Figure 2—figure supplement 3

Schematic depiction of the interactions between transposase and DNA in the Mos1 STC structure.
The IR DNA is shown in blue, and the target DNA shown in black (top strand) and magenta (bottom strand). Lines connect the detailed description of the interaction to either a circle (denoting a backbone phosphate) or the central rectangle (representing a base). Transposase interactions with the backbone phosphates of nucleotides surrounding the TA target sequence support the target DNA conformation, and include contacts between the backbone amides of Y276 and N250 and C-1; Y276 OH and G-2; T213 HG1 and A4; A216 NH and G5 and R257 NH and T6.
Figure 3 with 1 supplement
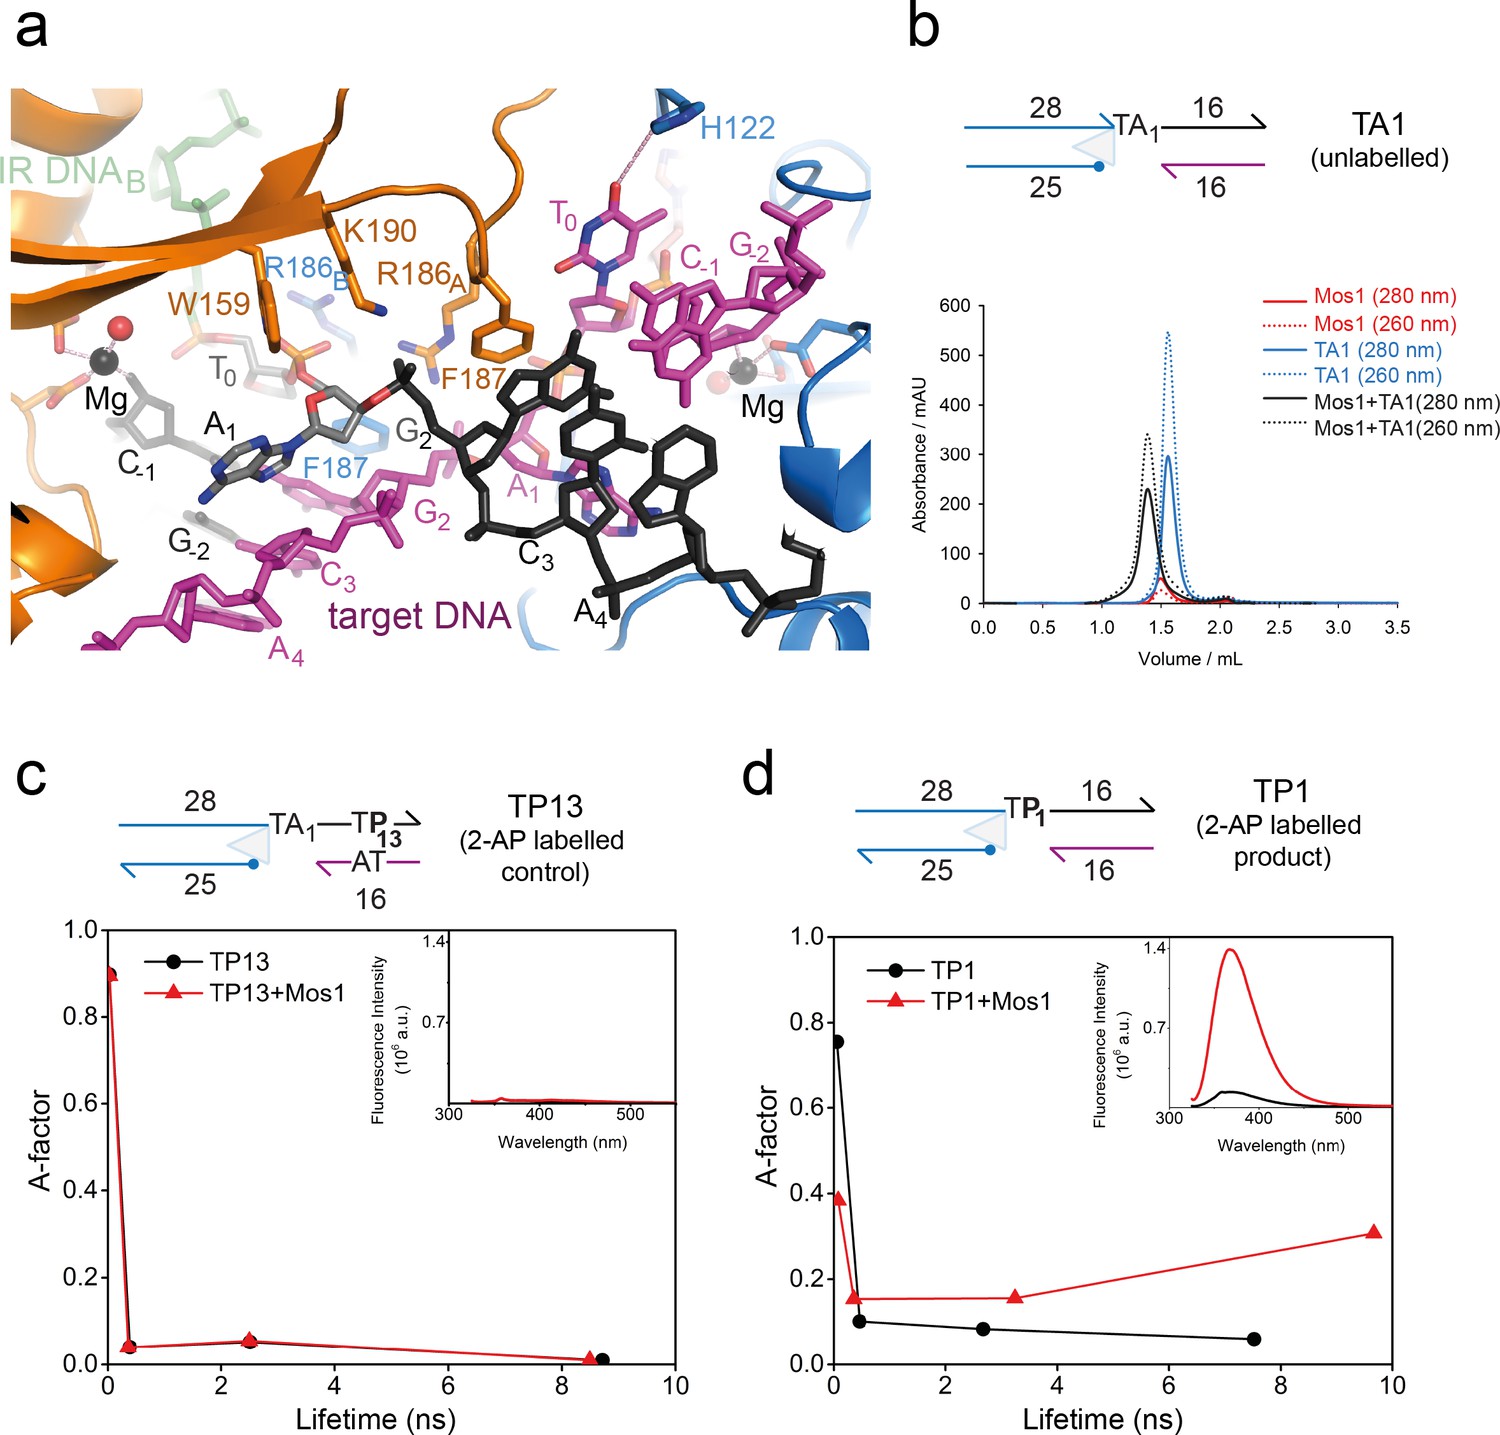
Dynamic base flipping of the target adenines.
(a) Target DNA binding in the Mos1 STC, showing the flipped A1 conformation. The unpaired T0 base stacks with the C-1 base of the same strand. See Figure 3—figure supplement 1 for the effect on strand transfer activity of the mutation H122A. (b) Schematic of the TA1 DNA duplex and gel filtration chromatograms of Mos1 transposase (red), TA1 (blue) and the STC (black). UV absorbance at 280 nm (solid line) and 260 nm (dotted line). (c and d) Fluorescence spectroscopy of the 2AP-labelled DNA oligonucleotides TP13 and TP1, shown schematically in (c) and (d) respectively. The A-factor (fractional population) and lifetime of each of the four fluorescence decay components are plotted for TP13 and TP1 alone (black circles and lines) and in the presence of Mos1 transposase (red triangles and lines); and tabulated in Figure 3—source data 1. The steady-state fluorescence emission spectra are inset in each case.
-
Figure 3—source data 1
Fluorescence decay parameters for 2AP-containing duplexes, TP13 and TP1, in the absence and presence of Mos1 transposase.
- https://doi.org/10.7554/eLife.15537.011
Figure 3—figure supplement 1
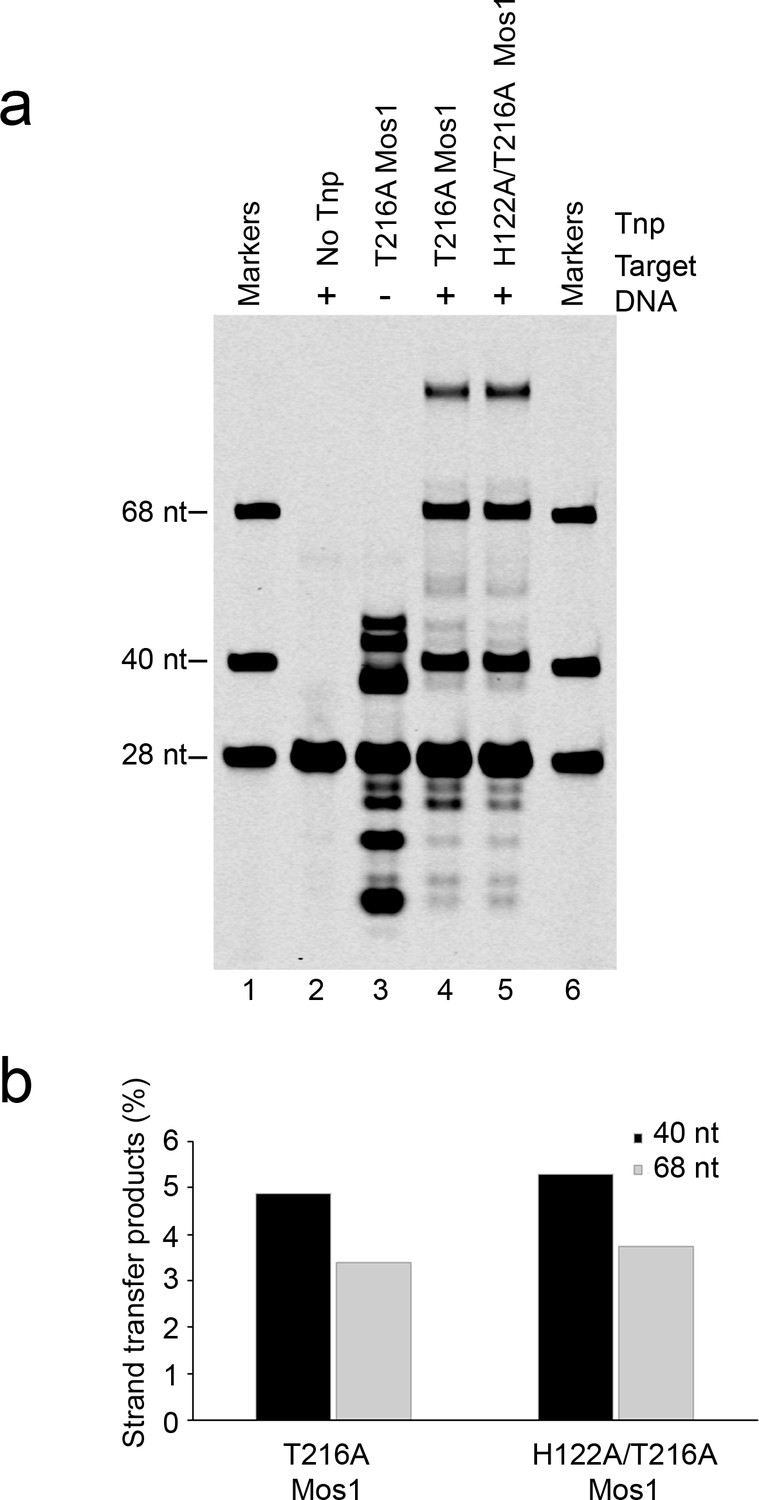
Strand transfer assay comparing the activity of T216A and H122A/T216A Mos1 transposases.
(a) Denaturing PAGE of the strand transfer reaction products. Lanes 1 and 6 contain markers; lane 2 is without transposase; lane 3 has no target DNA, but integration occurs at the two TA dinucleotides within the IR DNA sequence. (b) Quantification of the 40 nt and 68 nt strand transfer products for each mutant transposase, as a percentage of total DNA.
Figure 4

Transposase interactions with rotated backbone phosphates stabilise the target DNA.
(a) Target DNA phosphate interactions with catalytic domain residues. The side-chains of R186, W159 and K190 can form hydrogen bonds (dotted lines) with backbone phosphate oxygens of A1 and G2 (distances in Å). (b) Schematic of the in vitro Mos1 strand transfer assay. Integration of the 28 nt TS into the top target strand, yields a 68 nt product, whereas integration into the bottom strand gives a 40 nt product. (c) Denaturing PAGE of the strand transfer reaction products. Lanes 1 and 12 contain markers; lanes 2 and 13, reactions without transposase; lanes 3 and 14, reactions without target DNA. (Integration occurs at the two TA dinucleotides in the IR sequence). (d) Quantification of the 40 nt and 68 nt products (as a percentage of total DNA) for each mutant transposase; error bars represent the standard deviation and were calculated from 3 experiments.
Figure 5
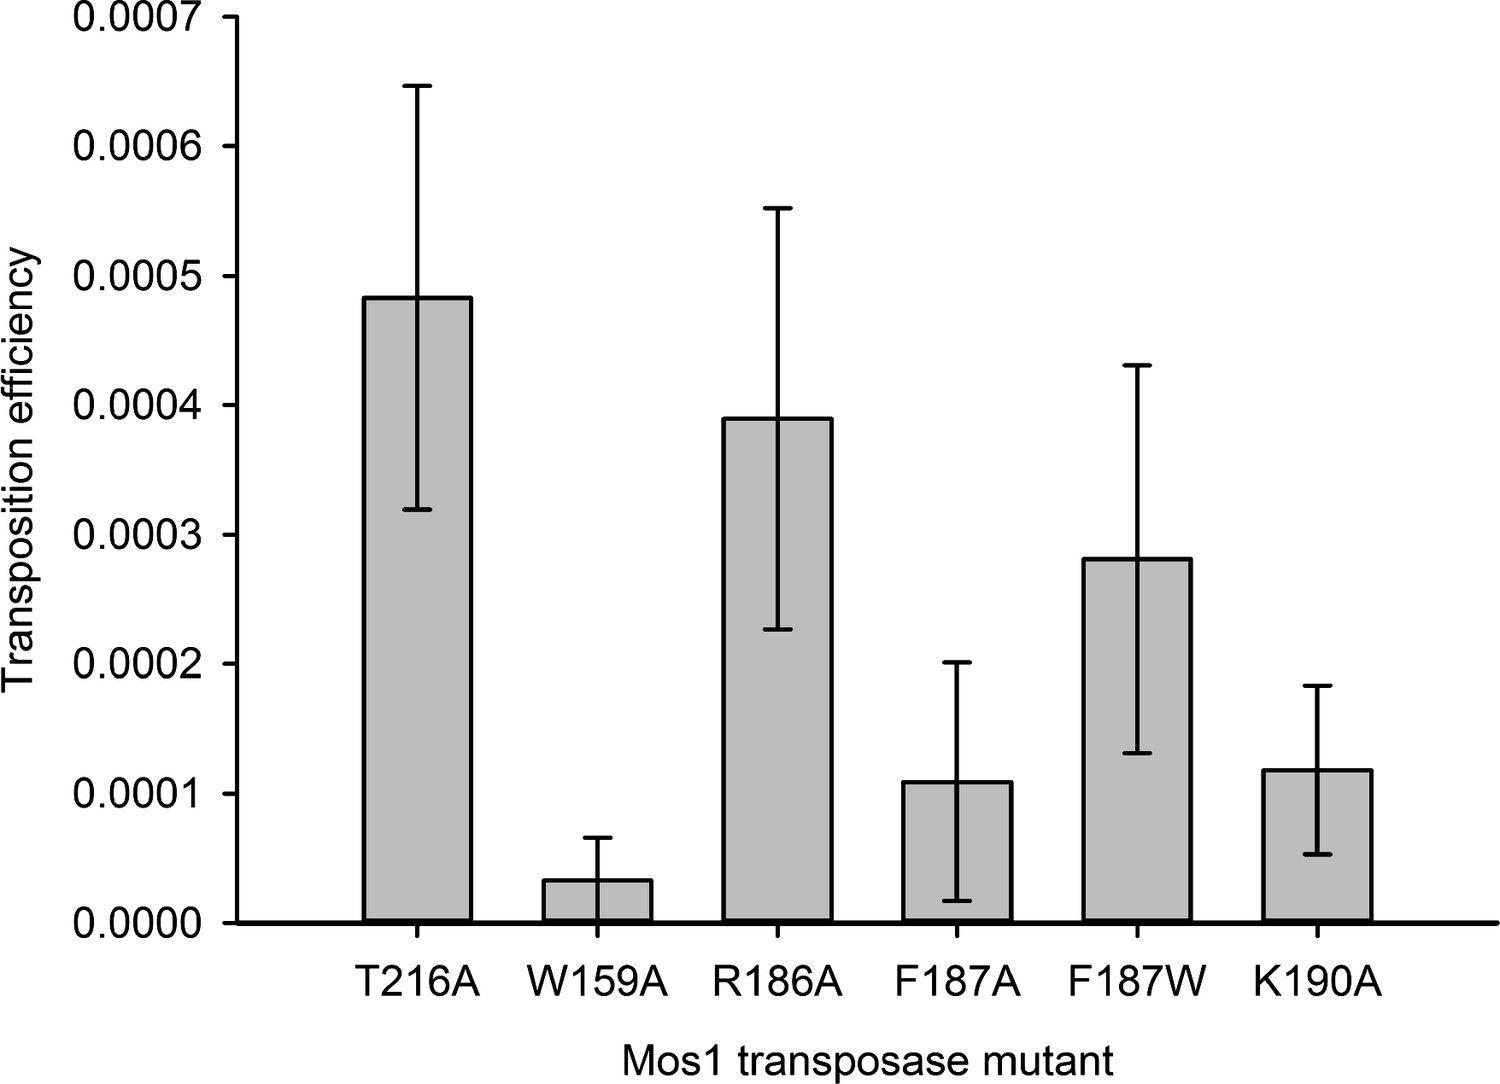
Residues that stabilise the transposition product are required for efficient Mos1 transposition in vitro.
Efficiencies of an in vitro Mos1 hop assay, performed using Mos1 transposase mutants and donor plasmids containing a kanamycin resistance gene flanked by Mos1 inverted repeats, as described previously (Trubitsyna et al., 2014). Excision of the IR-flanked gene from a circular plasmid by transposase, and its integration into a supercoiled target plasmid, results in transfer of the kanamycin resistance to the target plasmid. Each mutant transposase also contained the mutation T216A, which allows soluble protein expression. Sequencing of the transposition products revealed that each mutant transposases retained faithful integration at TA sites. Error bars represent the standard deviation, calculated from three repeats of two experiments.
Figure 6
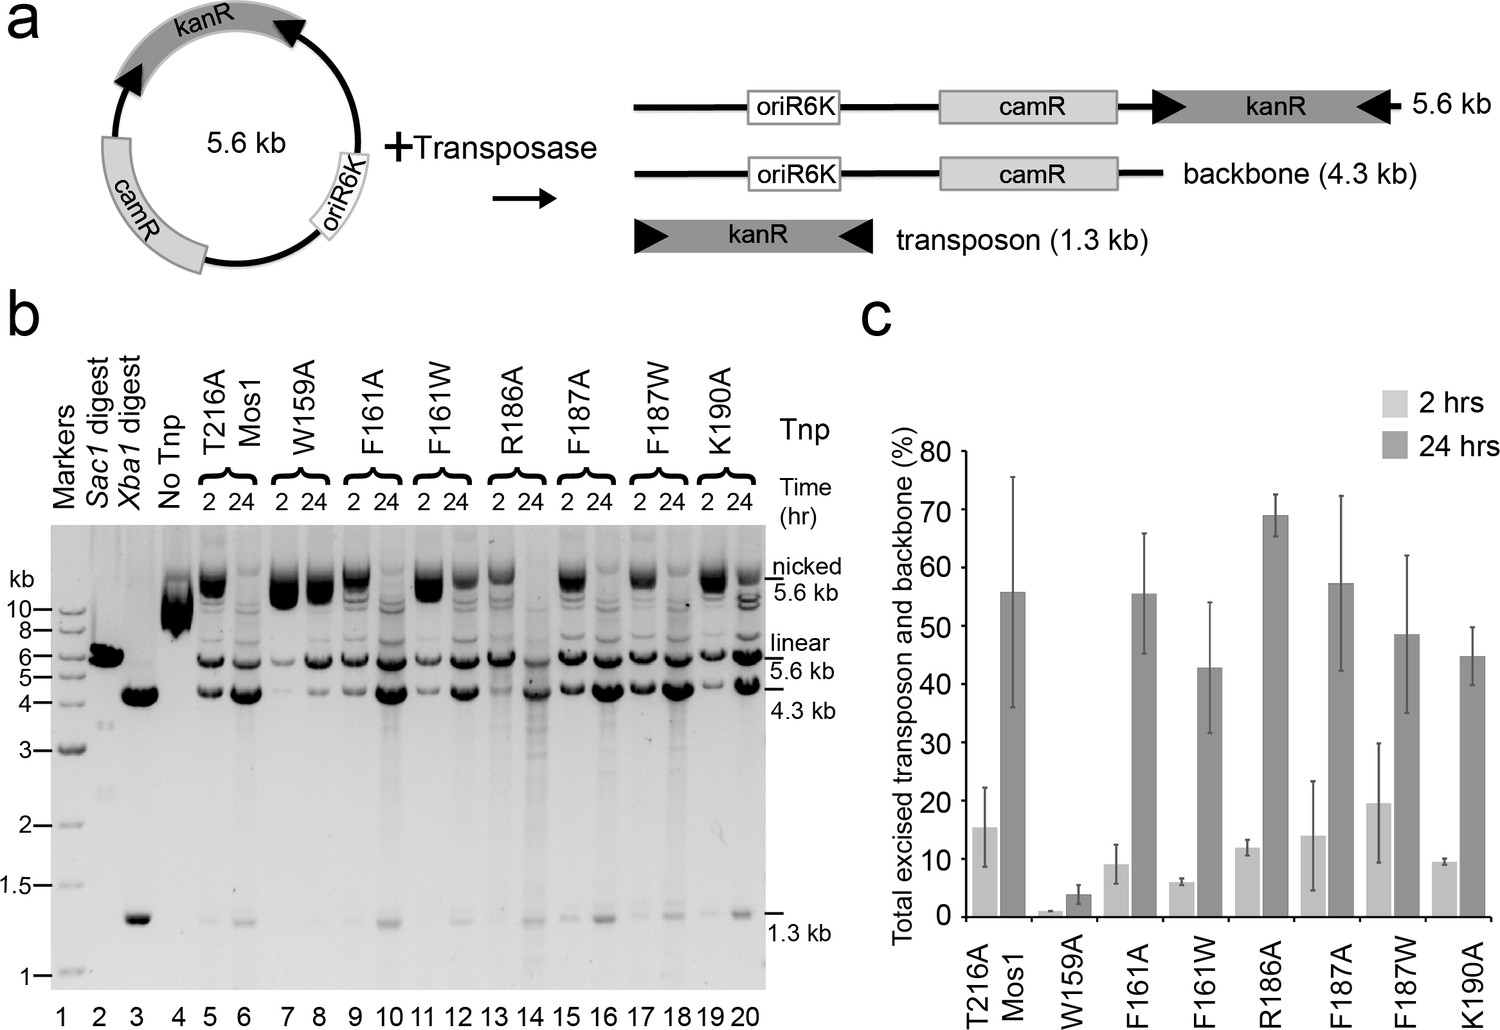
Plasmid-based transposon cleavage assays.
(a) Schematic of the in vitro plasmid-based Mos1 cleavage assay. (b) Agarose gel showing the products of plasmid-based transposon cleavage assays, for each mutant transposase (Tnp) after 2 hr and 24 hr. Control experiments show linearization of the plasmid with Sac1 (lane 2), excision of the transposon by Xba1 digestion (lane 3) and reaction with no transposase (lane 4). (c) Quantification of the transposon and plasmid backbone released (as a percentage of total DNA) after 2 hr and 24 hr. Error bars represent the standard deviation calculated from 2 experiments.
Figure 7
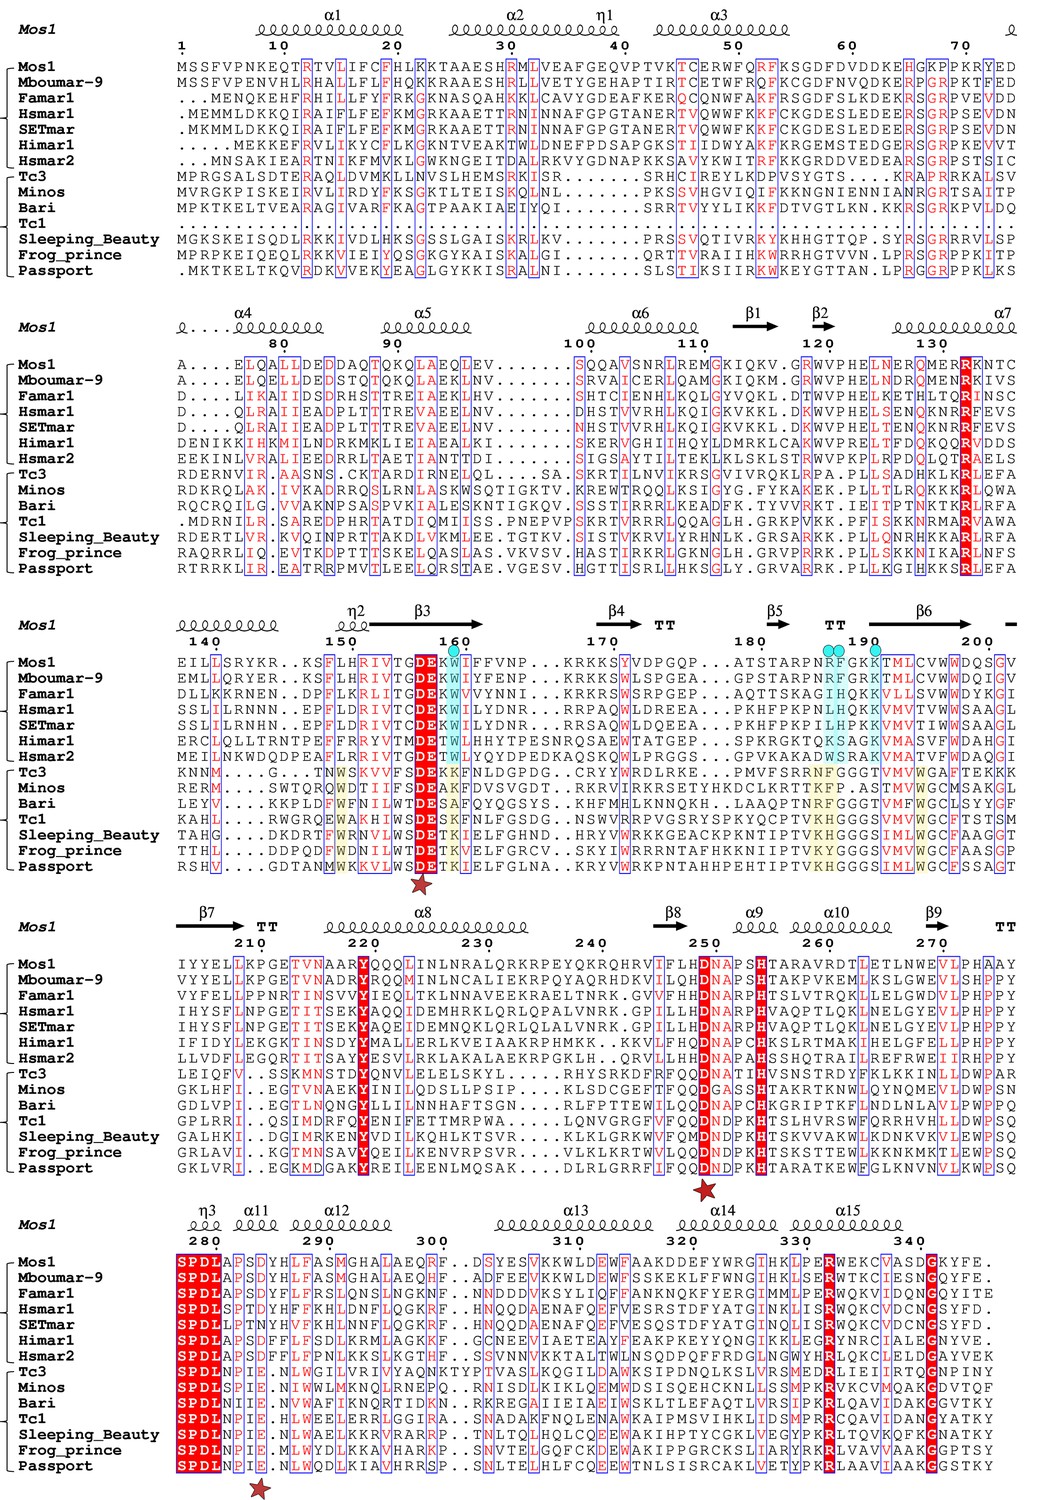
Alignment of the amino acid sequence of Mos1 with six other mariner transposases and five Tc1-family transposases.
The secondary structure elements of Mos1 transposase in the Mos1 STC are shown above the alignment. A red star below the alignment denotes the position of each of the catalytic acidic residues of the DDE/D triad. The third residue of this triad is typically D in the mariner sub-family and E in the Tc sub-family. The key residues involved in target DNA stabilisation in the Mos1 STC are highlighted in blue and marked by a blue dot. The figure was created with ESPript 3.0 (http://espript.ibcp.fr/ESPript/cgi-bin/ESPript.cgi).
Figure 8
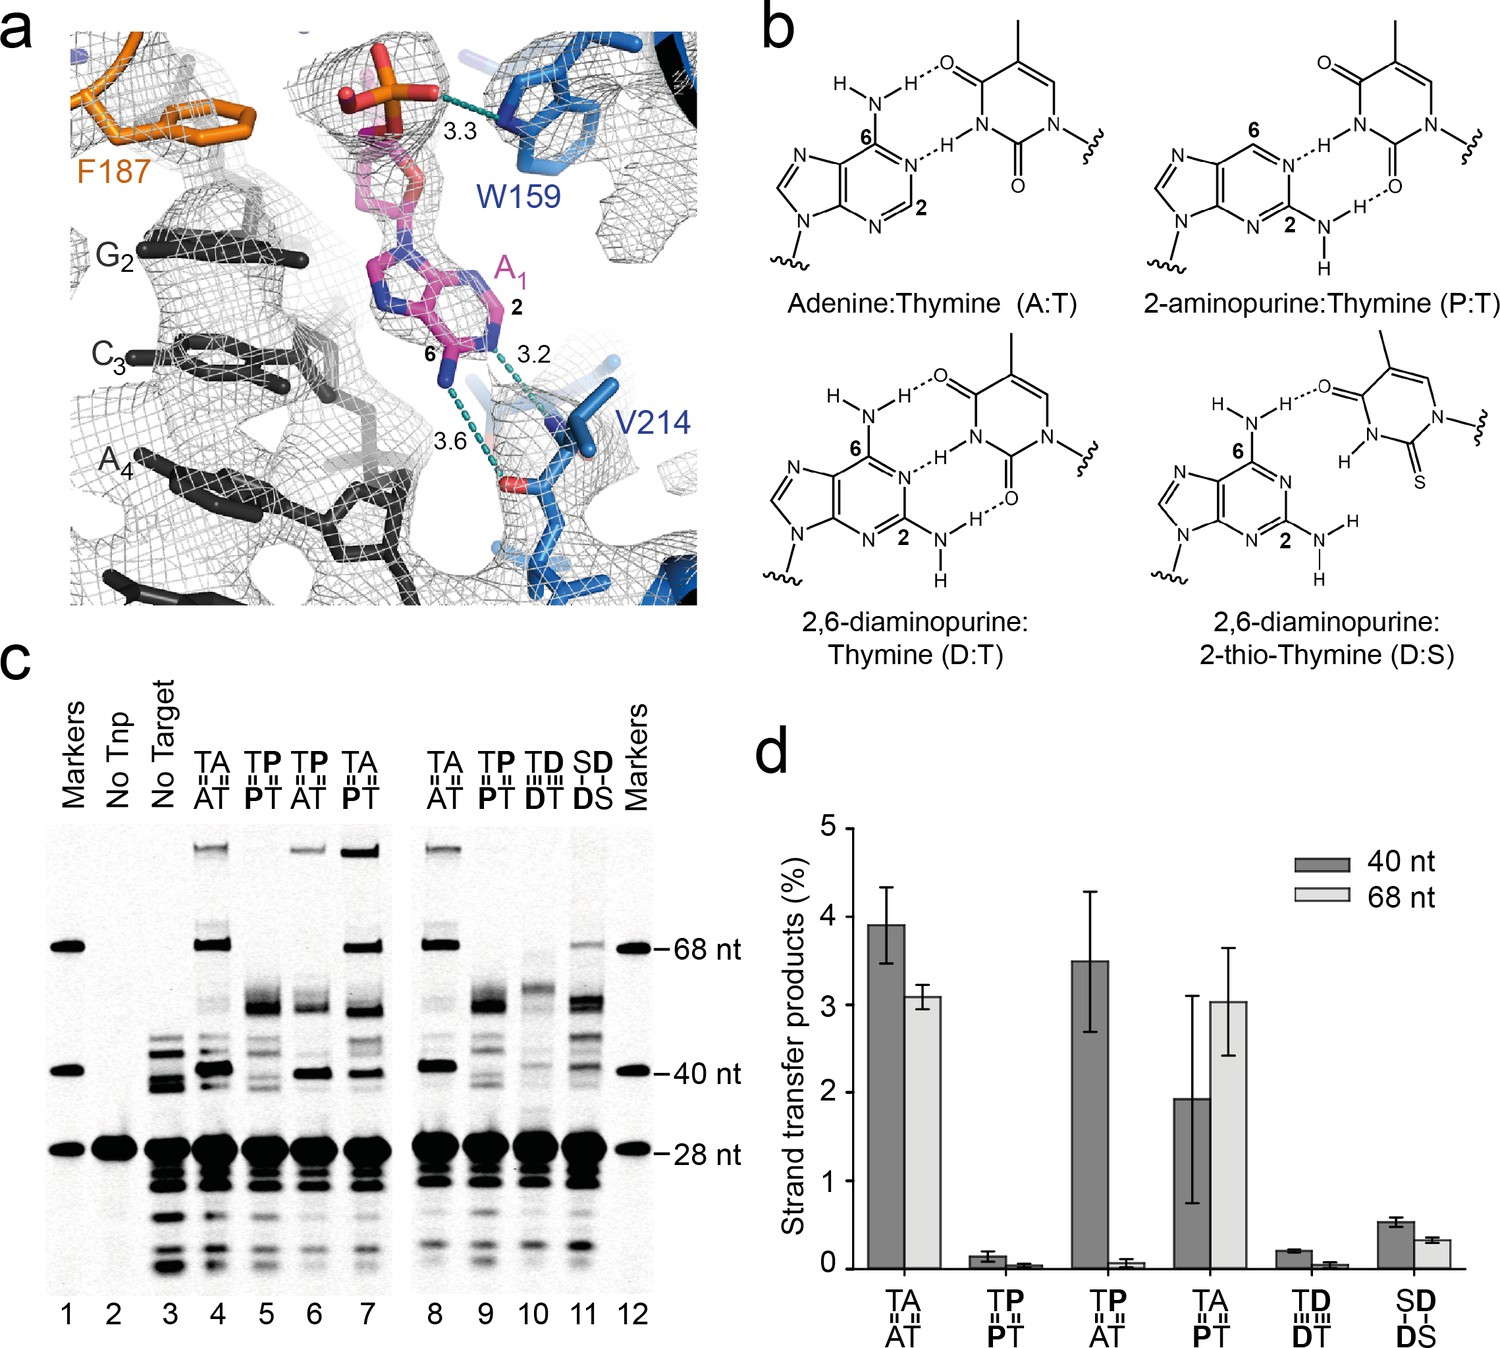
Base-specific recognition of the flipped adenine.
(a) Close up view of one of the flipped target adenines in the Mos1 STC crystal structure showing the hydrogen bond interactions (dotted cyan lines, distance in Å) with the V214 backbone atoms and the 2 and 6 positions of the adenine ring. The simulated annealing composite omit 2Fo-Fc electron density map (grey mesh) is contoured at 1.2σ. (b) Chemical structures and base-pairing of adenine, A, and its analogues 2-aminopurine, P, and 2,6-diaminopurine, D, with thymine, T or 2-thio-thymine, S. A steric clash between the 2-thio group of S and the 2-amino group of D tilts the bases relative to each other, and thus only one H-bond forms. (c) Denaturing PAGE of the products of strand transfer reactions with target DNA containing adenine and/or thymine analogues, as indicated above lanes 4 to 11. (d) Quantification of the 40 nt and 68 nt strand transfer products for each target DNA duplex, as a percentage of total DNA. Error bars represent the standard deviation, calculated from 2 experiments.
Figure 9 with 1 supplement
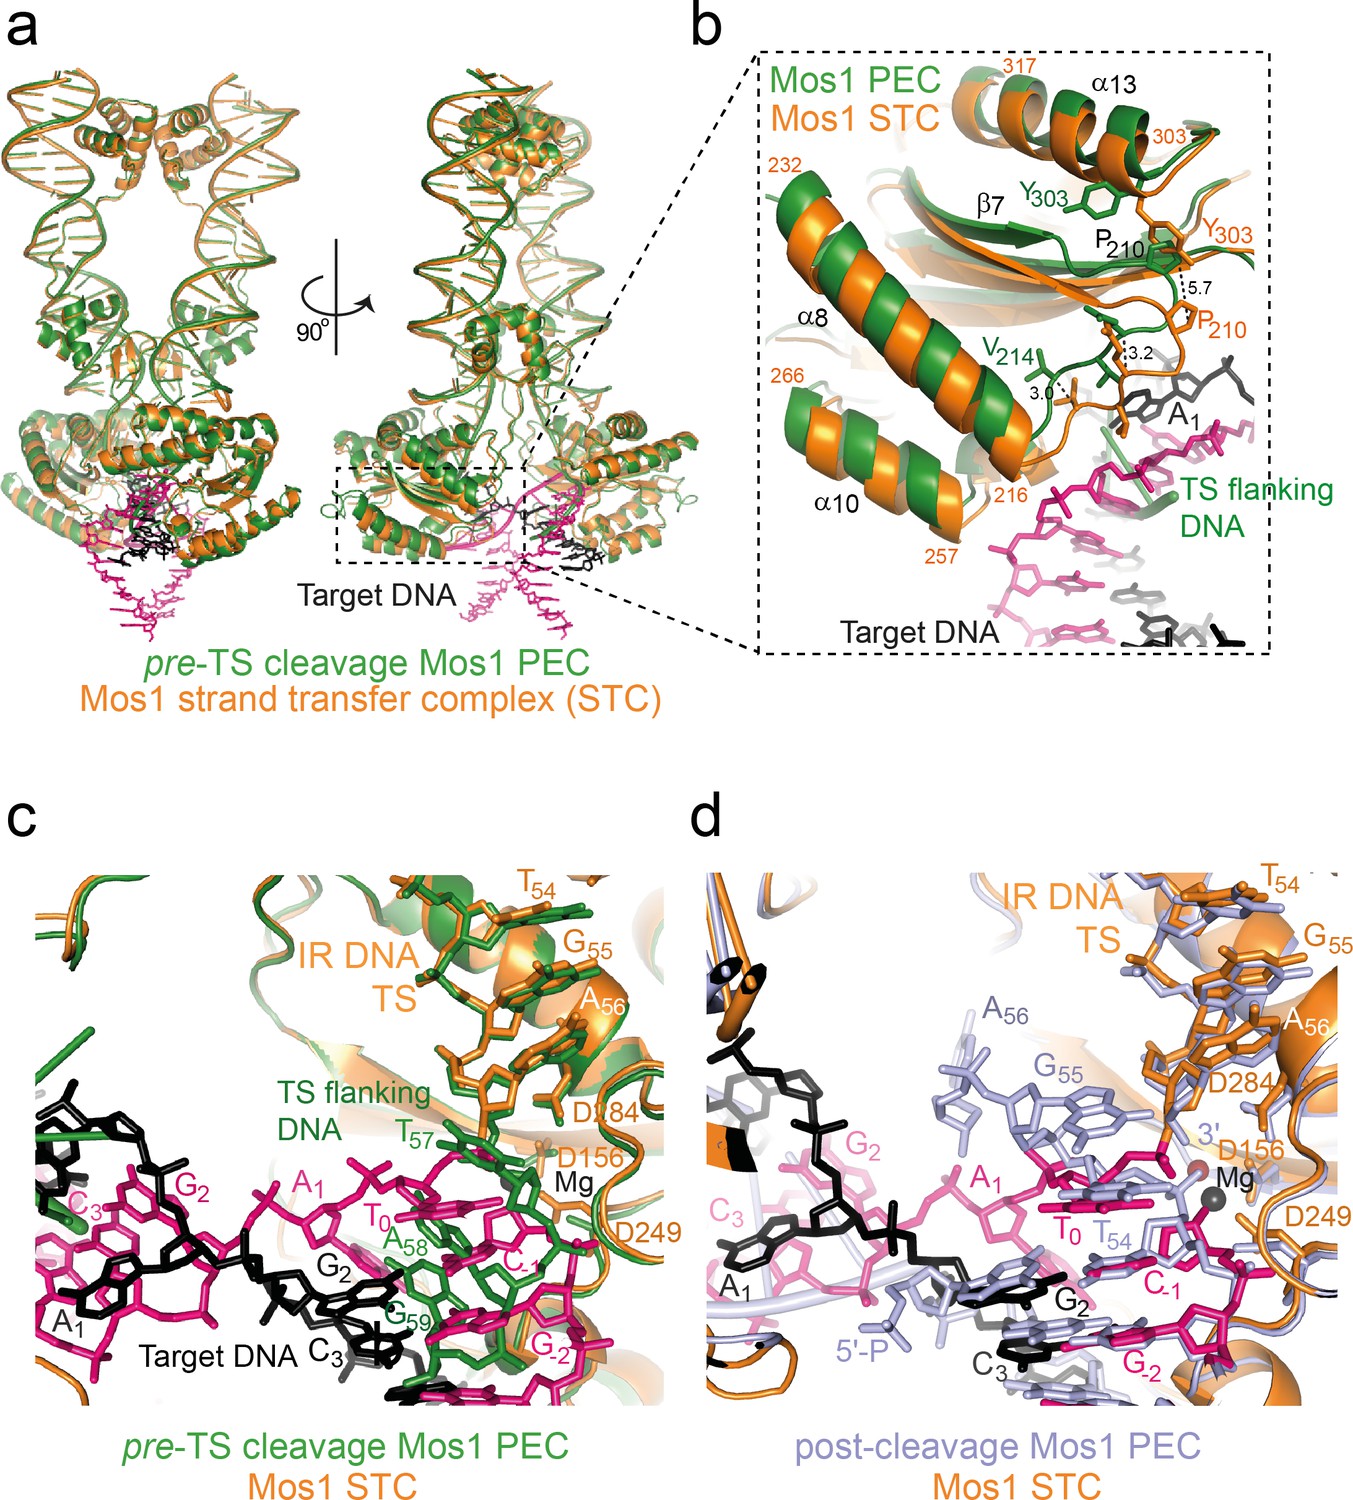
Structural comparison of the Mos1 STC with the pre- and post-TS cleavage Mos1 paired-end complexes.
(a) Orthogonal views of the Mos1 STC (orange) superimposed on the pre-TS cleavage PEC (PDB ID: 4U7B, green): r.m.s.d. over all transposase backbone atoms, 1.2 Å. Video 1 and video 2 show the transposase morphing from the pre- and post-cleavage PEC structures to the STC, respectively. (b) Close-up view of part of the catalytic domain, boxed in (a). Mos1 STC target DNA and the pre-TS cleavage PEC flanking DNA are shown as sticks (pink and black) and a green cartoon, respectively. Dotted lines indicate the displacement between the two structures, with distances in Å. (c) and (d) Close-up view of the Mos1 STC (orange) active site superimposed on (c) the pre-TS cleavage PEC (green) and (d) the post-TS cleavage PEC (PDB ID: 3HOS): T54 in the additional DNA duplex (lavender sticks) may represent T0 of target DNA before strand transfer. A full view of the Mos1 STC superposed on the post-TS cleavage PEC structures is shown in Figure 9—figure supplement 1.
Figure 9—figure supplement 1
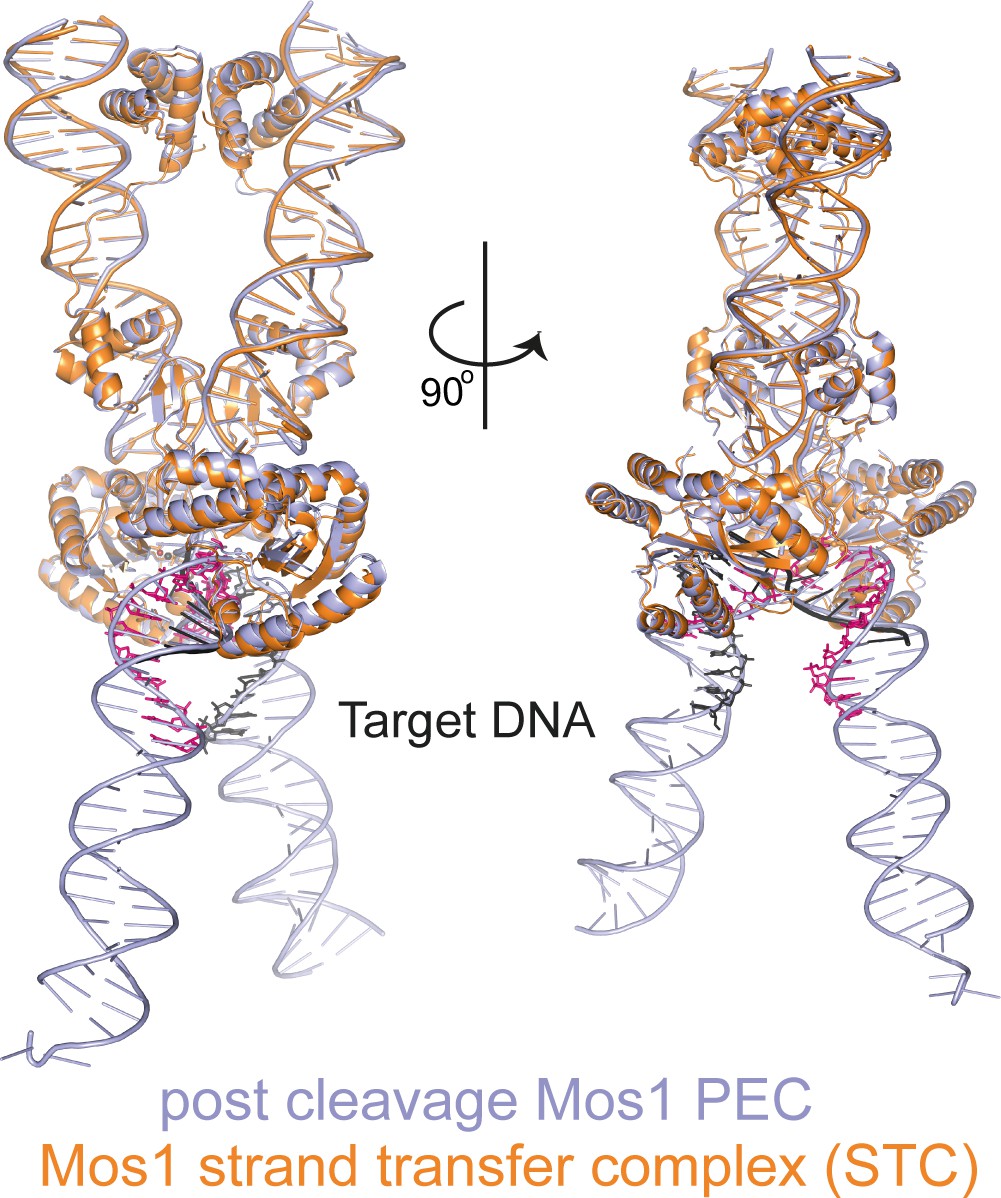
Structural comparison of the Mos1 STC with the post-TS cleavage Mos1 paired-end complex.
The Mos1 STC (orange) is superimposed on the post-TS cleavage PEC (PDB ID: 3HOS, lavender).
Figure 10
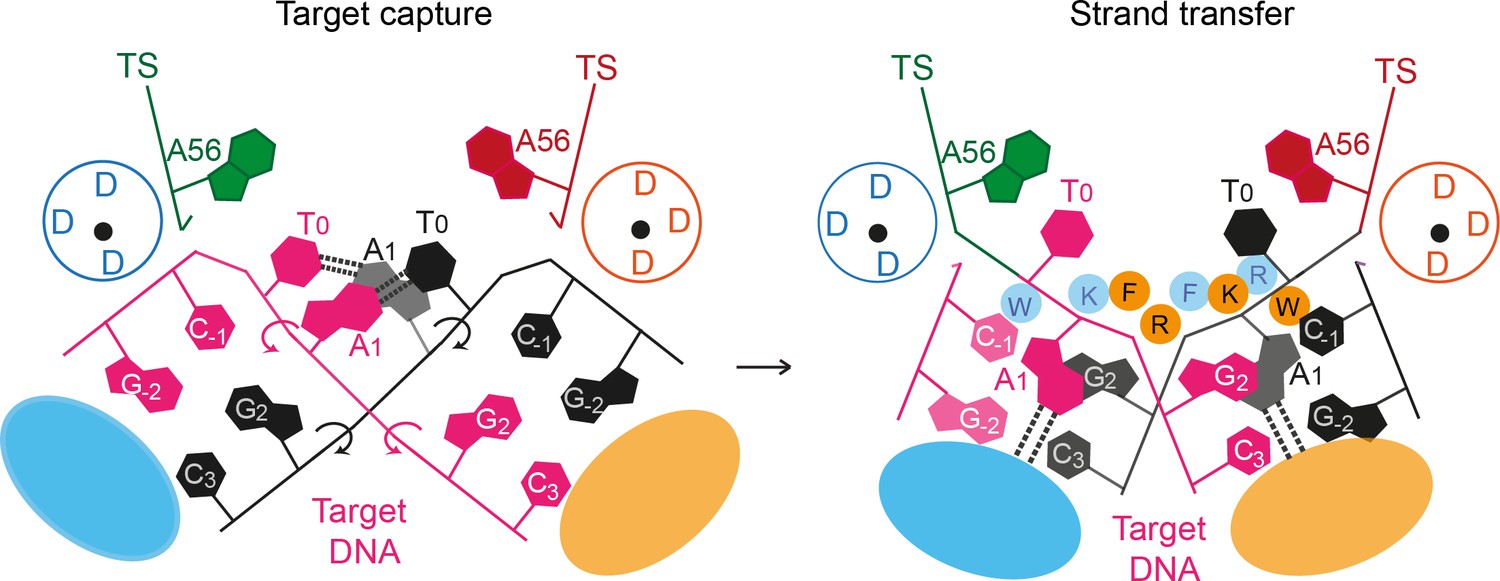
A proposed mechanism for Mos1 transposon integration incorporates target DNA bending and trapping of flipped target adenines.
Schematic representation of key features of the STC (right) and the proposed target capture complex (left), with transposase subunits (orange and blue). Filled circles represent residues W159 (W), R186 (R), F187 (F) and K190 (K) and the encircled DDD depicts each active site. Arrows indicate rotation of the DNA backbone of each target DNA strand (magenta and black). Dotted lines represent hydrogen bonds between TA base pairs in the TCC and between flipped target adenines and transposase backbone atoms in the STC.
Videos
Video 1
Morphing of the Mos1 transposase conformation in the pre-TS cleavage PEC (PDB ID: 4U7B) into the Mos1 STC conformation.
Related to Figure 9.
Video 2
Morphing of the Mos1 transposase conformation in the post-cleavage PEC (PDB ID: 3HOS) into the Mos1 STC conformation.
Related to Figure 9.
Tables
Table 1
Sequences of oligonucleotides used in the crystallisation, target integration and fluorescence experiments. The target TA dinucleotide (and its variants) are highlighted in bold. The adenine analogue 2-aminopurine is denoted P and 2,6-diaminopurine is D; the thymine analogue 2-thio-thymine, is indicated by S. IR700 indicates the 5' addition of the infrared fluorescent dye 700.
| Name | Sequence | Length (nt) |
|---|---|---|
| Crystallisation of STC | ||
| TS | 5' AAA CGA CAT TTC ATA CTT GTA CAC CTG ATA GCA GTG | 36 |
| NTS | 5' GGT GTA CAA GTA TGA AAT GTC GTT T | 25 |
| target DNA | 5' GGC CCA CTG C | 10 |
| Target Integration Assays | ||
| TS IR DNA | 5' AAA CGA CAT TTC ATA CTT GTA CAC CTG A | 28 |
| TS 5' labelled IR DNA | 5' IR700 / AAA CGA CAT TTC ATA CTT GTA CAC CTG A | 28 |
| NTS IR DNA | 5' GGT GTA CAA GTA TGA AAT GTC GTT T | 25 |
| TA target DNA (top strand) | 5' AGC AGT GCA CTA GTG CAC GAC CGT TCA AAG CTT CGG AAC GGG ACA CTG TT | 50 |
| TA target DNA (bottom strand) | 5' AAC AGT GTC CCG TTC CGA AGC TTT GAA CGG TCG TGC ACT AGT GCA CTG CT | 50 |
| TP target DNA (top strand) | 5' AGC AGT GCA CTP GTG CAC GAC CGT TCA AAG CTT CGG AAC GGG ACA CTG TT | 50 |
| TP target DNA (bottom strand) | 5' AAC AGT GTC CCG TTC CGA AGC TTT GAA CGG TCG TGC ACT PGT GCA CTG CT | 50 |
| TD target DNA (top strand) | 5' AGC AGT GCA CTD GTG CAC GAC CGT TCA AAG CTT CGG AAC GGG ACA CTG TT | 50 |
| TD target DNA (bottom strand) | 5' AAC AGT GTC CCG TTC CGA AGC TTT GAA CGG TCG TGC ACT DGT GCA CTG CT | 50 |
| SD target DNA (top strand) | 5' AGC AGT GCA CSD GTG CAC GAC CGT TCA AAG CTT CGG AAC GGG ACA CTG TT | 50 |
| SD target DNA (bottom strand) | 5' AAC AGT GTC CCG TTC CGA AGC TTT GAA CGG TCG TGC ACS DGT GCA CTG CT | 50 |
| Fluorescence experiments | ||
| TS_P1 | 5' AAA CGA CAT TTC ATA CTT GTA CAC CTG AtP gca gtg gac gta ggc c | 46 |
| TS_P13 | 5' AAA CGA CAT TTC ATA CTT GTA CAC CTG Ata gca gtg gac gtP ggc c | 46 |
| TS_A1 | 5' AAA CGA CAT TTC ATA CTT GTA CAC CTG Ata gca gtg gac gta ggc c | 46 |
| NTS | 5' GGT GTA CAA GTA TGA AAT GTC GTT T | 25 |
| Target_16 | 5' g gcc tac gtc cac tgc | 16 |
Table 2
X-ray diffraction and refinement statistics.
| Crystal | Mos1 Strand transfer complex | |
|---|---|---|
| PDB ID | 5HOO | |
| Space group | C121 | |
| Cell dimensions | a = 256.3 Å b = 58.9 Å c = 110.2 Å α = 90.0°, β = 94.9°, γ = 90.0° | |
| Wavelength (Å) | 0.9795 | |
| Average mosaicity | 0.22 | |
| Overall | Outer shell | |
| Resolution (Å) | 86.99–3.29 | 3.52–3.29 |
| Rsymm | 0.077 | 0.152 |
| Total observations | 78358 | 14630 |
| Unique observations | 25201 | 4479 |
| < I>/σ<I> | 8.1 | 3.3 |
| Correlation CC | 0.927 | 0.996 |
| Completeness (%) | 99.6 | 99.5 |
| Multiplicity | 3.1 | 3.3 |
| Rwork | 0.243 | |
| Rfree (5.21% of reflections) | 0.279 | |
| R.m.s. deviations: Bond Length (Å) Bond Angle (deg) Chiral volume (Å) | 0.0077 1.2072 0.0785 | |
| Average B factor (Å2) | 74.0 | |
| Ramachandran plot: Core (%) Allowed (%) Outliers (%) | 90.8 9.2 0 | |
Download links
A two-part list of links to download the article, or parts of the article, in various formats.
Downloads (link to download the article as PDF)
Open citations (links to open the citations from this article in various online reference manager services)
Cite this article (links to download the citations from this article in formats compatible with various reference manager tools)
A bend, flip and trap mechanism for transposon integration
eLife 5:e15537.
https://doi.org/10.7554/eLife.15537


