Reproducible diagnostic metabolites in plasma from typhoid fever patients in Asia and Africa
- Umeå University, Sweden
- Liverpool School of Tropical Medicine, United Kingdom
- Nagasaki University, Japan
- Oxford University, United Kingdom
- Clinical Research Unit, Vietnam
- Mahidol University, Thailand
- University of Amsterdam, the Netherlands
- University of Amsterdam, The Netherlands
- The International Vaccine Institute, South Korea
- Chittagong Medical College Hospital, Bangladesh
- Malaria Research Group and Dev Care Foundation, Bangladesh
- The University of Cambridge, United Kingdom
Figures
Figure 1 with 1 supplement
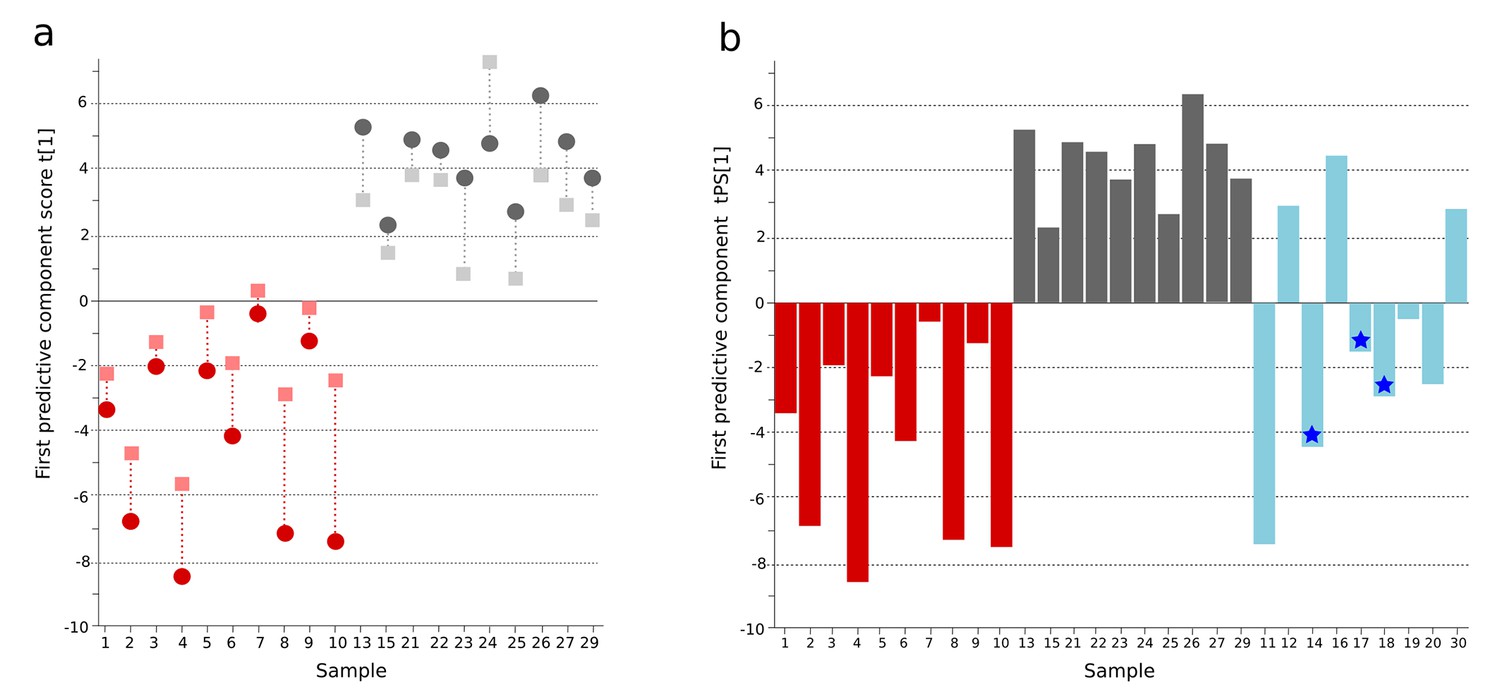
OPLS-DA model of plasma metabolites from a Bangladeshi cohort of patients with culture-positive typhoid and fever controls, with prediction of suspected typhoid.
(A) OPLS-DA model generated from GCxGC-TOFMS data from the plasma of 10 patients with culture-positive typhoid and 10 fever controls using 236 metabolites. Regular (circles) and cross-validated (squares) scores for the first predictive component (t[1] and tcv[1], respectively, linked by broken line) showing a separation between culture-positive typhoid (red) and fever control samples (grey) (p=0.006). (B) Column plot of the predicted scores for the first predictive component (tPS[1]) where clinically suspected typhoid samples (n = 9) (blue columns) have been predicted into the model distinguishing between culture-positive typhoid (red) and fever control samples (grey). Plot shows five samples were more similar to the culture-positive typhoid samples and three more similar to the controls; one sample remained marginal. The blue stars identify PCR-amplification-positive samples.
Figure 1—figure supplement 1
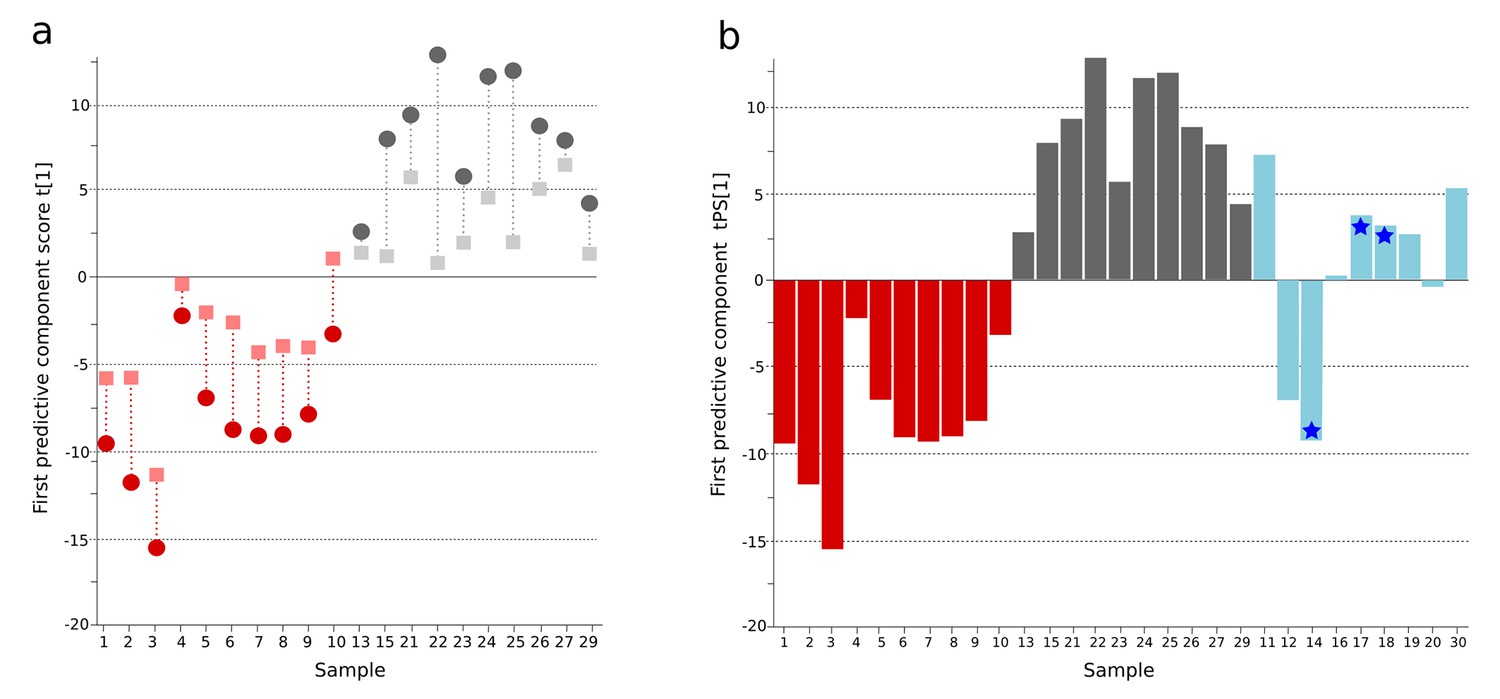
OPLS-DA model of urine metabolites from a Bangladeshi cohort including patients with culture-positive typhoid and fever controls, with prediction of suspected typhoid.
(A) OPLS-DA model generated from UHPLC-Q-TOFMS data from the urine of 10 patients with culture-positive typhoid and 10 fever controls using 941 metabolites (positive ionization mode). Regular (circles) and cross-validated (squares) scores for the first predictive component (t[1] and tcv[1], respectively, linked by broken line) showing a separation between culture-positive typhoid (red) and fever control samples (grey) (p=0.025). (B) Column plot of the predicted scores for the first predictive component (tPS[1]) where culture-negative/suspected typhoid typhoid samples (n = 9) (blue columns) have been predicted into the model distinguishing between culture-positive typhoid (red) and fever control samples (grey); PCR-amplification-positive samples are identified by the blue stars.
Figure 2
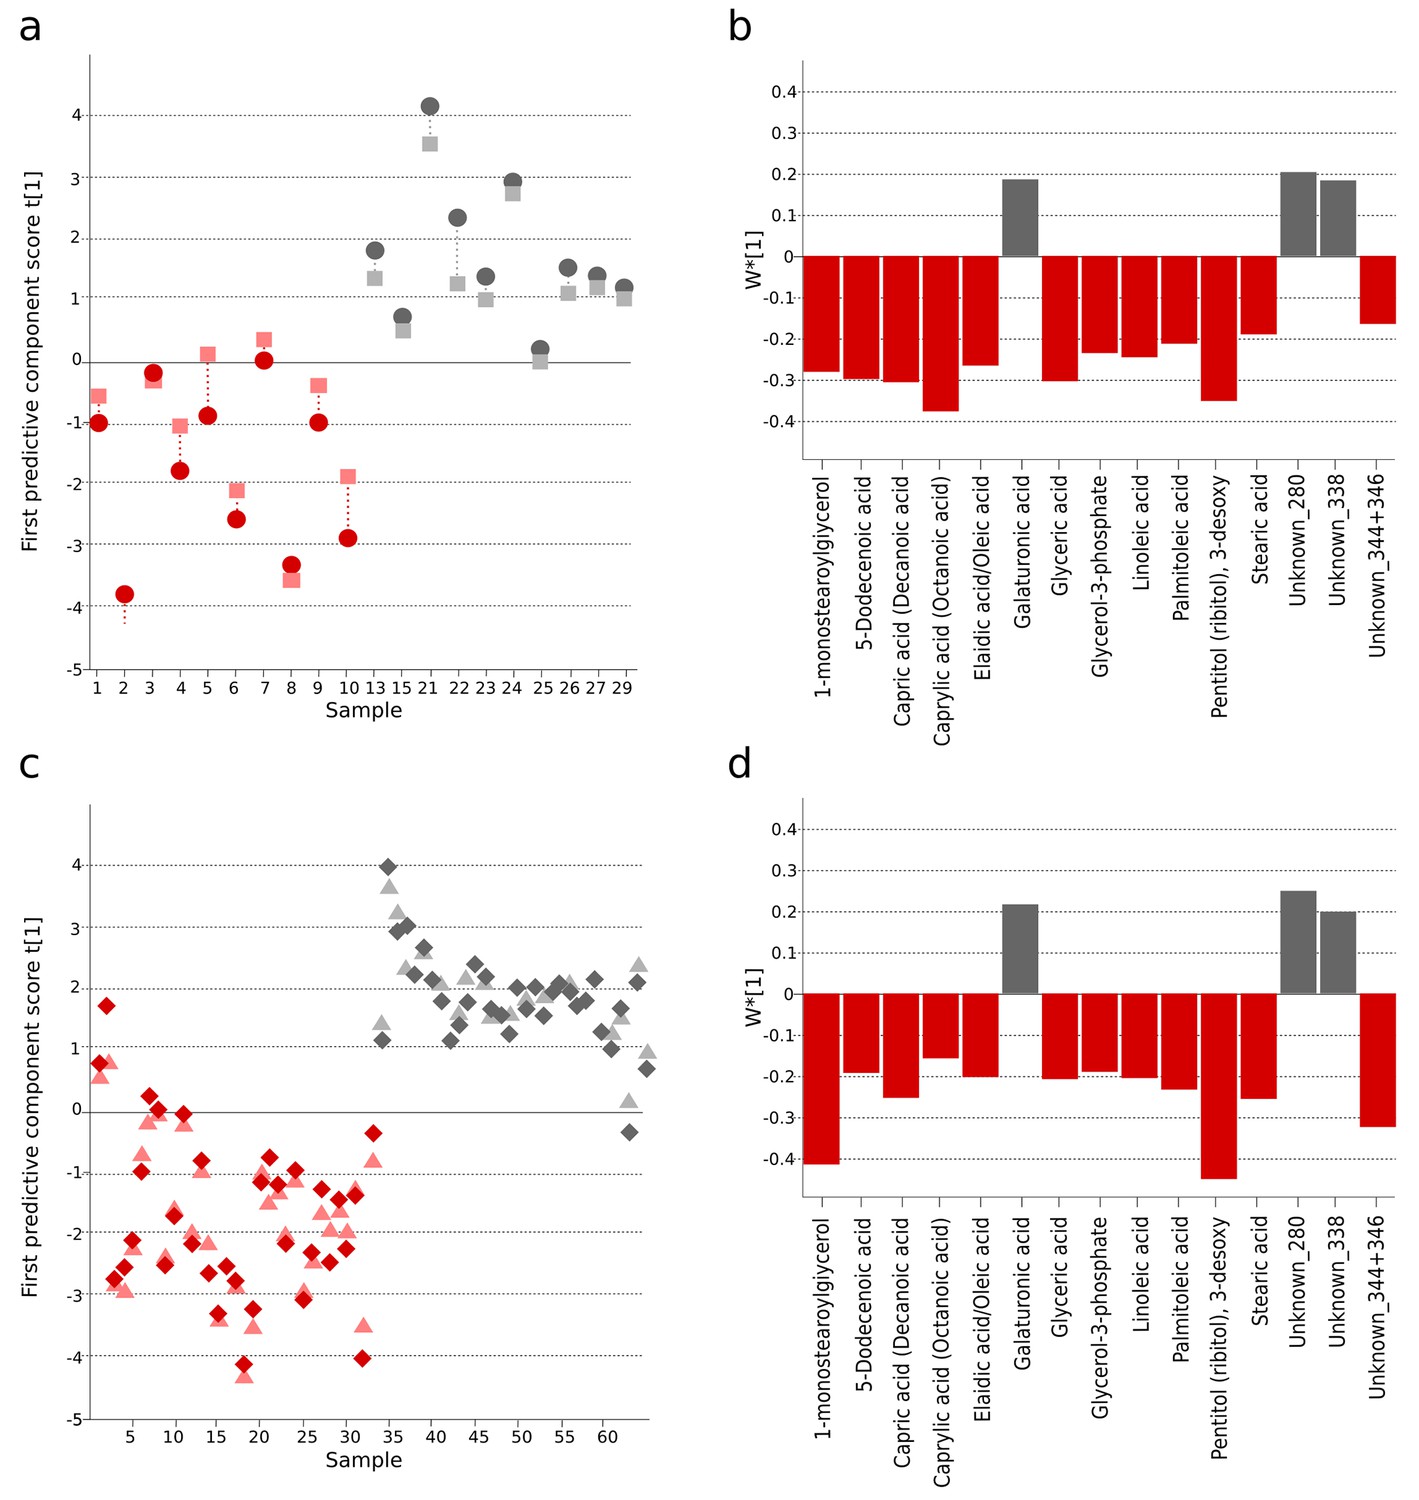
The identification and validation of typhoid diagnostic metabolites.
OPLS-DA models generated from GCxGC-TOFMS data using 15 informative metabolites from the current study (Bangladeshi cohort) and the previous study in Nepali cohort that were consistently up- or downregulated and significantly different in a multivariate model separating culture-positive S. Typhi patients from controls. (A) Regular (circles) and cross-validated (squares) scores for the first predictive component (t[1] and tcv[1], respectively, linked by broken line) showing a separation between culture-positive typhoid (red; n = 10) and fever control samples (grey; n = 10) (p=0.016) in the Bangladeshi cohort. (B) Column plot of model covariance loadings (w*[1]) for the first predictive component for the 15 common named metabolites in the Bangladeshi cohort, showing metabolites with a higher relative concentration in the culture-positive typhoid group in red and metabolites with a higher relative concentration in the fever control group in grey. (C) Regular (circles) and cross-validated (squares) scores for the first predictive component (t[1] and tcv[1], respectively, linked by broken line) showing a separation between culture-positive typhoid (red; n = 33 including eight analytical replicates) and afebrile control samples (grey; n = 32 including seven analytical replicates) (p<0.0001) from the Nepali cohort. (D) Column plot of model covariance loadings (w*[1]) for the first predictive component for the 15 common named metabolites in the Nepali cohort, showing metabolites with a higher relative concentration in the typhoid group in red and metabolites with a higher relative concentration in the afebrile control group in grey.
Figure 3 with 2 supplements
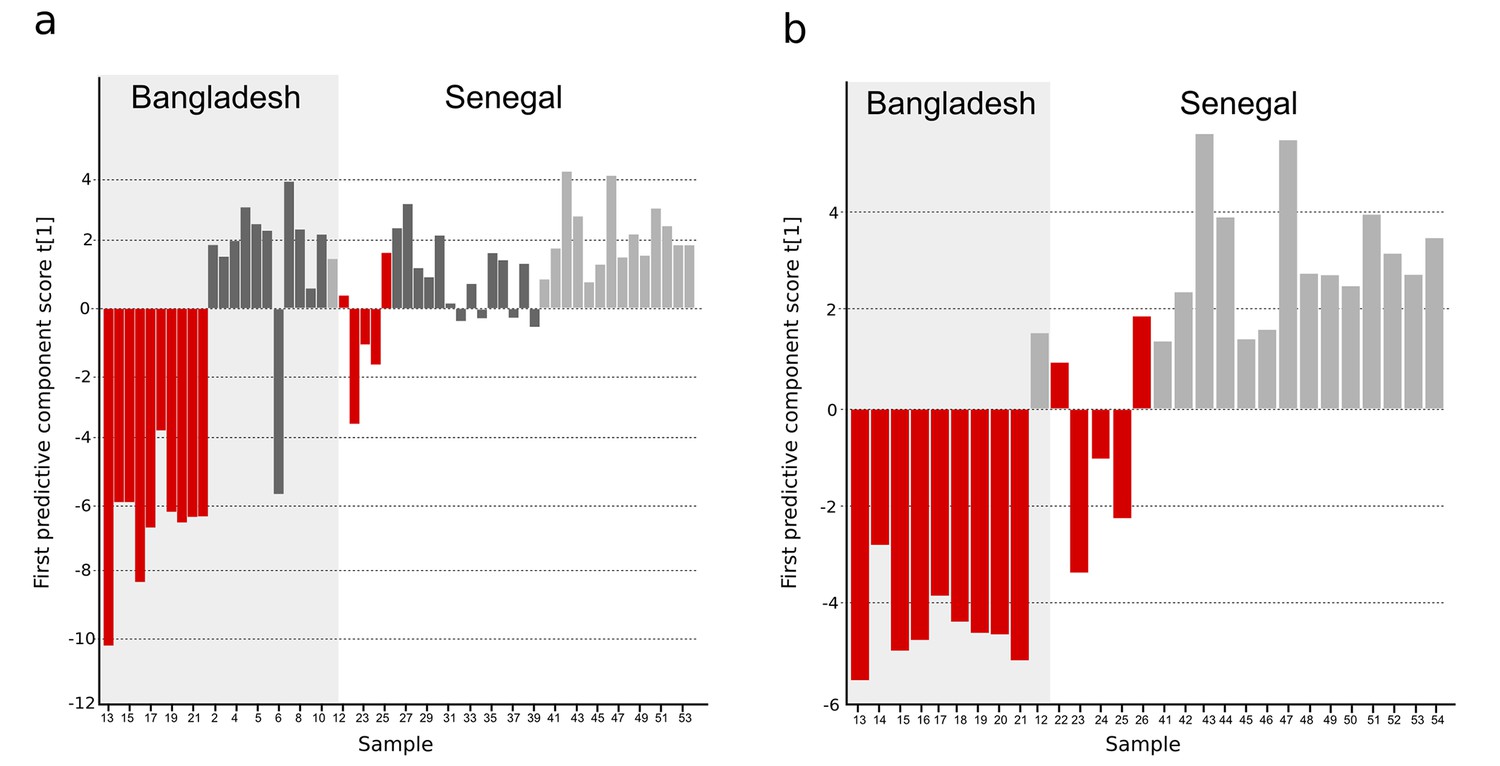
OPLS-DA models of plasma metabolites from Bangladeshi/Senegalese validation cohorts of patients with typhoid, malaria and other infections.
OPLS-DA models generated from GC-TOFMS using 104 metabolites. (A) Column plot of the first predictive component scores, t[1] showing a separation of typhoid infection samples (red; n = 14) from the two control groups; malaria (light grey; n = 15) and infections caused by other bacteria/pathogens (grey; n = 25) (p<0.0001). For the Bangladeshi samples, there is a clear separation except for one control sample behaving as a typhoid sample, there is more overlap for the Senegalese samples. (B) Column plot of the first predictive component scores, t[1] showing a separation of typhoid infection samples (red; n = 14) from malaria samples (light grey; n = 15) (p<0.001). There is a clear separation for the Bangladeshi samples and for the Senegalese samples except two typhoid samples behaving as malaria.
Figure 3—figure supplement 1
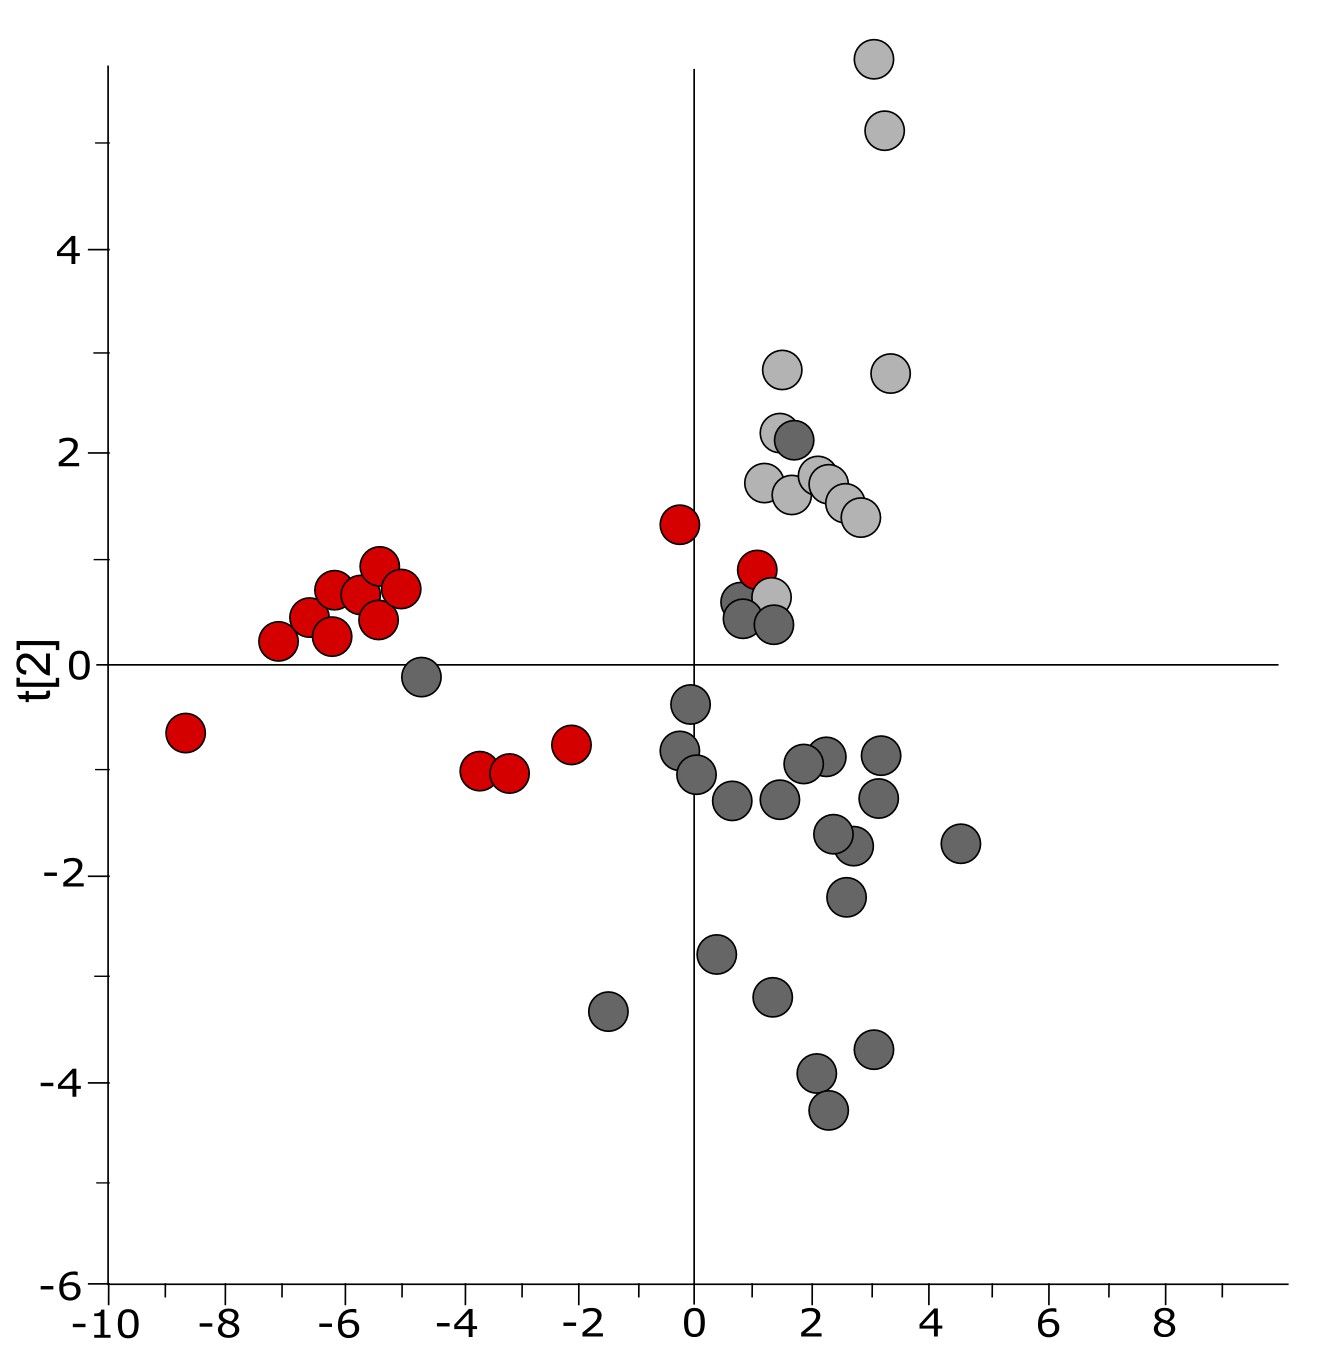
Three-class OPLS-DA model of GC-TOFMS data of plasma samples from a Bangladeshi/Senegalese validation cohort including patients with typhoid, malaria and other infections based on 104 metabolites.
Score plot with the scores of the two first predictive component, t[1] (x-axis) and t[2] (y-axis) showing a separation of typhoid infection samples, shown in red, from the two control groups (malaria, shown in light grey, and infections caused by other bacteria/pathogens, shown in dark grey) along the first component (with some overlap) and a separation of the malaria control group from the other infections control group along the second component (with some overlap) (p=0.0035).
Figure 3—figure supplement 2

Comparison of metabolites for three sample cohorts.
The metabolite pattern separating typhoid samples from controls in the Bangladeshi/Senegalese validation cohort was compared to the corresponding metabolite patterns in the Bangladeshi cohort in the current study and the Nepali cohort in the previous study to find metabolites that were consistently up- or downregulated and multivariate significant in the three cohorts. Column plots of first predictive component scores (t[1]) for OPLS-DA models separating typhoid samples (red) from controls (dark grey, including a malaria group in light grey in A) for (A) GC-TOFMS data of plasma samples from the Bangladeshi/Senegalese validation cohort based on 24 significant metabolites consistently up- or downregulated in the Bangladeshi/Senegalese cohort and the Bangladeshi cohort and/or the Nepali cohort (p<0.0001), (B) GCxGC-TOFMS data of plasma samples from the Bangladeshi cohort based on 13 significant metabolites consistently up- or downregulated in the Bangladeshi/Senegalese cohort and the Bangladeshi cohort (p=0.39) and (C) GCxGC-TOFMS data of plasma samples from the Nepali cohort based on 14 significant metabolites consistently up or downregulated in the Bangladeshi/Senegalese cohort and the Nepali cohort (p<0.0001). Five metabolites were consistently up or downregulated in all three cohorts.
Tables
Table 1
Patient group metadata for the Bangladeshi cohort.
| Clinical parameter* | Culture confirmed typhoid† (n = 10)¶ | Suspected typhoid‡ (n = 9) | Fever controls§ (n = 10) |
|---|---|---|---|
| Age (years) | 23 (20–30) | 22 (16–30) | 46 (20–65) |
| Sex (male) | 5 | 6 | 8 |
| Fever duration (days) | 7 (5–11) | 10 (6–12) | 5 (5–9) |
| Abdominal pain | 5 | 5 | 5 |
| Diarrhoea | 5 | 3 | 2 |
| Constipation | 1 | 4 | 2 |
| Vomiting | 5 | 7 | 3 |
| Cough | 2 | 1 | 7 |
| Rash | 0 | 2 | 0 |
| Dysuria | 0 | 0 | 2 |
| Headache | 6 | 4 | 6 |
| Seizure | 0 | 0 | 0 |
| Drowsy | 0 | 2 | 2 |
| Bloody stool/ Melaena | 1 | 0 | 1 |
| Confusion/unconscious | 0 | 1 | 0 |
| Axillary temperature (oC) | 38.6 (38.3–39.4) | 38.9 (38.5–39.4) | 38.6 (38.3–38.9) |
| Pulse (bpm) | 108 (97–114) | 100 (92–110) | 105 (86–123) |
| Jaundice | 0 | 1 | 1 |
| Hepatomegaly | 1 | 2 | 1 |
| Splenomegaly | 0 | 0 | 1 |
| Hb | 11.9 (10.4–12.9 | 12.0 (9.6–12.1) | 12.6 (10.4–14.0) |
| WBC | 6.6 (4.9–8.4) | 7.0 (4.2–8.5) | 14.4 (10.7–21.1) |
| Neutrophils (%) | 79 (70–81) | 70 (63–72) | 80 (78–88) |
| Lymphocytes (%) | 19 (15–26) | 25 (24–33) | 15 (8–18) |
| Monocytes (%) | 2 (2–3) | 2 (2–4) | 2 (2–4) |
| Eosinophils (%) | 1 (1–1) | 1 (1–2) | 1 (1–2) |
| Platelets | 170 (160–232) | 180 (160–265) | 280 (180–320) |
| Urea | 24.6 (21.4–28.0) | 24.1 (22.1–29.5) | 67.9 (21.4–81.2) |
| Creatinine | 0.9 0.6–1.0) | 0.9 (.7–1.0) | 1.6 (0.8–2.4) |
| AST | 101 (47–137) | 51 (33–199) | 32 (16–78) |
| ALT | 93 (48–137) | 36 (28–105) | 31 (20–43) |
| Complications** | 2 | 0 | 4 |
| Died†† | 0 | 0 | 2 |
-
*Median and interquartile range (IQR) for each patient group given for quantitative parameters and number of patients with presence of symptom/characteristics for qualitative parameters.
-
†Typhoid confirmed by a positive blood culture for S. Typhi.
-
‡Clinical suspected typhoid fever with a negative blood culture, final diagnoses included: Clinically suspected typhoid with blood PCR amplification positive for S. Typhi (3); clinical suspected typhoid (4); clinical suspected typhoid or leptospirosis (1); possible typhoid encephalopathy (1).
-
§Fever controls included: pneumonia (3), malaria (2), meningitis (2); sepsis (1), cellulitis (1), urinary tract infection (1).
-
¶One sample removed from analysis due to discrepant metabolite profile.
-
**Complications were: gastrointestinal bleeding and severe anaemia requiring transfusion in the typhoid group; respiratory failure, hepatorenal failure, septic shock and cardiopulmonary arrest, coma and cardiopulmonary arrest, and an acute myocardial infarction in the fever controls.
-
††Deaths in this group were associated with sepsis and malaria.
Additional files
-
Supplementary file 1
(A) Table of detected metabolites in plasma samples analyzed with GCxGC-TOFMS in the primary Bangladeshi cohort. (B) Overview of multivariate models. (C) Table of common metabolites between the Bangladeshi and the previous Nepali cohort using OPLS-DA models of culture-positive typhoid infection vs. control. (D) Table of detected metabolites in plasma samples analyzed with GC-TOFMS in the Bangladeshi/Senegalese validation cohort.
- https://doi.org/10.7554/eLife.15651.009
-
Supplementary file 2
Additional patient metadata and diagnoses.
- https://doi.org/10.7554/eLife.15651.010
-
Supplementary file 3
Additional materials and methods.
- https://doi.org/10.7554/eLife.15651.011
Download links
A two-part list of links to download the article, or parts of the article, in various formats.
Downloads (link to download the article as PDF)
Open citations (links to open the citations from this article in various online reference manager services)
Cite this article (links to download the citations from this article in formats compatible with various reference manager tools)
Reproducible diagnostic metabolites in plasma from typhoid fever patients in Asia and Africa
eLife 6:e15651.
https://doi.org/10.7554/eLife.15651


