Regulation of starvation-induced hyperactivity by insulin and glucagon signaling in adult Drosophila
- Zhejiang University, China
- University of California, Berkeley, United States
Figures
Figure 1

A neuron-specific RNAi screen for starvation-induced hyperactivity in adult Drosophila.
(a–b) The DAMS-based locomotion assay. (a) A single virgin female fly was hosted in a 5 × 65 mm polycarbonate tube, secured between 2% agar medium (with or without 5% sucrose) on one end and a piece of cotton on the other. The ruler was used for illustrating the size of the tube. (b) The tube was then inserted into the DAMS monitor (Trikinetics). One DAM2 monitor can hold 32 tubes at a time. The passage of flies through the middle of the tube was counted by an infrared beam. The frequency of midline crossings therefore indirectly measured flies’ locomotor activity. (c) The workflow of our RNAi screen. Note that UAS-RNAi transgenes were integrated into either the second or the third chromosome. (d) Summary of our RNAi screen (n = 29–48). For each line, their average daily midline crossing activity when fed ad libitum with 5% sucrose ('Baseline locomotion'), their activity upon starvation ('Locomotion upon starvation'), and the relative increase in locomotion ('Increase in locomotion') were listed. 'Control' is the progeny of GAL4 driver line crossed to a wild type strain. The statistical difference between fed vs. starved conditions were listed for each RNAi line. Data are shown as means ( ± SEM). NS, p>0.05; *p<0.05; **p<0.01; ***p<0.001.
Figure 2
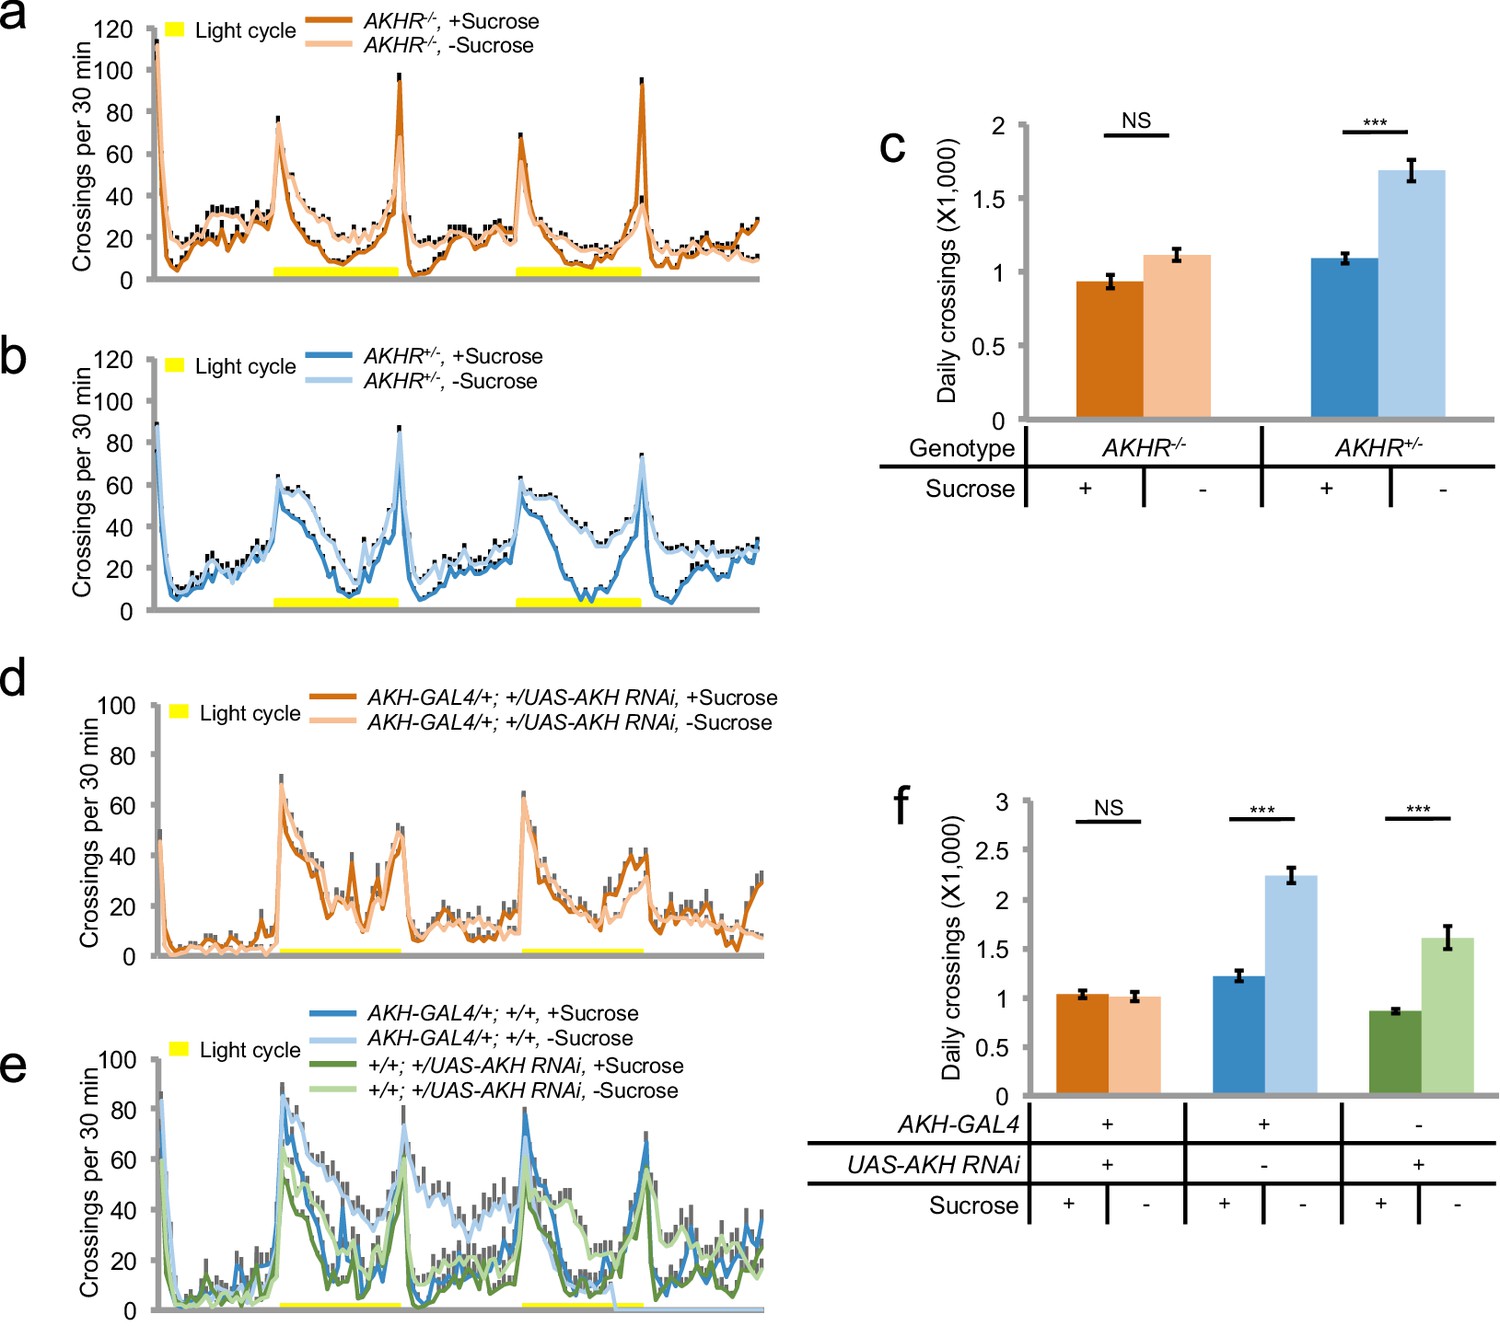
AKH-AKHR signaling is required for starvation-induced hyperactivity.
(a–b) Midline crossing activity of indicated genotypes assayed in the presence of 5% sucrose ('+Sucrose') or 2% agar ('+Sucrose') (n = 61–63). Yellow bars represent 12 hr light-on period in this and following figures. (c) Average daily midline crossing activity of flies assayed in a–b. (d–e) Midline crossing activity of indicated genotypes assayed in the presence of 5% sucrose ('+Sucrose') or 2% agar ('-Sucrose') (n = 24–30). (f) Average daily midline crossing activity of flies assayed in d–e. Error bars represent SEM. NS, p>0.05; ***p<0.001.
Figure 3 with 3 supplements
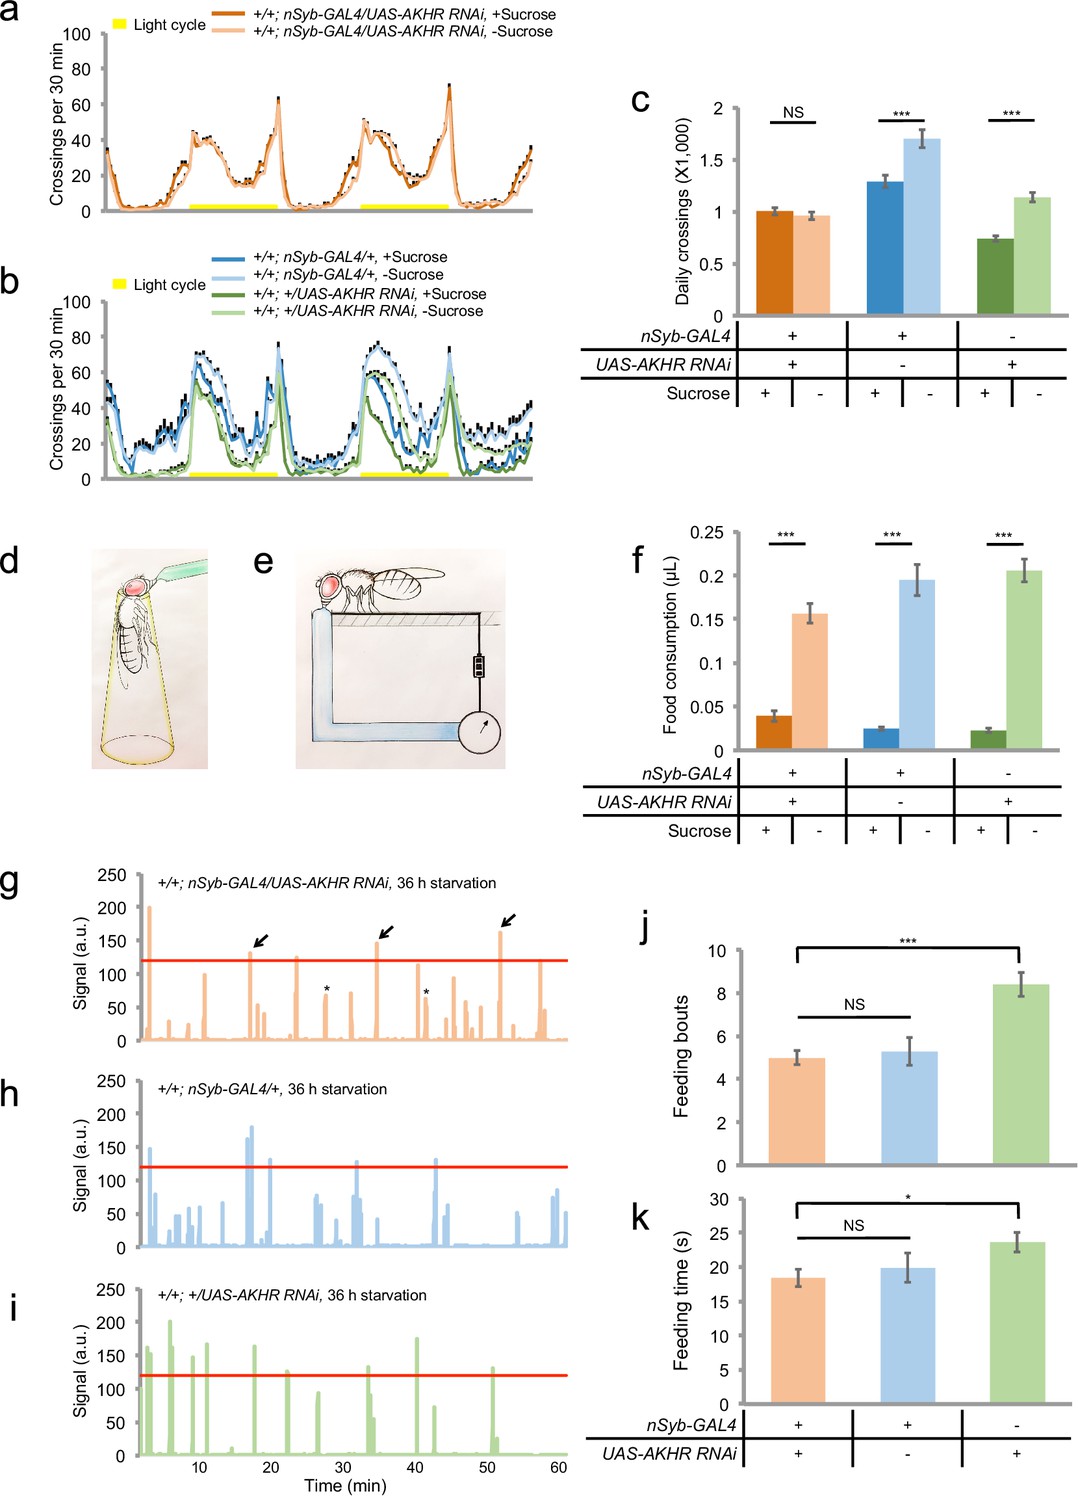
Neuronal AKHR is required for starvation-induced hyperactivity but not food consumption.
(a–b) Midline crossing activity of indicated genotypes assayed in the presence of 5% sucrose ('+Sucrose') or 2% agar ('-Sucrose') (n = 31–80). (c) Average daily midline crossing activity of flies assayed in a–b. (d–e) Schematic illustration of the MAFE assay (d) or the FLIC assay (e). (f) Volume of 800 mM sucrose consumed in a meal by indicated genotypes fed ad libitum with 5% sucrose, or starved for 36 hr using the MAFE assay. (n = 30–39). (g–i) Representative feeding plots of individual flies in the FLIC assay. Flies of the indicated genotypes were starved for 36 hr before the assays. The plots show the electrical current signals that reflected the physical contact between flies and the liquid food (800 mM sucrose). The a.u. higher than 120 (red line) was considered as feeding events (arrows). Asterisks indicate possible 'tasting/licking' events. (j–k) Number of feeding bouts (j) and total duration of feeding time (k) during 1 hr recording in the FLIC assay (n = 50–72). Note that one control genotype (green) exhibited higher levels of feeding likely due to the genetic background of nSyb-GAL4 we used. Error bars represent SEM. NS, p>0.05; *p<0.05; ***p<0.001.
Figure 3—figure supplement 1
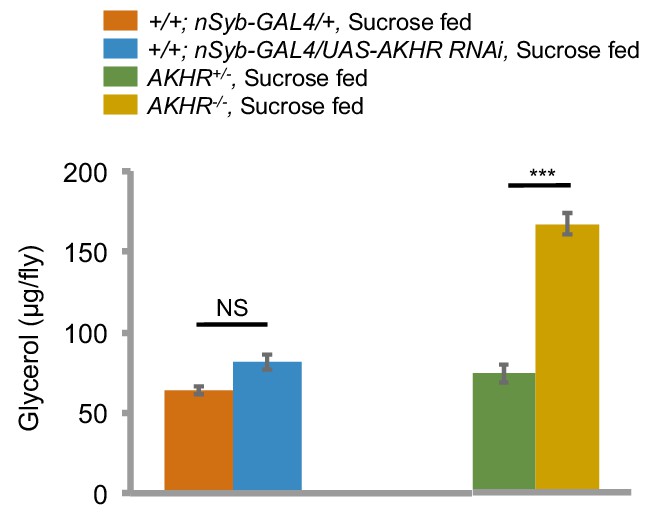
Neuronal AKHR is not involved in the regulation of fat storage.
Average amount of triglyceride of indicated genotypes fed ad libitum (n = 20–30). NS, p>0.05; ***p<0.001. For detailed protocols, please see Yang et al. (2015). Octopamine mediates starvation-induced hyperactivity in adult Drosophila. Proceedings of the National Academy of Sciences 112, 5219–5224.
Figure 3—figure supplement 2
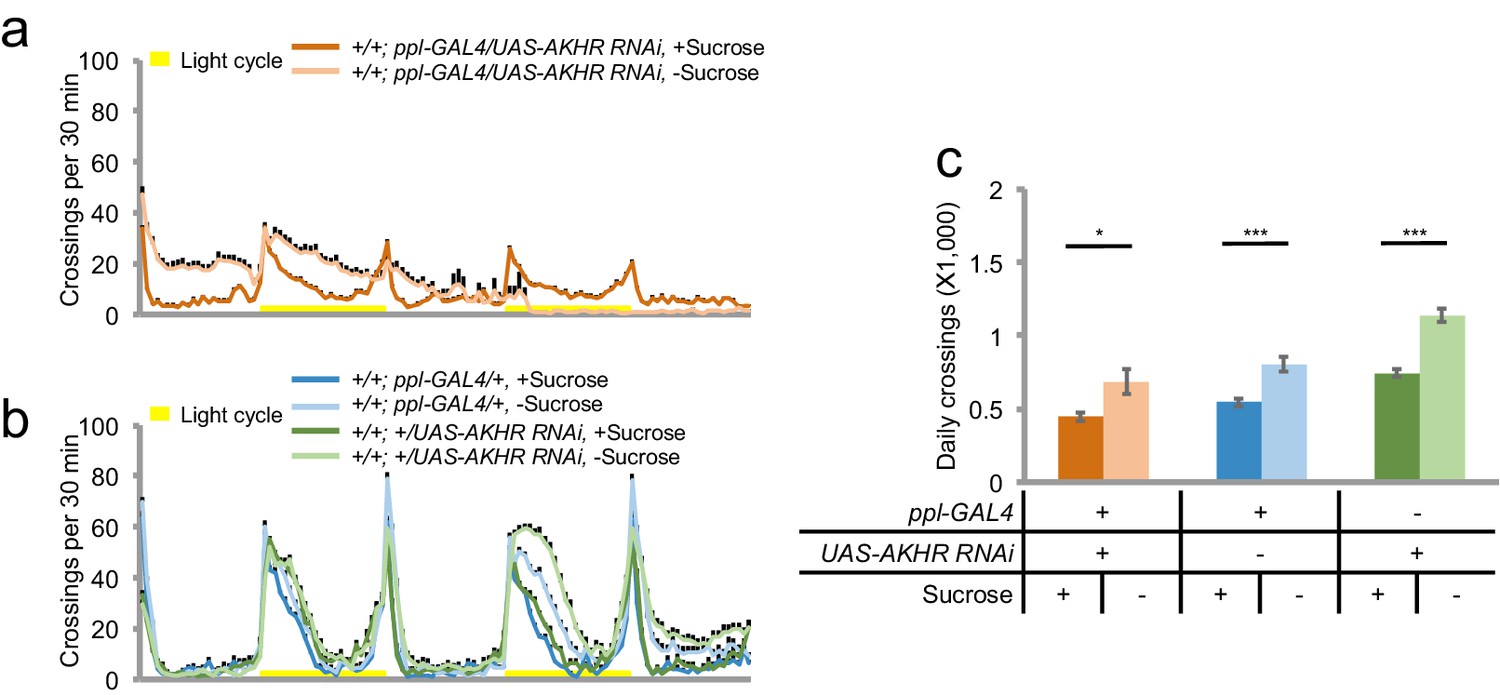
AKHR expressed in the fat body is not required for starvation-induced hyperactivity.
(a–b) Midline crossing activity of indicated genotypes assayed in the presence of 5% sucrose ('+Sucrose') or 2% agar ('-Sucrose') (n = 44–64). (c) Average daily midline crossing activity of flies assayed in a–b. *p<0.05; ***p<0.001.
Figure 3—figure supplement 3

Neuronal AKHR is required for starvation-induced hyperactivity but not the localization and occupation of food sources.
(a) Top view of a behavioral chamber (10 mm (D) × 4 mm (H)). The dashed circle outlines an agar patch ± 5% sucrose. (b–d) Spatial distribution of indicated genotypes assayed fed ad libitum in the presence of sucrose (first row), and starved flies assayed in the absence or presence of sucrose (second and third rows) (n = 10–20). The average walking velocity for each treatment was listed at the upper left corner (mm/s). Color temperature of the scale bar represents the percentage of time spent on each pixel for the duration of the assay (8 hr). (e) Walking velocity of flies assayed in b–d (n = 10–20).
Figure 4 with 1 supplement

AKHR+ neurons are required for starvation-induced hyperactivity.
(a, c) The expression of membrane-bound GFP (mCD8GFP) in AKHR+neurons in the anterior (a) and the posterior (c) part of the fly brain. The dashed box outlines the region of SEZ. (b, d) An enlarged image of the SEZ region seen in a and c. Note the cell bodies located in the ventrolateral side of the SEZ (arrowheads) and their Y-shaped projections (arrows) in b. Green: GFP. Magenta: nc82. Scale bars represent 20 μm in a–d. (e–f) Midline crossing activity of indicated genotypes assayed in the presence of 5% sucrose ('+Sucrose') or 2% agar ('-Sucrose') (n = 60–75). (g) Average daily midline crossing activity of flies assayed in e–f. (h) Volume of 800 mM sucrose consumed in a meal by indicated genotypes fed ad libitum with 5% sucrose, or starved for 24 hr using the MAFE assay (n = 18–40). (i–j) Number of feeding bouts (i) and total duration of feeding time (j) during 1 hr recording in the FLIC assay (n = 20–24). Error bars represent SEM. NS, p>0.05; ***p<0.001.
Figure 4—figure supplement 1
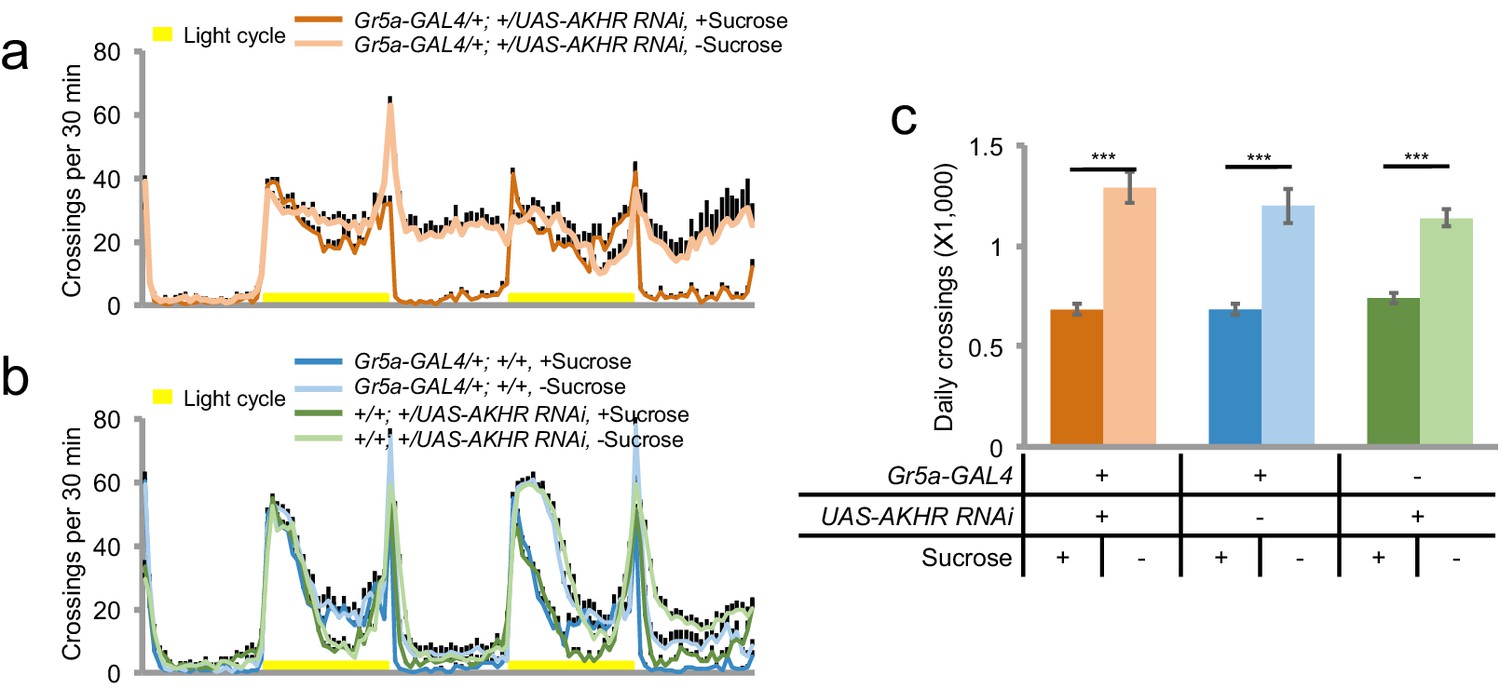
AKHR expressed in Gr5a+ gustatory sensory neurons is not required for starvation-induced hyperactivity.
(a–b) Midline crossing activity of indicated genotypes assayed in the presence of 5% sucrose ('+Sucrose') or 2% agar ('-Sucrose') (n = 46–64). (c) Average daily midline crossing activity of flies assayed in a–b. ***p<0.001.
Figure 5 with 1 supplement
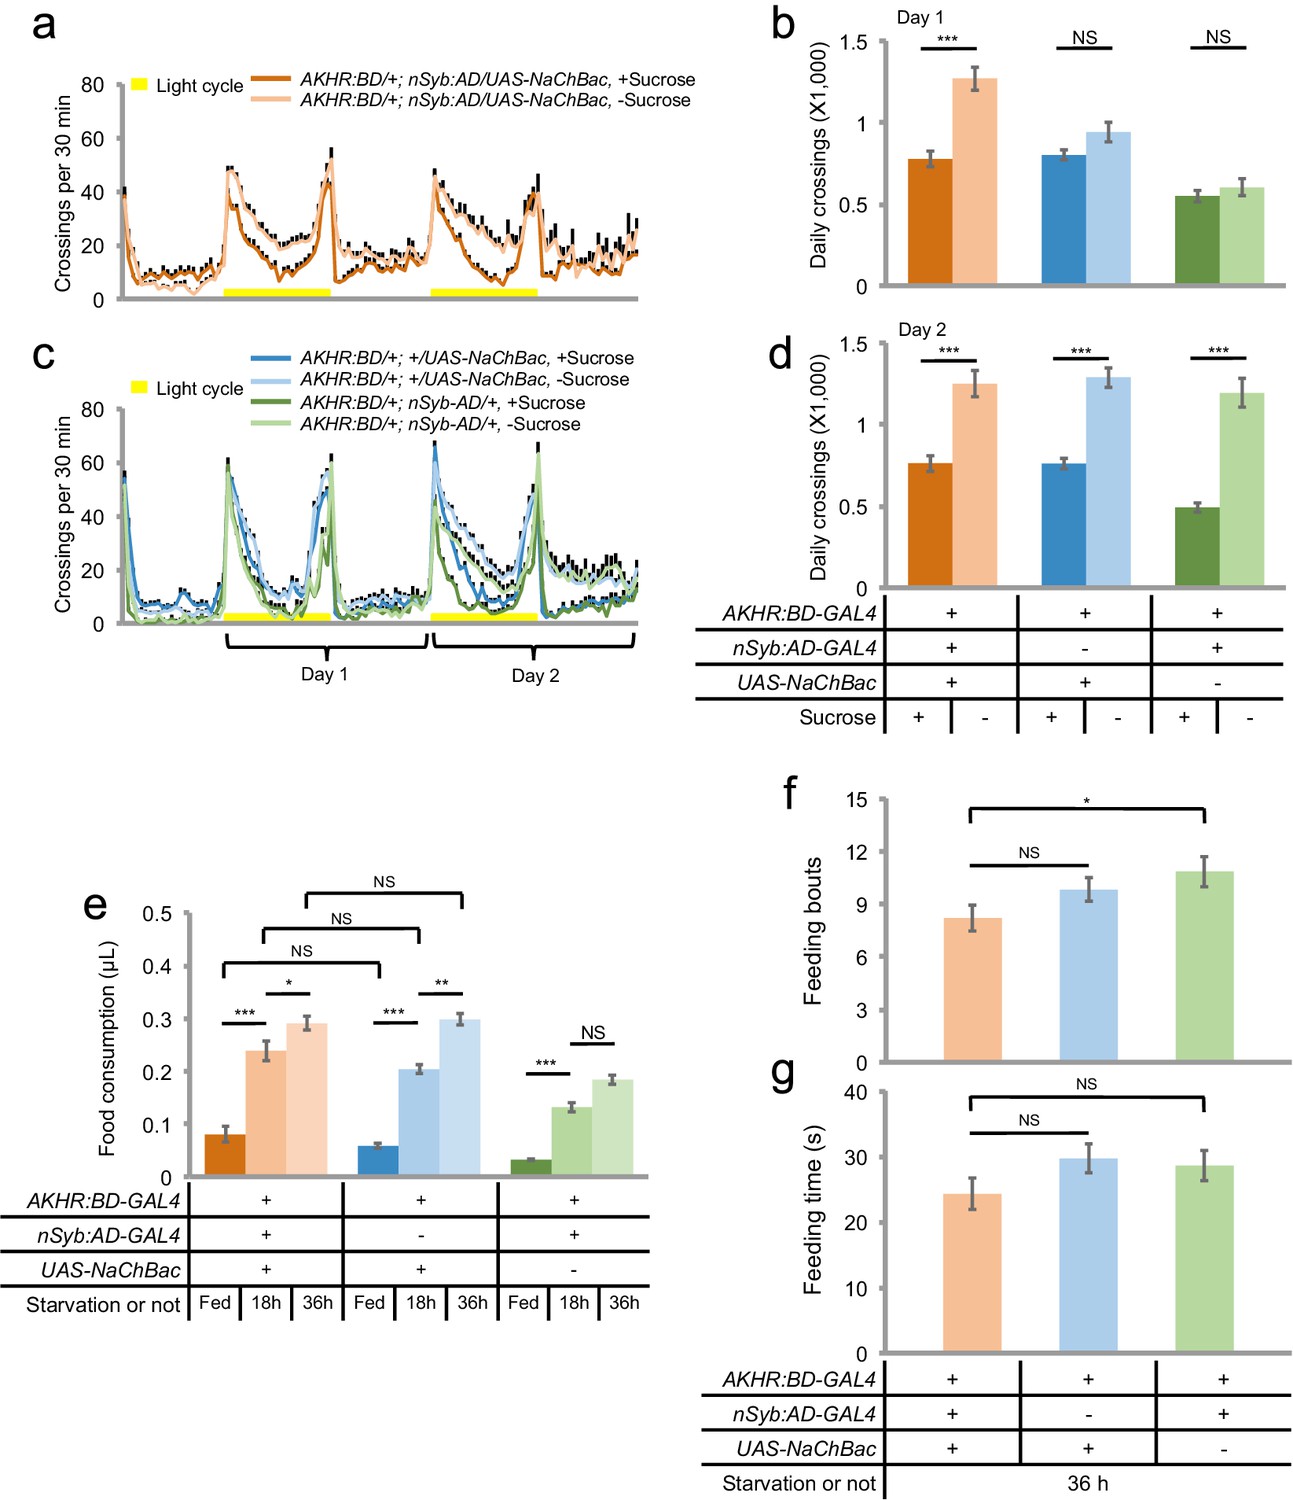
AKHR+ neurons promote starvation-induced hyperactivity.
(a, c) Midline crossing activity of indicated genotypes assayed in the presence of 5% sucrose ('+Sucrose') or 2% agar ('-Sucrose') (n = 48–80). (b, d) Average daily midline crossing activity during Day one (b) and Day two (d) of flies assayed in a, c. (e) Volume of 800 mM sucrose consumed in a meal by indicated genotypes fed ad libitum with 5% sucrose, or starved for 18 and 36 hr using the MAFE assay (n = 38–52). (f–g) Number of feeding bouts (f) and total duration of feeding time (g) during 1 hr recording in the FLIC assay (n = 54–60). Error bars represent SEM. NS, p>0.05; *p<0.05; **p<0.01; ***p<0.001.
Figure 5—figure supplement 1

AKHR over-expression in AKHR+ neuron accelerates starvation-induced hyperactivity.
(a–b) Midline crossing activity of indicated genotypes assayed in the presence of 5% sucrose ('+Sucrose') or 2% agar ('-Sucrose') (n = 46–48). (c–e) Average daily midline crossing activity of flies assayed in a–b, breaking down to three different time windows (Day one-Daytime, Day one-Nighttime, Day two). NS, p>0.05; *p<0.05; **p<0.01; ***p<0.001.
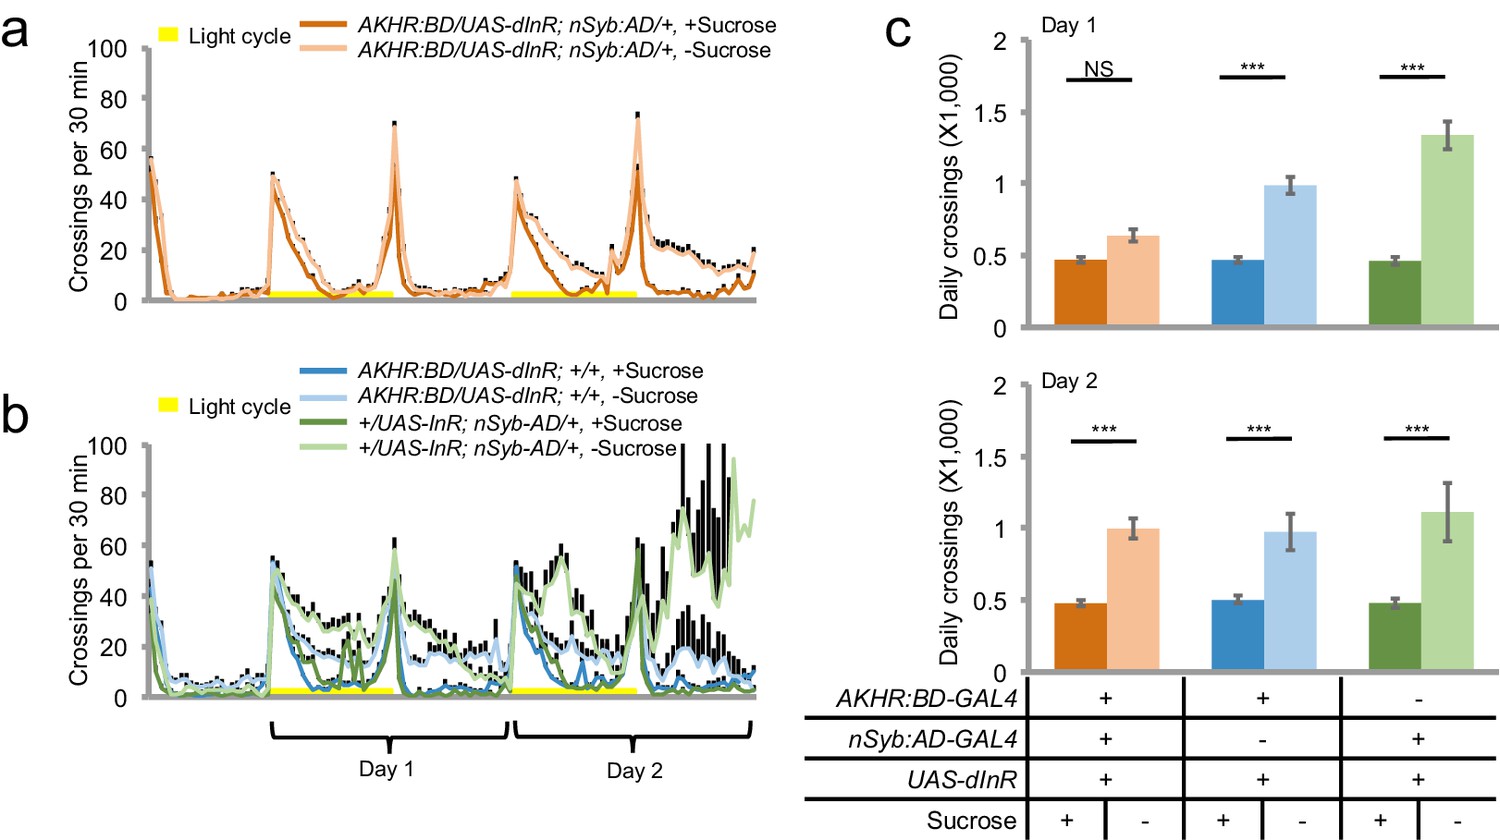
Figure 6 with 3 supplements
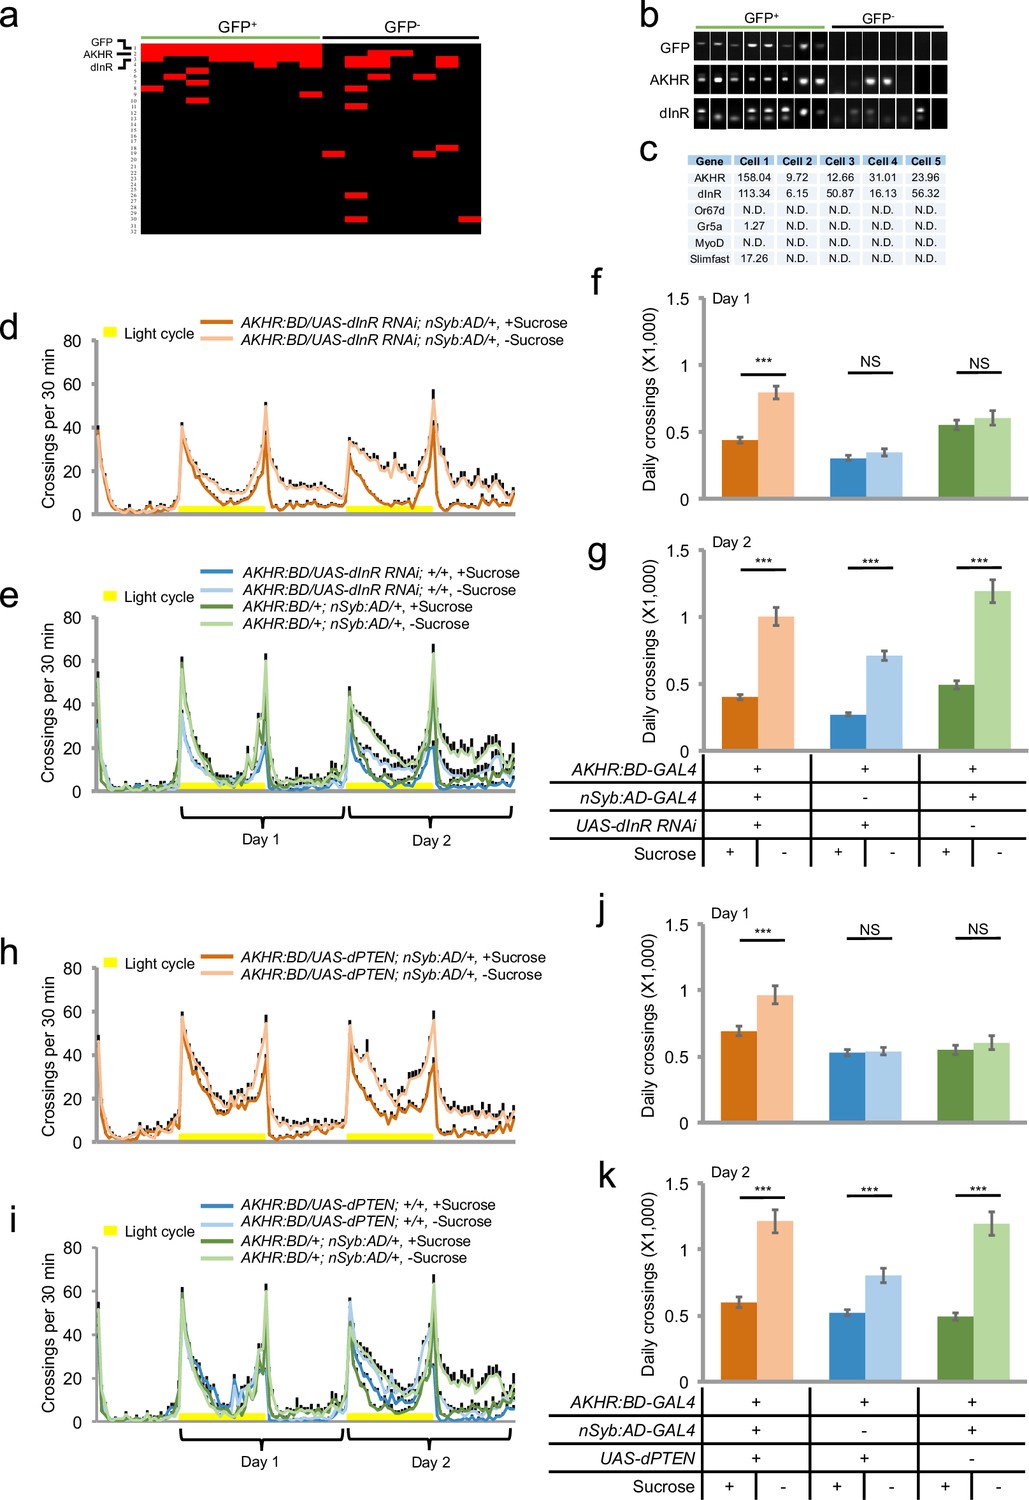
Insulin signaling suppresses starvation-induced hyperactivity via AKHR+ neurons.
(a) Heat map indicating the expression pattern of neuropeptide receptors we examined in individual AKHR+ (green) and AKHR- (black) neurons. Red and black blocks represent genes that could and could not be detected by RT-PCR, respectively. For a complete list of all 32 genes we examined see Supplementary file 1. The first three genes, GFP, AKHR, and dInR are indicated in bold. (b) Representative RT-PCR bands for indicated genes shown in a. Note that the lower bands in the 'dInR' row are primer dimers. (c) Gene expression in five GFP+ cells assayed by RNA-seq (shown in RPKM). Or67d and Gr5a are expressed in the primary sensory neurons; MyoD in muscle; and Slimfast in the fat body. (d–e) Midline crossing activity of indicated genotypes assayed in the presence of 5% sucrose ('+Sucrose') or 2% agar ('-Sucrose') (n = 48–80). (f–g) Average daily midline crossing activity during Day one and Day two of flies assayed in d–e. (h–i) Midline crossing activity of indicated genotypes assayed in the presence of 5% sucrose ('+Sucrose') or 2% agar ('-Sucrose') (n = 48–80). (j–k) Average daily midline crossing activity during Day one and Day two of flies assayed in h–i. Error bars represent SEM. NS, p>0.05; ***p<0.001.
Figure 6—figure supplement 1
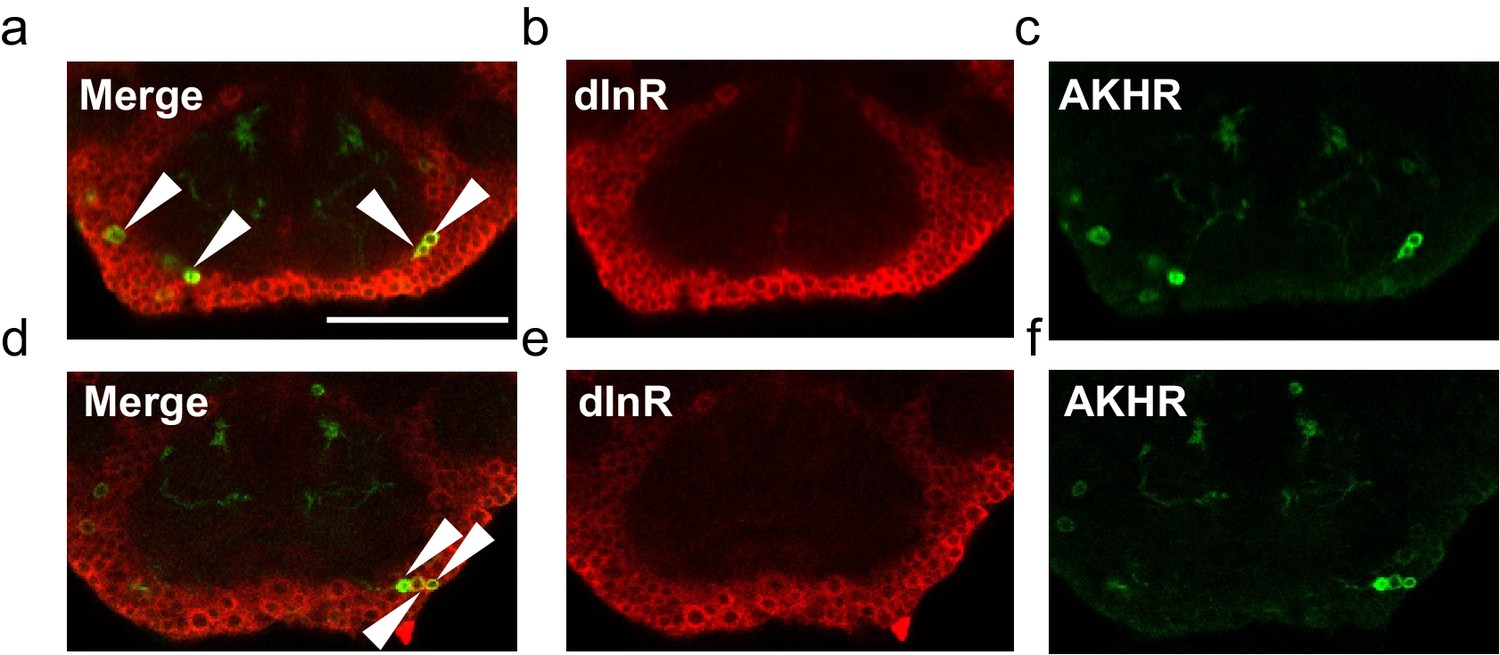
Co-localization of AKHR and dInR in the fly brain.
Two representative series are shown (upper and lower rows). (a, d) Merged images, showing the co-localization of dInR (red) and AKHR (green) in the SEZ (arrowheads). dInR expression was shown by antibody staining (b, e). GFP expression was driven by the nSyb:AD/AKHR:BD-GAL4 driver (c, f). Scale bars represent 20 μm.
Figure 6—figure supplement 2
dInR over-expression in AKHR+ neuron delays starvation-induced hyperactivity.
(a–b) Midline crossing activity of indicated genotypes assayed in the presence of 5% sucrose ('+Sucrose') or 2% agar ('-Sucrose') (n = 41–64). (c–d) Average daily midline crossing activity during Day one and Day two of flies assayed in a–b. NS, p>0.05; ***p<0.001.
Figure 6—figure supplement 3

DMS-R2 in AKHR+ neurons is not required for starvation-induced hyperactivity.
(a–b) Midline crossing activity of indicated genotypes assayed in the presence of 5% sucrose ('+Sucrose') or 2% agar ('-Sucrose') (n = 48). (c) Average daily midline crossing activity of flies assayed in a–b. **p<0.01; ***p<0.001.
Figure 7 with 1 supplement
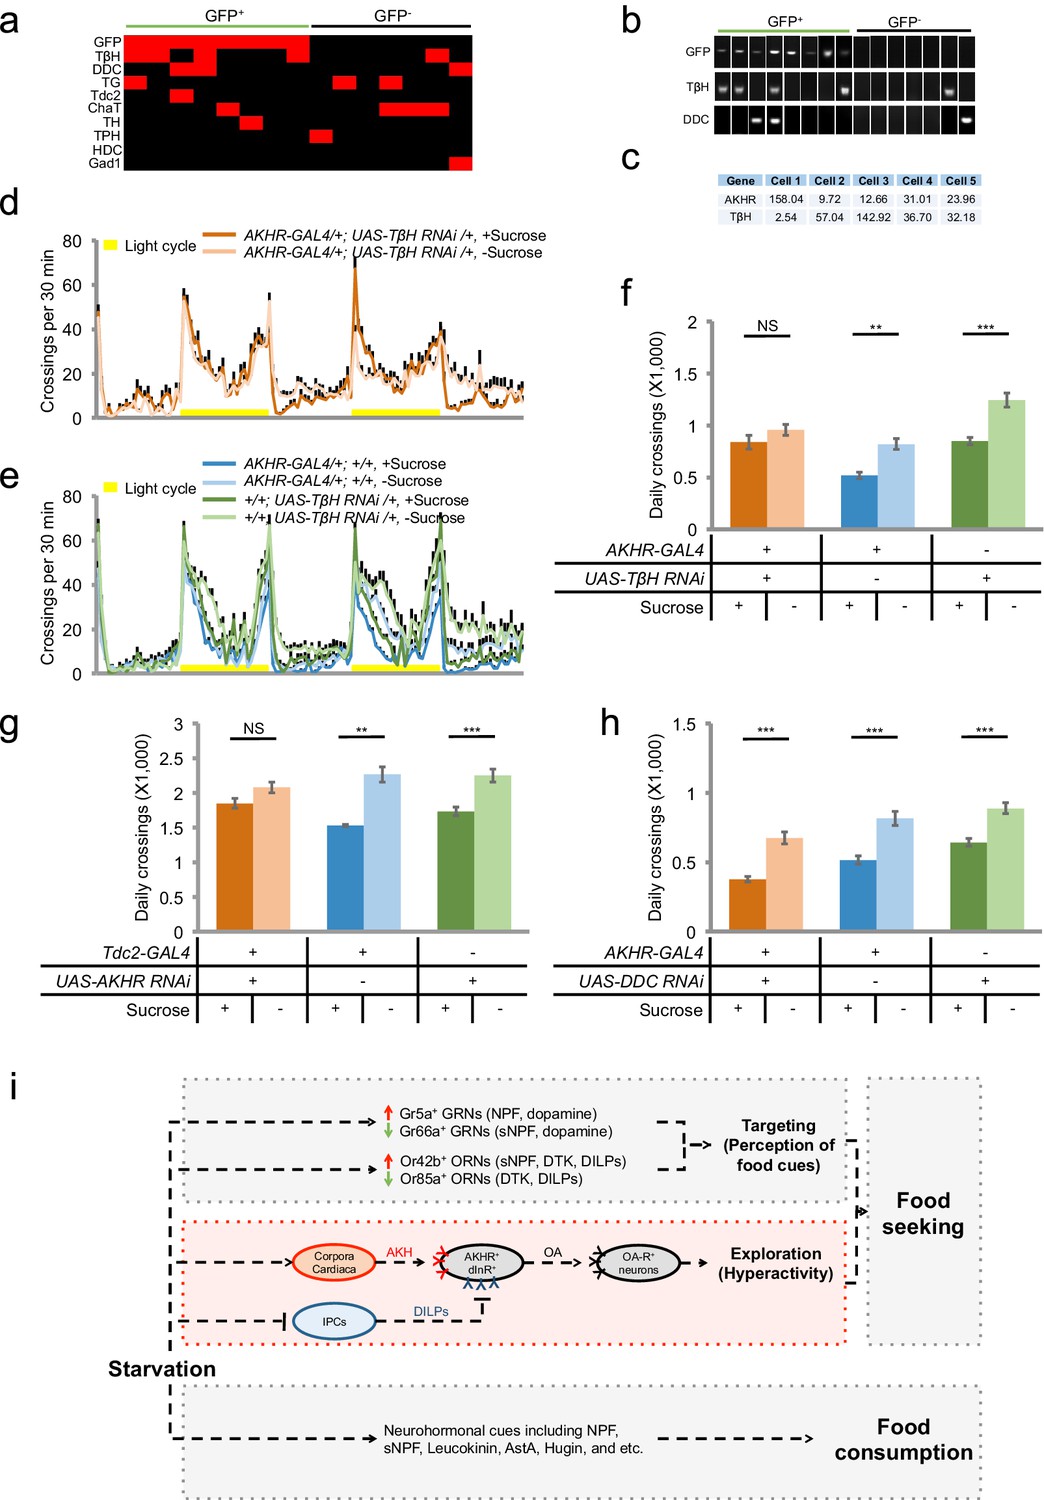
Octopamine mediates the effect of AKHR+ neurons on starvation-induced hyperactivity.
(a) Heat map indicating the expression of neurotransmitter related genes in individual AKHR+ and AKHR- neurons. Red and black blocks represent genes that could and could not be detected by RT-PCR, respectively. For a complete list of all 10 genes we examined see Supplementary file 1. (b) Representative RT-PCR bands for indicated genes shown in a. (c) Gene expression in five GFP+ cells assayed by RNA-seq (shown in RPKM). (d–e) Midline crossing activity of indicated genotypes assayed in the presence of 5% sucrose ('+Sucrose') or 2% agar ('-Sucrose') (n = 38–48). (f) Average daily midline crossing activity of indicated genotypes in d–e. (g–h) Average daily midline crossing activity of indicated genotypes (n = 43–65). (i) A working model. Starvation promotes both food seeking and food consumption. Food seeking has two components: food targeting (i.e. perception of food cues) and environmental exploration (i.e. hyperactivity). In this present study (highlighted in red), we have shown that a small group of octopaminergic neurons located in the fly brain are both necessary and sufficient for starvation-induced hyperactivity, an important aspect of food seeking. These neurons express AKHR and dInR, the receptors of AKH and DILPs, respectively. These neurons are octopaminergic (OA), and likely exert their behavioral effect via downstream neurons expressing certain octopamine receptor(s) (OA-R). It is worth noting that the regulation of starvation-induced hyperactivity is independent from that of food consumption, and vice versa. NS, p>0.05; **p<0.01; ***p<0.001.
Figure 7—figure supplement 1
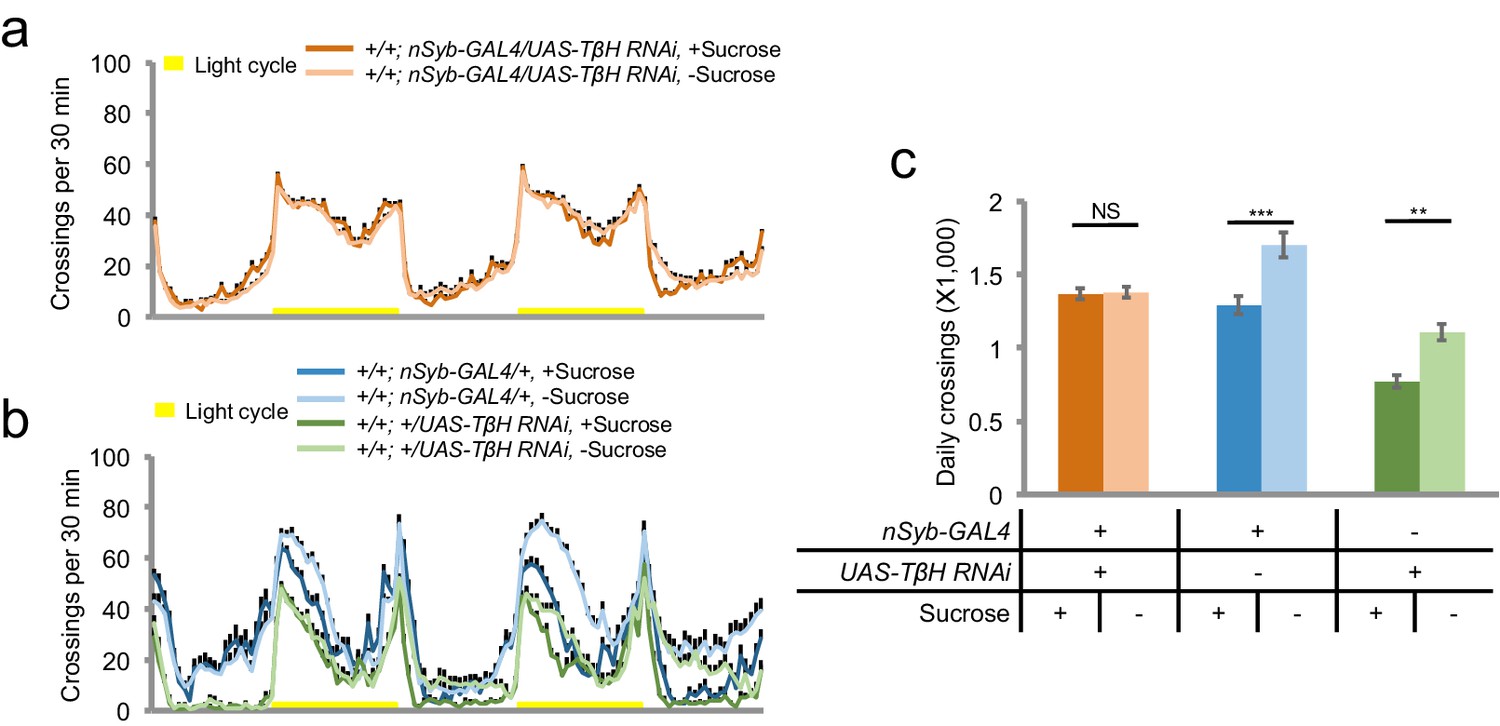
TβH is required for starvation-induced hyperactivity.
(a–b) Midline crossing activity of indicated genotypes assayed in the presence of 5% sucrose ('+Sucrose') or 2% agar ('-Sucrose') (n = 31–77). (c) Average daily midline crossing activity of flies assayed in a–b. NS, p>0.05; **p<0.01; ***p<0.001.
Additional files
-
Supplementary file 1
Additional behavioral data and primer sequences.
(A) Baseline locomotion for Figure 1 Summary of our RNAi screen (n = 29–48). For each line, their average daily midline crossing activity when fed ad libitum with 5% sucrose ('Baseline locomotion') was listed. The statistical difference between each RNAi line vs. the Control strain was listed. 'Control' is the progeny of the elav-GAL4 driver line crossed to a wild type strain. Data are shown as means ( ± SEM). NS, p>0.05; *p<0.05; **p<0.01; ***p<0.001. (B) Primers for Figure 6a–b List of candidate neuropeptide receptor genes, their putative ligands, and the primers used for RT-PCR analysis shown in Figure 6a–b. (C). Primers for Figure 7a–b List of candidate neurotransmitter related genes and the primers used for RT-PCR analysis shown in Figure 7a–b.
- https://doi.org/10.7554/eLife.15693.019
Download links
A two-part list of links to download the article, or parts of the article, in various formats.
Downloads (link to download the article as PDF)
Open citations (links to open the citations from this article in various online reference manager services)
Cite this article (links to download the citations from this article in formats compatible with various reference manager tools)
Regulation of starvation-induced hyperactivity by insulin and glucagon signaling in adult Drosophila
eLife 5:e15693.
https://doi.org/10.7554/eLife.15693


