The Lamin B receptor is essential for cholesterol synthesis and perturbed by disease-causing mutations
- Yale University, United States
- Yale School of Medicine, United States
Figures
Figure 1

Cholesterol biosynthesis pathway.
Simplified schematic of cholesterol biosynthesis starting from Acetyl-CoA. After 13 enzymatic steps, the intermediate Lanosterol can enter one of two parallel pathways designated Bloch and Kandutsch-Russel pathways, respectively, both of which employ an NADPH-dependent reduction step which can be catalyzed by sterol C14 reductases LBR or TM7SF2 (highlighted in magenta). Adapted, with modifications, from (Sharpe and Brown, 2013). The inset on the upper right depicts distinct subcellular localizations of the human sterol reductases LBR and TM7SF2 localizing to the inner nuclear membrane and ER, respectively.
Figure 2 with 3 supplements
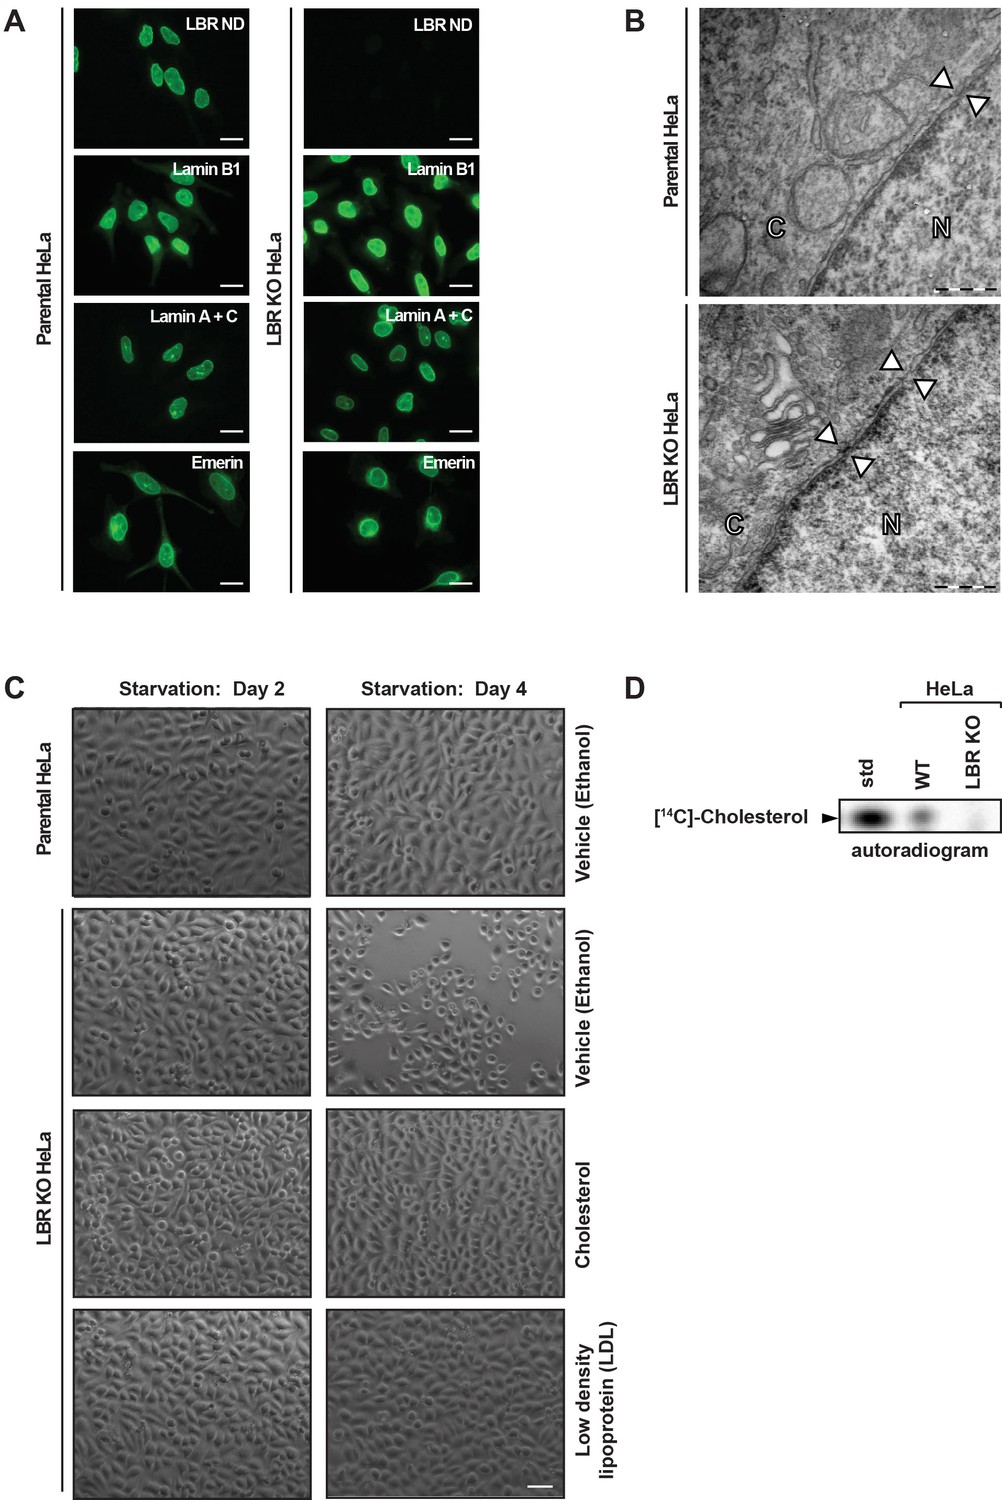
LBR deficient cells display normal nuclear envelope morphology but are sensitive to cholesterol restriction.
(A) HeLa WT and HeLa LBR KO cells were stained with antibodies against LBR using an antibody recognizing the N-terminal domain (ND), Lamin B1, Lamin A/C, and Emerin and then imaged by immunofluorescence microscopy. Scale bar = 10 μm. (B) EM images of WT and LBR KO HeLa cells. The nucleus (N) and cytosol (C) are labeled and nuclear pores are indicated by arrowheads. Scale bar = 500 nm. (C) Indicated cell lines were cultured under cholesterol-restrictive growth conditions for two days, imaged by bright-field microscopy, and cultured for 2 more days under cholesterol restrictive conditions, and imaged again. Cells were exposed either to vehicle, free cholesterol or LDL (10 µM) for four days as indicated. Scale bar = 50 µm. (D) HeLa WT and LBR KO cells in LPDS-containing medium were metabolically labeled with [14C]-acetate. Lipids were extracted and separated by TLC and visualized via autoradiography. [14C]-cholesterol was included as a standard (std).
Figure 2—figure supplement 1
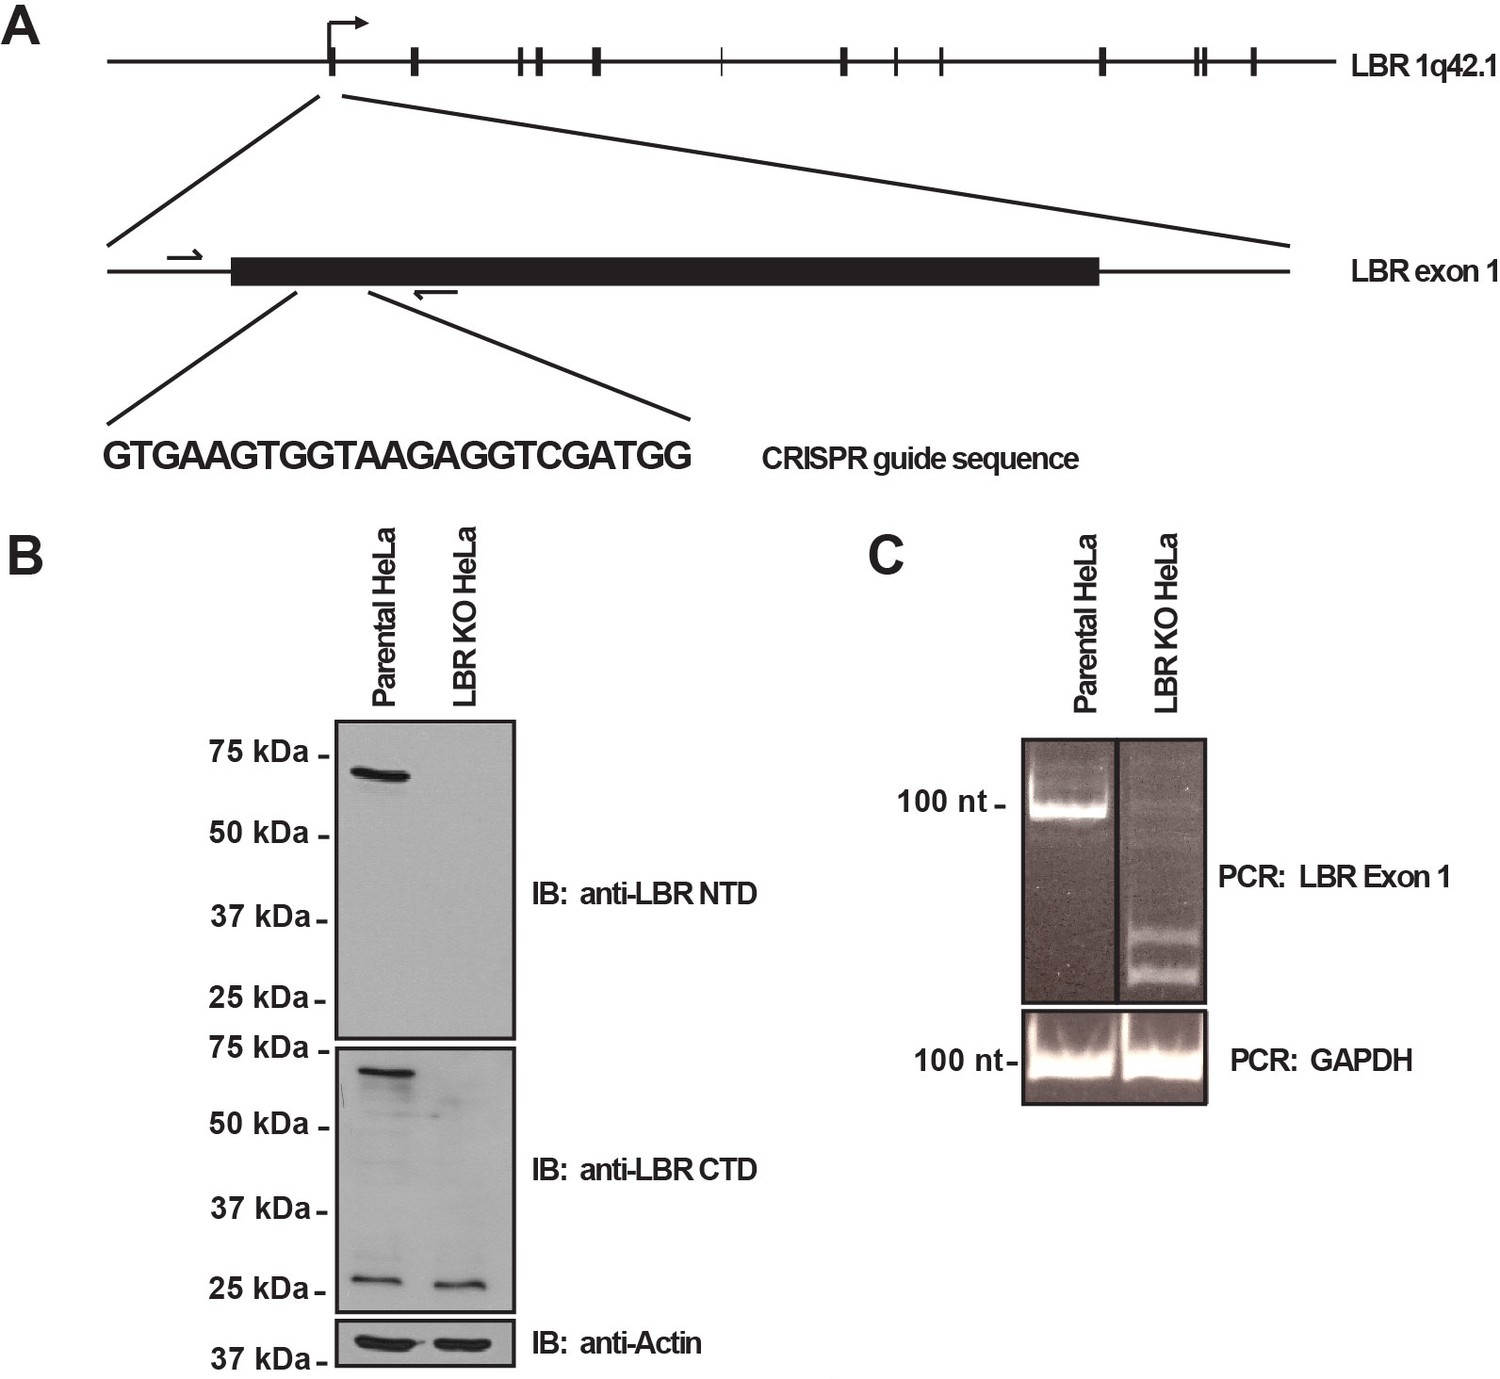
LBR knockout cells were generated using the CRISPR/Cas9 genome editing system.
(A) Schematic diagram encompassing the human LBR locus. Shown are the CRISPR guide RNA sequence used to create the knockout and the flanking genotyping PCR primers used to amplify the targeted region. Exons are black boxes, introns are black lines, and PCR primers are half arrows. (B) Parental and LBR knockout cells were harvested and analyzed for the presence of LBR protein by SDS-PAGE followed by immunoblotting (IB) using antibodies raised against the N-terminal domain (top) and C-terminal domain (bottom) of LBR. Blots were stripped and probed for β-actin as a loading control. (C) Genotyping PCR of the targeted LBR locus using primers shown in panel A for parental and LBR knockout cells. GAPDH was used as a loading control.
Figure 2—figure supplement 2
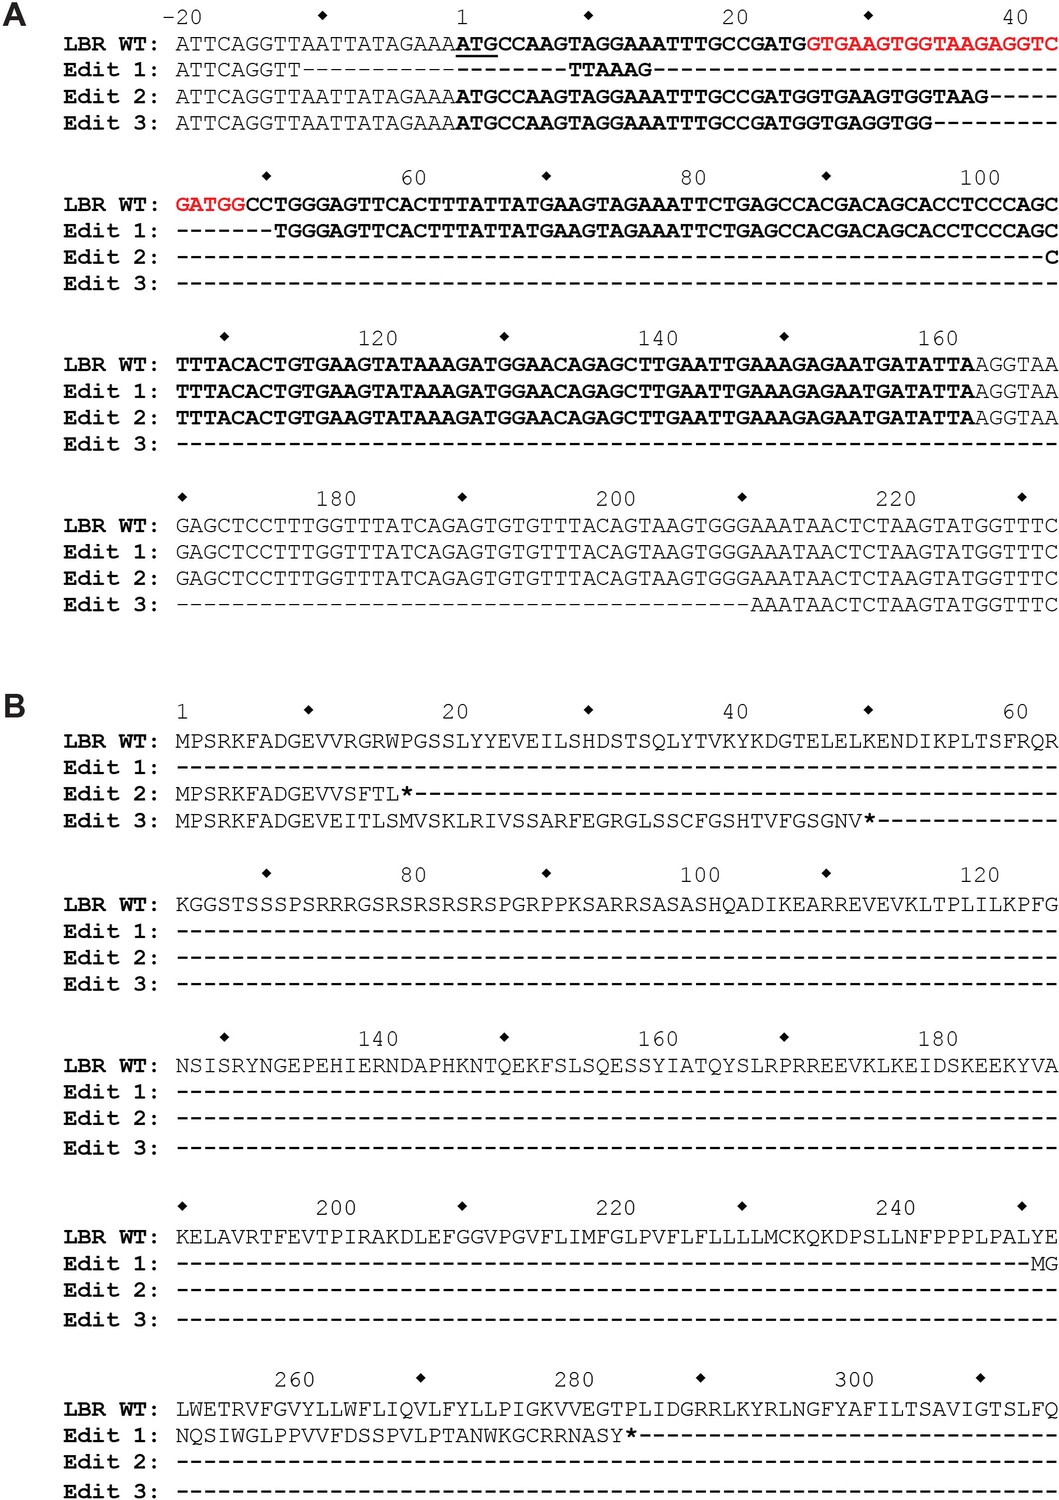
The genomic LBR CRISPR target site of LBR KO HeLa cells was analyzed using Illumina MiSeq.
(A) At the nucleotide level, three different mutations, designated Edit 1, Edit 2, and Edit 3, each corresponding to one of the three copies of LBR found in HeLa cells, were detected. The first mutation completely removes the LBR start codon, while the second two mutations are large out-of-frame deletions, the second of which removes the exon 1 5’ splice site. (B) At the protein level, Edit 1 results in the translation of a 34 amino acid out-of-frame peptide from an internal start codon located at p.251. Edit 2 results in the truncation of LBR at position p.17, and Edit 3 results in the correct translation of the first 11 amino acids of LBR, followed by 38 amino acids translated from LBR intron 1, with the introduction of a premature stop codon at LBR p.50.
Figure 2—figure supplement 3
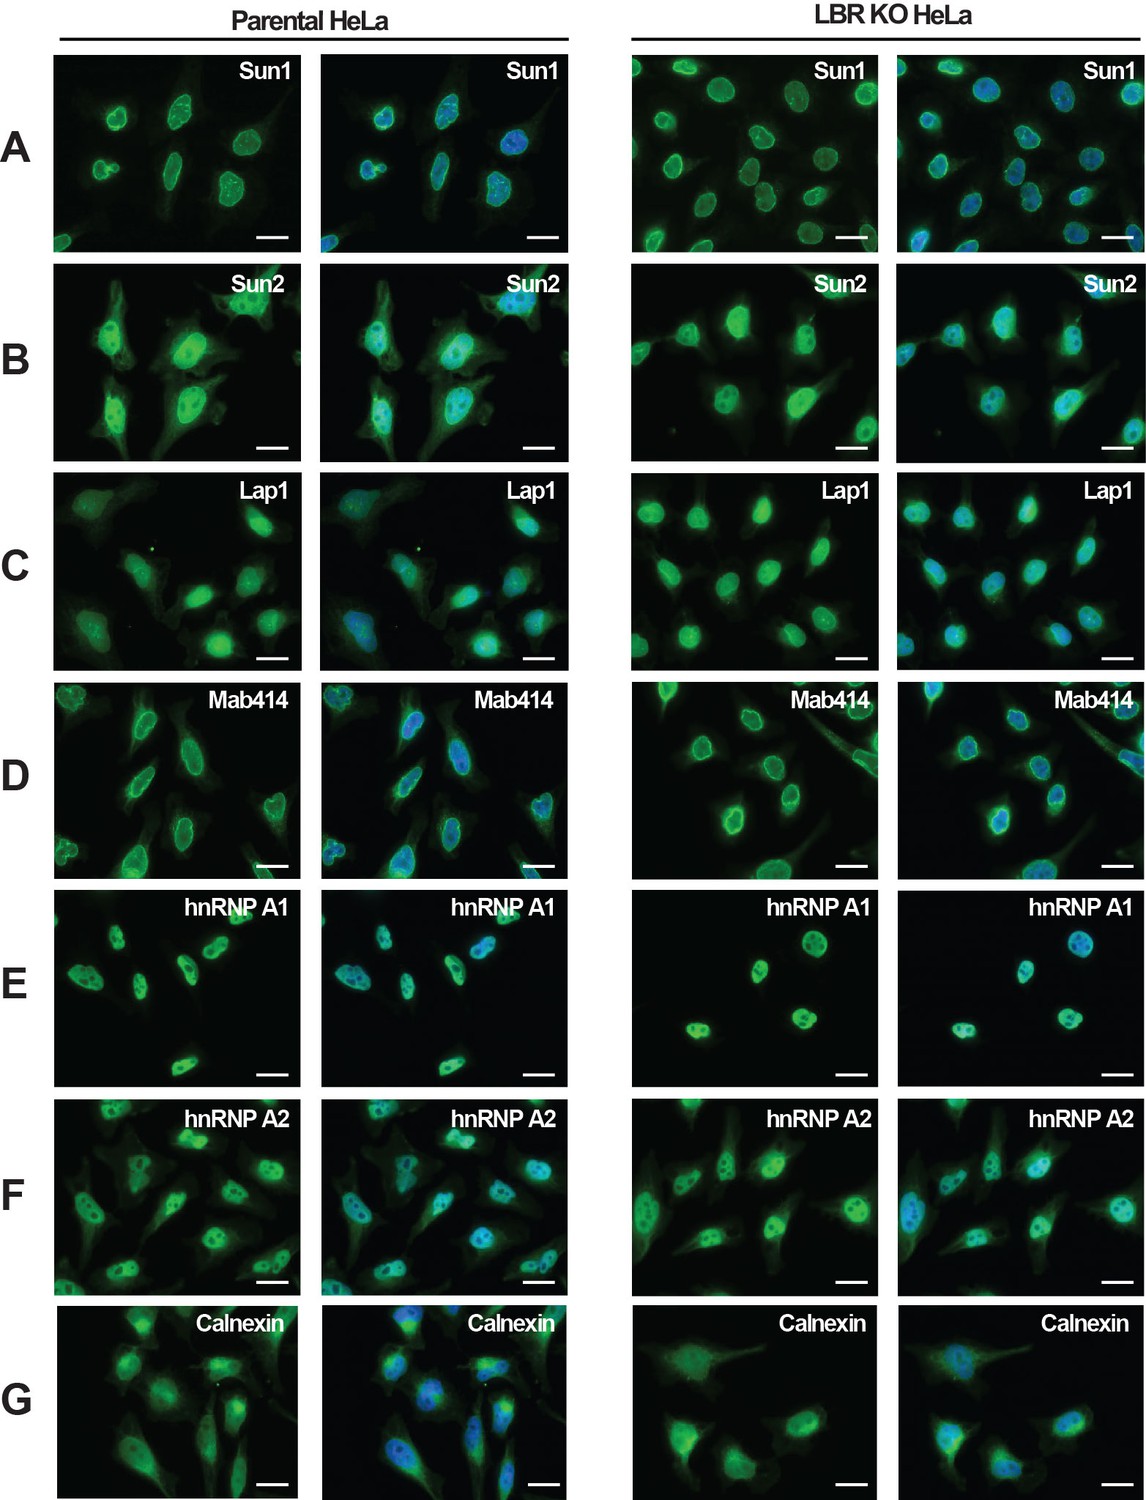
LBR deficient cells display normal nuclear envelope morphology.
(A–G) HeLa WT and HeLa LBR KO cells were fixed and processed for immunofluorescence using the indicated antibodies. Scale bar = 10 μm.
Figure 3 with 1 supplement
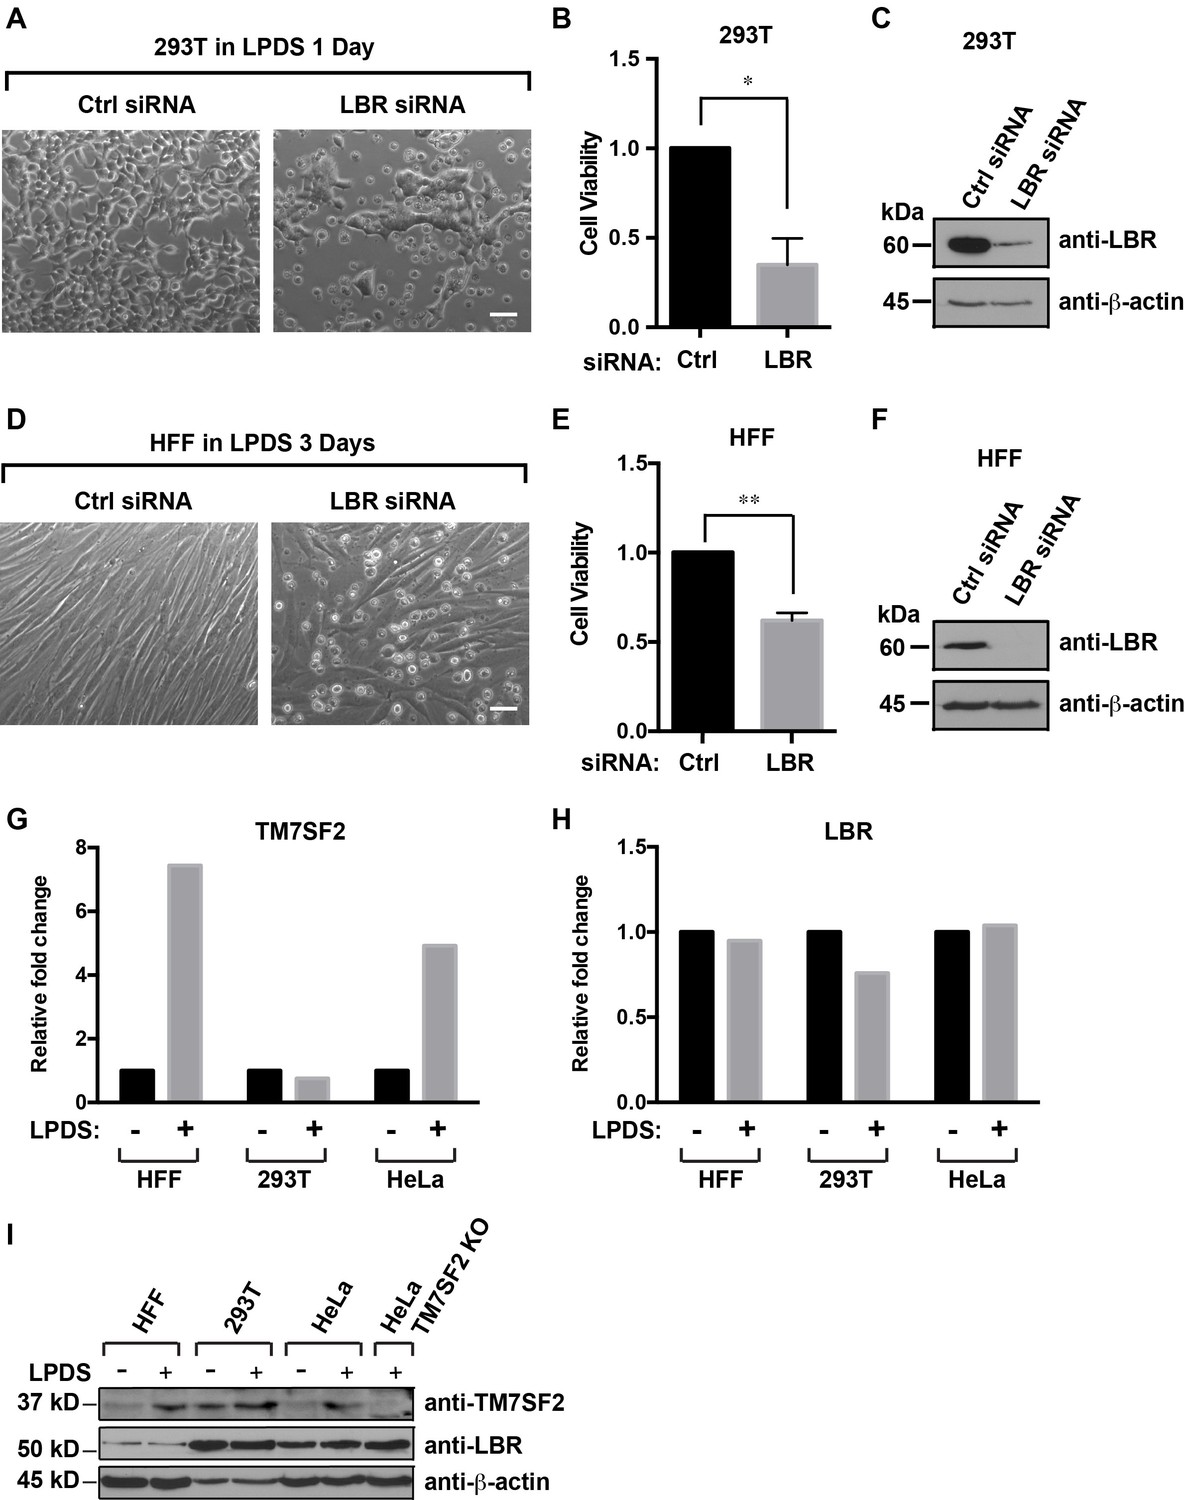
Cells with reduced levels of LBR are sensitive to cholesterol restriction despite the presence of TM7SF2 .
(A) 293T cells were transfected with control siRNA or LBR siRNA, incubated for 48 hr, cultured in cholesterol-restrictive condition for 1 day and imaged via bright-field microscopy. Scale bar = 50 µm (B) Surviving adherent cells were quantified using crystal violet staining, and data were standardized relative to the level of control siRNA. The error bars represent mean ± SD from three independent experiments (N = 3), and the statistical analysis was performed using paired t-test (*p value < 0.05, **p value < 0.01). (C) An additional parallel well of 293T cells with same treatment as described above was lysed and analyzed using immunoblotting. (D–F) HFF cells were treated with siRNA and cultured under cholesterol-restrictive conditions as described in (A) with an exception that HFF cells are cultured in the LPDS medium for 3 days. (G and H) HFF, 293T, and HeLa cells were cultured in normal medium or cholesterol-restrictive medium for 2 days, and cells were harvested and split into two aliquots. Total RNAs were extracted from one aliquot, reverse transcribed into cDNA, and analyzed using real-time PCR with gene specific primers as indicated. The data was represented as a relative level to the normal condition (i.e. –LPDS was set to one in each cell line). (I) The other aliquot of cells was lysed with sample buffer and subjected to immunoblotting analysis.
-
Figure 3—source data 1
TM7SF2 sequence cloned using RT-PCR from HeLa cells.
The TM7SF2 cDNA sequence cloned from HeLa cells (top strand) was aligned with the coding sequence of the published human TM7SF2 transcript isoform1 (NM_003273) (lower strand).
- https://doi.org/10.7554/eLife.16011.010
Figure 3—figure supplement 1
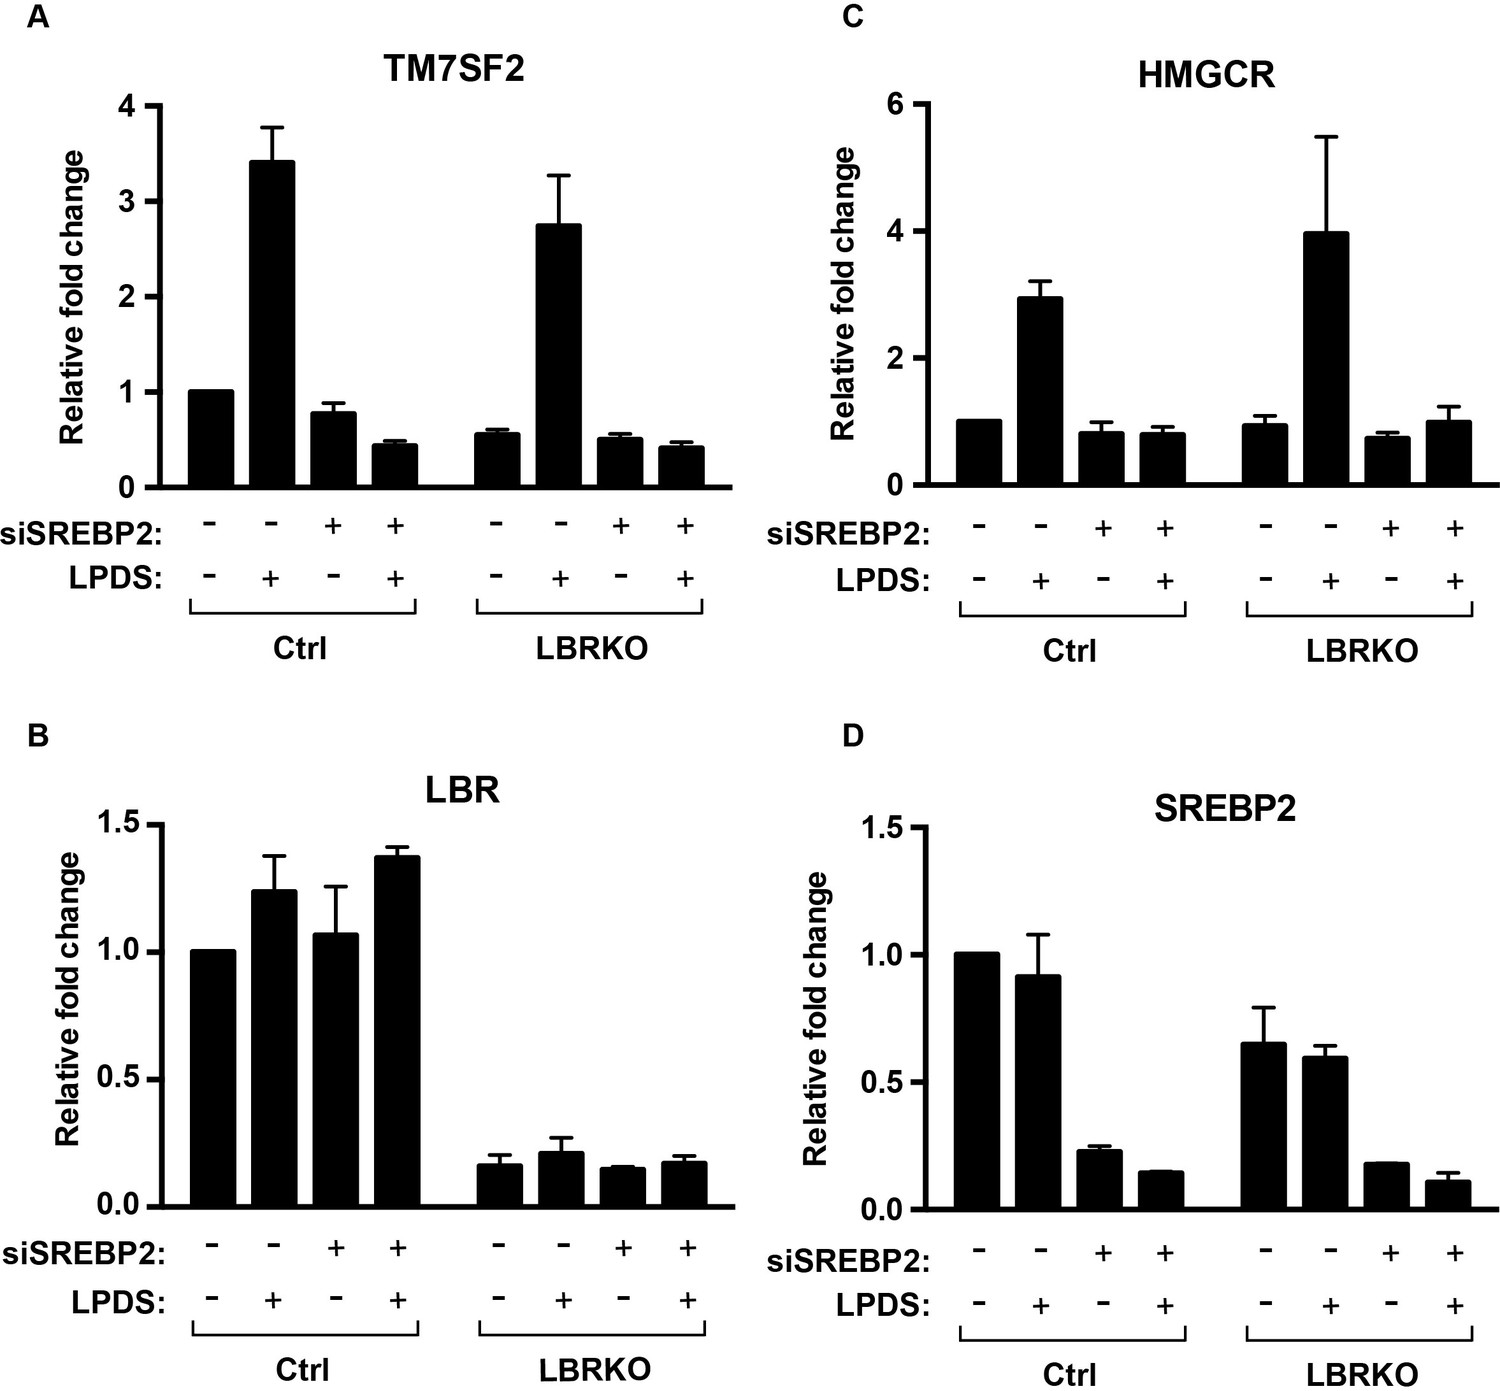
LBR transcription does not change under cholesterol-restrictive condition.
(A–D) Wild-type or LBR KO HeLa cells were transfected with control siRNA or SMARTpool siRNA targeting to SREBP2 for 48 hr, and cultured in normal medium or cholesterol-restrictive medium for another 48 hr. Total RNAs were then isolated, reversed transcribed into cDNA, and analyzed using real-time PCR with specific primers as indicated. Data were normalized relative to wild-type HeLa cells transfected with control siRNA, cultured in normal conditions. Error bars represent mean ± SD from triplicates.
Figure 4
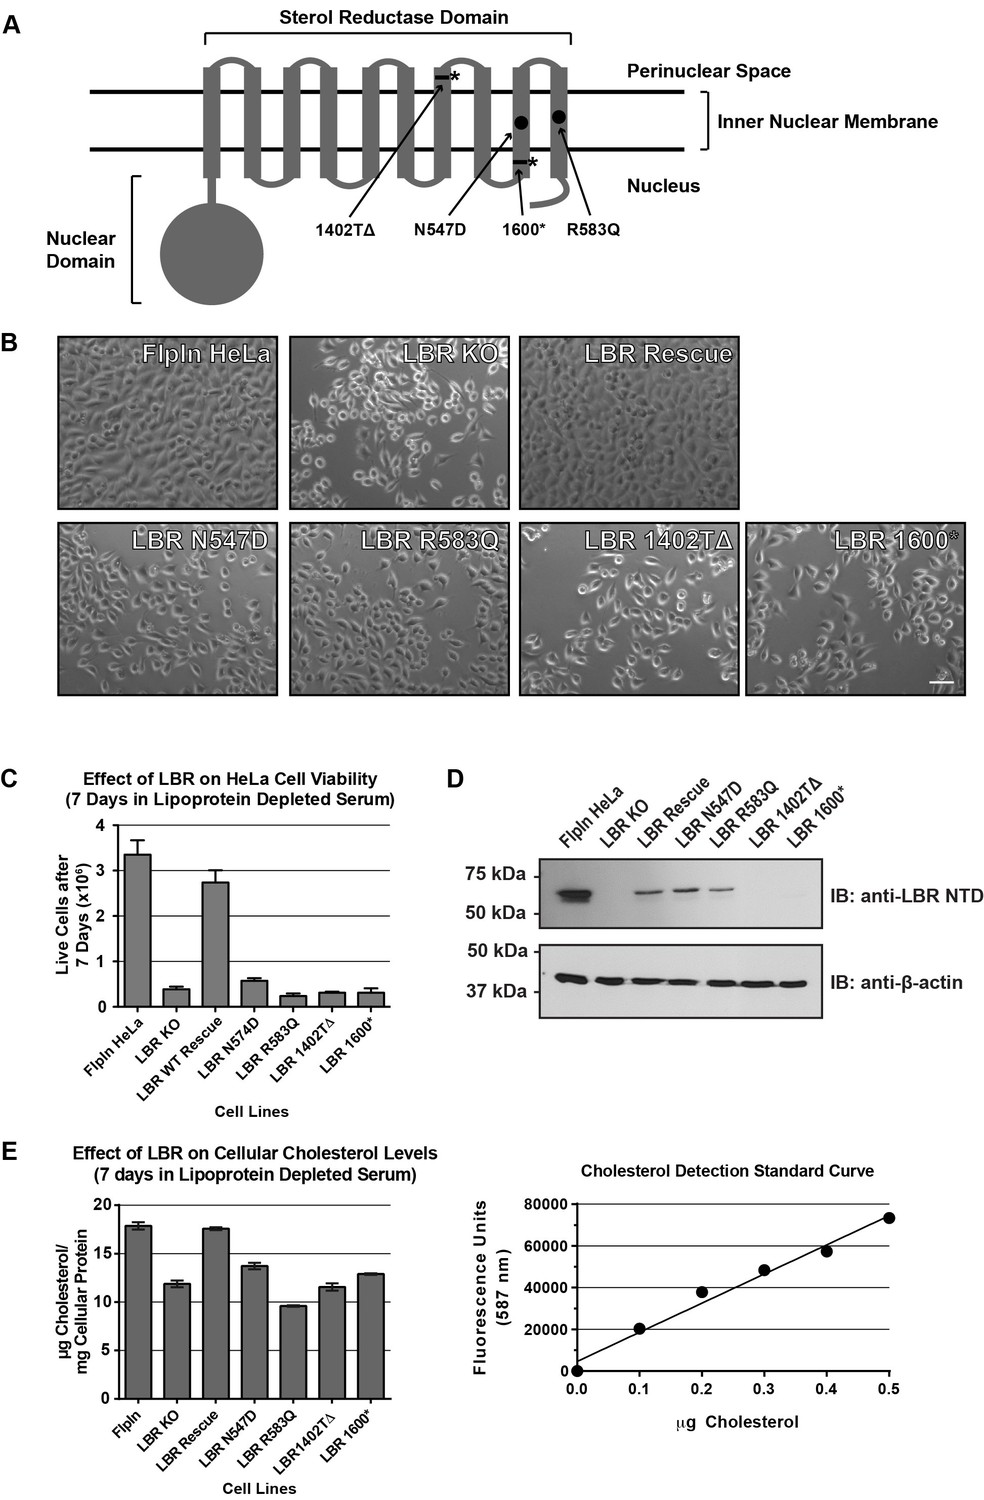
Cholesterol auxotrophy of LBR KO cells is rescued by wild-type but not disease-mutant LBR .
(A) Domain structure of LBR. Locations of disease-associated point mutations are indicated as black circles and asterisks demark disease-associated frameshift/truncation mutations. (B) Parental WT, LBR KO, or LBR KO cells expressing either WT LBR or mutant LBR from the FlpIn locus were cultured for 7 days in cholesterol-restrictive growth medium and then imaged by bright field microscopy. (C) The cell lines described above were grown in triplicate for 7 days in cholesterol-restrictive growth conditions, trypsinized, and counted. Values represent a mean of three independent experiments with error bars indicating the standard deviation (D) Immunoblot analysis of cell lysates harvested on day 7 of the experiment showing LBR expression level in each cell line relative to wild-type. (E) The above described cell lines were treated exactly as in (C), harvested, and the total cholesterol concentration was determined using a fluorometric assay (see Materials and methods). Values represent a mean of three independent experiments with error bars indicating the standard deviation. A cholesterol standard curve is shown on the right.
Figure 5 with 1 supplement
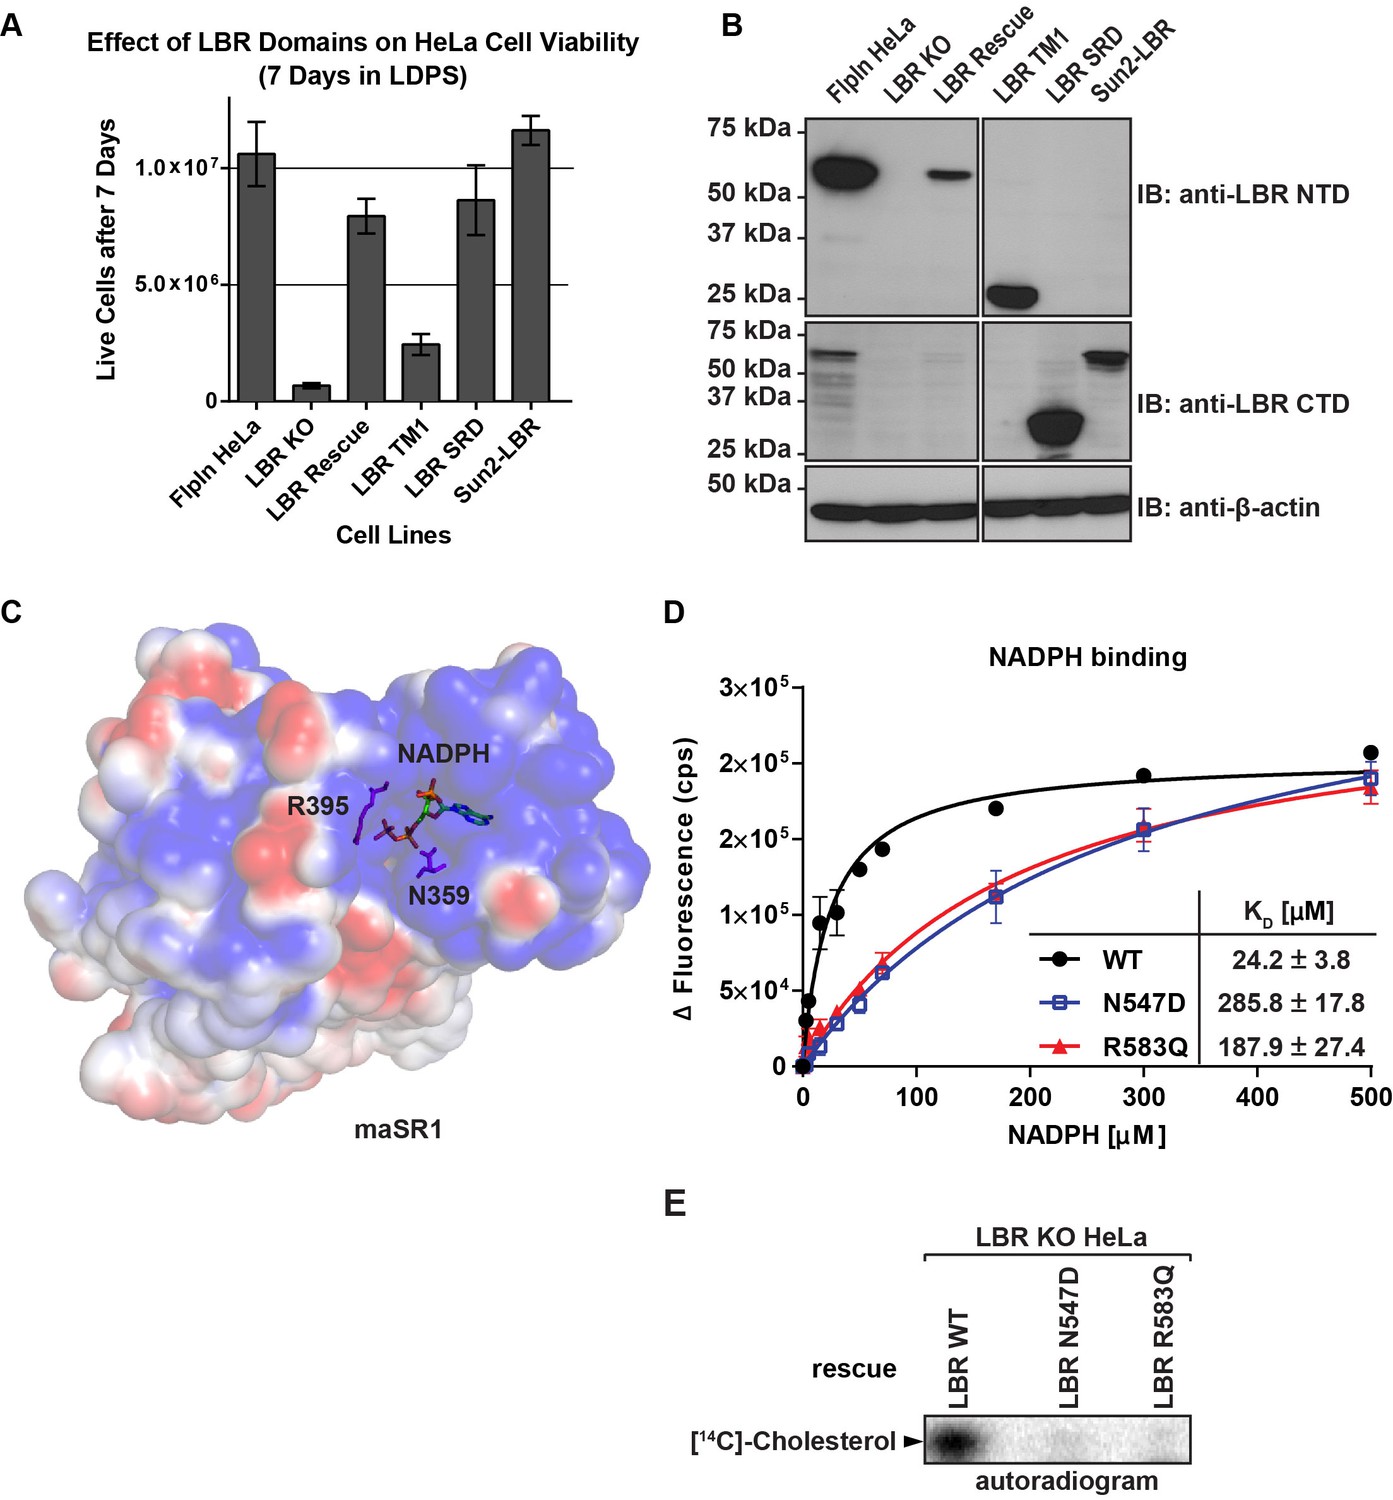
The C-terminal sterol reductase domain of LBR Is necessary and sufficient for cell viability under cholesterol restrictive growth conditions.
(A) WT HeLa cells, LBR knockout HeLa cells, or LBR knockout cells expressing either WT LBR, the LBR nuclear domain plus the first transmembrane helix (LBR-TM1), the LBR sterol reductase domain (LBR-SRD), or the nuclear domain of Sun2 fused to the sterol reductase domain of LBR (Sun2-LBR) were grown in triplicate under cholesterol restrictive growth conditions for 7 days. The cells were then trypsinized and counted and the results were plotted with standard deviations shown. (B) Anti-LBR immunoblots of lysates from the above treated cells show LBR expression level relative to WT. Membranes were probed with two distinct anti-LBR antibodies recognizing an N- and C-terminal LBR epitope, respectively. (C) Electrostatic surface potential representation of themaSR1 (crystal structure (PDB: 4QUV) with kT/e ± 1. NADPH and residues N359 and R395 corresponding to LBR disease-associated residues N547 and R583 (cf. Figure 5—figure supplement 1) are shown as sticks. (D) Disease-associated LBR point mutants LBR N547D and LBR R583Q show a decreased affinity for NADPH compared to wild-type LBR. Intrinsic tryptophan fluorescence of purified LBR WT and mutants upon NADPH binding was plotted against NADPH concentration and non-linear regressions were fitted in GraphPad Prism. All measurements were performed in triplicate. (E) HeLa LBR KO cells stably expressing LBR WT, LBR mutant N54D or R583Q were cultured in LPDS containing medium for 48 hr prior to metabolically labeling with [14C]-acetate. Lipids were extracted and separated by TLC and visualized via autoradiography. Bands corresponding to [14C]-cholesterol are marked by an arrowhead.
Figure 5—figure supplement 1
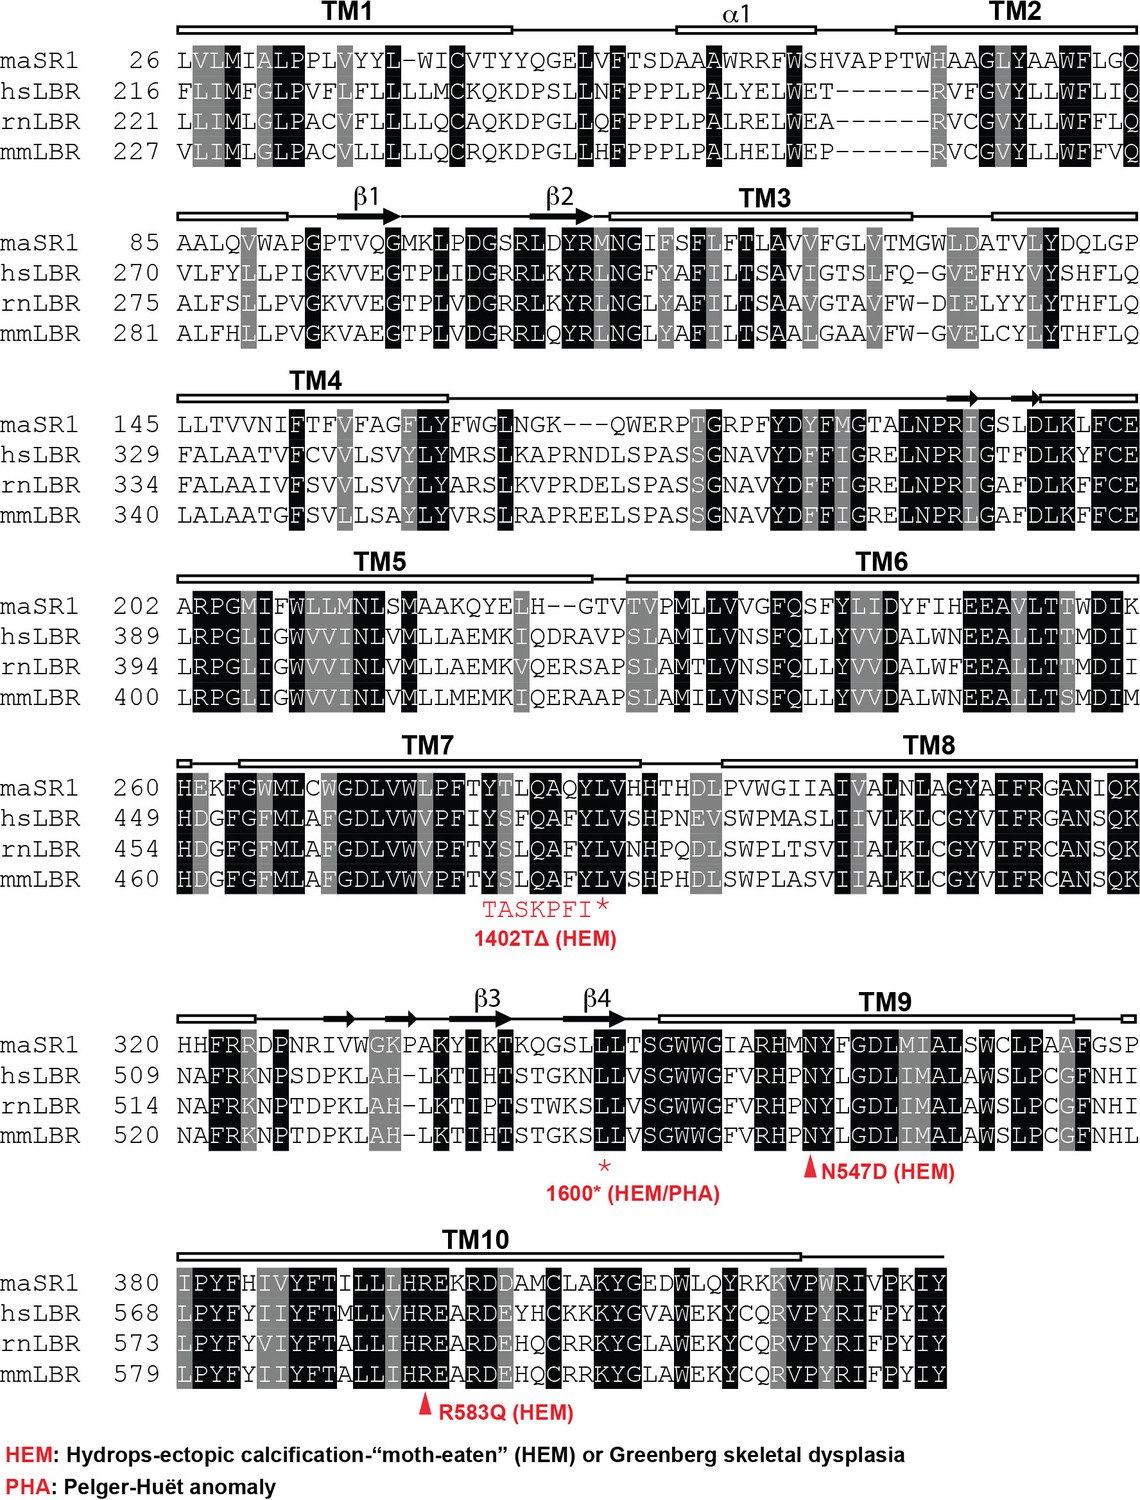
Sequence alignment of LBR and related sterol reductases.
LBR sequences from human, rat, and mouse together with maSR1 (Methylomicrobium alcaliphilum delta (14)-sterol reductase) were aligned with Clustal Omega. Secondary structures of maSR1 are labeled above the sequences. The boxes indicate helices, the arrows indicate β-sheets, and the solid lines indicate random structural regions. The asterisks indicate stop codons of LBR 1402TΔ and LBR 1600* mutants. The triangles indicate N547D and R583Q mutants.
Figure 6
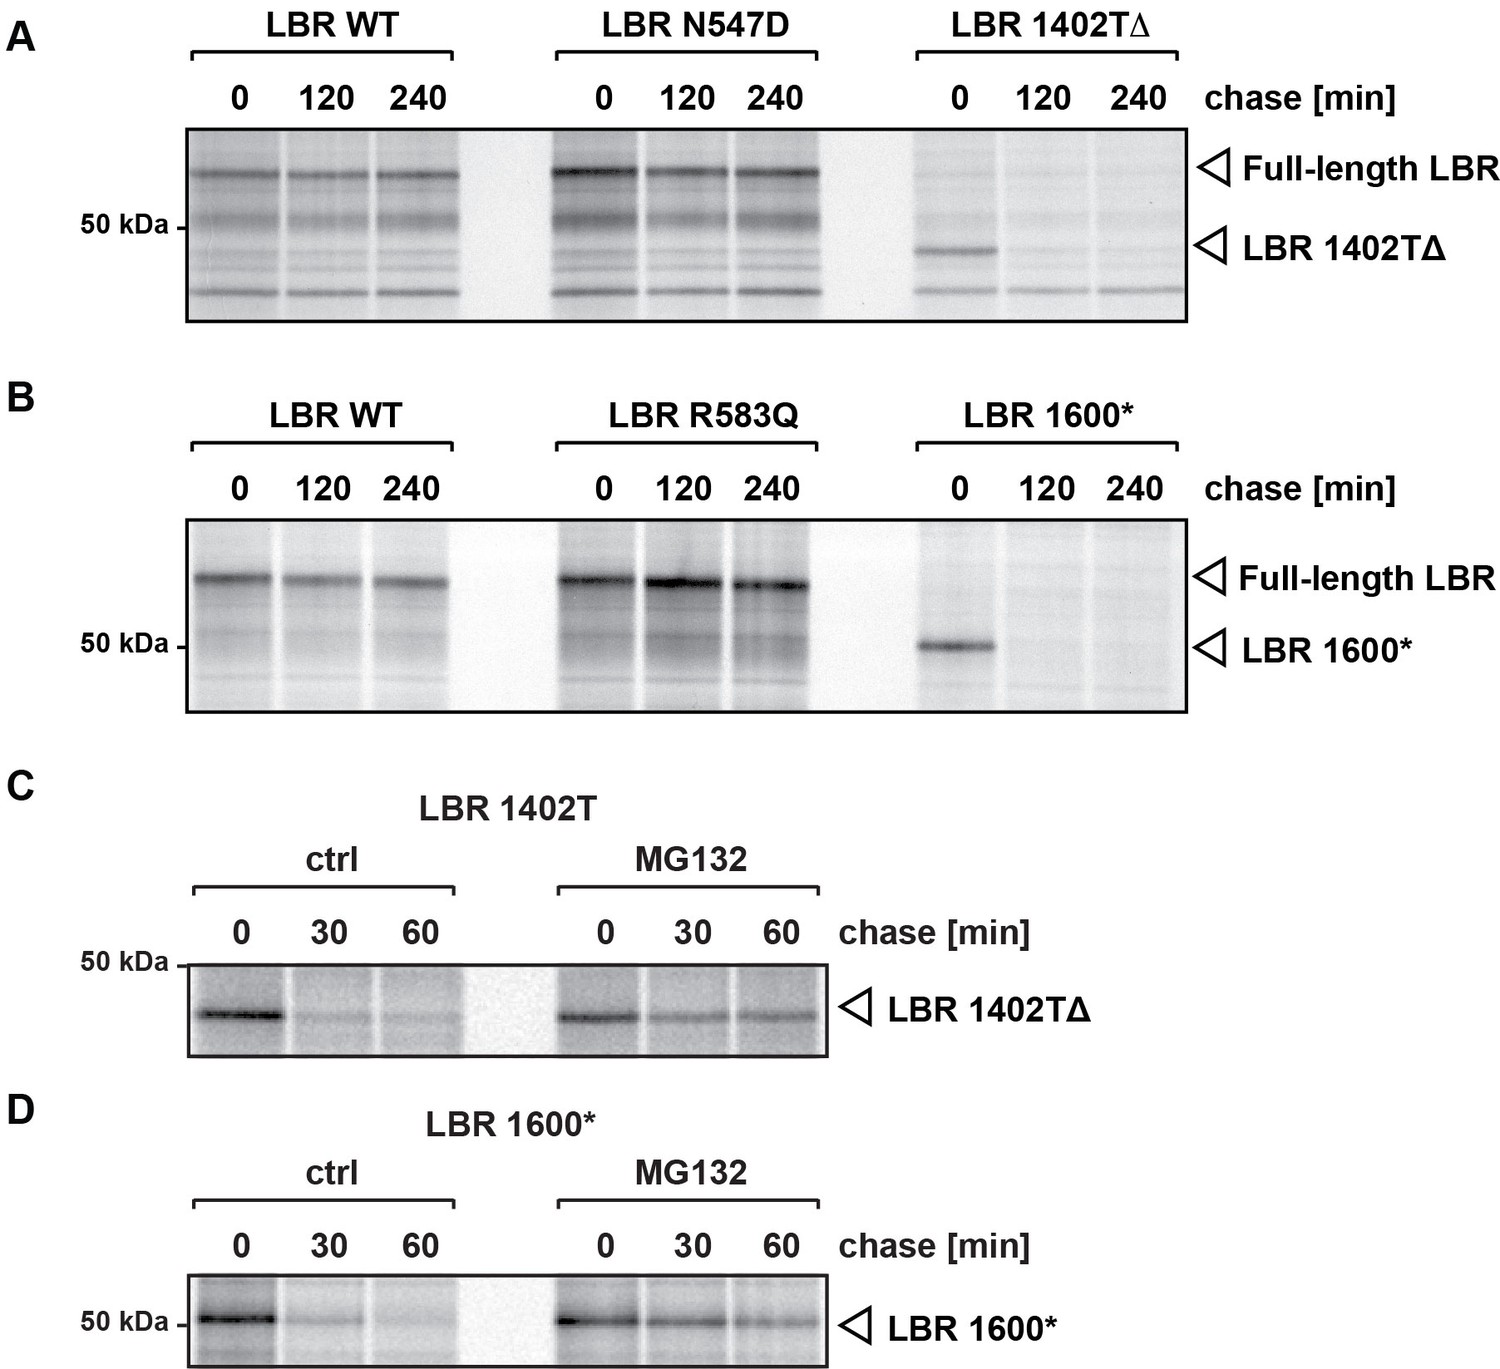
C-terminally truncated LBR mutants associated with Pelger-Huët anomaly and Greenberg skeletal dysplasia are rapidly degraded via the proteasome.
(A), (B) LBR KO cells expressing either WT LBR or the disease-associate LBR mutants were metabolically labeled with 35S and then chased with an excess of unlabeled cysteine/methionine. LBR was then retrieved at the indicated time points via immunoprecipitation, resolved by SDS-PAGE and imaged via autoradiography. (C), (D) Turnover of LBR 1402TΔ and LBR 1600* was measured on a shorter time scale in the absence or the presence of MG132.
Figure 7
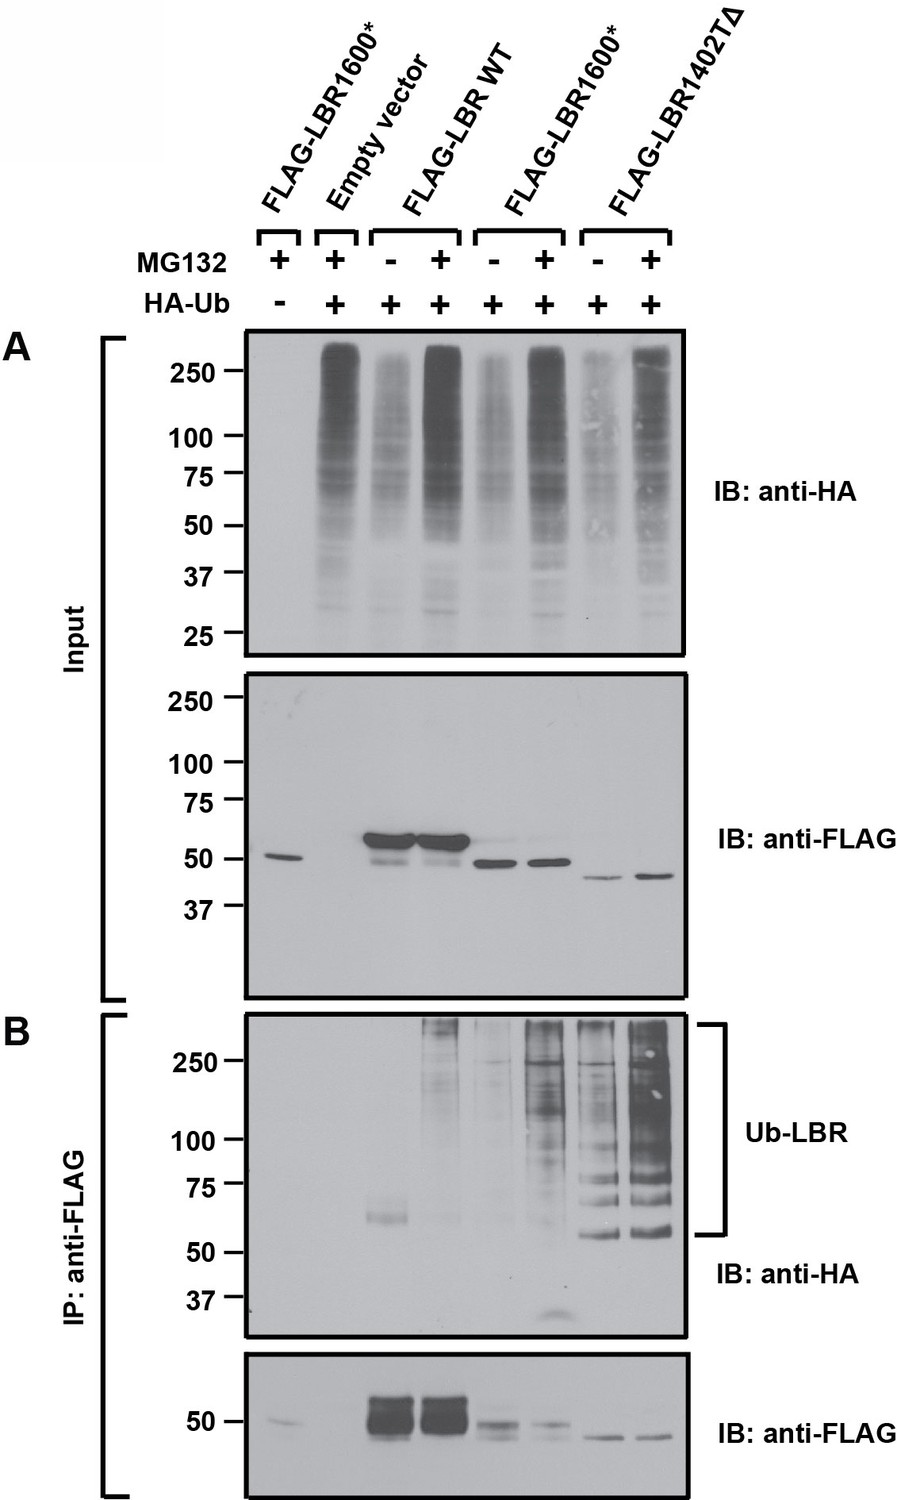
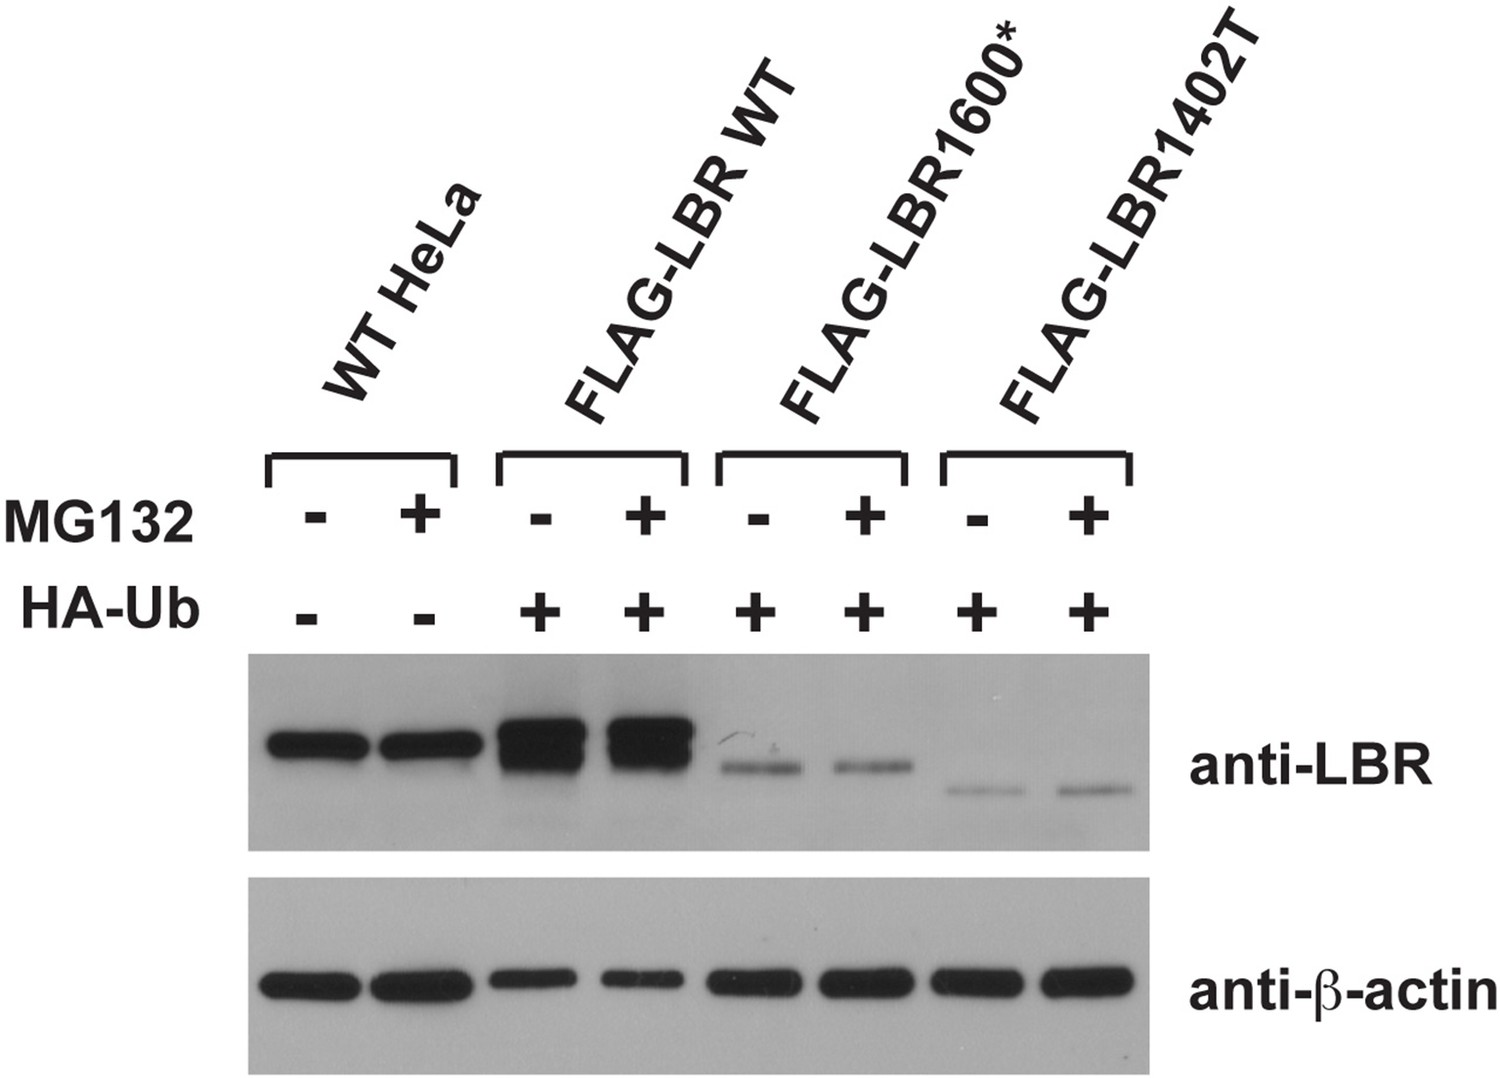
LBR 1402TΔ and LBR 1600* proteins are polyubiquitylated.
LBR KO cells were co-transfected with plasmids encoding HA-tagged ubiquitin and FLAG-tagged LBR WT, LBR 1600*, or LBR1402TΔ. Sixteen-hours-post transfection, cells were treated with MG132 or DMSO for another 4 hr before harvesting and denaturing SDS lysis. (A) Five percent of cell lysates used per immunoprecipitation (B) were separated by SDS-PAGE and subjected to immunoblotting using the indicated antibodies (B) Lysates were diluted in SDS-free buffer and subjected to immunoprecipitation using anti-FLAG antibody, followed by SDS-PAGE and immunoblotting analysis using the indicated antibodies.
Figure 8 with 1 supplement
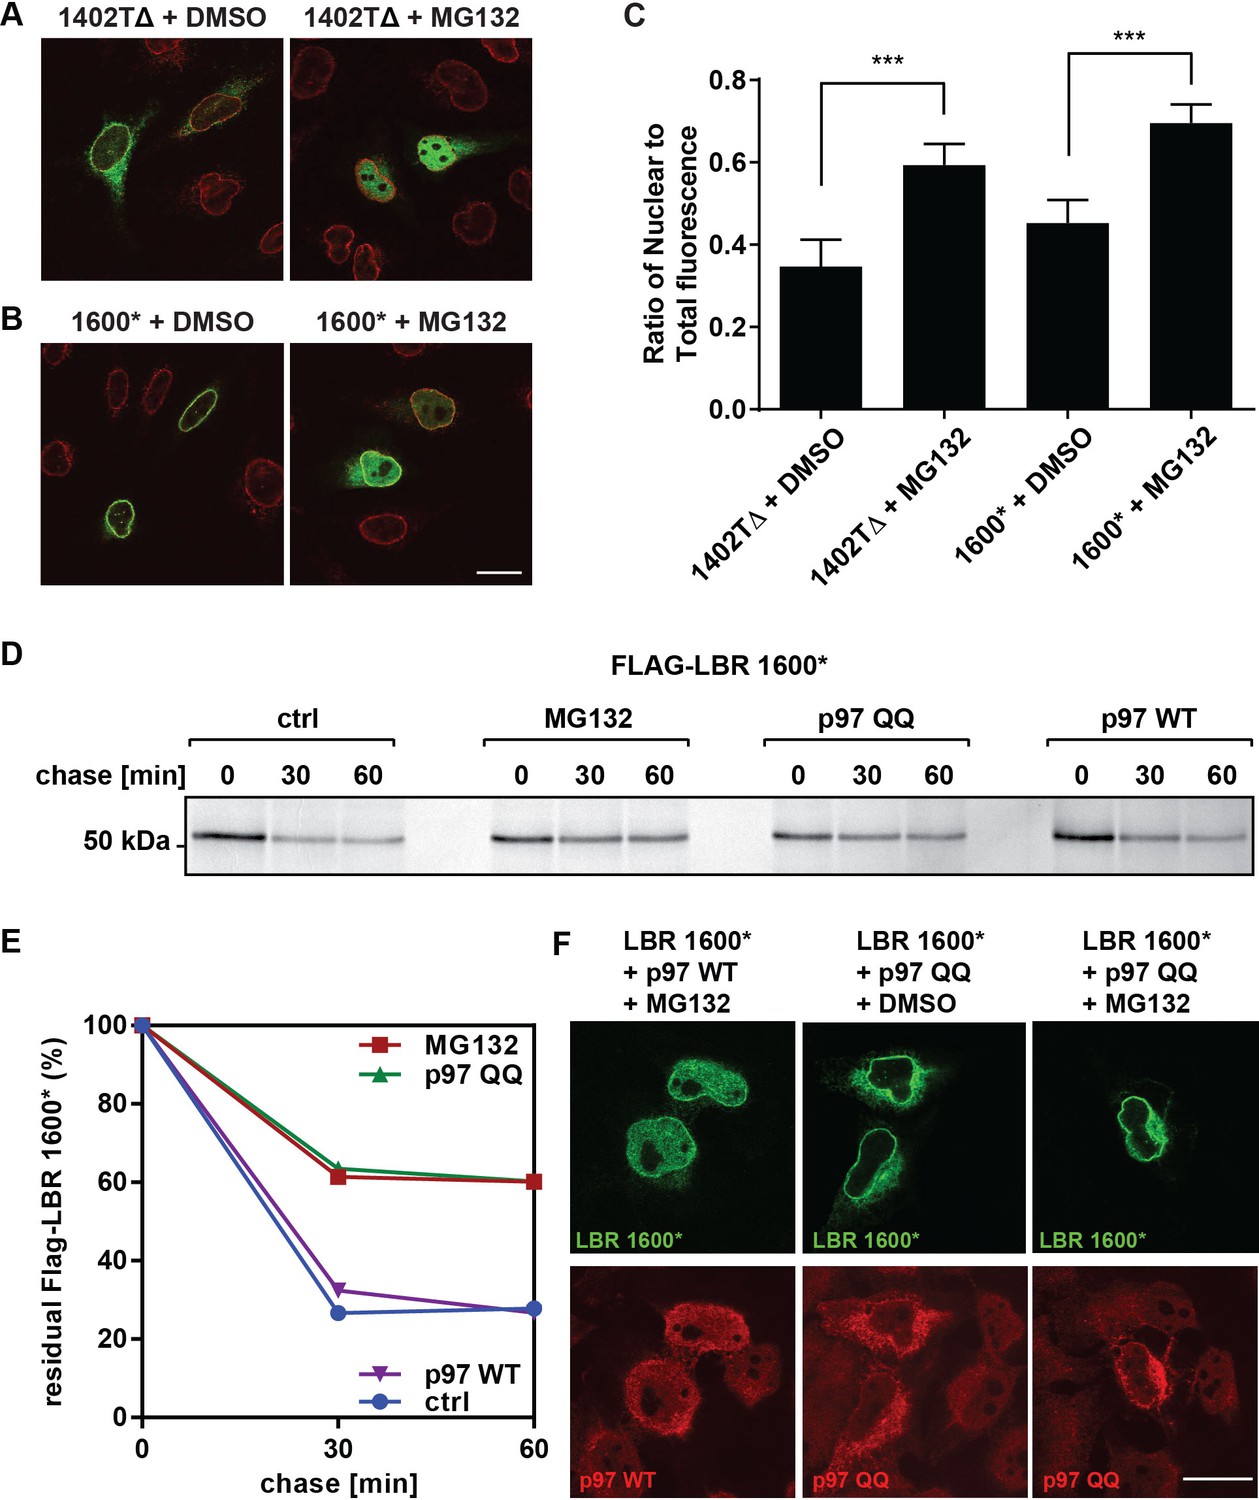
LBR 1402TΔ and LBR 1600* proteins accumulate in the nucleus after MG132 treatment.
(A,B) LBR knockout cells expressing either LBR 1402TΔ or LBR 1600* were treated with MG132 or DMSO vehicle for 4 hr and then fixed, stained, and imaged by confocal fluorescence microscopy. The cells were stained with antibodies against LBR (green) and Lamin A/C (red). (C) Cells were treated and imaged as above (A,B), and the nuclear fluorescence obtained from 20 complete z-stack series for each condition was quantified using ImageJ, summed up, and standardized relative to the sum of total fluorescence. The ratio of nuclear to total cellular fluorescence is given as arithmetic mean value. Error bar represents mean ± SD. The statistical significance is determined by unpaired t-test. ***p<0.001 (D) Pulse-chase analysis of LBR KO HeLa cells co-transfected with FLAG-tagged LBR 1600* mutant and p97 WT or QQ mutant. (E) Densitometric quantification of pulse-chase data. (F) LBR-knockout HeLa cells were co-transfected with LBR mutant 1600* and with p97 WT or QQ mutant and treated with 10 µM of MG132 or DMSO for 4 hr. Cells are stained with anti-LBR (green) and anti-p97 (red), and imaged with a confocal microscope. Scale bar = 20 μm.
Figure 8—figure supplement 1
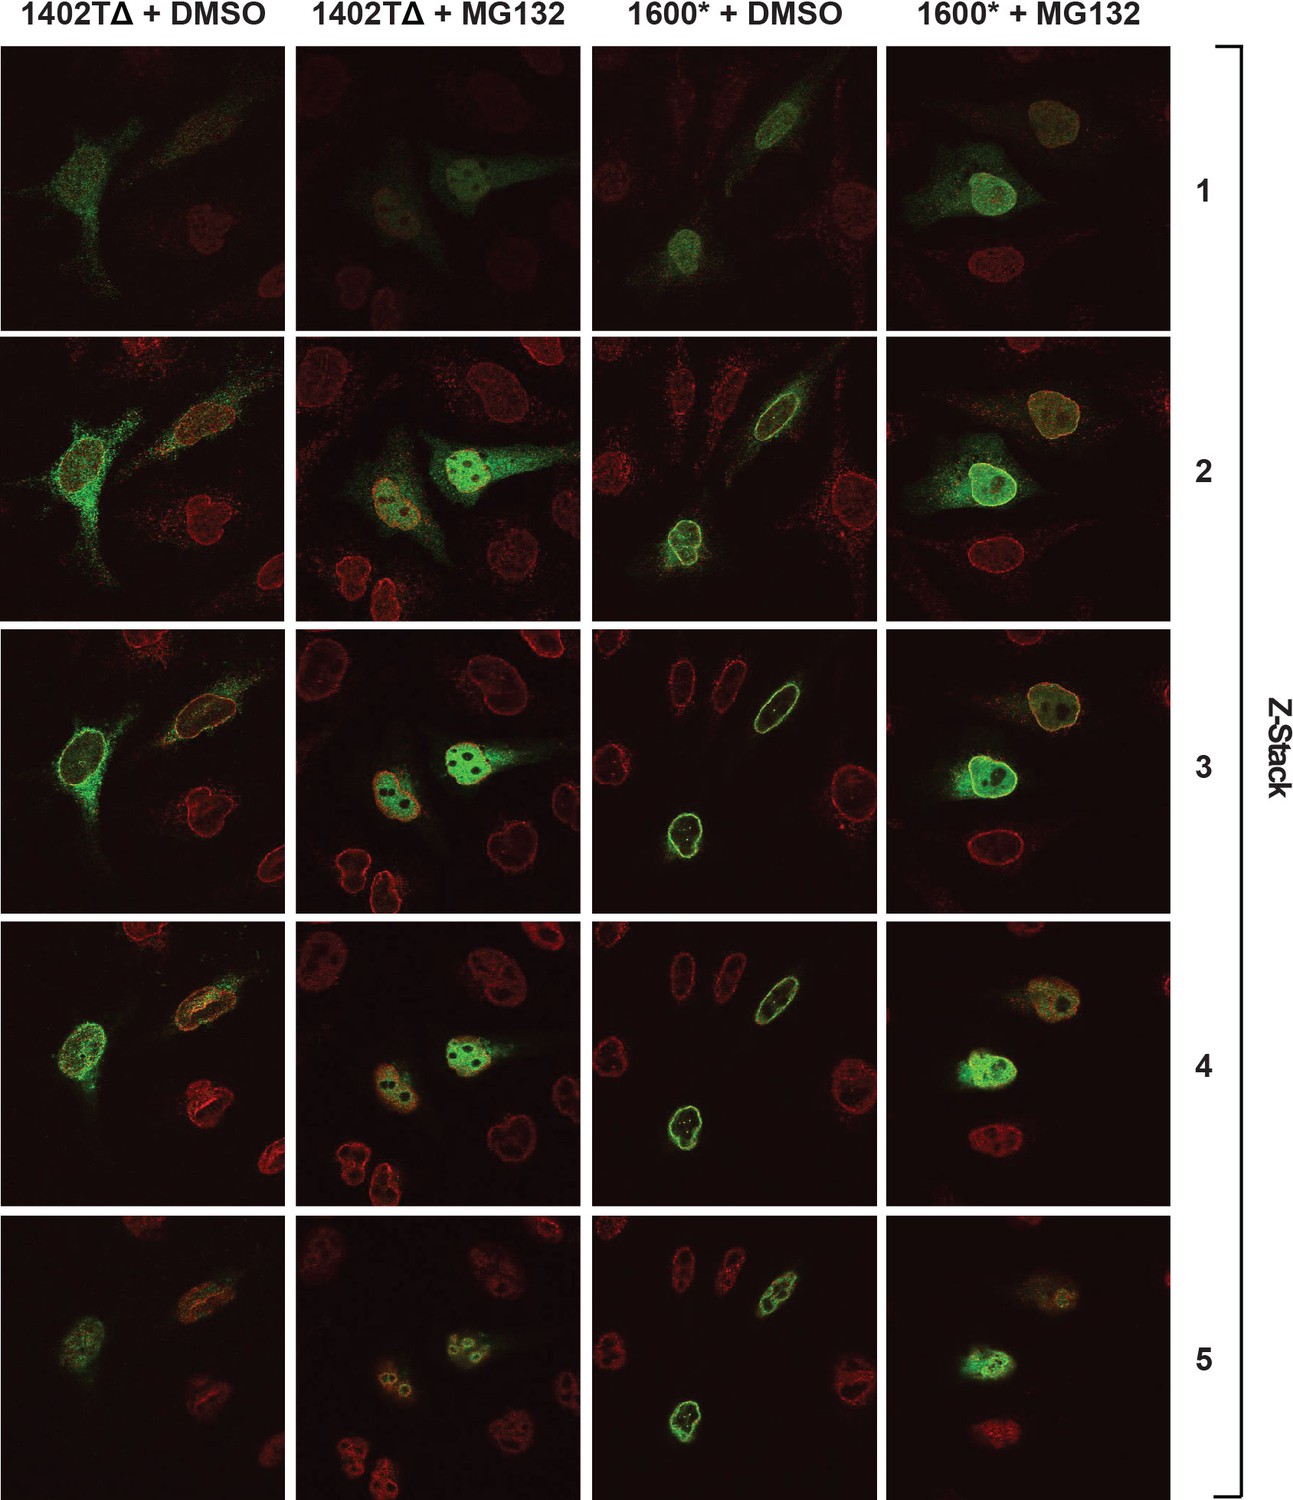
Complete confocal z-stack series corresponding to Figure 8A, B.
LBR knockout cells expressing either LBR 1402TΔ or LBR 1600* were treated with MG132 or DMSO vehicle for 4 hr and then fixed, stained, and imaged by confocal fluorescence microscopy. The cells were stained with antibodies against LBR (green) and Lamin A/C (red).
Figure 9
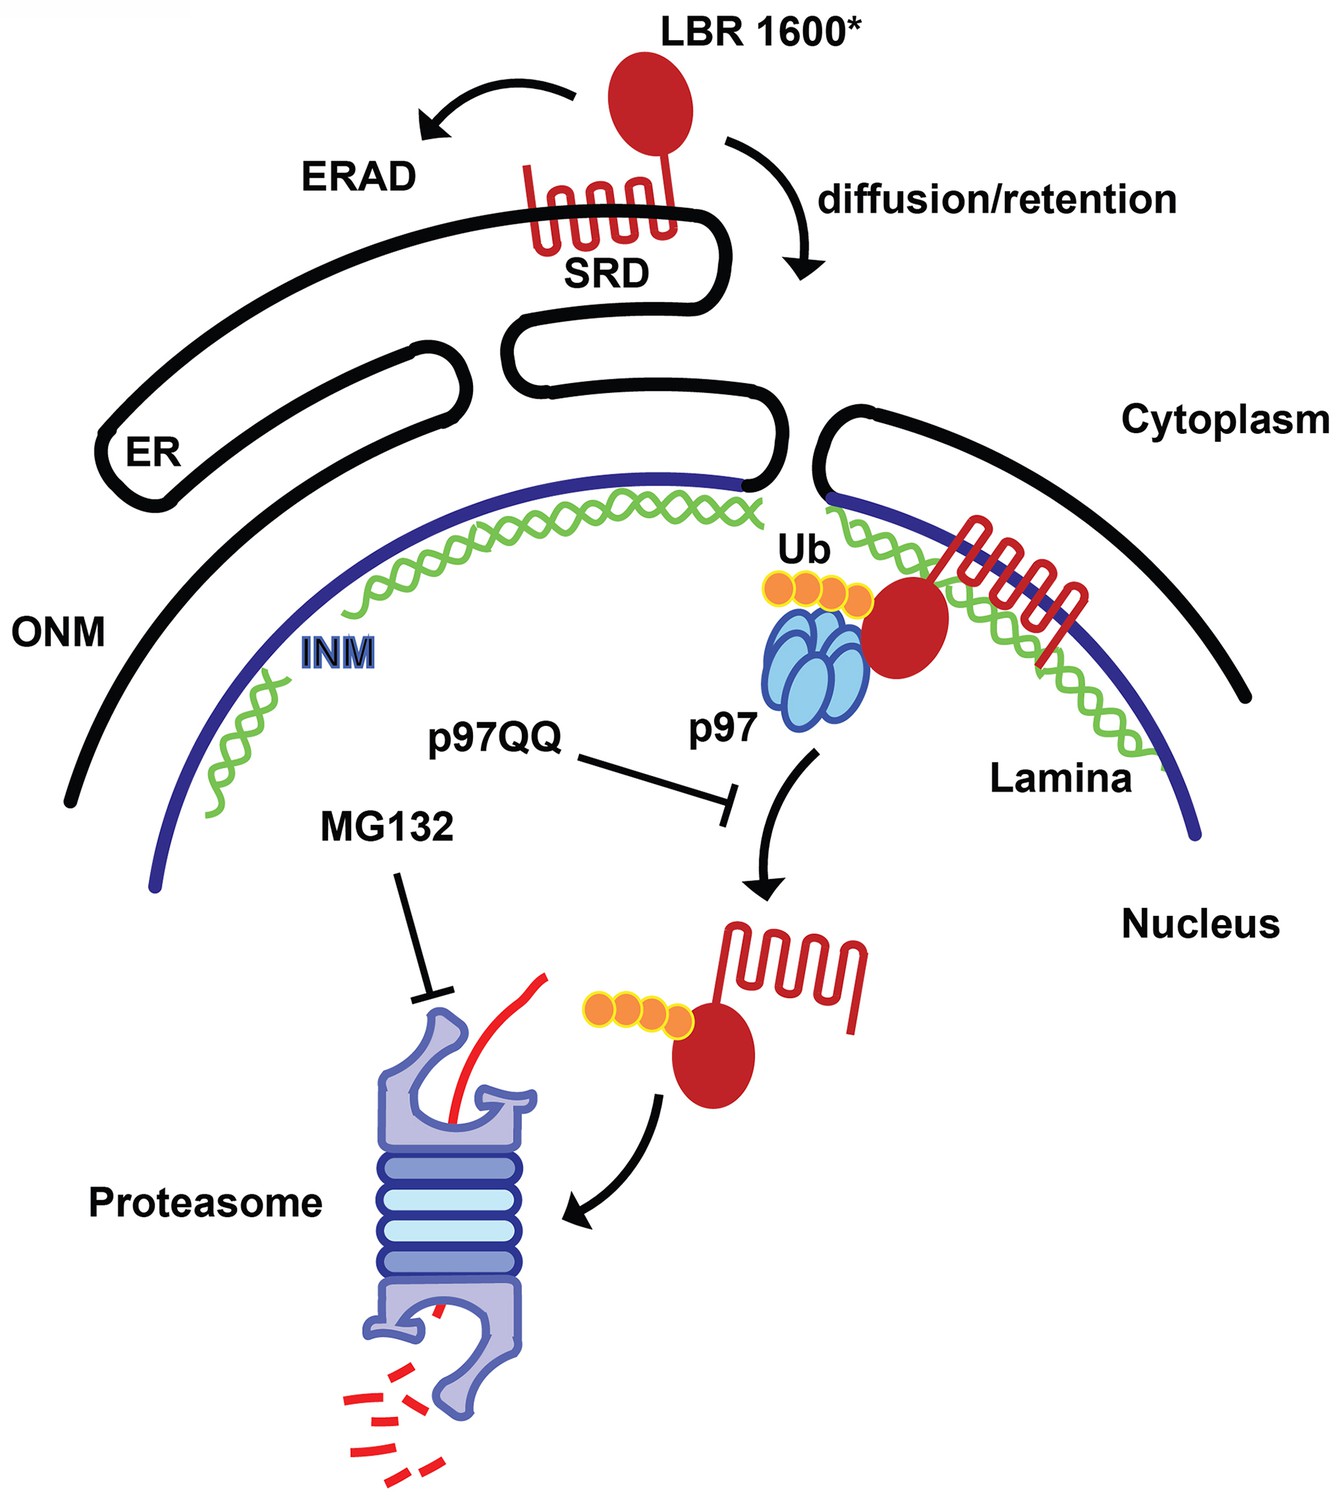
Model for partitioning of metabolically unstable LBR variants between ER- and INM-resident protein turnover pathways.
C-terminal truncation of LBR (e.g. in LBR 1600* or 1400TΔ) causes the sterol reductase domain (SRD) to misfold, leading to LBR ubiquitylation, membrane dislocation and its subsequent degradation via the Ub/proteasome pathway. A minor portion of LBR1600* is degraded by the canonical ERAD pathway in the ER, whereas the majority will enter the nucleus by virtue of the correctly folded N-terminal domain and be retained by binding to the nuclear lamina. Here, a presumably ERAD-independent pathway is operative, involving both p97 and the Ub/proteasome. Turnover at the INM can be inhibited at the dislocation or degradation step by a dominant negative p97 variant (p97 QQ) or the proteasome inhibitor MG132, respectively. Note that several ERAD components as well as p97 cofactors are omitted for clarity. ER, endoplasmic reticulum; INM, inner nuclear membrane; ONM, outer nuclear membrane; Ub, ubiquitin.
Author response image 1
Tables
Table 1
Diseases-associated LBR mutations used in this study.
| LBR variant | Mutation | Phenotype | Reference |
|---|---|---|---|
| N547D | c.1639A>G | Heterozygous - No Phenotype | Clayton et al., 2010 |
| p.N547D | Homozygous - Greenberg Dysplasia | Konstantinidou et al., 2008 | |
| R583Q | c.1748G>A | Heterozygous - No Phenotype | Clayton et al., 2010 |
| p.R583Q | Homozygous - Greenberg Dysplasia | ||
| 1402TΔ | c.1402delT | Heterozygous - Phenotype Unknown | Clayton et al., 2010 |
| p.Y468TfsX475 | Homozygous - Greenberg Dysplasia | ||
| 1600* | c.1599-1605TCTTCTA→CTAGAAG | Heterozygous - Pelger-Huët Anomaly | Waterham et al., 2003 |
| p.X534 | Homozygous - Greenberg Dysplasia |
Download links
A two-part list of links to download the article, or parts of the article, in various formats.
Downloads (link to download the article as PDF)
Open citations (links to open the citations from this article in various online reference manager services)
Cite this article (links to download the citations from this article in formats compatible with various reference manager tools)
The Lamin B receptor is essential for cholesterol synthesis and perturbed by disease-causing mutations
eLife 5:e16011.
https://doi.org/10.7554/eLife.16011


