Engineering vanilloid-sensitivity into the rat TRPV2 channel
- National Institute of Neurological Disorders and Stroke, National Institutes of Health, United States
- University of Oxford, United Kingdom
- National Cancer Institute, United States
Figures
Figure 1
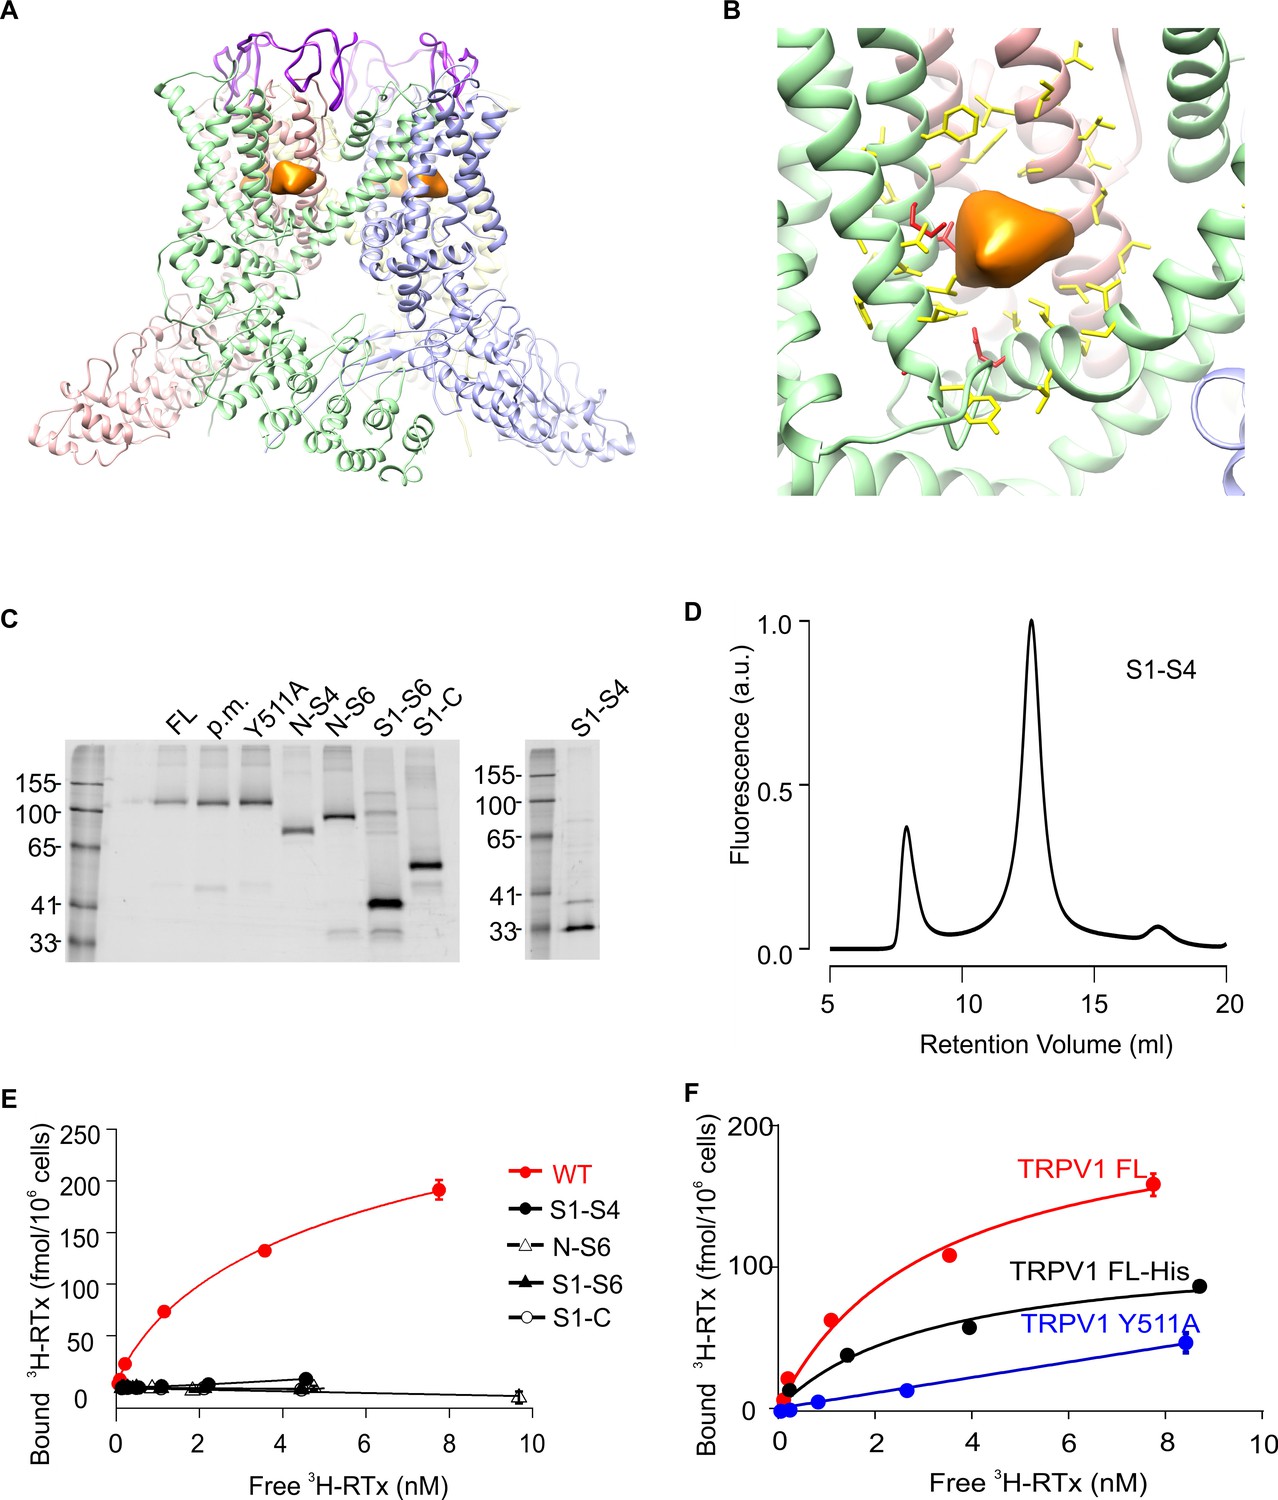
Structure of TRPV1 and characterization of TRPV1 constructs expressed in yeast.
(A) Side view of the RTx/DkTx bound cryo-EM structures of TRPV1 refined using the NMR structure of DkTx (Bae et al., 2016). The EM density tentatively assigned to RTx is colored orange and the backbone of DkTx is colored bright purple. (B) Close-up view of the RTx EM density (orange) with residues closer than 12.5 Å from the center of mass of that density shown in stick representation. The four residues studied here (S512, T550, M547, E570) are colored red and the others yellow. (C) In-gel fluorescence of SDS-solubilized membranes from S. cerevisiae cells overexpressing GFP-tagged TRPV1 domain constructs using the following abbreviations: FL (Full-lenth), p.m. (pore mutant; deletion of 629–647)(Garcia-Sanz et al., 2004), N-S4 (N terminus through 575), N-S6 (N-terminus through 704), S1-S6 (423 to 704), S1-C (423 to C terminus) and S1-S4 (431 to 575). (D) Fluorescence-coupled size exclusion chromatography (FSEC) traces of GFP-tagged TRPV1 S1-S4 domain solubilized in DDM. The first peak is the void volume and the second corresponds to monomeric domain. (E) 3H-RTx binding to intact S. cerevisiae cells expressing full-length TRPV1 and its separate domains, all of which contain GFP tags on their C-termini. Data were normalized to number of cells because the trucated constructs express to higher levels compared to TRPV1, and data were corrected for non-specific binding as described in Materials and methods. Data points are the mean + S.E.M. for triplicate determinations. Smooth function for full-length GFP-tagged TRPV1 is a fit of the Hill equation to the data with Kd and Hill slope (nH) values of 7.0 nM and 0.78 for TRPV1. (F) Binding of 3H-RTx to S. cerevisiae cells containg GFP-tagged TRPV1, N-terminus His-tagged TRPV1 (without GFP), or dual GFP- and His-tagged TRPV1 construct harboring the Y511A mutation. Smooth functions are fits of the Hill equation to the data with Kd and nH values of 7.2 nM and 0.82 for TRPV1, 30 nM and 0.6 for TRPV1-His, and >238 nM and 1.1 for TRPV1 Y511A. Data points are the mean + S.E.M. for triplicate determinations.
Figure 2
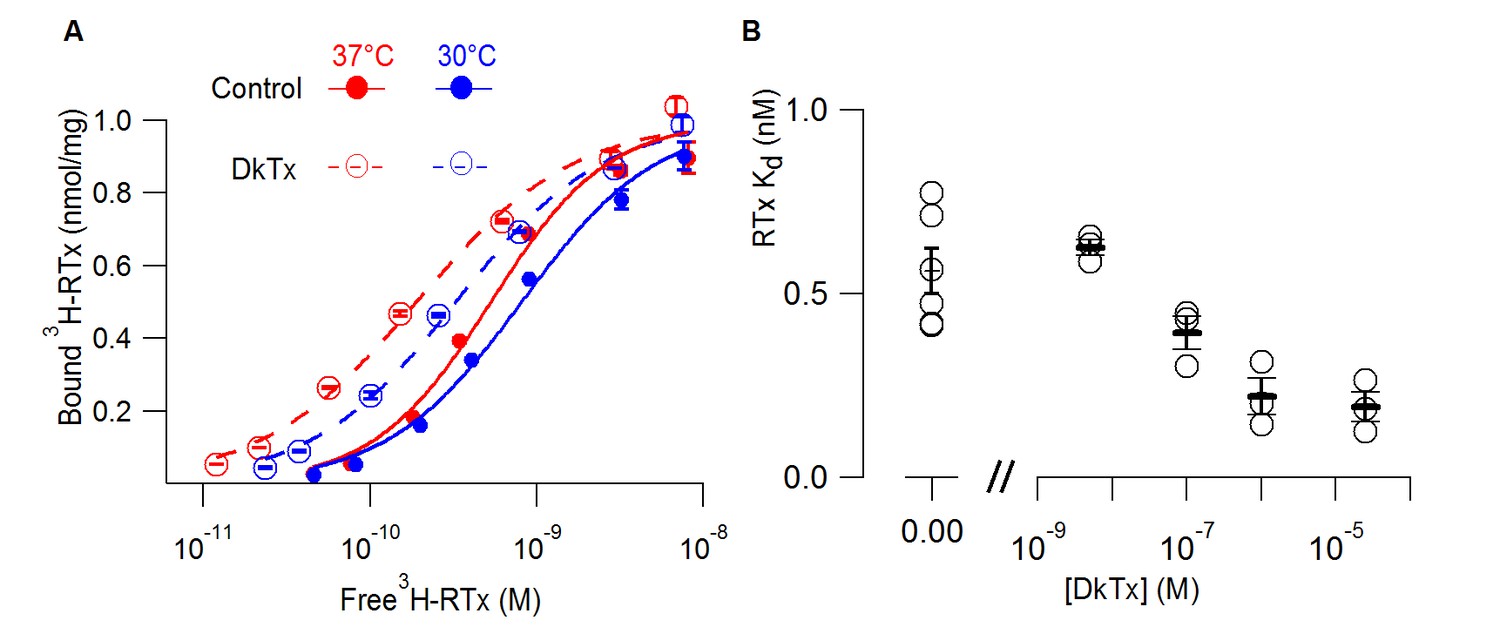
DkTx allosterically modulates the affinity of RTx for the TRPV1 channel.
(A) 3H-RTx binding to S. cerevisiae membranes containg full-length 1D4-tagged TRPV1 in the presence or absence of DkTx (0.7 µM), normalized to total protein per sample. Smooth functions are fits of the Hill equation to the data with Kd and Hill slope (nH) values 0.53 nM (nH=1.24) in control and 0.19 nM (nH=0.92) in the presence of DkTx at 37°C. At 30°C Kd and nH values were 0.8 nM (nH=1.1) in control and 0.33 nM (nH=1) in the presence of DkTx. Data points are mean + S.E.M. for triplicate determinations. (B) RTx Kd values in the absence and presence of different concentrations of DkTx measured at 37°C. Values for individual cells are shown as circles and the mean + S.E.M. as bars for between 3 to 5 separate experiments, each of which were determined in triplicate.
Figure 3 with 1 supplement

RTx sensitivity of individual mutations in TRPV1.
(A) Voltage protocols used to measure time courses for activation of TRPV1 (left) or I-V relations (right). (B, left panel) Representative time course for WT TRPV1 activation in response to 2-APB and RTx measured from outward currents at +60 mV and from inward currents at -60 mV. Pulses were given every 3 s. The colored horizontal lines indicate application of agonists (2 mM 2-APB, 100 nM RTx, 50 µM RR). The dotted horizontal line indicates the zero-current level. (B, right panel) Mean normalized I-V relations obtained in control (open symbols, not visible), 2-APB (blue), RTx (red) and RR immediately after RTx (black filled symbols). Currents were normalized to the value in the presence of saturating 2 mM 2-APB. Data are expressed as mean ± S.E.M. (n = 4). (C-F) Time courses and I-V relations (n=3–5) for individual mutations as indicated, studied using the same protocols as in (A,B).
Figure 3—figure supplement 1

Sequences of the transmembrane regions of rat TRPV1-4 channels.
Light yellow boxes indicate residues within 12.5 Å of the center of mass of the sharpened RTx EM density (see Figure 1B). The four residues near the vanilloid binding pocket (512, 547, 550, and 570 in TRPV1) that differ between TRPV1 and TRPV2 are shown in magenta.
Figure 4 with 1 supplement

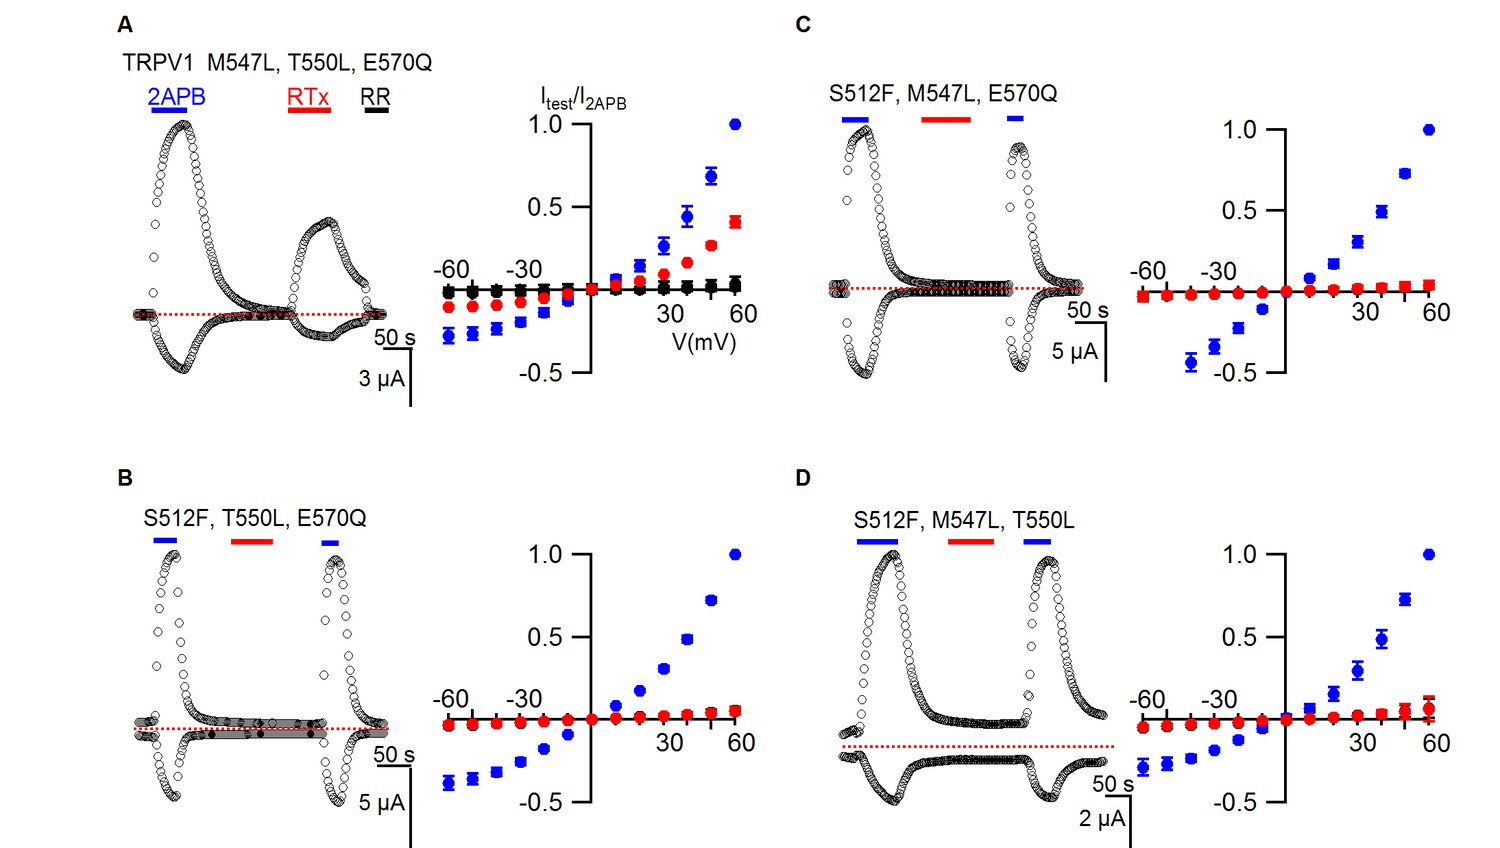
TRPV1 quadruple mutant and double mutant responses to RTx.
(A, left panel) Representative time courses for TRPV1 QM (S512F, M547L, T550L, E570Q) activated by 2-APB (2 mM) and RTx (100 nM) measured at +60 and -60 mV. RR (50 µM) was applied after RTx. Same pulse protocol as Figure 3. The dotted horizontal line indicates the zero-current level. (A, right panel) Mean normalized I-V relations obtained in control (open circles; not visible), 2-APB (blue) and RTx (red). Currents were normalized to the value in the presence of 2 mM 2-APB . Data are expressed as mean ± S.E.M. (n = 3). (B-D Left and right panel) Time course and I-V relations of double mutants of TRPV1 activated by 2-APB (2 mM) or RTx (100 nM) obtained the same way as in (A). For the I-V relations in (D), currents measured when RR was applied immediately after RTx are shown as filled black symbols. Currents were normalized to the value in the presence of 2 mM 2-APB (n=3–5).
Figure 4—figure supplement 1
TRPV1 triple mutant responses to RTx.
(A, left panel) Representative time courses for a TRPV1 triple mutant activated by 2-APB (2 mM) and RTx (100 nM) measured at +60 and -60 mV. RR (50 µM) was applied after RTx. Same pulse protocol as Figure 3. The dotted horizontal line indicates the zero-current level. (A, right panel) Mean normalized I-V relations under different conditions using the color codes in Figure 3. Currents were normalized to the value in the presence of 2 mM 2-APB. Data are expressed as mean ± S.E.M. (n = 3). (B–D Left and right panel), Time course and I-V relations of the other TRPV1 triple mutants in either 2-APB (2 mM) or RTx (100 nM) obtained the same way as in (A). Currents were normalized to the value in the presence of 2 mM 2-APB (n=3–5).
Figure 5 with 1 supplement
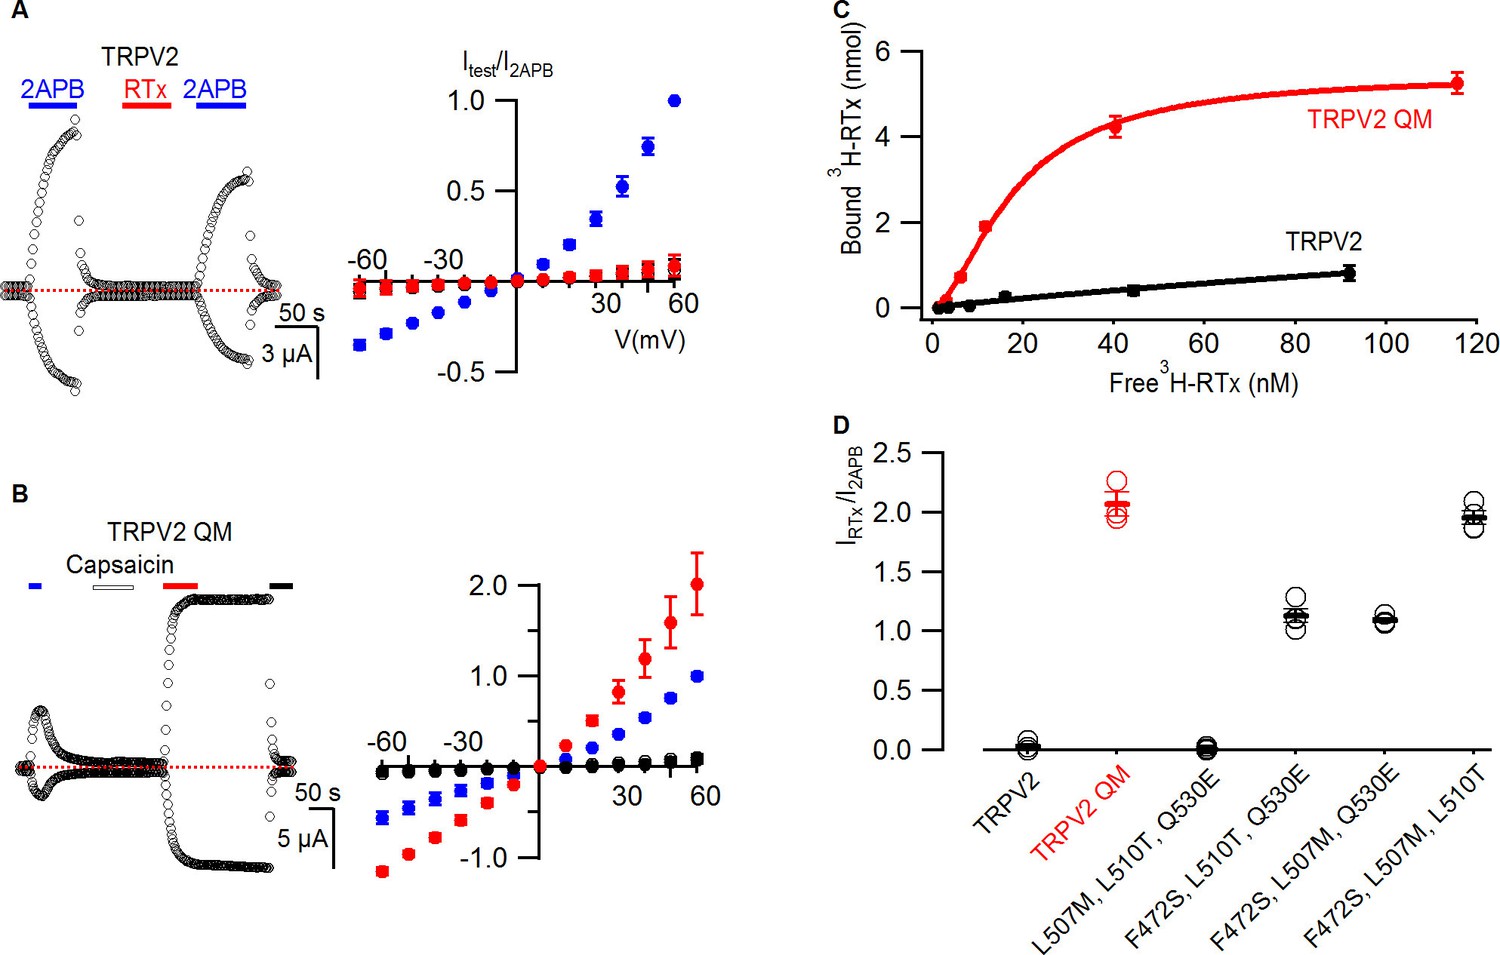
RTx binds to and activates the TRPV2 QM.
(A, left panel) Representative time courses for WT TRPV2 in the presence of 2-APB (4 mM) or RTx (100 nM) measured at +60 and -60 mV. Same pulse protocol as Figure 3. The dotted horizontal line indicates the zero-current level. (A, right panel) Mean normalized I-V relations under different conditions using the color codes from Figure 3. Currents were normalized to the value in the presence of 2-APB (4 mM). Data are expressed as mean ± S.E.M. (n = 3). (B, left panel) Response of the quadruple mutant of TRPV2 (F472S, L507M, S510T, Q530E) to 2-APB (4 mM),capsaicin (50 µM) and RTx (100 nM) obtained as in (A). (B, right panel) Mean normalized I-V relations under different conditions using the color codes from Figure 3. Data are expressed as mean ± S.E.M. (n=4–8). (C) Binding of 3H-RTx to membranes containing 1D4-tagged TRPV2 QM (red) and 1D4-tagged WT TRPV2 (black). Membranes were prepared from yeast expressing the two constructs to comparable levels as judged by westerns using a 1D4 mAb and equal amounts of membranes were used for assessing binding of RTx to the two TRPV2 constructs, and data were corrected for non-specific binding as described in Materials and methods. Smooth functions are fits of the Hill equation to the data with Kd and nH values of 18 nM and 1.7 for TRPV2 QM and of > 200 nM and 0.9 for wt TRPV2. (D) Summary of the response of TRPV2, TRPV2 QM and thee triple mutants to RTx. Currents measured in response to RTx (100 nM) at +60 mV are normalized to that measured in response to 2-APB (4 mM). Values for individual cells are shown as circles and the mean + S.E.M. as bars.
Figure 5—figure supplement 1
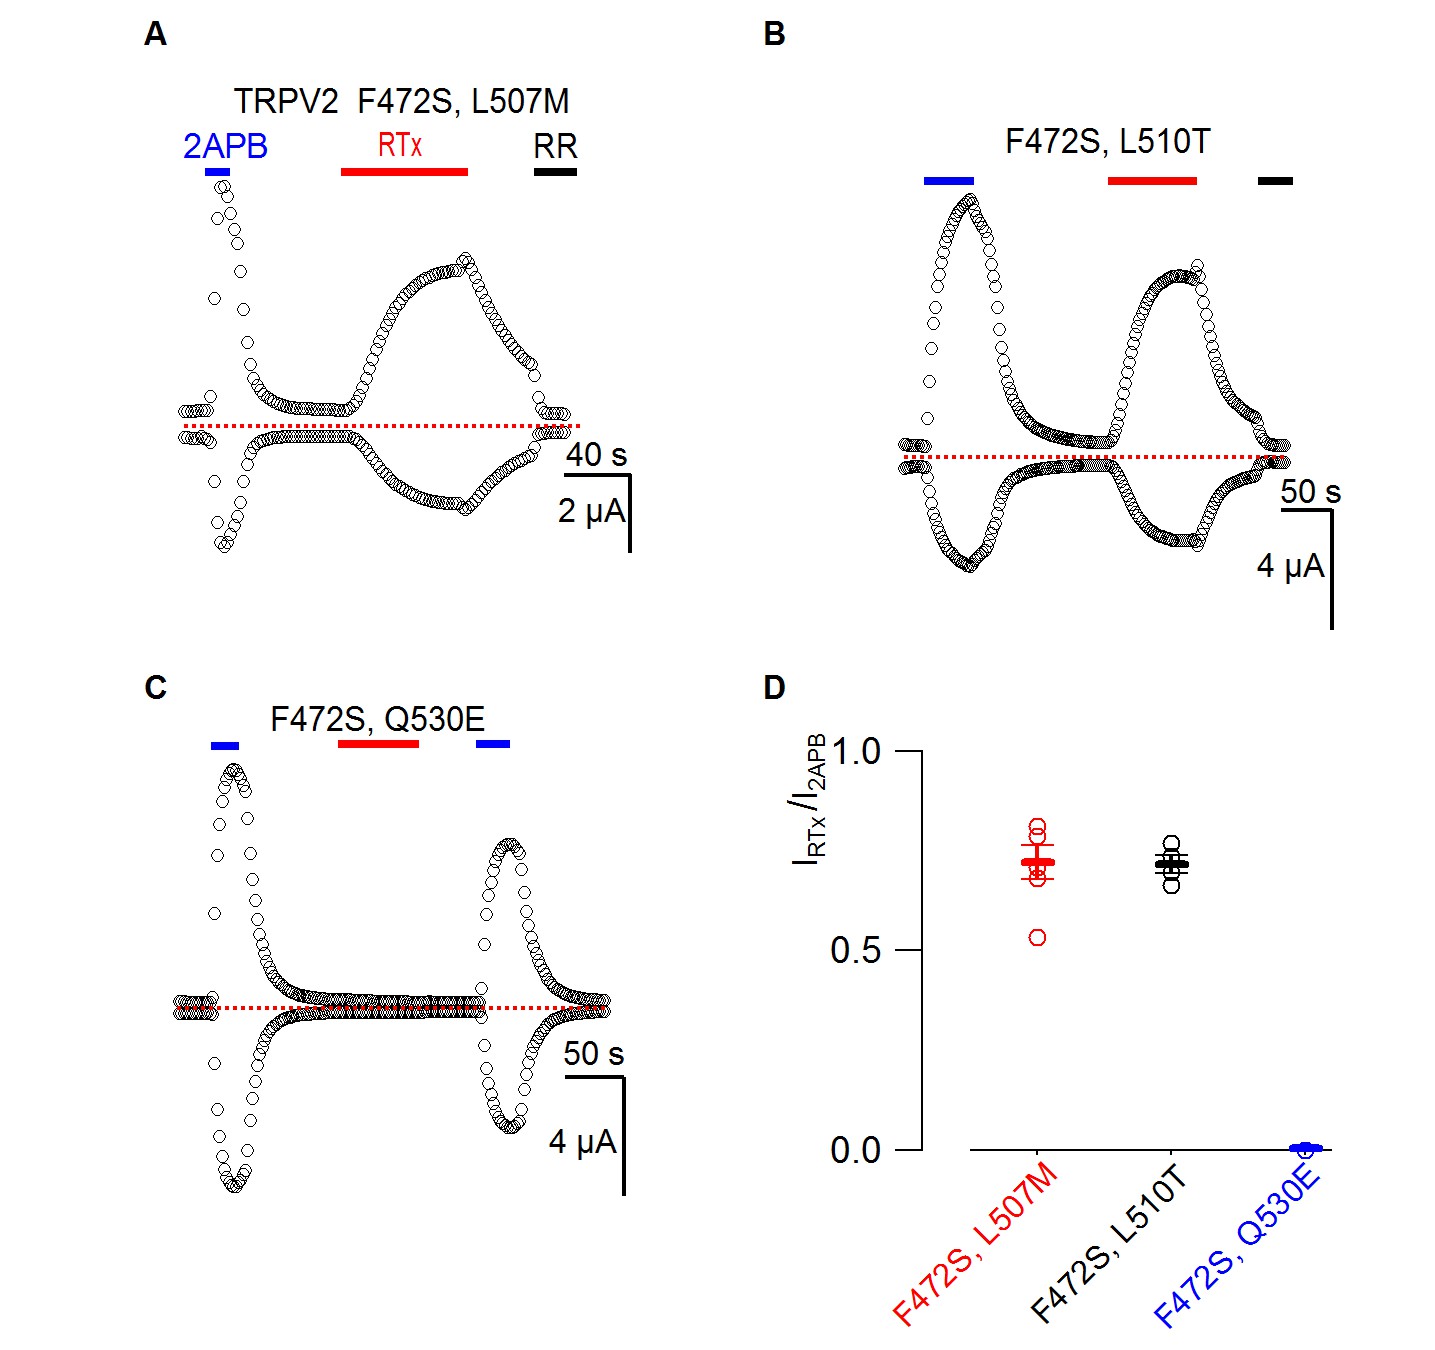
Responses of TRPV2 double mutants to RTx.
(A-C) Representative time courses for TRPV2 double mutants activated by 2-APB (4 mM) or RTx (100 nM) measured at +60 and −60 mV. RR (50 µM) was applied as indicated. See Figure 3 for the voltage protocol. The dotted horizontal line indicates the zero-current level. (D) Summary of the response of TRPV2 double mutants to RTx (100 nM) normalized to that of 2-APB (4 mM.) Values for individual cells are shown as circles and the mean + S.E.M. as bars (n=3–5).
Figure 6 with 1 supplement
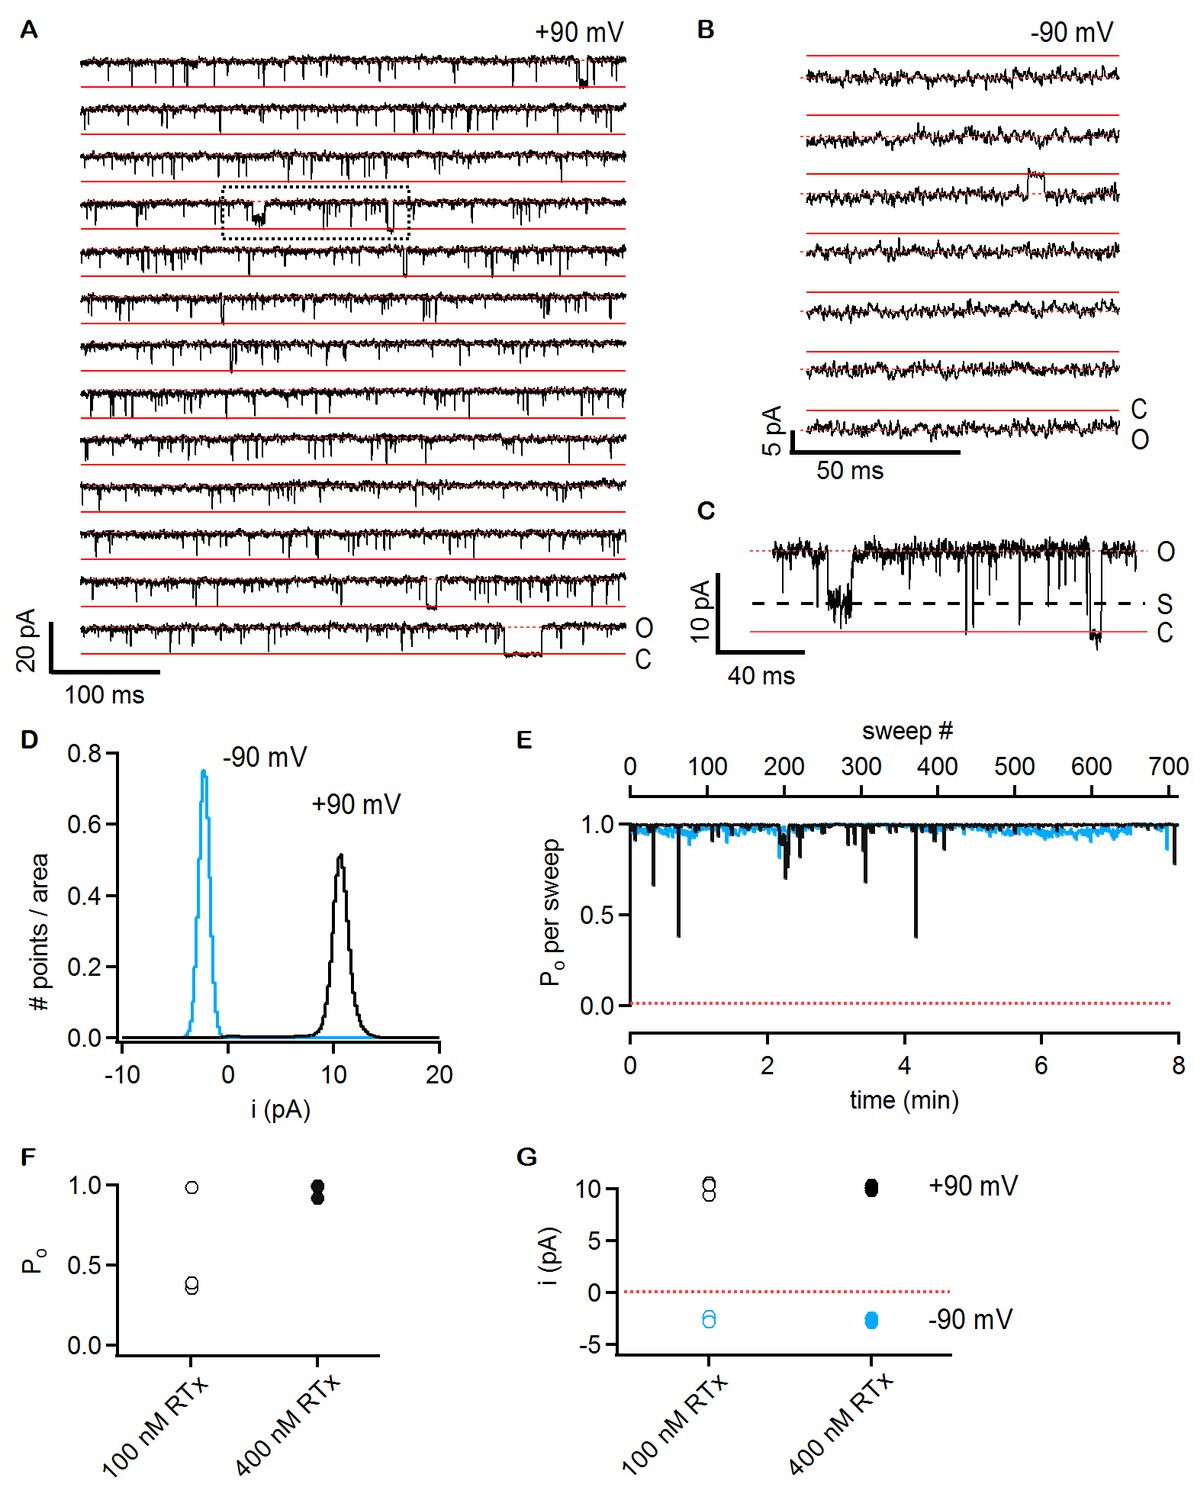
RTx activates the TRPV2 QM channel with high efficacy and affinity.
(A) Single-channel recordings of TRPV2 QM obtained from an inside-out patch at +90 mV in the presence of 100 nM RTx. Currents were elicited by 500 ms pulses to +90 mV from a holding potential of −90 mV applied every 200 ms. A trace without openings obtained in control solution prior to RTx application was used for leak-subtraction. The red continuous horizontal lines indicate the zero-current level (closed channel - C) and the dotted lines the current level for an open channel - O. The blue dotted rectangle denotes a portion of the recording that is shown in higher magnification in (C). (B) Single-channel recordings from the patch in (A) obtained at the holding potential of -90 mV. The continuous red lines are the zero current level (closed channel – C) and the dotted lines denote an open channel (O). (C) Magnification of the single-channel recordings in the dotted black box in (A) showing the occurrence of subconductance levels, denoted by (S) and the dashed black line. (D) Normalized all-points histograms from all recordings obtained at +90 (black) and -90 mV (blue) from the patch in (A-C). Histograms were normalized to the total area under the curve. (E) Po per sweep as a function of recording time calculated for all recordings at +90 (black) and -90 mV (blue) from the same patch in (A-D). The dotted red line denotes a Po of 0. (F) Mean Po values for TRPV2 QM at 100 nM RTx (open symbols) and +90 mV calculated from the single-channel patch in (A-E) and from two other patches with two channels each (n = 3 independent patches), together with Po values at 400 nM RTx (closed symbols) calculated from two single-channel patches and two patches containing two channels each (n = 4 independent patches). (G) Single-channel current amplitudes for the full-conductance level of an open TRPV2 QM channel in the presence of 100 nM (open symbols) or 400 nM (closed symbols) RTx at +90 (black) or -90 mV (blue) obtained from the same patches as the Po values in (F). The dotted red line denotes the zero-current level.
Figure 6—figure supplement 1
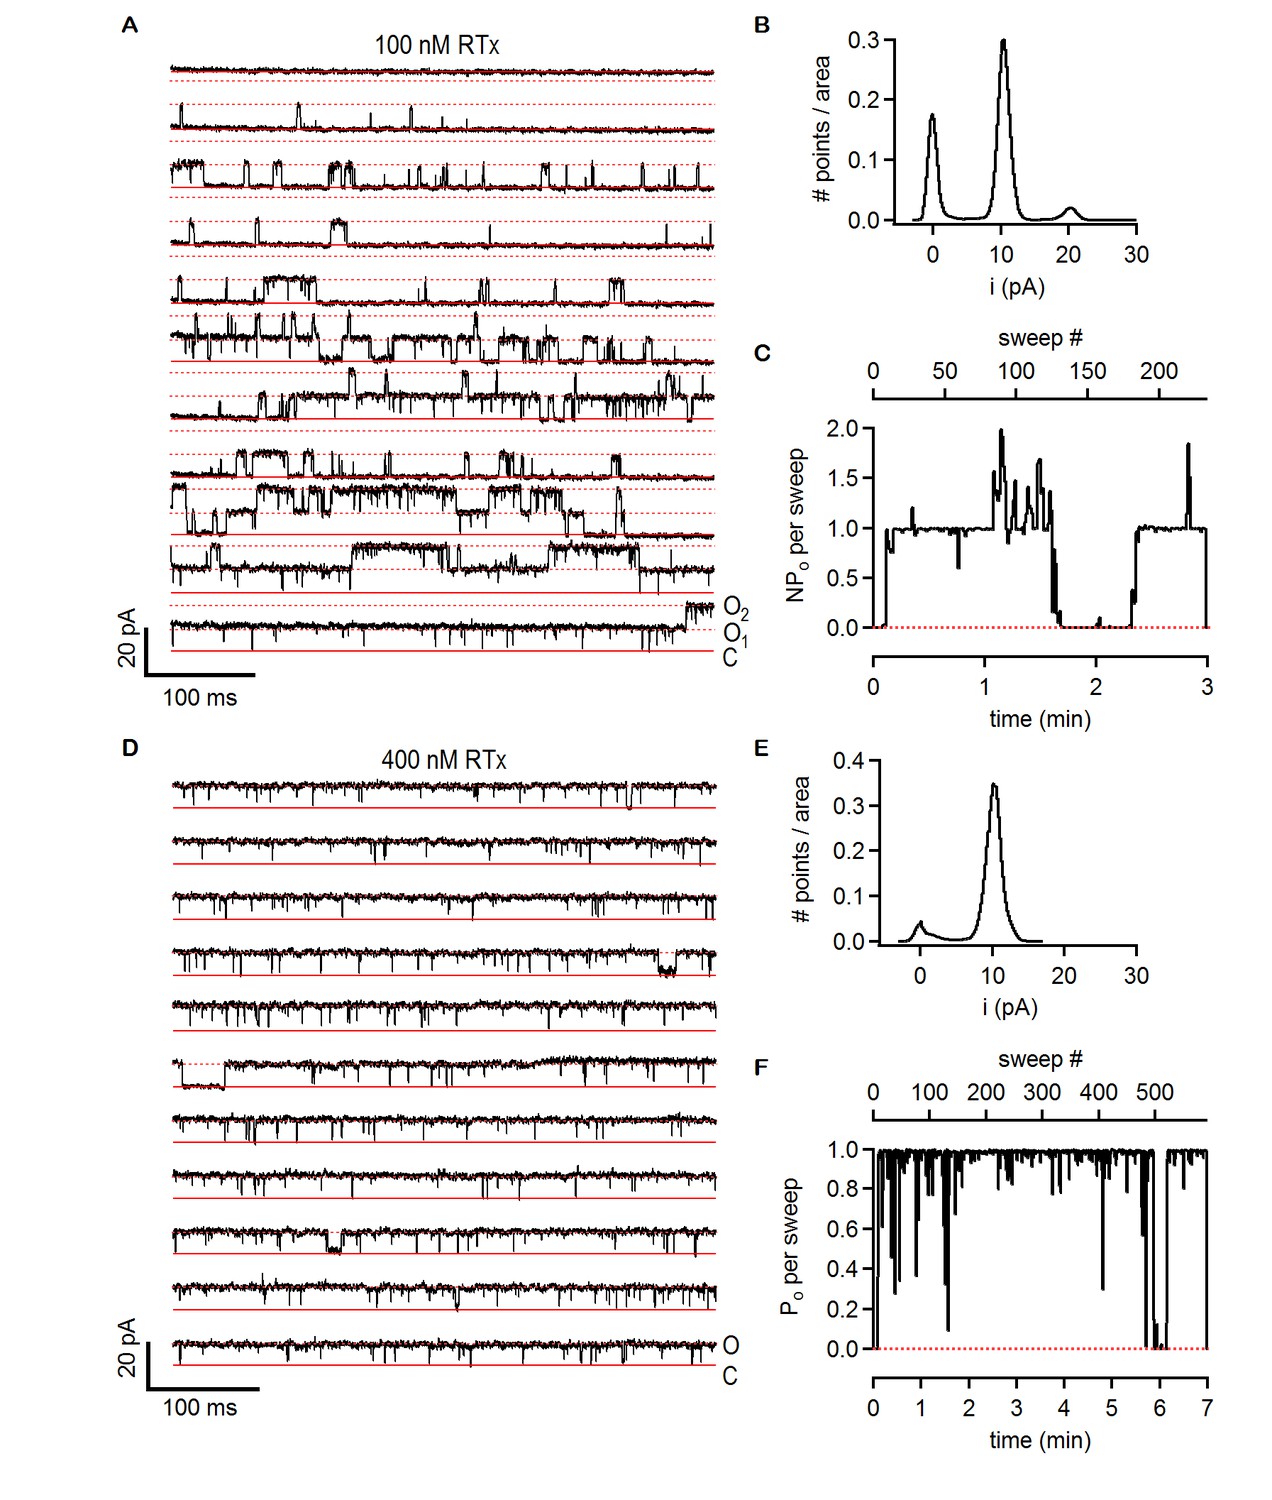
Single-channel activity of TRPV2 QM in the presence of 100 nM and 400 nM RTx.
(A) Recordings from an inside-out patch containing two TRPV2 QM channels in the presence of 100 nM RTx at +90 mV. The voltage protocol used was the same as in Figure 6A. The red continuous horizontal lines indicate the zero-current level (closed channel - C) and the dotted lines the current level for an open channel (O1) or two simultaneously open channels (O2). (B) Normalized all-points histogram from all recordings obtained at +90 mV from the patch in (A). The histogram was normalized to the total area under the curve. (C) NPo per sweep (where N is likely to be 2) calculated for all recordings at +90 as in (A) from the same patch shown as a function of time. The dotted red line denotes an NPo of 0. (D) Single-channel TRPV2 QM recordings from an inside-out patch at +90 mV in the presence of 400 nM RTx. The red continuous horizontal lines indicate the zero-current level (closed channel - C) and the dotted lines the current level for an open channel (O). (E) Normalized all points-histogram from recordings at +90 mV and 400 nM RTx from the patch in (D). (F) Po per sweep as a function of time calculated for the patch in (D) at +90 mV and 400 nM RTx. The dotted red line denotes a Po of 0.
Figure 7
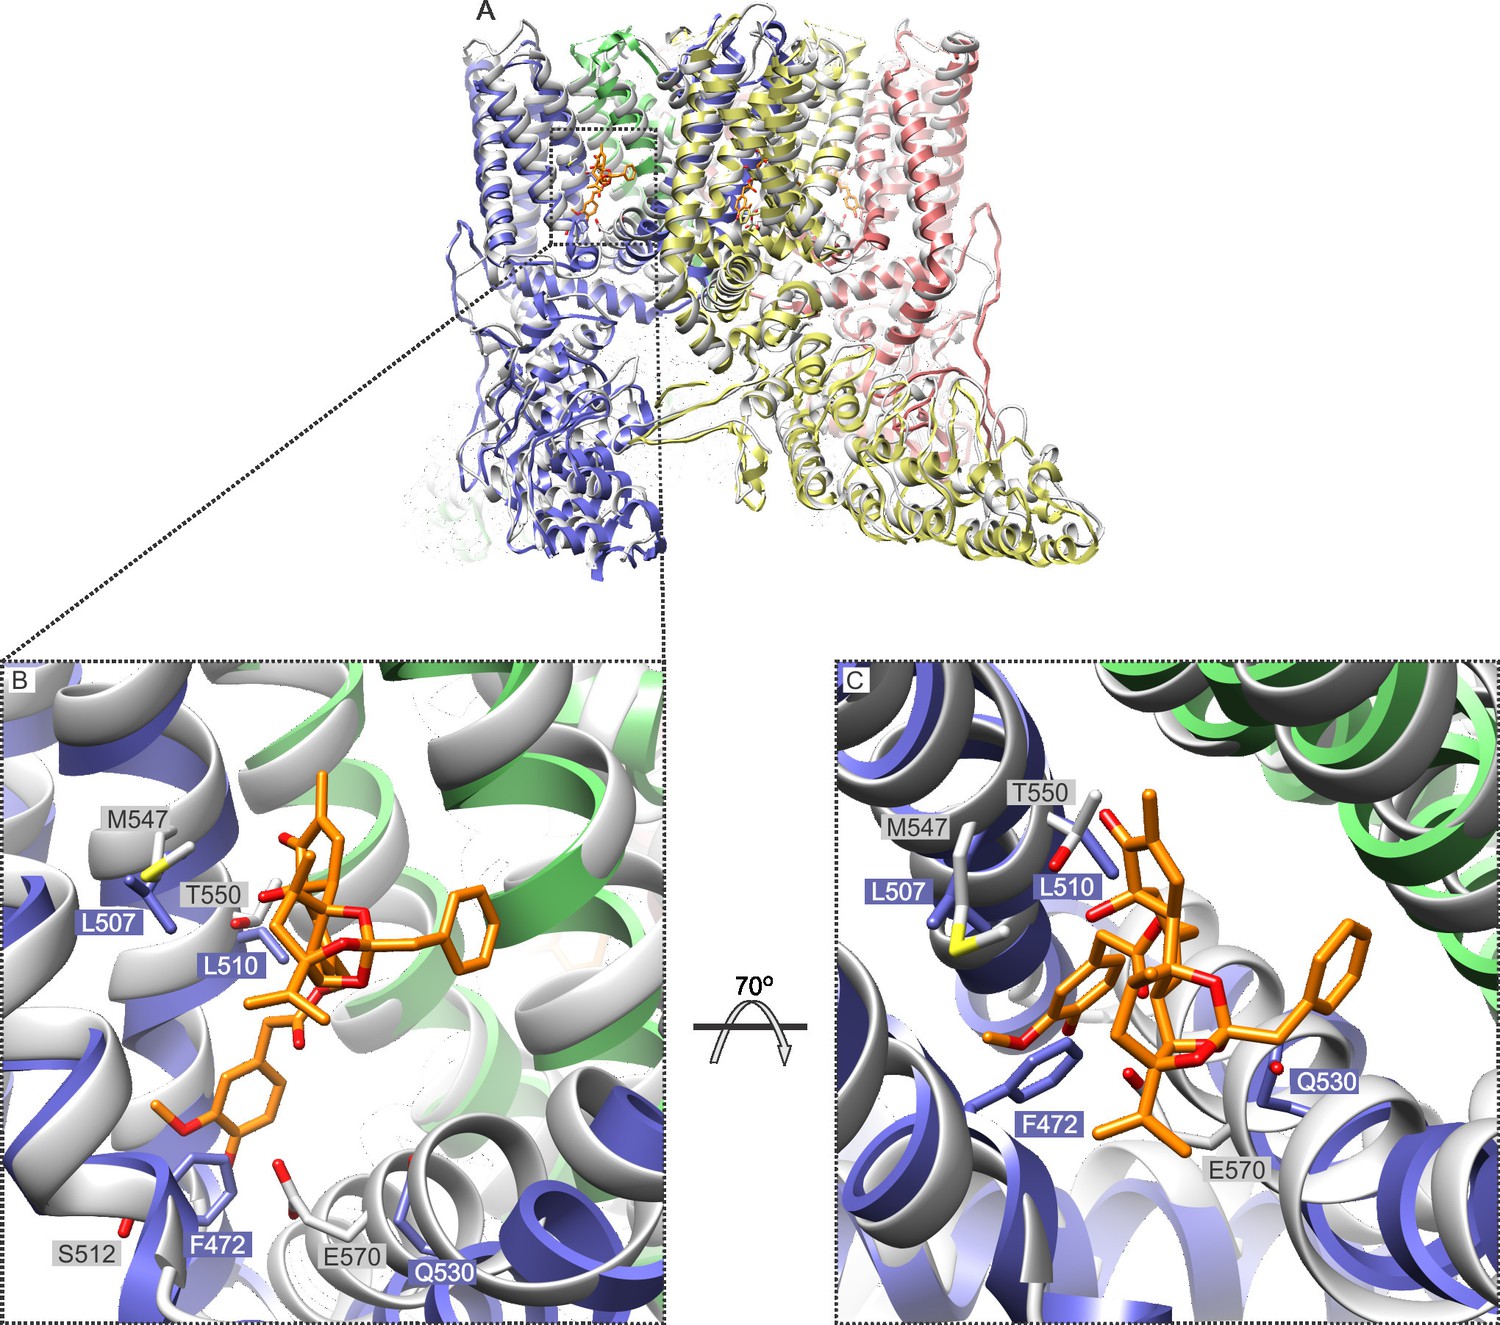
Comparison of the structures of TRPV1 and TRPV2 and the RTx binding pocket.
(A) Side view of the superposition of the cryo-EM structure of the RTx/DkTx-bound rTRPV1 channel (gray) (Cao et al., 2013) with that of rabbit TRPV2 (colored by chain) (Zubcevic et al., 2016). RTx is shown in orange as docked by (Elokely et al., 2016). (B,C) Enlarged views of the RTx binding pocket showing the side chains in stick representation for the four mutated residues in TRPV2 QM numbered according to the rat sequence of the two proteins. TRPV2 subunits are colored by chain and TRPV1 is shown in gray.
Download links
A two-part list of links to download the article, or parts of the article, in various formats.
Downloads (link to download the article as PDF)
Open citations (links to open the citations from this article in various online reference manager services)
Cite this article (links to download the citations from this article in formats compatible with various reference manager tools)
Engineering vanilloid-sensitivity into the rat TRPV2 channel
eLife 5:e16409.
https://doi.org/10.7554/eLife.16409


