A circuit motif in the zebrafish hindbrain for a two alternative behavioral choice to turn left or right
- Cornell University, United States
- Howard Hughes Medical Institute, Janelia Research Campus, United States
Figures
Figure 1
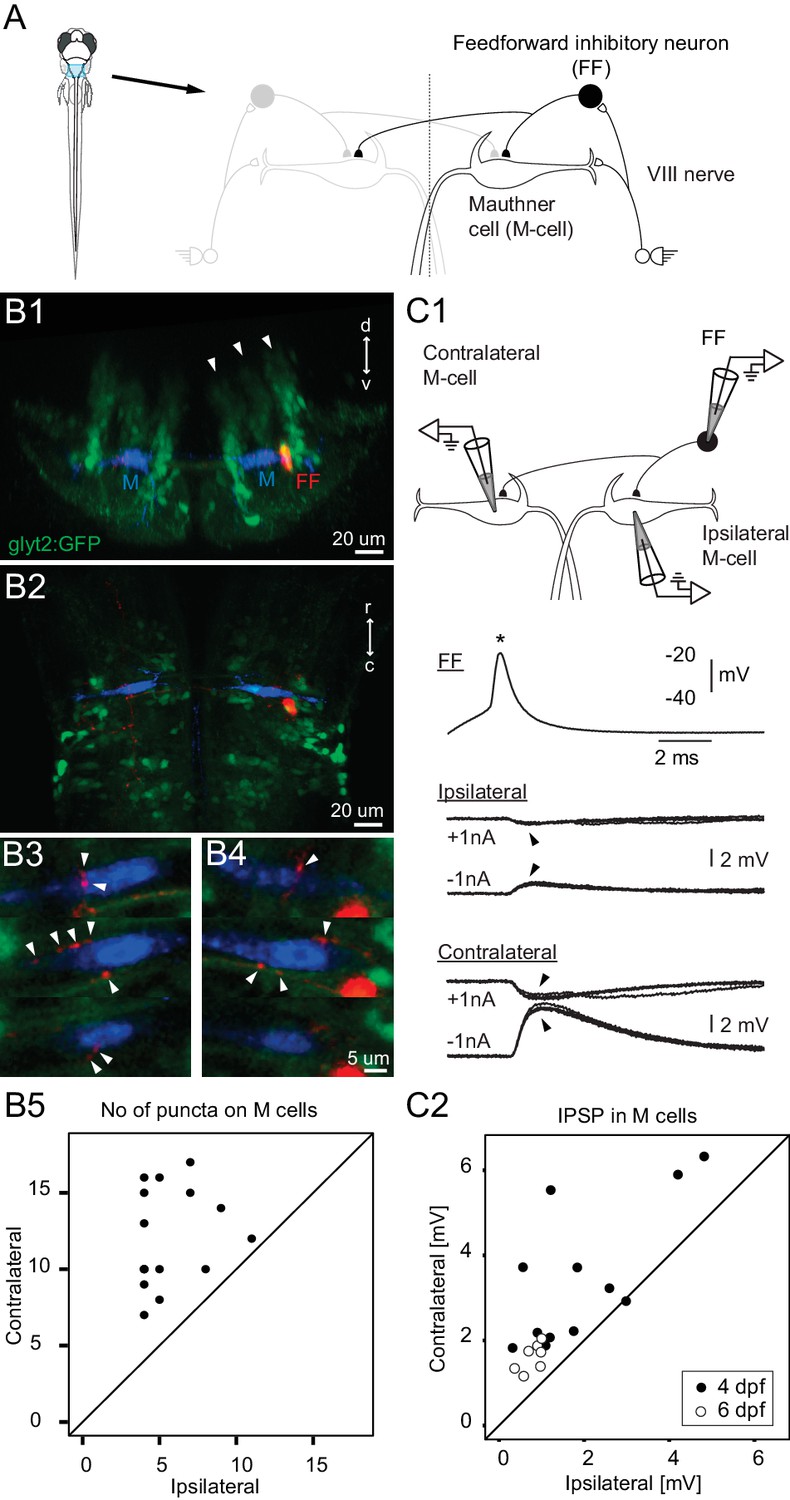
Connectivity of inhibitory neurons implicated in the laterality of the escape response.
(A) The blue region marked on the drawing of the fish contains the two Mauthner cells and neuronal candidates for their control, which may determine whether the animal escapes to the left or right. Right side shows some known contacts in this network, with sensory inputs from the eighth nerve exciting the ipsilateral M-cell as well as inhibitory interneurons that inhibit both M-cells. (B1) A cross section through the hindbrain in the region of the Mauthner cell from a transgenic line with glycinergic neurons labeled with GFP (green). The two Mauthner cells (blue) and a filled feedforward (FF) inhibitory interneuron (red) were labeled via patch pipettes. The FF neuron lies at the bottom of the most lateral of three columns (arrowheads) of glycinergic neurons, near the lateral dendrite of the M-cell. (B2) A horizontal view of the region shows that red processes of the FF neuron are located in the vicinity of both the ipsilateral and contralateral M-cells. Optical sections through the region of the contralateral (B3) and ipsilateral M-cells (B4) show swellings (arrowheads) of the processes from the inhibitory FF cell adjacent to both M-cells. (B5) A plot of the number of boutons adjacent to ipsilateral versus contralateral M-cells from 14 fish (4 days old) in which individual FF cells and both M-cells were labeled. In every case, the number of boutons apposed to the contralateral cell exceeded the number apposed to the ipsilateral one, with a highly significant difference between the two sides (p<0.0001). (C1) Triple patch recordings from an FF neuron and the two M-cells show that firing the FF cell (asterisk) by current injection produces larger IPSPs in the contralateral M-cell than the ipsilateral one (arrowheads). IPSPs from four sweeps are shown at potentials above and below resting potential by the injection of plus or minus 1 nA of current into the M-cells. This electrophysiology is from the neurons whose morphology is shown in B. (C2) A plot of the amplitude of the IPSPs (for negative 1 nA injection) in the ipsilateral versus contralateral M-cell from 19 triple patch experiments like the one in C1. Seven of these were from 6 days old nacre fish and 12 from 4 days old relaxed fish. In 18 of 19 experiments, the IPSPs were larger in the contralateral M-cell, with a highly significant difference between the two sides (p<0.001).
Figure 2 with 1 supplement
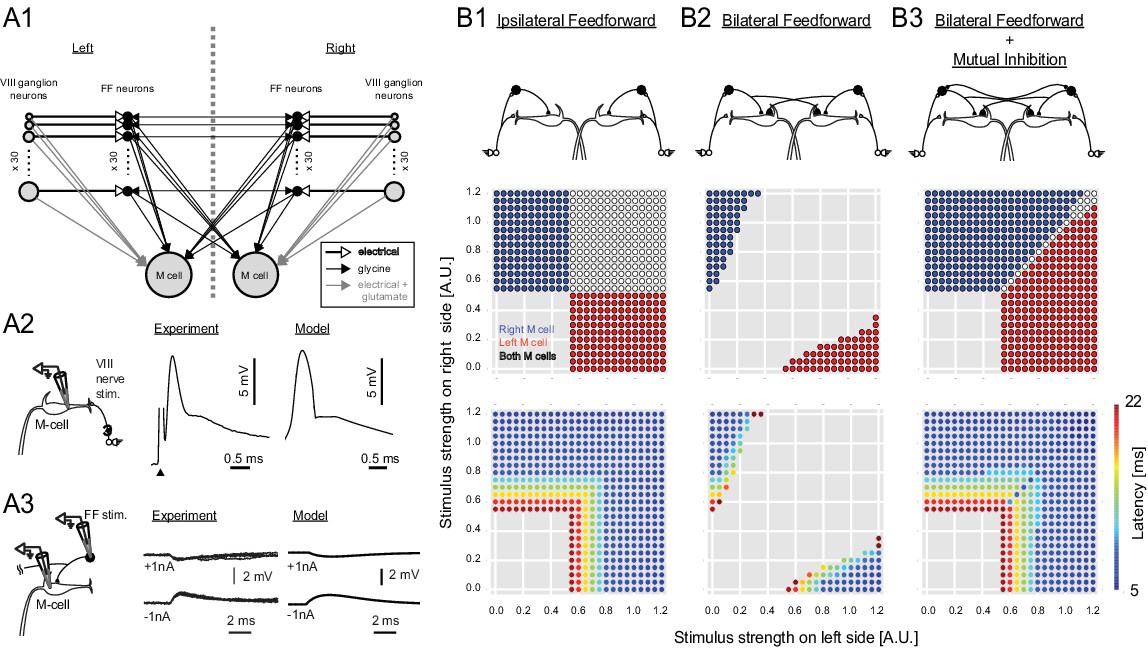
Output of a computational model of the studied neurons in the Mauthner network.
(2A1) Connectivity implemented in the model. Gray arrows indicate mixed electrical and excitatory glutamatergic connections. White arrows indicate pure electrical connections. Black arrows indicate inhibitory glycinergic connections. (2A2) Mauthner response to eighth nerve stimulation. The eighth nerve on one side was stimulated (left panel) and the EPSP in the lateral dendrite of Mauthner cell was recorded experimentally (middle panel). The EPSP in the model was simulated by synchronous activation of eighth ganglion neurons (right panel). (2A3) Inhibitory input from an FF neuron to a Mauthner cell. A single actual FF neuron is activated by current injection to fire a single spike while monitoring IPSPs in the ipsilateral Mauthner cell (left panel). Four traces are shown at potentials above and below reversal potential by injection of plus or minus 1 nA of current into the M-cells (middle panel). The modeled IPSP in the ipsilateral Mauthner cell during injection of plus or minus 1 nA of current (right panel). (2B1) Output of the computational model of Mauthner circuit with only ipsilateral feedforward inhibitory connections (upper panel). Various combinations of left (x-axis) and right stimuli (y-axis) are presented to the model circuit and each stimulus condition is color-coded based on the activation of Mauthner cells (blue: only right Mauthner cell fires, red: only left Mauthner cell fires, white: both Mauthner cells fire) (middle panel) and also based on the latency of the activation (lower panel). (2B2) Output as in B1, but with the addition of asymmetric bilateral feedforward inhibitory connections (upper panel). Middle and lower panels were formatted as in B1. (2B3) Output as in B2, but with the addition of putative reciprocal inhibitory connections between the FF neurons (upper panel).
Figure 2—figure supplement 1
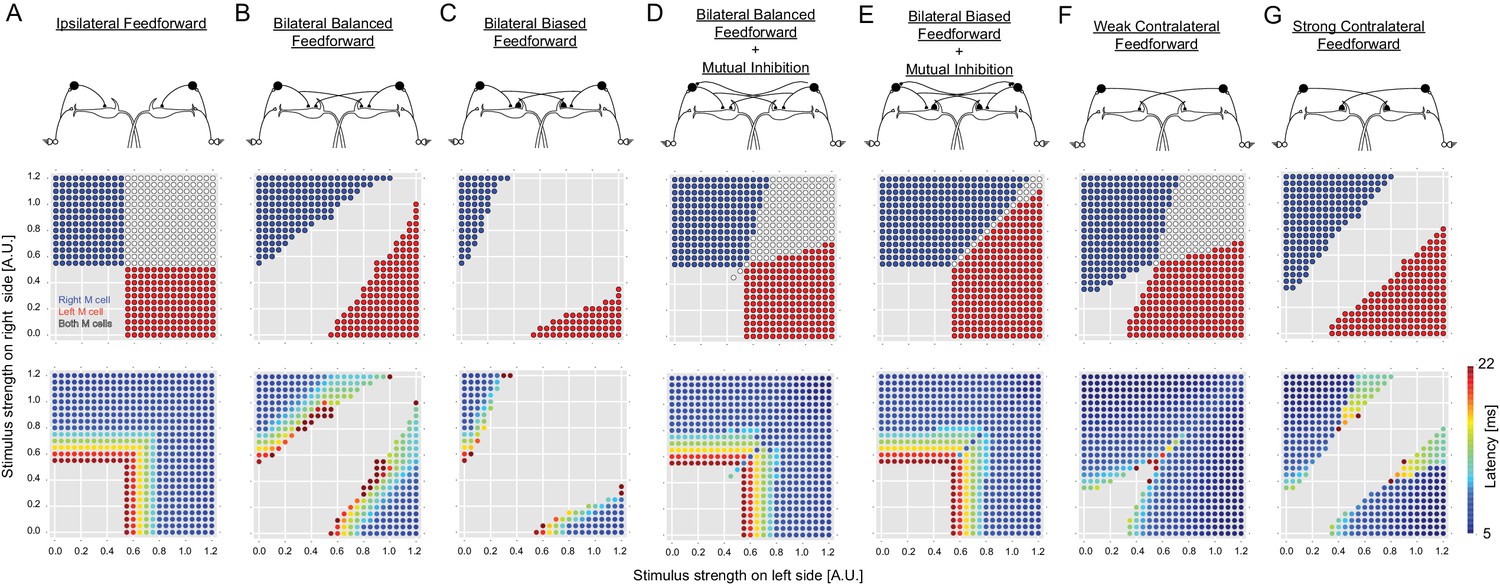
Outcomes of all of the circuit configurations modeled.
The layout is the same as in Figure 2, with panels A, C and E duplicated from Figure 2 to allow comparison with other variants of the circuit. (B) A circuit like that in C with ipsilateral and contralateral inhibition of the M-cells, but with symmetrical crossed inhibition of the M-cells, instead of the biased crossed inhibition in C that we actually observed experimentally. The symmetrical inhibition of the M-cells in network B leads to a smaller, though still substantial, zone of no escape responses than a similar model with biased inhibition (C). (D–E) Models like those in B and C, but including mutual inhibition between the inhibitory interneurons on opposite sides. Adding mutual inhibition between the inhibitory neurons in each of these recovers escape responses to strong bilateral inputs. This, however, leads to a seemingly more adaptive outcome when the M-cell inhibition is contralaterally biased (E), as this narrows the zone in which both M-cells are simultaneously activated. This configuration matches what we observed experimentally. F and G show model performance when there is only contralateral M-cell inhibition at symmetrical weak or strong levels (the levels are those used for the weak or strong biased connections in other panels, which are based on experiment). Both perform poorly, with large zones of simultaneous or no responses.
Figure 3
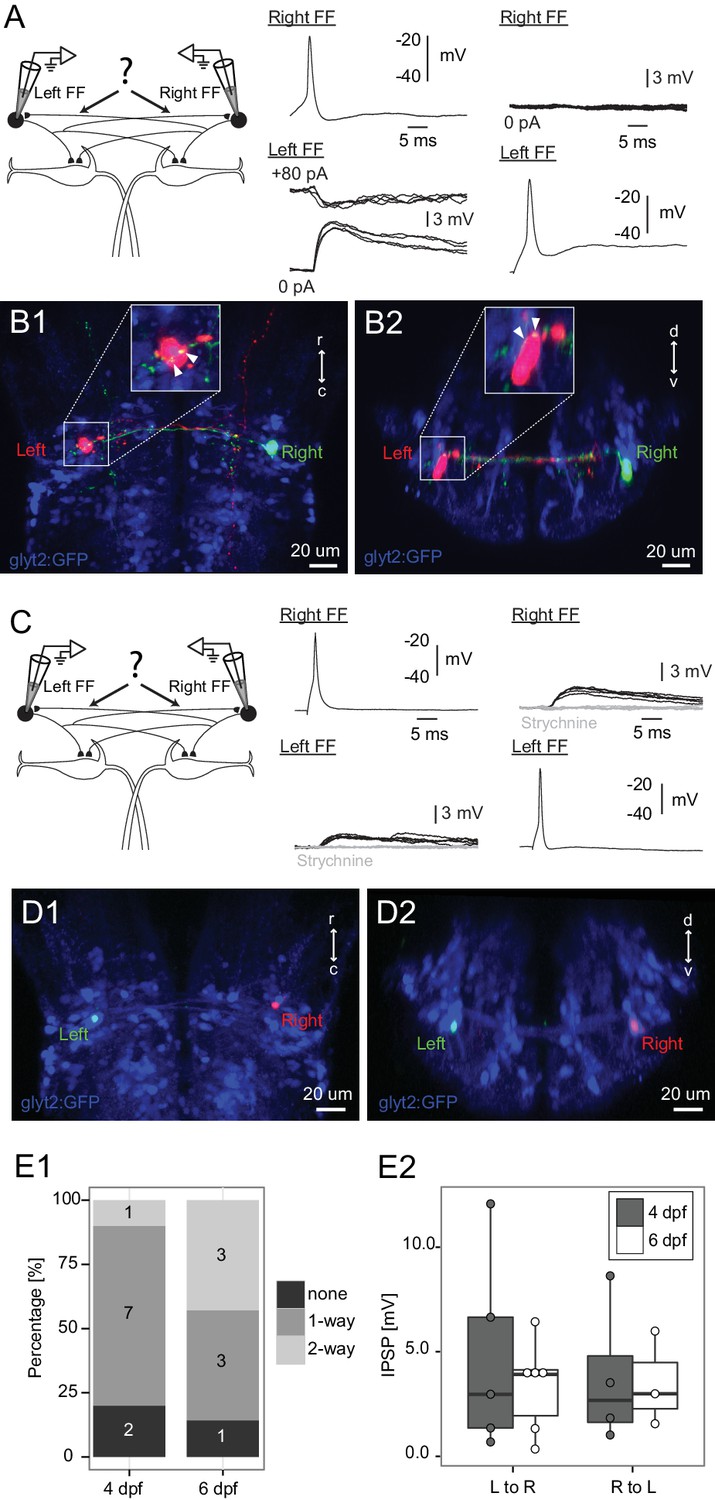
Connections between FF inhibitory neurons on the two sides.
(A) Patching of pairs of FF neurons on opposite sides of the brain. In this case, firing the right cell (Right FF) led to an IPSP in the FF on the left side (Left FF) (middle panel), but the left cell did not produce a response in the right one (right panel). B1 and B2 show horizontal and cross sections respectively, of the neurons recorded in A after filling them with dye. Green processes from the right neuron give rise to swellings apposed to the left neuron (arrowheads on insets in B1,B2, which show the soma at higher magnification), consistent with the physiological connection. (C) Paired patch recordings of two reciprocally connected FF neurons. Firing the right neuron led to a depolarizing response in the left cell and vice versa (dark traces). Both responses were blocked by strychnine (1 µM, gray traces), consistent with the PSP being a glycinergic inhibition with a reversal potential just above resting potential in our recording conditions. (D1–2) The locations of the neurons recorded in C in confocal images of the dye filled neurons after recordings. (E1) Patching of 17 bilateral pairs of FF neurons from either 4 day (relaxed) or 6 day (nacre) old fish revealed that most were connected to each other in one or both directions. Numbers in the histograms indicate the number of pairs with connections in neither direction (none), one direction (1-way), or reciprocal connections (2-way). (E2) Box plot of the strengths of the connections from left to right and right to left (only measured in cases where there was a connection in a given direction). The connection strengths were not significantly different in the two directions.
Figure 4
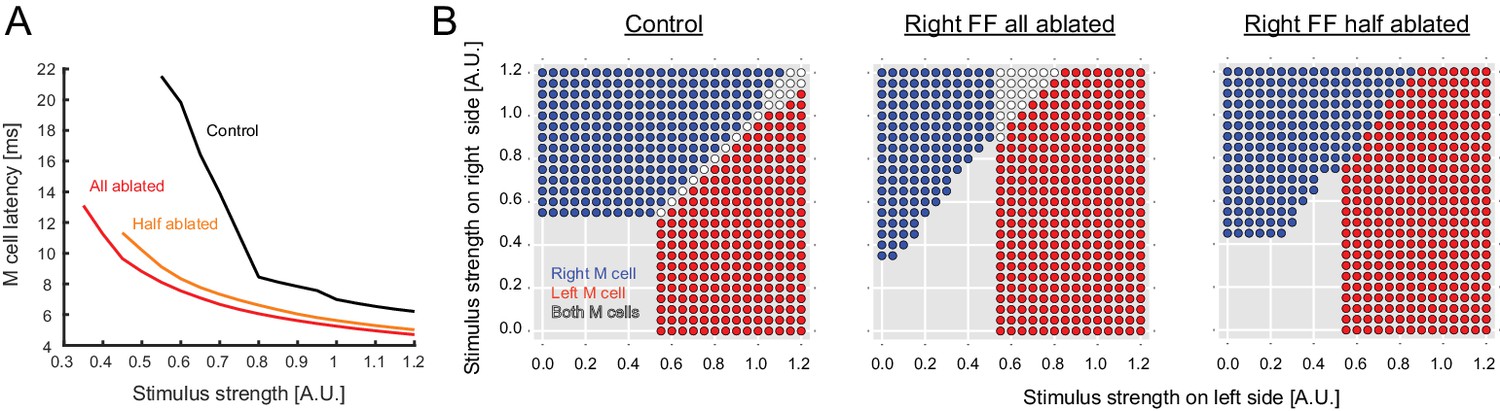
Output predicted by the model after ablation of FF neurons.
(A) Modeled latency of the Mauthner cell spike as a function of the simulated stimulus strength in control (black) and in cases where the entire pool of FF-neurons was removed from the model on the stimulated side (red) or half the pool was removed (orange). The response latency becomes shorter after removal of FF neurons in the model. (B) Biased left-right decision after one-sided FF-removal in the model. A series of left and right stimuli is presented to the control model (left panel) and the FF-removed models (right panels). The stimulus conditions that lead to the activation of one of the Mauthner cells are color-coded based on the activation pattern (blue: only right Mauthner cell fires, red: only left Mauthner cell fires, white: both Mauthner cells fire). The likelihood of left Mauthner activation increases after the removal of right FF neurons.
Figure 5
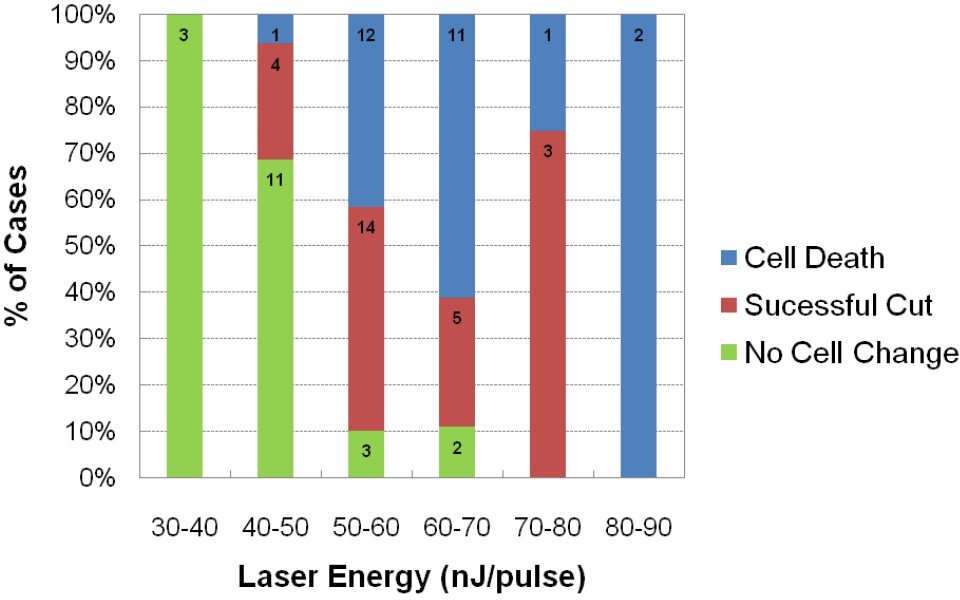
Assessment of impact of laser intensity on the Mauthner cell.
Plot shows the results of targeting the lateral dendrite of 72 Mauthner cells with laser pulses of different intensities, showing the percentage of cases in which the cell died, the lateral dendrite was cut off with the neuron surviving, or no obvious change in the cell. Numbers on bars indicate the number of fish in each category.
Figure 6
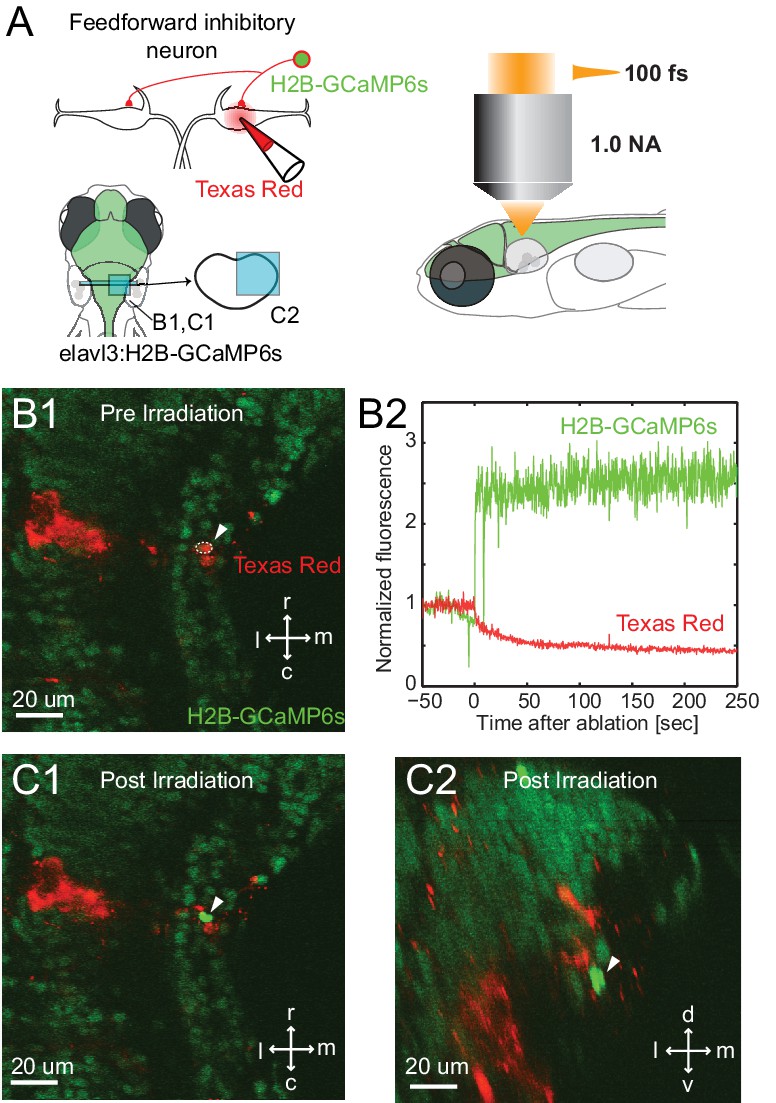
Specificity of laser targeting of inhibitory neurons.
(A) FF neurons were backfilled with Texas red in a transgenic line with neurons labeled with nuclear targeted GCaMP6s. (B1) Image prior to laser targeting showing the cell to be targeted marked by the white arrow head. (B2) GCaMP6s fluorescence from the targeted cell following laser illumination for ablation shows a massive increase in fluorescence, also visible in images of the targeted neuron in horizontal (C1) and cross section (C2) images taken after illumination. Note the bright green signal is evident only in the targeted cell and not in surrounding neurons next to and above it, showing the specificity of the targeting.
Figure 7

Examples of Laser ablations.
(A) Diagram showing the approach to ablations, with initial filling of the Mauthner cell with red dye by single cell electroporation in a line with GFP labeled glycinergic neurons, followed by imaging and ablations from above with a femtosecond laser. (B1–B3) Control fish exposed to laser power below threshold for lesions shown pre irradiation (B1), immediately post irradiation (B2) and between 1 and 2 days later (B3). Glycinergic neurons are green, with arrows pointing to the cluster of feedforward cells on either side of the red Mauthner cell. (C1–C3) As in B, but with laser ablation directed at the visible feedforward neurons (arrows in C1), most of which were removed (C3), while preserving the adjacent red dendrite of the M-cell. (D1–D3) Laser targeting of the lateral dendrite of the Mauthner cell (arrow) sometimes severs the lateral dendrite, while leaving the adjacent inhibitory neurons and the soma of the M-cell intact (D3). (E1–E3) Laser targeting of the lateral dendrite that led to death of the M-cell (soma marked by arrowhead in E1 is absent in E3), but preservation of adjacent inhibitory neurons.
Figure 8
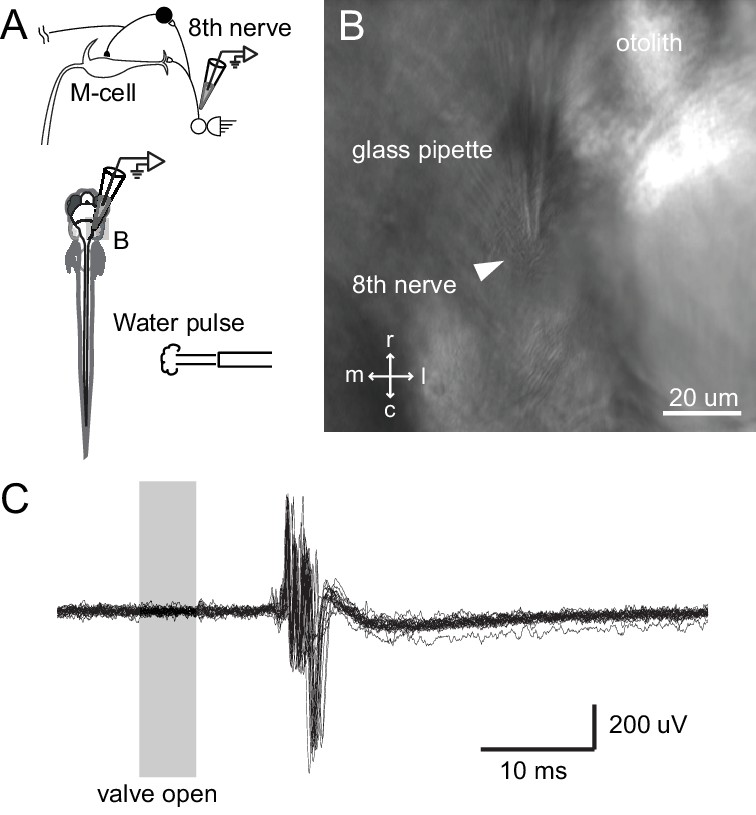
Tail directed water pulse leads to activation of axons in the eighth cranial nerve.
(A) Diagram of the experiment in which extracellular recordings from the eighth cranial nerve in a paralyzed larvae were performed while applying a pulse of water directed at the tail. (B) Image of the glass recording electrode on the eighth nerve. (C) The water pulse led to extracellularly recorded activity in fibers of the eighth nerve, showing that a water pulse like that we used on freely swimming fish can produce an auditory response, even though tail directed.
Figure 9
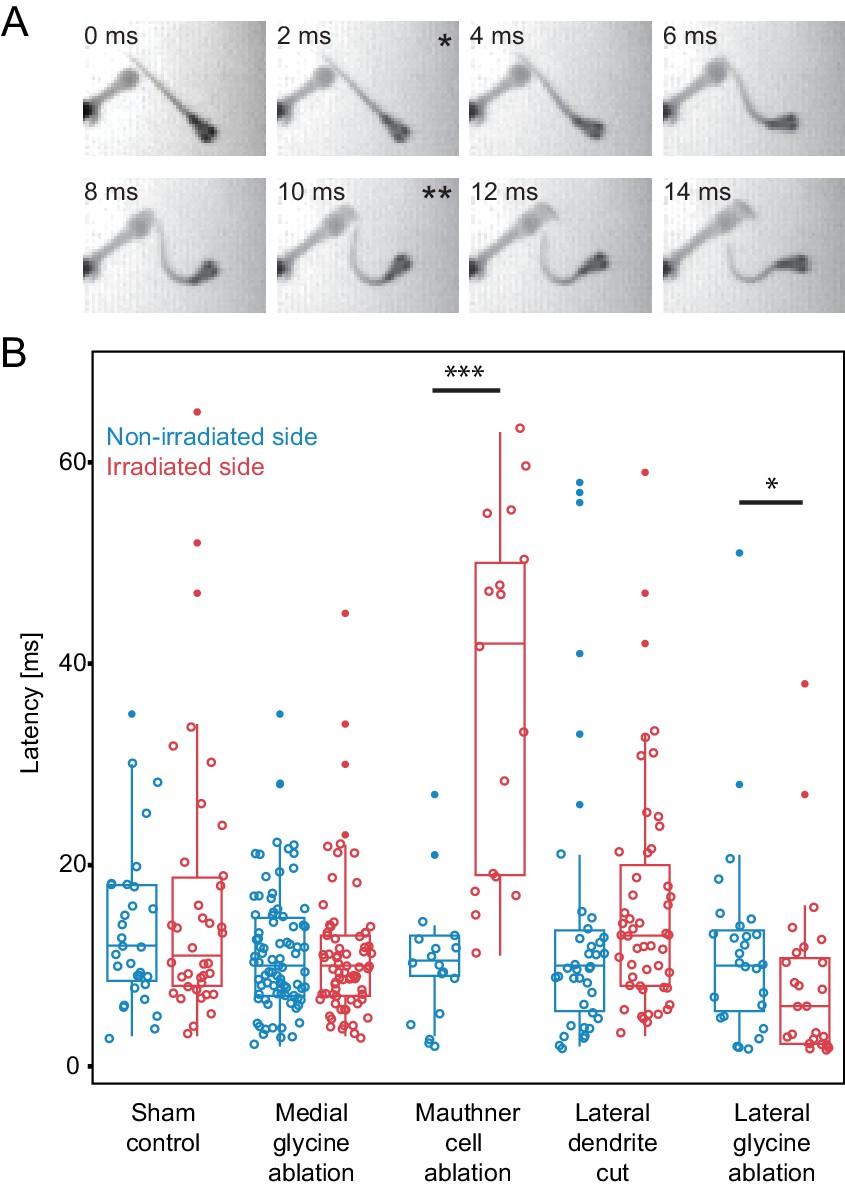
Escape latency of control and lesioned fish in response to a unilaterally directed squirt of water.
(A) Example trial showing the escape elicited by a squirt of colored water from a needle on the left side of the frame. The bend begins in the second frame (*) and the fish performs a rapid escape bend away from the stimulus in subsequent frames, with the peak initial bend at 10 ms (**). (B.) All of the data for the latency of escape response from lesioned (red) and unlesioned (blue) sides in controls and in the different ablation conditions. Box and whisker plots represent median as well as first and third quartiles. Outlier points are solid. Asterisks mark significant differences between responses on intact and lesioned sides (*p<0.05, ***p<0.001, corrected for multiple comparisons). Sham ablations and ablation of medial glycinergic cells near the M-cell, but not implicated in escapes, did not affect the latency. Killing the Mauthner cell led to a significant increase in latency. Cutting dendrite of the M-cell also led to a trend toward a longer latency, although it was not significantly different from the intact side. Ablation of the lateral FF glycinergic neurons led to a significant reduction in the latency to respond.
Figure 10
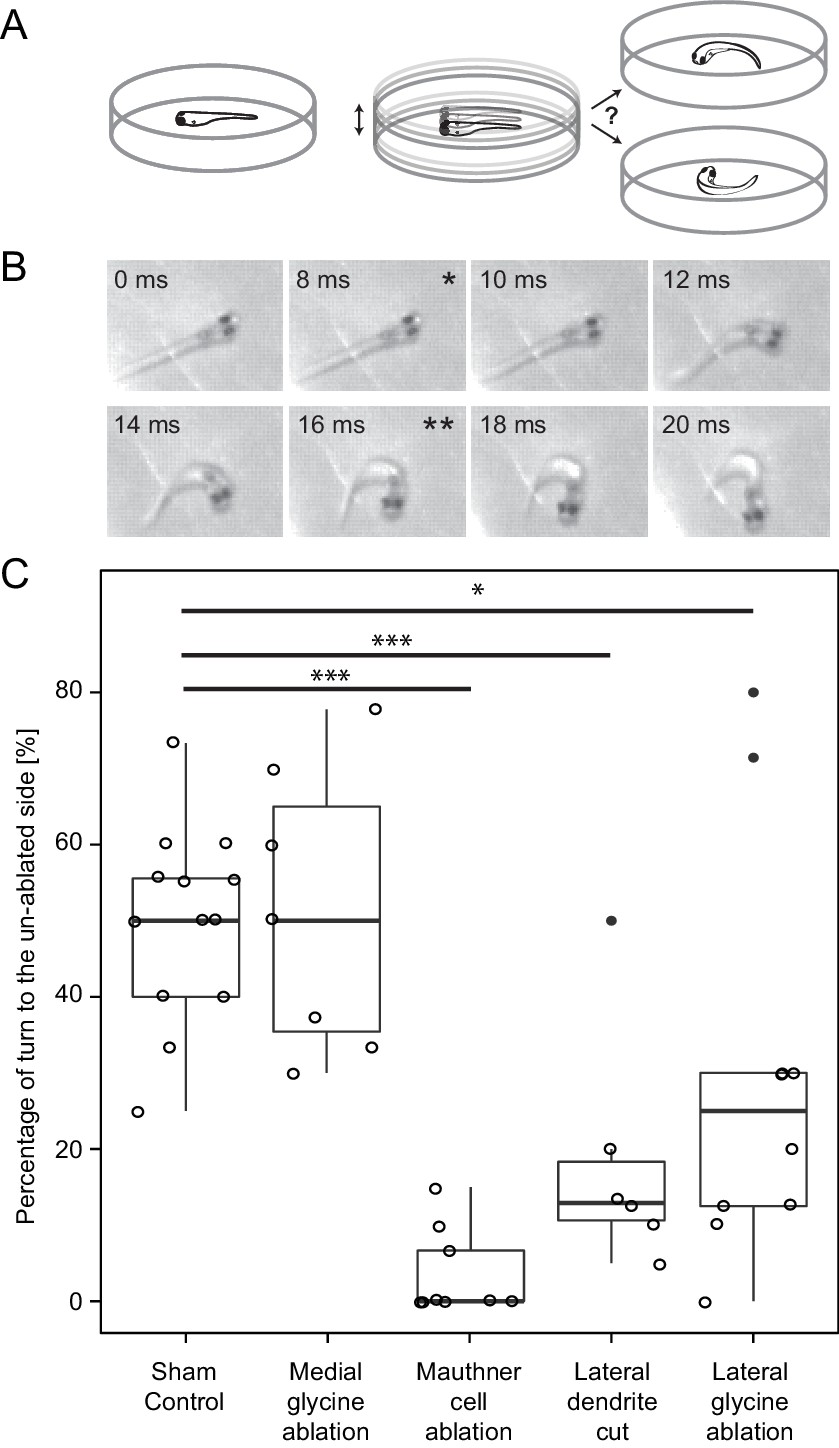
Response laterality of control and lesioned fish in response to an omnidirectional stimulus.
(A) Diagram of the experiment in which a dish containing a freely swimming fish is vibrated and the left/right direction of the initial escape turn is monitored. (B) An example of the high speed video recordings of a trial in which the escape response occurred to the fish’s right side. Asterisks mark the beginning (*) and end (**) of the initial bend. (C) All of the data for response laterality for the control and lesion conditions, showing the percentage of responses initiated by the ablated side, which led to a turn away from that side and toward the intact side. Every lesion condition, except the ablation of medial glycinergic cells not implicated in escape, was significantly different from sham controls, with the magnitude of the change differing depending upon the type of lesion (*p<0.05, ***p<0.001, corrected for multiple comparisons).
Figure 11
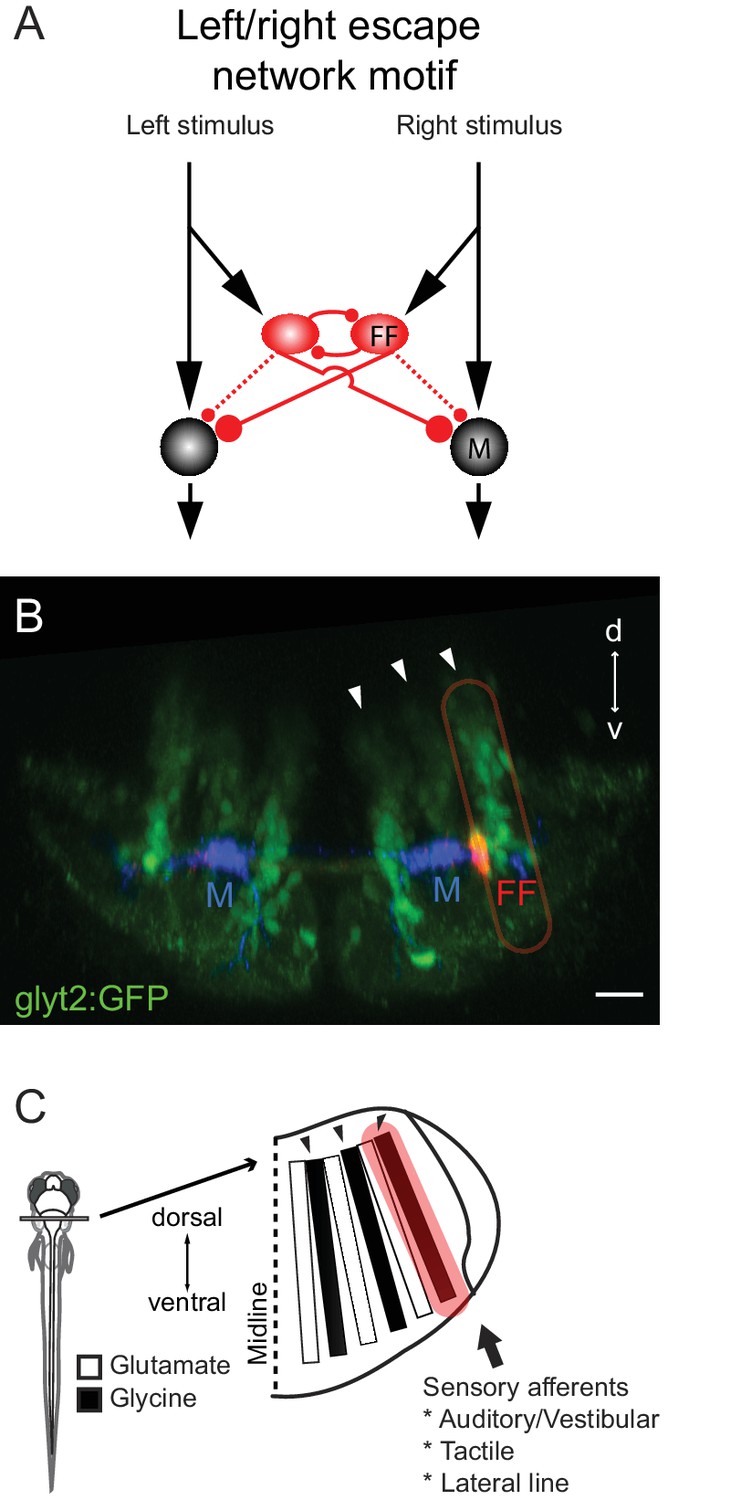
Summary of the circuit and its relationship to hindbrain structure.
(A) Diagram of the circuit motif for the left right choice revealed and tested behaviorally in this paper. Relative synaptic strengths are indicated by contact size. Dotted line shows ipsilateral output of the FF. M: Mauthner cell, FF(red): Feedfoward inhibitory neuron. (B) Image of the disposition of the neurons in the hindbrain. The inhibitory neurons (red, FF) lie at the bottom the most lateral of three columns of glycinergic inhibitory neurons (green) marked by arrows. This lateral column contains commissural inhibitory neurons with outputs on both sides of the hindbrain, while more medial columns contain neurons with contralateral (middle column) or ipsilateral outputs (medial column). Scale bar=20 µm. (C) The column containing the FF neurons is one of a series of interleaved glutamatergic and glycinergic columns in the hindbrain. The variety of sensory inputs to the lateral glycinergic column and the shared morphology of the neurons in it raise the possibility that other neurons in the column might also contribute to the laterality of other behavioral responses to sensory inputs by implementing the same circuit motif.
Tables
Table 1
Experimentally measured properties and settings used in the Modeling. Top: Experimentally derived basic properties of Mauthner and Feedforward glycinergic neurons at 4 dpf. (Mauthner: n=24, FF: n=28). Rm, input resistance; Erest, resting membrane potential; ECl, reversal potential of IPSP; Espike, spiking threshold; Tau, membrane time constant. Corrected for liquid junction potential. Bottom: Parameters used for conductance-based models of the Mauthner circuit. Rm, input resistance; Erest, resting membrane potential; ECl, reversal potential of IPSP; Espike, spiking threshold; Tau, time constant; El, leak reversal potential; EK, reversal potential of potassium; ENa, reversal potential of sodium; gl, leak conductance per area; gNa, sodium conductance per area; gK, potassium conductance per area.
| 1. Measured parameters | ||||
| Mauthner | FF | |||
| Rm [Mohm] | 10.3 ± 0.9 | 411.7 ± 41.16 | ||
| Erest [mV] | −78.5 ± 0.9 | −77.3 ± 0.7 | ||
| ECl [mV] | −75.4 ± 0.94 | NA | ||
| Espike [mV] | −61.3 ± 1.1 | −60.9 ± 1.0 | ||
| Tau [ms] | 22.6 ± 7.4 | 9.9 ± 1.2 | ||
2. Model parameters | ||||
LIF model parameters | Mauthner | FF | ||
| Rm [Mohm] | 10 | 400 | ||
| Erest [mV] | −79 | −77 | ||
| Ecl [mV] | −75 | −75 | ||
| Espike [mV] | −61 | −61 | ||
| Tau [ms] | 23 | 10 | ||
| No of Cells/side | 1 | 30 | ||
HH model parameters | Auditory | |||
| El [mV] | −79 | |||
| EK [mV] | −90 | |||
| ENa [mV] | 50 | |||
| gl [msiemns/cm2] | 0.05 | |||
| gNa [msiemens/cm2] | 100 | |||
| gK[msiemens/cm2] | 200 | |||
| No of Cells/side | 30 | |||
| Surface area [um2] | 2000–20000 | |||
Connectivity Parameters | Synapse type | Conductance [nS] | Delay [ms] | Connectivity pattern |
| FF -> ipsilateral M | Glycine | 25 | 0.3 | all to one |
| FF-> contralteral M | Glycine | 2.5 × FF->ipsiM | 0.3 | all to one |
| Auditory-> M | Gap | 15 | NA | all to one |
| Auditory-> M | Glutamate | 12 | 0.7 | all to one |
| Auditory->FF | Gap | 10 | NA | one to one |
| FF -> contra FF | Glycine | 12 | 0.3 | all to all |
Synapse time constants | Glutamate | Glycine | ||
| Tau [ms] | 2 | 2 | ||
Download links
A two-part list of links to download the article, or parts of the article, in various formats.
Downloads (link to download the article as PDF)
Open citations (links to open the citations from this article in various online reference manager services)
Cite this article (links to download the citations from this article in formats compatible with various reference manager tools)
A circuit motif in the zebrafish hindbrain for a two alternative behavioral choice to turn left or right
eLife 5:e16808.
https://doi.org/10.7554/eLife.16808


