The histone H3K9 demethylase KDM3A promotes anoikis by transcriptionally activating pro-apoptotic genes BNIP3 and BNIP3L
- University of Massachusetts Medical School, United States
- Howard Hughes Medical Institute, University of Massachusetts Medical School, United States
- Université Laval, Canada
- Centre de recherche du CHU de Québec, CHUL, Canada
- McGill University, Canada
Figures
Figure 1 with 4 supplements

Identification of KDM3A as an anoikis effector in breast cancer epithelial cells.
(A) Schematic of the design of the large-scale RNAi screen to identify anoikis effectors. (B) Cell death, monitored by annexin V staining, in MCF10A cells expressing a non-silencing (NS) shRNA and cultured attached to the matrix, or in detached cells (cultured in suspension for 96 hr) expressing a NS shRNA or one of five candidate shRNAs. Error bars indicate SD. P value comparisons are made to the detached, NS shRNA control. **p<0.01. (C) Crystal violet staining of MCF10A cells expressing vector, KDM3A or the catalytically-inactive KDM3A(H1120G/D1122N) mutant.
-
Figure 1—source data 1
List of 26 shRNAs, and the target genes, whose abundance was significantly enriched >500-fold following detachment of MCF10A cells.
- https://doi.org/10.7554/eLife.16844.004
-
Figure 1—source data 2
Source data for Figure 1B.
- https://doi.org/10.7554/eLife.16844.005
Figure 1—figure supplement 1

FACS analysis.
Representative FACS plots corresponding to Figure 1B.
Figure 1—figure supplement 2
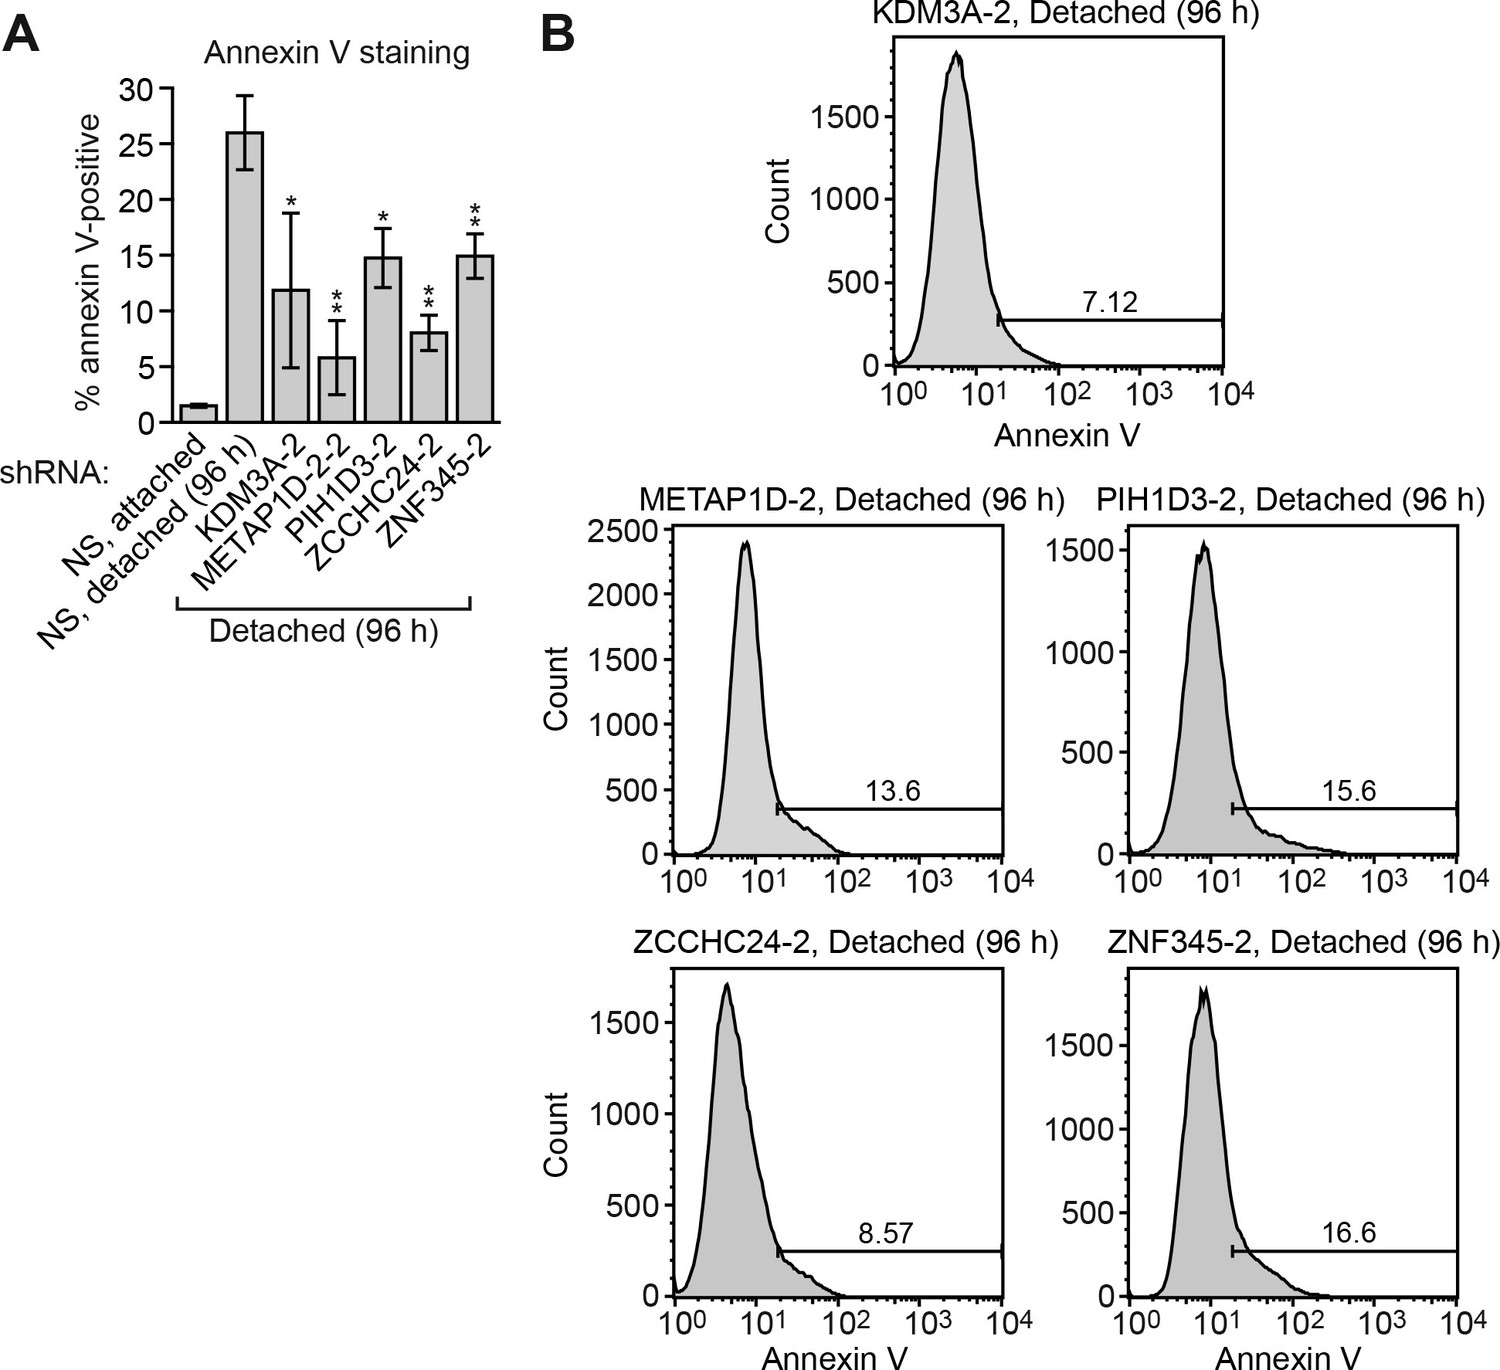
Confirmation of the results of Figure 1B using a second, unrelated shRNA.
(A) Cell death, monitored by annexin V staining, in MCF10A cells expressing a non-silencing (NS) shRNA and cultured attached to the matrix, or in detached cells (cultured in suspension for 96 hr) expressing a NS shRNA or one of five candidate shRNAs unrelated to those used in Figure 1B. Error bars indicate SD. **p<0.01. (B) Representative FACS plots corresponding to (A).
Figure 1—figure supplement 3

Analysis of BIM and candidate shRNA knockdown efficiencies.
qRT-PCR analysis monitoring knockdown efficiencies of BIM and two unrelated shRNAs directed against the five candidate genes in MCF10A cells. Error bars indicate SD. *p<0.05; **p<0.01.
Figure 1—figure supplement 4

Confirmation of increased levels of KDM3A upon ectopic expression.
Immunoblot analysis monitoring levels of KDM3A in MCF10A cells expressing vector, KDM3A or KDM3A(H1120G/D1122N). The results confirm increased expression of KDM3A in cells transfected with KDM3A-expressing plasmids. α-tubulin (TUBA) was monitored as a loading control.
Figure 2 with 1 supplement
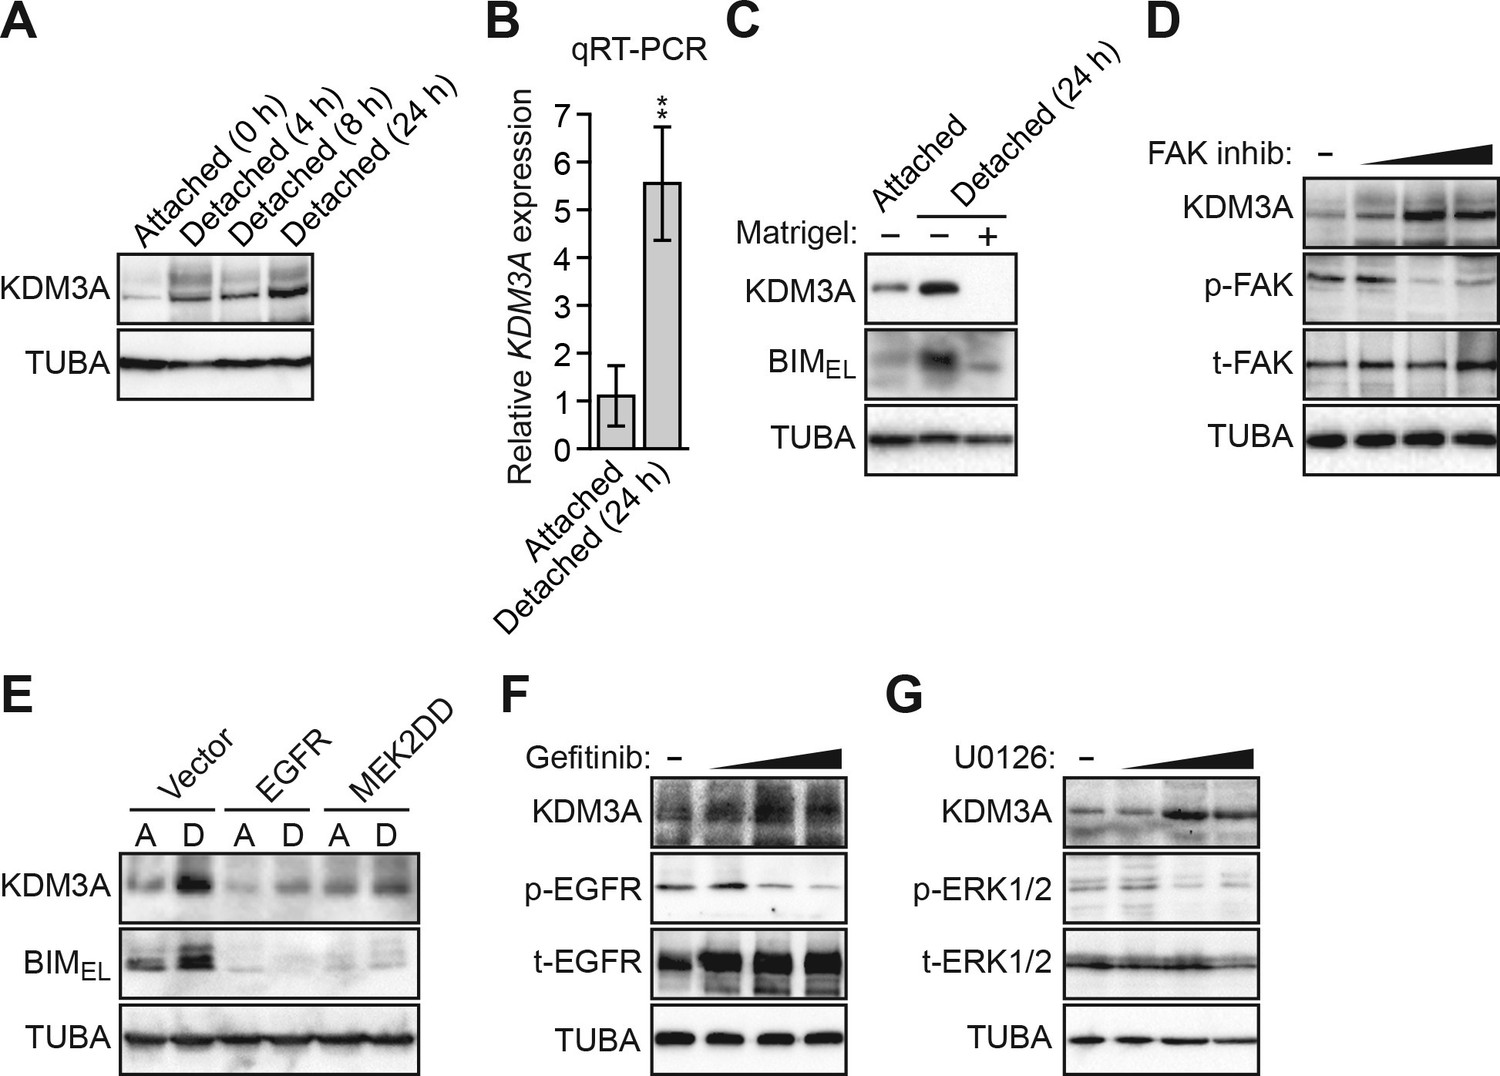
Detachment and loss of integrin and growth factor receptor signaling induces KDM3A expression.
(A) Immunoblot monitoring KDM3A levels in attached MCF10A cells, or detached cells cultured in suspension for 4, 8 or 24 hr. β-actin (ACTB) was monitored as a loading control. (B) qRT-PCR analysis monitoring KDM3A mRNA levels in attached MCF10A cells, or detached cells cultured in suspension for 24 hr. Error bars indicate SD. **p<0.01. (C) Immunoblot monitoring levels of KDM3A and BIMEL in attached MCF10A cells or detached MCF10A cells cultured in suspension for 24 hr and treated in the presence or absence of Matrigel. α-tubulin (TUBA) was monitored as a loading control. (D) Immunoblot monitoring levels of KDM3A, phosphorylated FAK (p-FAK) or total FAK (t-FAK) in MCF10A cells treated for 48 hr with 0, 1, 5 or 10 µM FAK inhibitor. (E) Immunoblot monitoring levels of KDM3A and BIMEL in MCF10A cells expressing either vector, EGFR or MEK2DD and cultured as attached (A) or detached (D) cells grown in suspension for 24 hr. (F) Immunoblot monitoring levels of KDM3A, phosphorylated EGFR (p-EGFR) or total EGFR (t-EGFR) in MCF10A cells treated for 48 hr with 0, 1, 5 or 10 µM gefitinib. (G) Immunoblot monitoring levels of KDM3A, phosphorylated ERK1/2 (p-ERK1/2) or total ERK1/2 (t-ERK1/2) in MCF10A cells treated for 48 hr with 0, 1, 5 or 10 µM U0126.
-
Figure 2—source data 1
Source data for Figure 2B.
- https://doi.org/10.7554/eLife.16844.011
Figure 2—figure supplement 1

Inhibition of FAK, EGFR, or MEK in MCF10A cells increases KDM3A expression.
(A–C) qRT-PCR analysis monitoring KDM3A expression in MCF10A cells treated for 48 hr with 0, 1, 5 or 10 µM FAK inhibitor (A), gefitinib (B), or U0126 (C). Error bars indicate SD. **p<0.01.
Figure 3 with 6 supplements
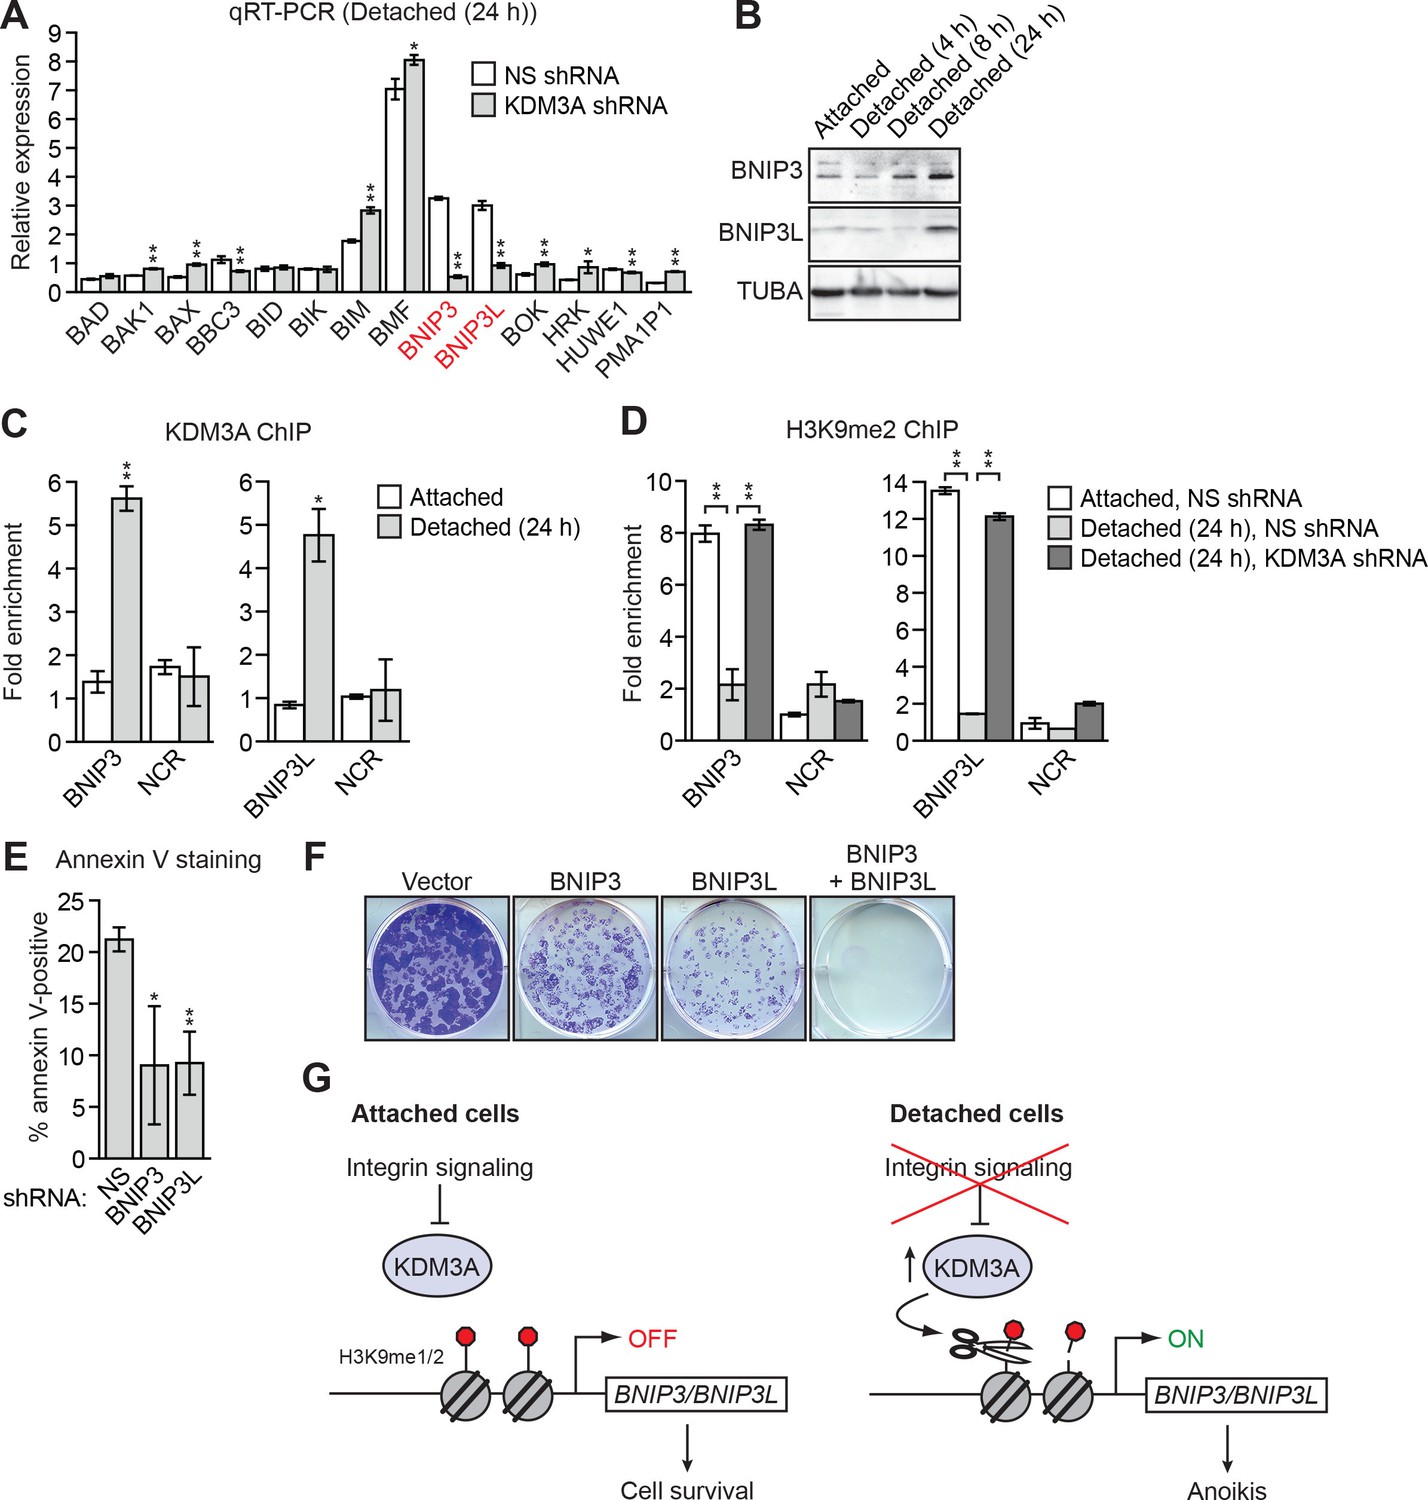
KDM3A induces anoikis by transcriptionally activating BNIP3 and BNIP3L.
(A) qRT-PCR analysis monitoring expression of pro-apoptotic BCL2 genes in detached MCF10A cells grown in suspension for 24 hr and expressing a NS or KDM3A shRNA. The expression of each gene is shown relative to that obtained in attached cells expressing a NS shRNA, which was set to 1. P value comparisons for each gene are made to the NS shRNA control. Genes whose expression is decreased >2-fold upon KDM3A knockdown are indicated in red. (B) Immunoblot analysis monitoring levels of BNIP3 and BNIP3L in attached MCF10A cells, and detached cells following growth in suspension for 4, 8 or 24 hr. (C) ChIP monitoring binding of KDM3A on the promoters of BNIP3 and BNIP3L or a negative control region (NCR) in attached MCF10A cells or detached cells grown in suspension for 24 hr. P value comparisons for each region are made to the attached control. (D) ChIP monitoring the levels of H3K9me2 on the promoters of BNIP3 and BNIP3L or a negative control region in attached MCF10A cells or detached cells expressing a NS or KDM3A shRNA and grown in suspension for 24 hr. P value comparisons for each region are made to the detached, NS shRNA control. (E) Cell death, monitored by annexin V staining, in MCF10A cells expressing a NS, BNIP3 or BNIP3L shRNA. (F) Crystal violet staining of MCF10A cells expressing vector, BNIP3, BNIP3L or both BNIP3 and BNIP3L. (G) Model. Error bars indicate SD. *p<0.05; **p<0.01.
-
Figure 3—source data 1
Source data for Figure 3A, C, D and E.
- https://doi.org/10.7554/eLife.16844.014
Figure 3—figure supplement 1

Confirmation of the results of Figure 3A using a second, unrelated KDM3A shRNA.
qRT-PCR analysis monitoring expression of BCL2 pro-apoptotic genes in detached MCF10A cells expressing a NS or a second, unrelated KDM3A shRNA to that used in Figure 3A. The expression of each gene is shown relative to that obtained in attached cells, which was set to 1. Error bars indicate SD. *p<0.05; **p<0.01.
Figure 3—figure supplement 2

The level of H3K9me1 on the BNIP3 and BNIP3L promoters is diminished following detachment, which is counteracted by knockdown of KDM3A.
ChIP monitoring the levels of H3K9me1 on the promoters of BNIP3 and BNIP3L or a negative control region (NCR) in attached MCF10A cells or detached cells expressing a NS or KDM3A shRNA and grown in suspension for 24 hr. P value comparisons for each region are made to the detached, NS shRNA control. Error bars indicate SD. *p<0.05; **p<0.01.
Figure 3—figure supplement 3
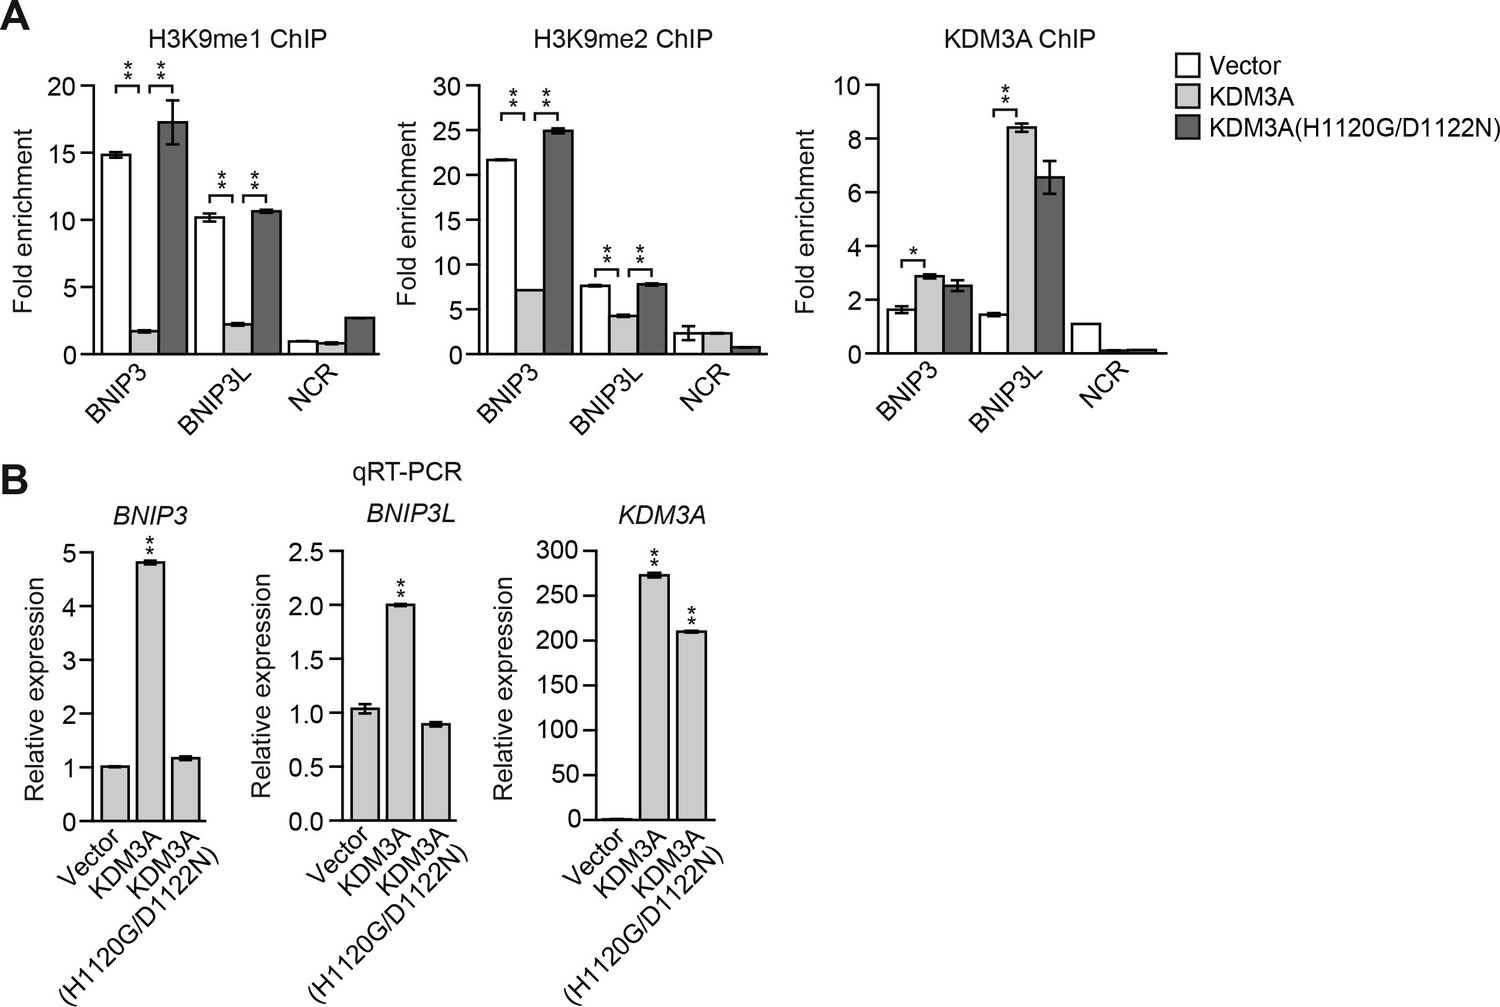
Overexpression of KDM3A, but not KDM3A(H1120G/D1122N), in attached MCF10A cells results in decreased levels of H3K9me1 and H3K9me2 on the BNIP3 and BNIP3L promoters and increased expression of BNIP3 and BNIP3L.
(A) ChIP monitoring the levels of H3K9me1, H3K9me2 and KDM3A on the promoters of BNIP3 and BNIP3L or a negative control region (NCR) in attached MCF10A cells expressing empty vector, wild-type KDM3A or KDM3A(H1120G/D1122N). The increased occupancy of KDM3A(H1120G/D1122N) on the BNIP3 and BNIP3L promoters is not unexpected because the mutations are in the catalytic domain and should not affect DNA binding. (B) qRT-PCR analysis monitoring expression of BNIP3, BNIP3L or KDM3A in attached MCF10A cells expressing empty vector, wild-type KDM3A or KDM3A(H1120G/D1122N). Error bars indicate SD. *p<0.05; **p<0.01.
Figure 3—figure supplement 4

Analysis of BNIP3 and BNIP3L shRNA knockdown efficiencies.
qRT-PCR analysis monitoring knockdown efficiency of two unrelated BNIP3 and BNIP3L shRNAs in MCF10A cells. Error bars indicate SD. **p<0.01.
Figure 3—figure supplement 5
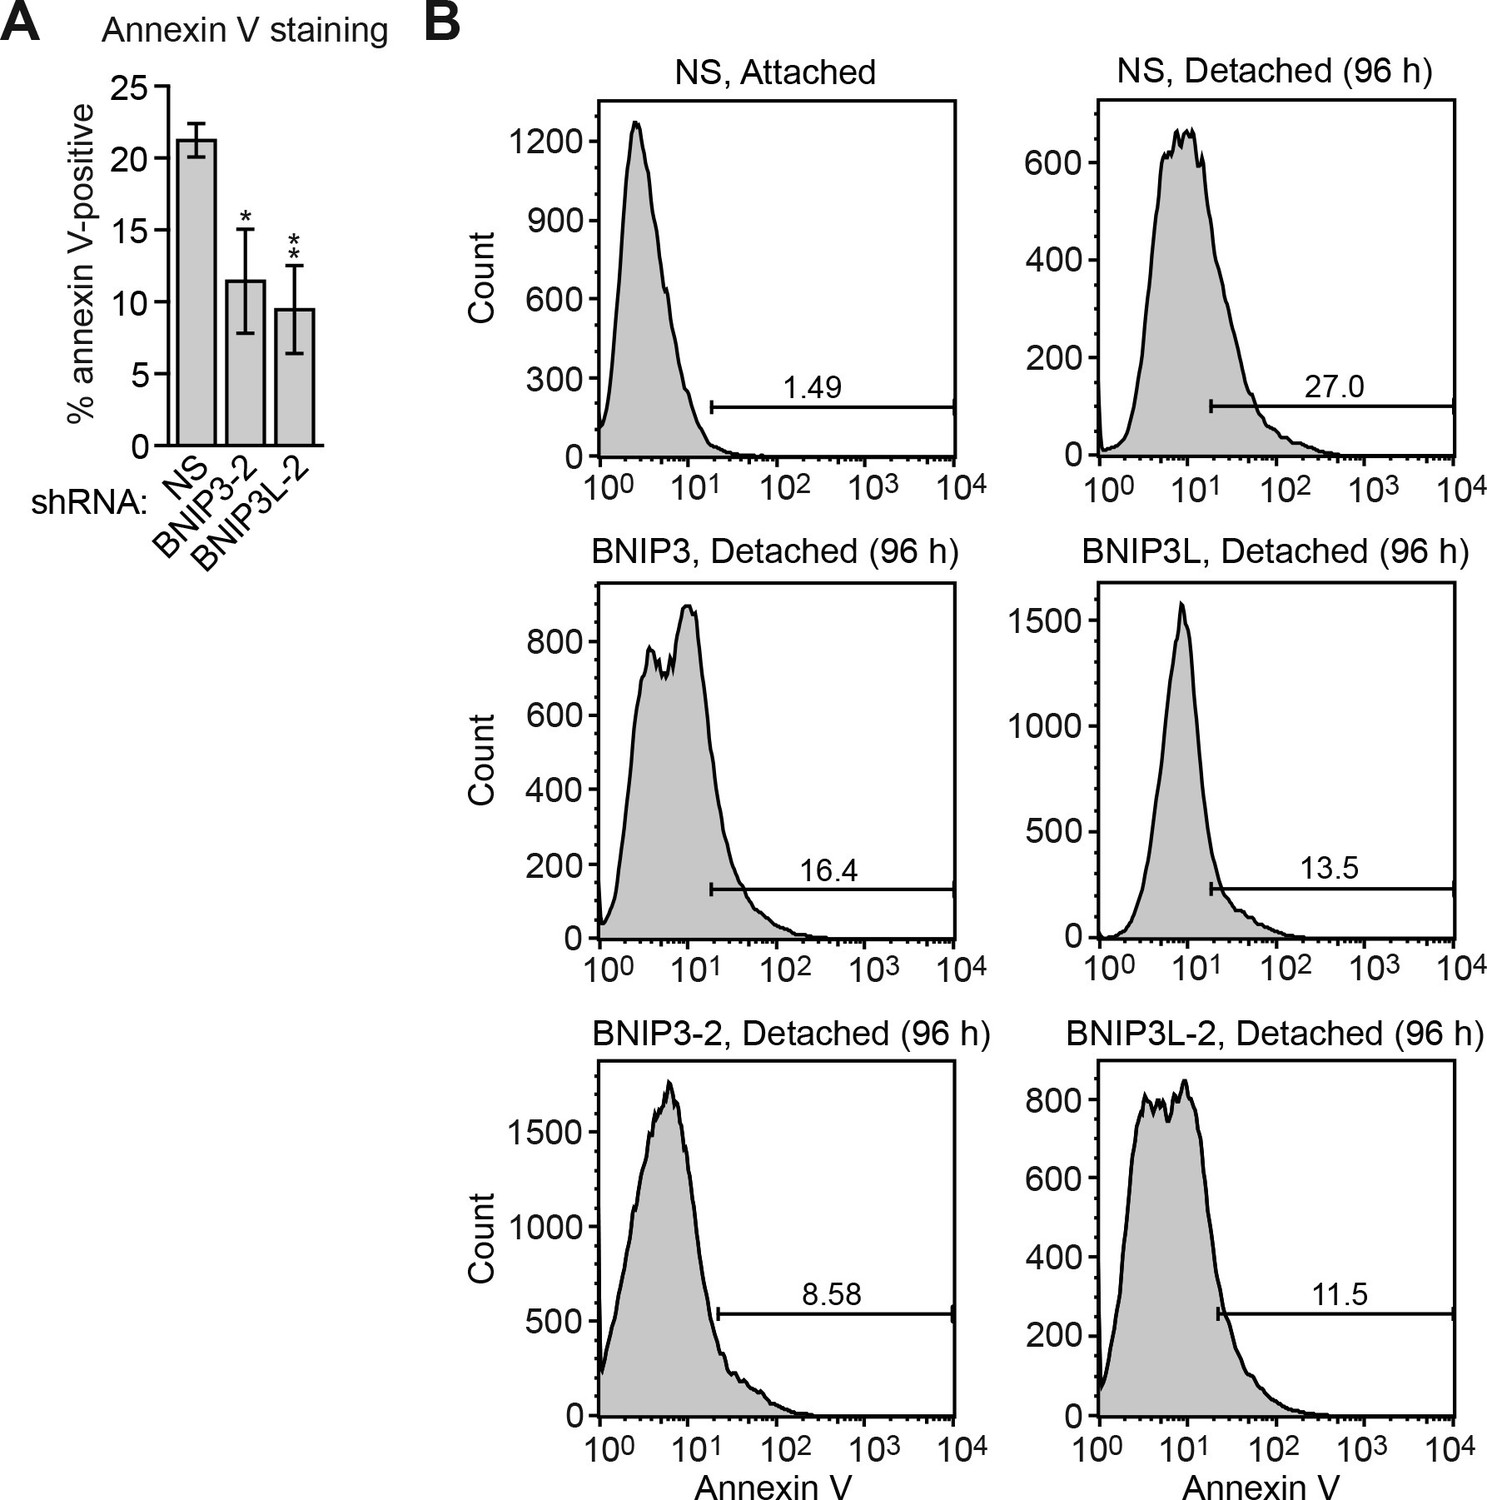
Confirmation of the results of Figure 3E using a second, unrelated shRNA.
(A) Cell death, monitored by annexin V staining, in MCF10A cells expressing a non-silencing (NS) shRNA or BNIP or BNIP3L shRNA unrelated to that used in Figure 3E. Error bars indicate SD. *p<0.05; **p<0.01. (B) Representative FACS plots corresponding to Figure 3E and (A).
Figure 3—figure supplement 6
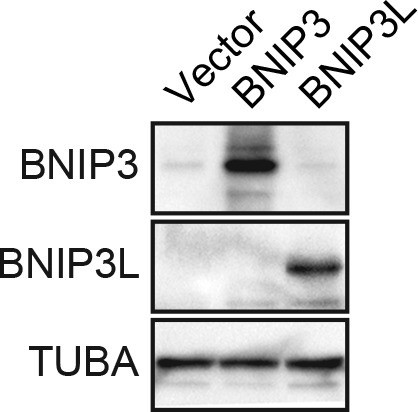
Confirmation of increased levels of BNIP3 and BNIP3L upon ectopic expression.
Immunoblot analysis monitoring levels of BNIP3 or BNIP3L in MCF10A cells expressing vector, BNIP3 or BNIP3L. The results confirm increased expression of the proteins. α-tubulin (TUBA) was monitored as a loading control.
Figure 4 with 9 supplements
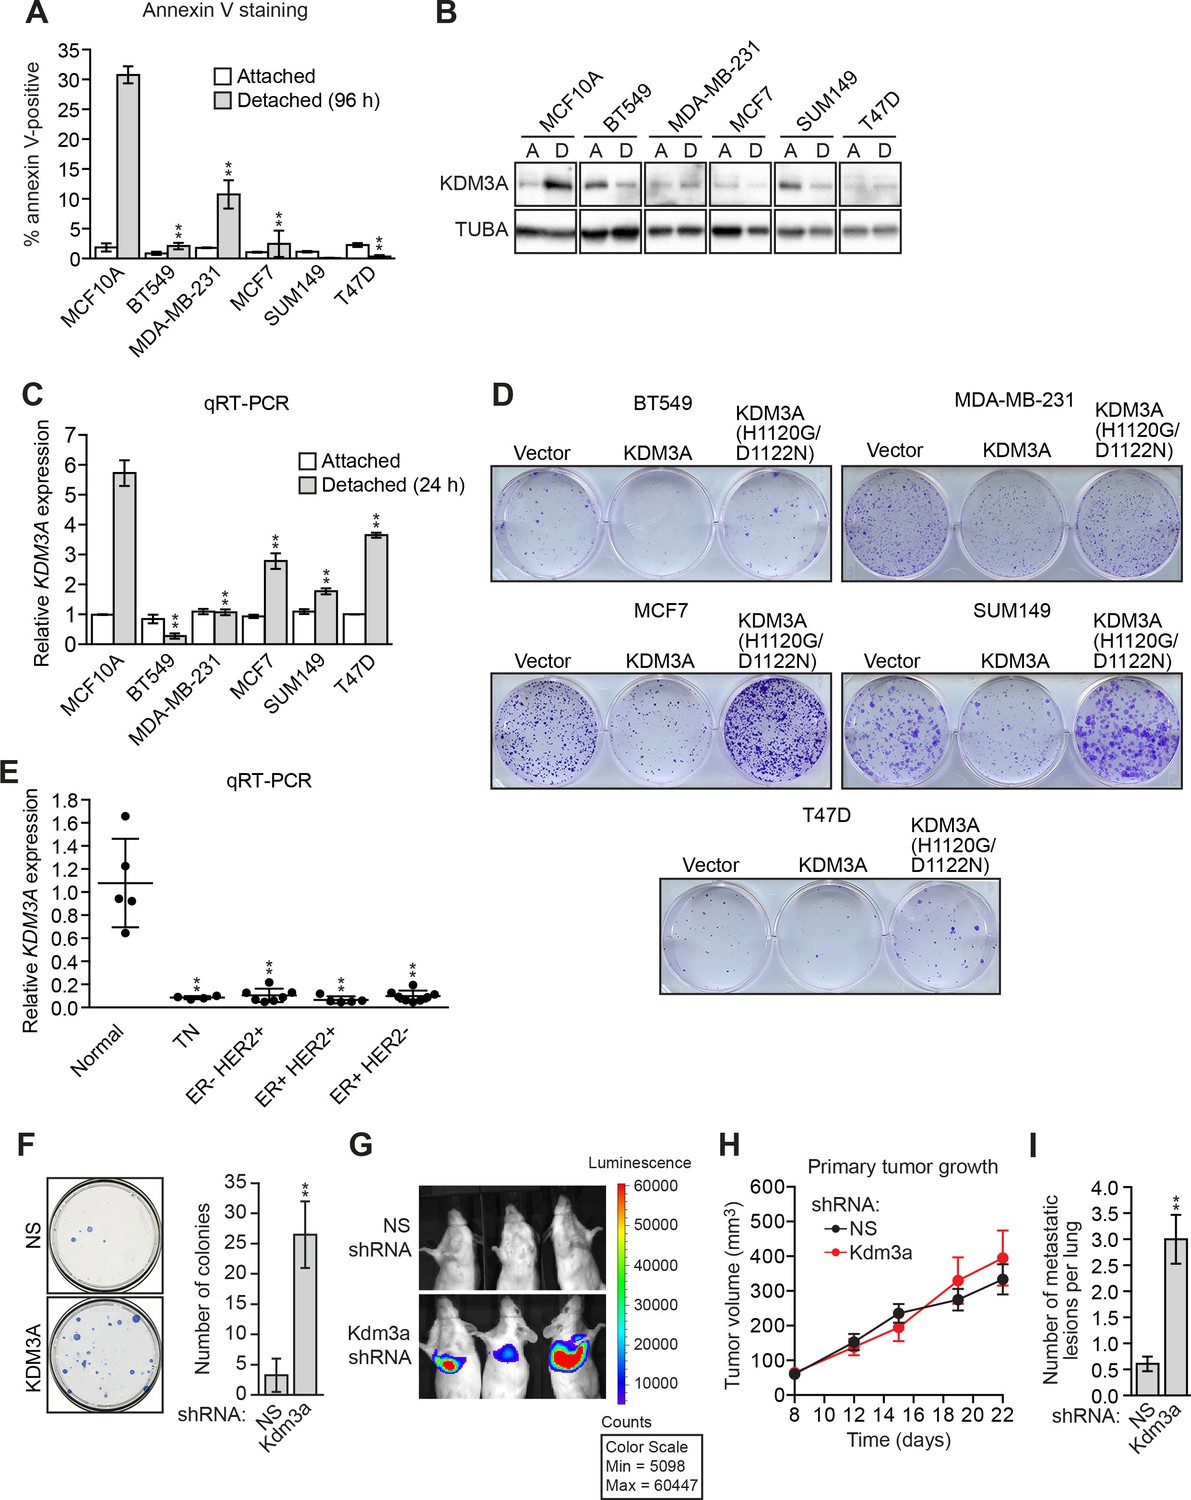
KDM3A prevents metastasis and its expression is defective in human breast cancer cell lines and tumors.
(A) Cell death, monitored by annexin V staining, in MCF10A cells and a panel of human breast cancer cell lines cultured as attached cells or detached following growth in suspension for 96 hr. Error bars indicate SD. P value comparisons for each breast cancer cell line are made to the detached MCF10A sample. (B) Immunoblot analysis monitoring KDM3A levels in MCF10A cells and a panel of human breast cancer cell lines cultured as attached (A) cells or detached (D) following growth in suspension for 24 hr. All images for the KDM3A antibody were cropped from the same blot and thus were processed and exposed in the same manner, as were images for the TUBA loading control. (C) qRT-PCR analysis monitoring KDM3A expression in MCF10A cells and a panel of human breast cancer cell lines cultured as attached cells or detached following growth in suspension for 24 hr. Error bars indicate SD. P value comparisons for each breast cancer cell line are made to the detached MCF10A sample. (D) Crystal violet staining of human breast cancer cells expressing vector, KDM3A or KDM3A(H1120G/D1122N). (E) qRT-PCR analysis monitoring KDM3A expression in normal breast epithelial cells and human breast tumors. TN, triple negative [estrogen receptor-negative (ER-), human epidermal growth factor receptor 2-negative (HER2-) and progesterone receptor-negative (PR-)]. Error bars indicate SD. The differences in KDM3A expression between subtypes are not statistically significant. (F) Mouse pulmonary survival assay. (Left) Representative plates showing colony formation of CLS1 cells expressing a NS or Kdm3a shRNA that had been isolated from mouse lungs following tail vein injection. (Right) Quantification of colony formation (n = 4 mice per shRNA). Error bars indicate SD. (G) Live animal imaging monitoring lung tumor metastasis in mice following injection of 67NR cells expressing a NS or Kdm3a shRNA (n = 3 mice per group). (H) Primary tumor growth in mice injected with 4T07 cells expressing a NS (n = 7) or Kdm3a (n = 8) shRNA. Error bars indicate SEM. The differences in primary tumor growth between groups are not statistically significant. (I) Metastatic burden. Number of metastatic lesions per lung in mice injected with 4T07 cells expressing a NS (n = 7) or Kdm3a (n = 8) shRNA. Error bars indicate SEM. **p<0.01.
-
Figure 4—source data 1
Source data for Figure 4A, C, E, F, H and I.
- https://doi.org/10.7554/eLife.16844.022
Figure 4—figure supplement 1
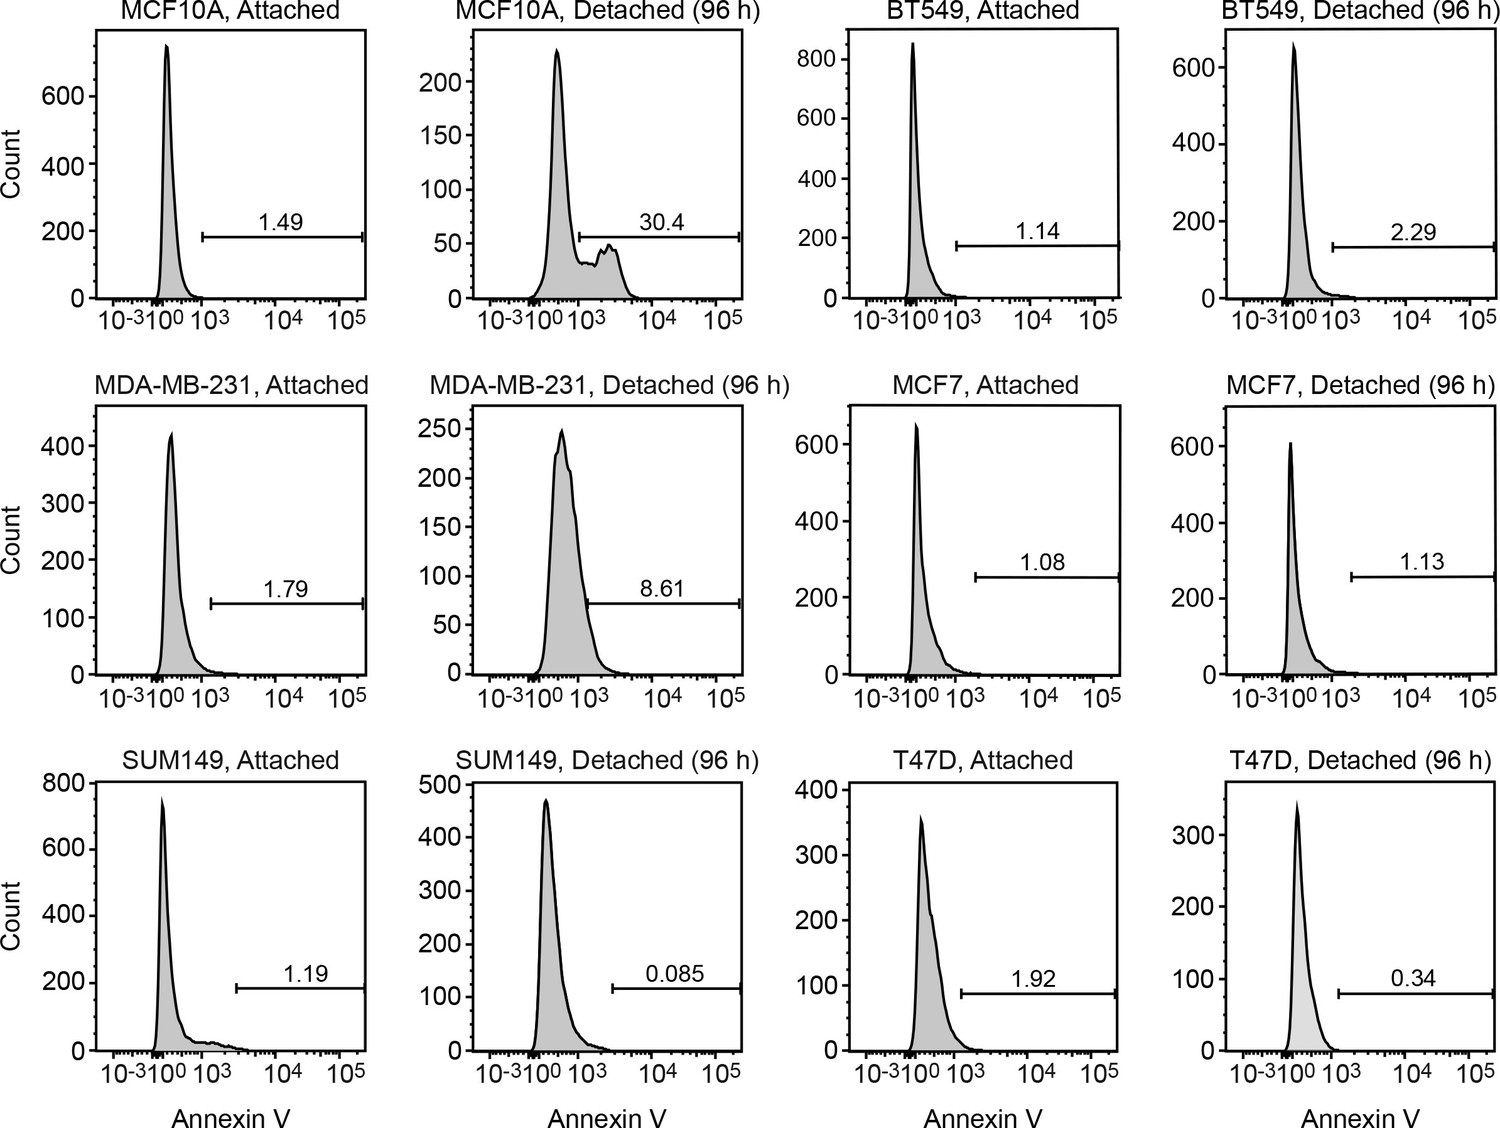
FACS analysis.
Representative FACS plots corresponding to Figure 4A.
Figure 4—figure supplement 2
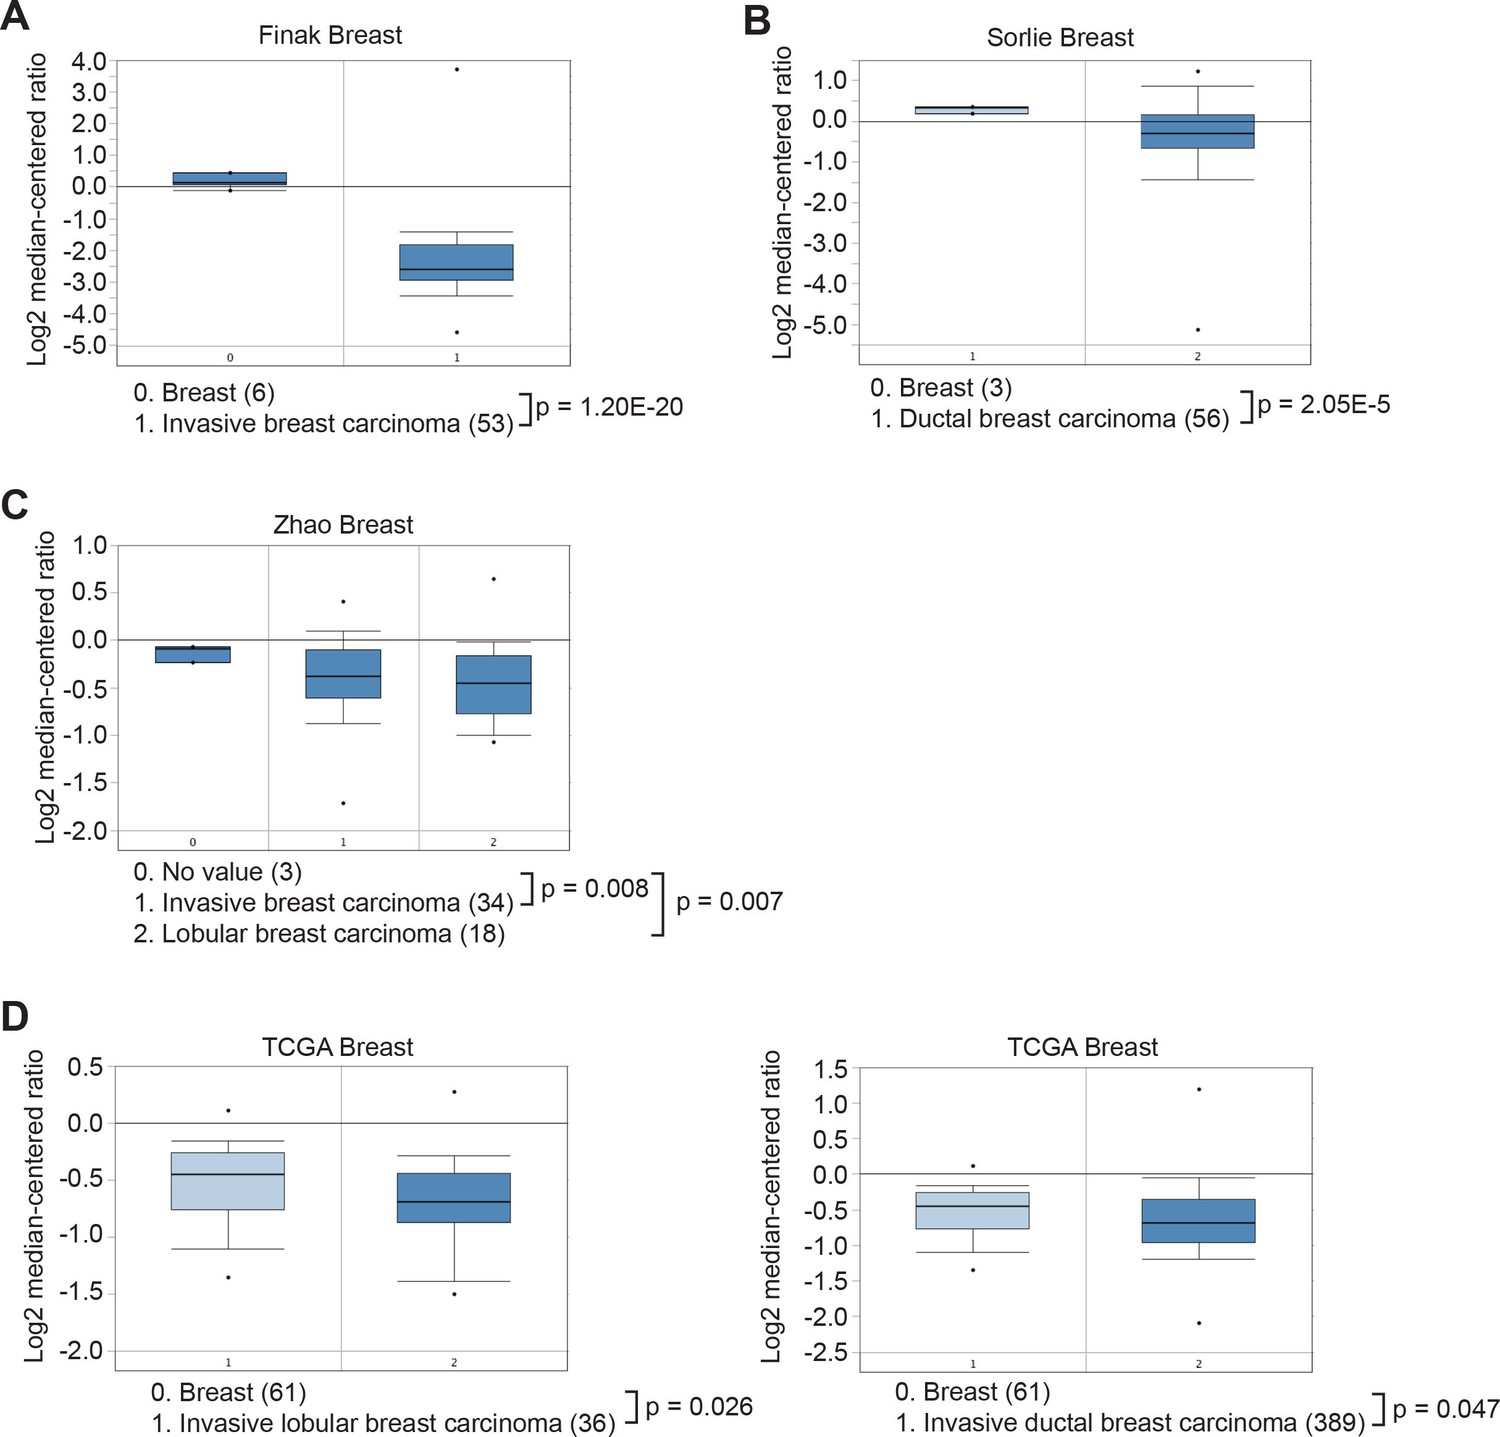
Oncomine analysis of KDM3A expression in breast cancer.
The Oncomine Cancer Profiling database was queried to access Finak (A), Sorlie (B), Zhao (C) and The Cancer Genome Atlas (TCGA) (D) breast cancer data sets. The results reveal that KDM3A is significantly under-expressed in breast carcinoma relative to normal tissue.
Figure 4—figure supplement 3
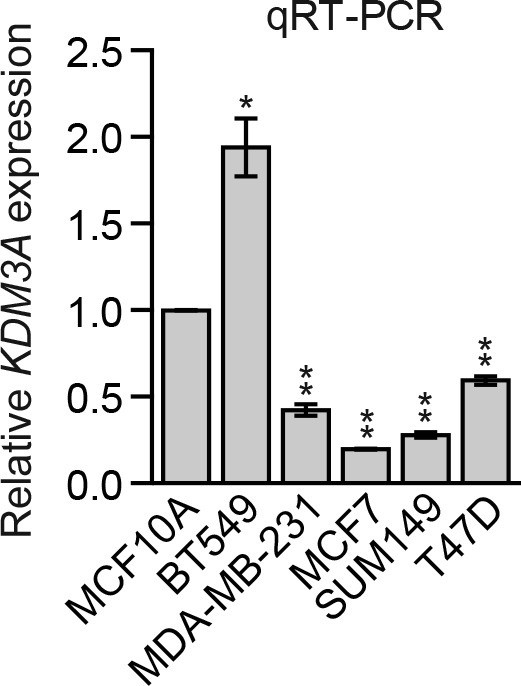
Analysis of basal KDM3A expression in human breast cancer cell lines.
qRT-PCR analysis of KDM3A expression in MCF10A cells and a panel of human breast cancer cell lines cultured as attached cells. The results were normalized to that obtained in MCF10A cells, which was set to 1. The results show that basal KDM3A expression levels were diminished in four of five human breast cancer cell lines analyzed. Error bars indicate SD. *p<0.05; **p<0.01.
Figure 4—figure supplement 4
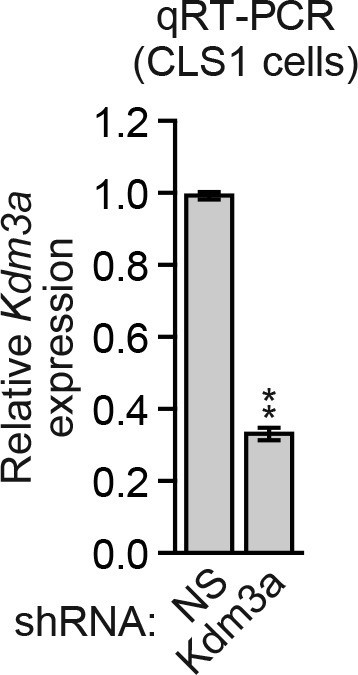
Analysis of Kdm3a shRNA knockdown efficiency in mouse CLS1 cells.
qRT-PCR analysis monitoring knockdown efficiency of Kdm3a in CLS1 cells. Error bars indicate SD. **p<0.01.
Figure 4—figure supplement 5
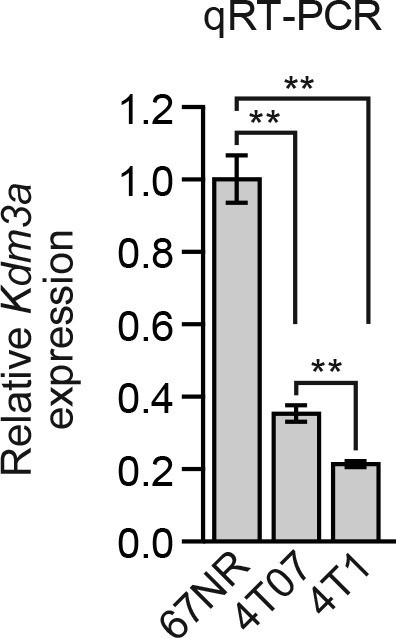
Analysis of Kdm3a expression in a mouse breast cancer carcinoma progression series.
qRT-PCR analysis of Kdm3a expression in 67NR, 4T07, and 4T1 cells. Error bars indicate SD. **p<0.01.
Figure 4—figure supplement 6
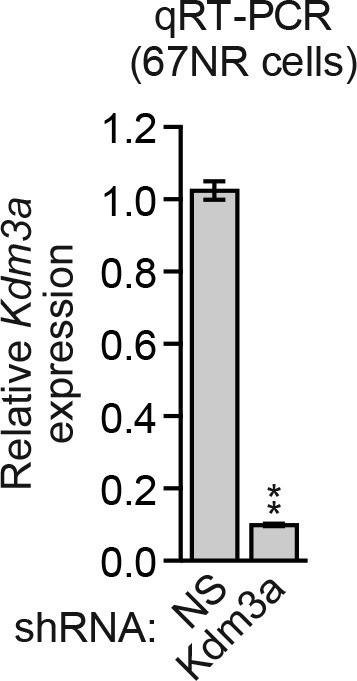
Analysis of Kdm3a shRNA knockdown efficiency in mouse 67NR cells.
qRT-PCR analysis monitoring knockdown efficiency of Kdm3a in 67NR cells. Error bars indicate SD. **p<0.01.
Figure 4—figure supplement 7
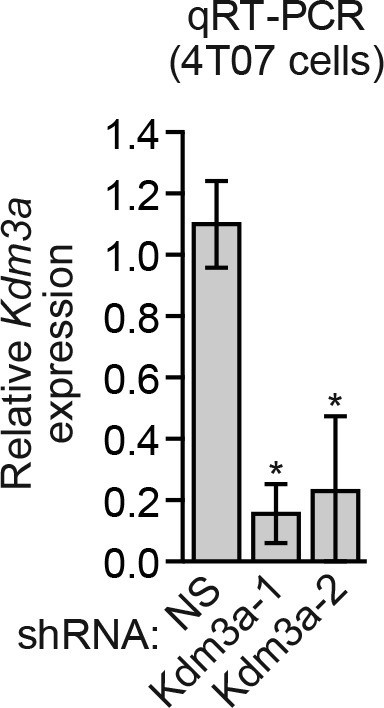
Analysis of Kdm3a shRNA knockdown efficiency in mouse 4T07 cells.
qRT-PCR analysis monitoring knockdown efficiency of two unrelated Kdm3a shRNAs in 4T07 cells. Error bars indicate SEM. *p<0.05.
Figure 4—figure supplement 8

Confirmation of the results of Figure 4H using a second, unrelated shRNA.
Primary tumor growth in mice injected with 4T07 cells expressing a NS (n = 7) or Kdm3a (n = 9) shRNA unrelated to that used in Figure 4H. Error bars indicate SEM. The differences in primary tumor growth between groups are not statistically significant.
Figure 4—figure supplement 9

Confirmation of the results of Figure 4I using a second, unrelated shRNA.
Number of metastatic lesions per lung in mice injected with 4T07 cells expressing a NS (n = 7) or Kdm3a (n = 9) shRNA unrelated to that used in Figure 4I. Error bars indicate SEM. **p<0.01.
Additional files
-
Supplementary file 1
List of shRNAs obtained from Open Biosystems/Thermo Scientific.
- https://doi.org/10.7554/eLife.16844.032
-
Supplementary file 2
List of primers used for qRT-PCR and ChIP.
- https://doi.org/10.7554/eLife.16844.033
Download links
A two-part list of links to download the article, or parts of the article, in various formats.
Downloads (link to download the article as PDF)
Open citations (links to open the citations from this article in various online reference manager services)
Cite this article (links to download the citations from this article in formats compatible with various reference manager tools)
The histone H3K9 demethylase KDM3A promotes anoikis by transcriptionally activating pro-apoptotic genes BNIP3 and BNIP3L
eLife 5:e16844.
https://doi.org/10.7554/eLife.16844


