mRNA poly(A)-tail changes specified by deadenylation broadly reshape translation in Drosophila oocytes and early embryos
- Howard Hughes Medical Institute, Whitehead Institute for Biomedical Research, United States
- Massachusetts Institute of Technology, United States
- Harvard-MIT Division of Health Sciences and Technology, United States
- Whitehead Institute for Biomedical Research, United States
Figures
Figure 1 with 1 supplement

Transient coupling between poly(A)-tail length and translational efficiency in embryos.
(A) Time line of the developmental transitions probed in this study, illustrating the presence of maternal and zygotic mRNAs (pink and purple, respectively). (B) Relationship between mean poly(A)-tail length and relative translational efficiency (TE) at the indicated developmental stage (top), and the relationship between tail-length and TE changes observed between adjacent stages (bottom). For each stage, tail-length and TE measurements were from the same sample. In the top panels, results are plotted for all mRNAs that had ≥100 poly(A)-tail length measurements (tags), ≥10.0 reads per million mapped reads (RPM) in the RNA-seq data, and >0 RPM in the ribosome-profiling data. In each sample, TE values (log2) were median centered by subtracting the median TE value of that sample from each value (median values in stage 14 oocytes, 0–1 hr embryos, 2–3 hr embryos, 3–4 hr embryos, and 5–6 hr embryos were –0.2523, –0.1329, 0.4799, 0.6469, and 0.6447, respectively). In the bottom panels, results are plotted for all mRNAs that had ≥100 poly(A) tags and ≥10.0 RPM in the RNA-seq data of both samples, and ≥10.0 RPM in the ribosome-profiling data of one of the two samples and >0 RPM in the other. TE fold-change values (log2) were median centered for each comparison (median values, 0.2027, –0.0047, 0.0701, and –0.003 from left to right). The Spearman correlation coefficient (Rs) and number of mRNAs (n) are shown in each plot. The TE data for stage 14 oocytes were from Kronja et al. (2014b). (C) Abundance and TE of zelda, stat92E, smaug, and bicoid mRNA at the indicated developmental stages (RPKM is reads per kilobase per million mapped reads). TE values (log2) for each stage were median centered as described above, using the median values (log2) reported in the legends of Figure 1B and Figure 2. The data for stage 14 were from Kronja et al. (2014b). If no RPF reads were observed in a sample, TEs were calculated using a pseudocount of 1 read. Points for which TE is based on either a single read or pseudocount are in grey, as are the lines connecting to them. Other TEs were based on ≥25 RPF reads, except the TEs for bicoid in stage 14 oocytes and 3–4 hr embryos (3 and 9 reads, respectively) and the TE for smaug in stage 13 oocytes (11 reads).
Figure 1—figure supplement 1
Dynamics of translational regulation during the OET and early embryonic development.
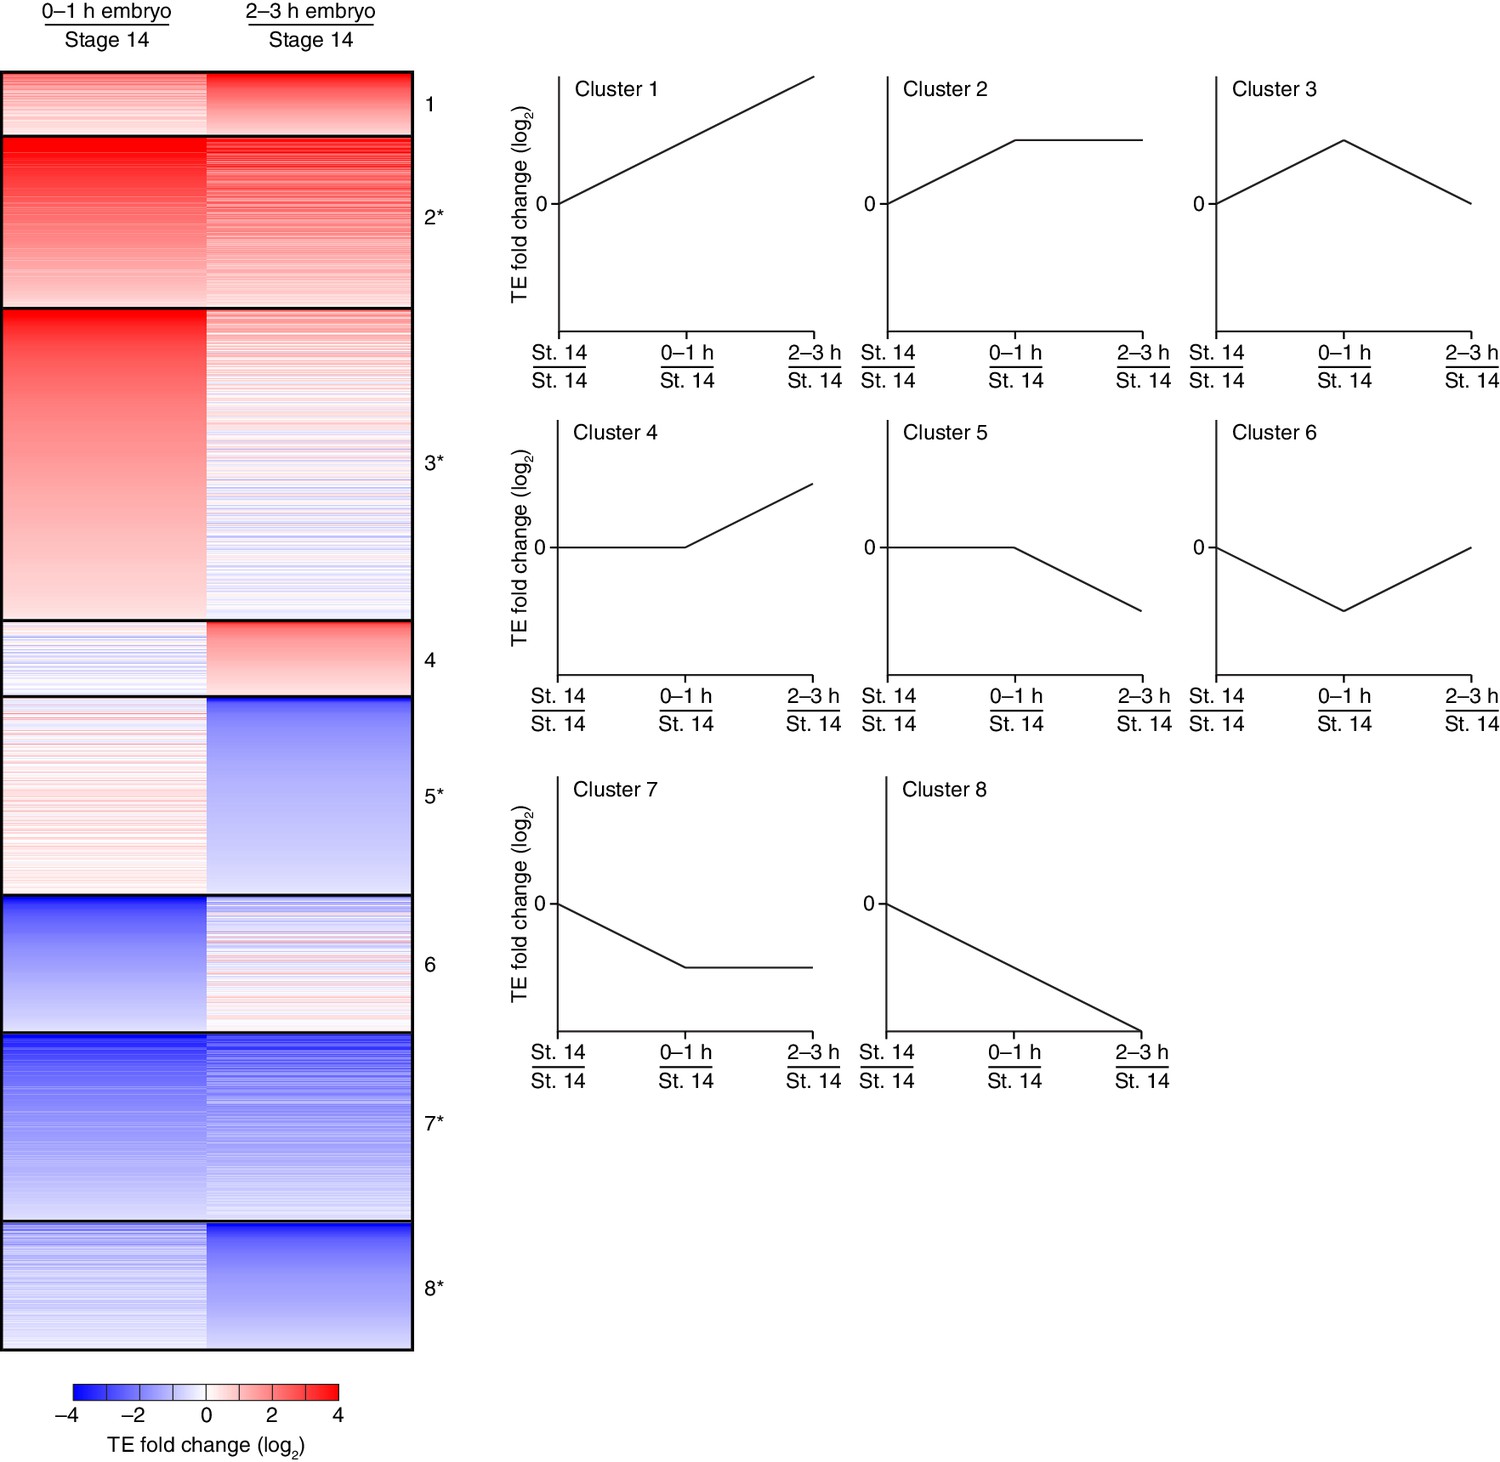
Distinct patterns of TE changes during the OET and early embryonic development. TE values (log2) for mRNAs in stage 14 oocytes, 0–1 hr embryos, and 2–3 hr embryos that had ≥10.0 RPM in the RNA-seq data for all samples, and ≥10.0 RPM in the ribosome-profiling data for at least one sample and >0.0 RPM in the others were median centered as in Figure 1B. The median-centered TEs for 0–1 hr embryos and 2–3 hr embryos were normalized to those of stage 14 oocytes and then clustered into defined patterns. Clusters are identified by number, and stylized graphs illustrate the TE dynamics of each cluster. Clusters that were significantly overrepresented are marked with an asterisk (p value <0.05, following Bonferonni correction); otherwise, as in Figure 3.
Figure 2 with 2 supplements
Coupling between poly(A)-tail length and translational efficiency in oocytes.
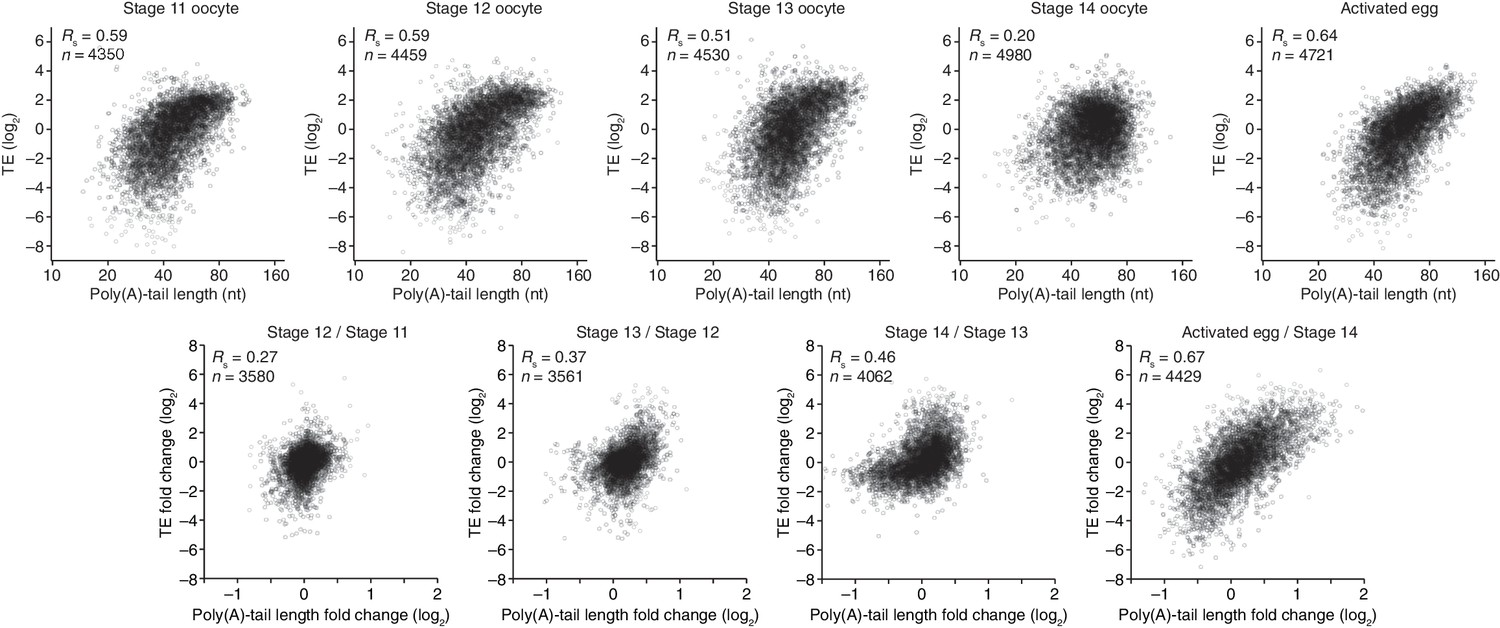
Relationship between mean poly(A)-tail length and TE in either oocytes at the indicated stage or activated eggs (top), and the relationship between tail-length and TE changes observed between adjacent stages (bottom). TE values (log2) were median centered (median values in stage 11, 12, 13, and 14 oocytes and activated eggs were –0.6641, –0.9006, –1.38, –0.2523, and –0.0158, respectively). TE fold-change values (log2) were median centered for each comparison (median values, –0.1961, –0.3969, 1.0886, and 0.2123 from left to right). The TE data for stage 14 oocytes and activated eggs were from Kronja et al. (2014b), and the plot of mean poly(A)-tail length and TE for the stage 14 oocyte is redrawn from Figure 1B. Otherwise, these panels are as in Figure 1B.
Figure 2—figure supplement 1

Widespread translational regulation during oocyte maturation.
(A) Relationship between TEs in stage 11 and stage 14 oocytes. TE values (log2) were median centered (median values in stage 11 and stage 14 oocytes, –0.5153 and –0.1318, respectively). Results are plotted for all mRNAs that had ≥10.0 RPM in the RNA-seq data of both samples and ≥10.0 RPM in the ribosome profiling data of at least one of the two samples and >0.0 RPM in the other. The median-centered TE fold-change values (log2) of stage 14 relative to stage 11 (median, 0.0147) were used to identify mRNAs that were ≥2-fold up- or downregulated in stage 14 oocytes, which are highlighted in red and blue, respectively; otherwise as in Figure 1B. (B) Relationship between the change in protein level (Kronja et al., 2014a) and change in TE observed after oocyte maturation. TE and protein fold-change (log2) values were median centered (median values of 0.1236 and 0.0474, respectively). Results are plotted for all mRNAs that had ≥10.0 RPM in the RNA-seq data, ≥10.0 RPM in the ribosome profiling of one of the two samples and >0.0 RPM in the other, and proteins with ≥2 unique peptides in each of three independent mass spectrometry experiments. (C) Relationship between tail-length and TE changes observed after oocyte maturation, redrawn from Figure 4A, but highlighting points for mRNAs with a TE ≤0.1 in stage 11 oocytes in blue (Supplementary file 3) and those for cyclin B, cyclin B3, and fizzy in yellow, green, and purple, respectively. The dashed line indicates a TE increase of 10 fold.
Figure 2—figure supplement 2
Uncoupled behavior observed for a subset of mRNAs between the last stages of oocyte maturation.
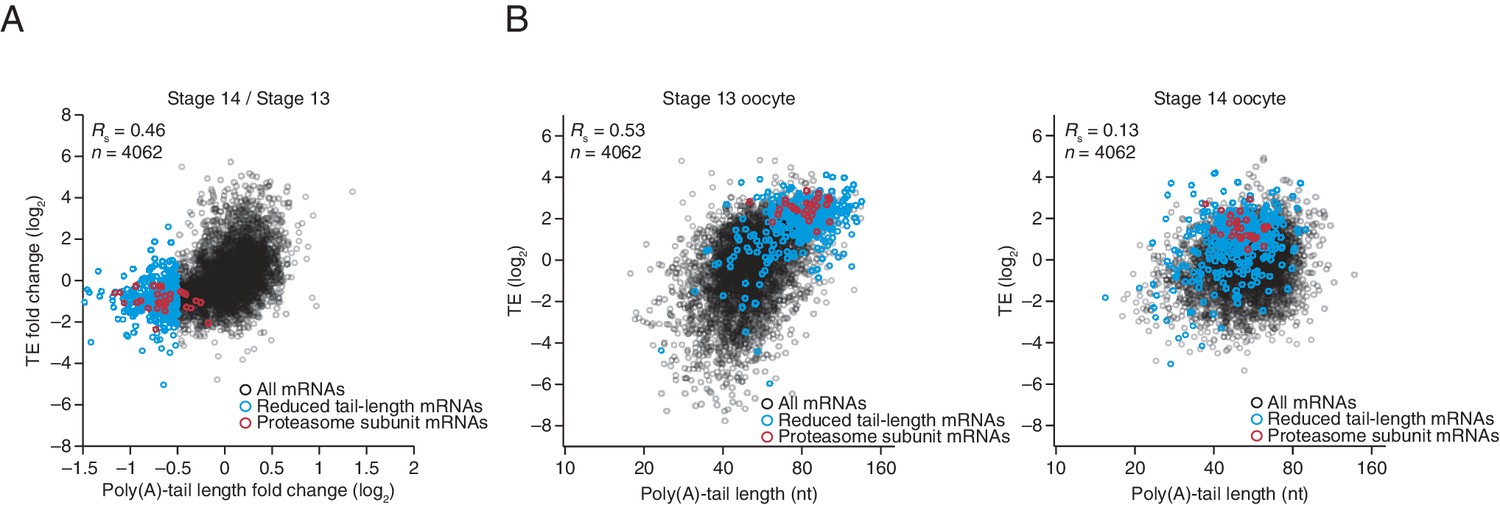
(A) The relationship between the tail-length and TE changes observed between stage 14 oocytes relative to stage 13 oocytes, redrawn from Figure 2, highlighting in blue mRNAs that had tail-length decreases of at least 29% (log2 fold change of –0.5), and in red mRNAs encoding proteasome subunits (Supplementary file 3). (B) The relationship between tail length and TE observed in stage 13 and 14 oocytes (left and right, respectively) analyzed as in Figure 2 but plotting results for only the mRNAs examined in panel A and highlighting the same sets of mRNAs as in panel A. TE values (log2) were median centered (median values for stage 13 and 14 oocytes, –1.2409 and –0.0779, respectively).
Figure 3
Dynamics of translational regulation during oocyte maturation.
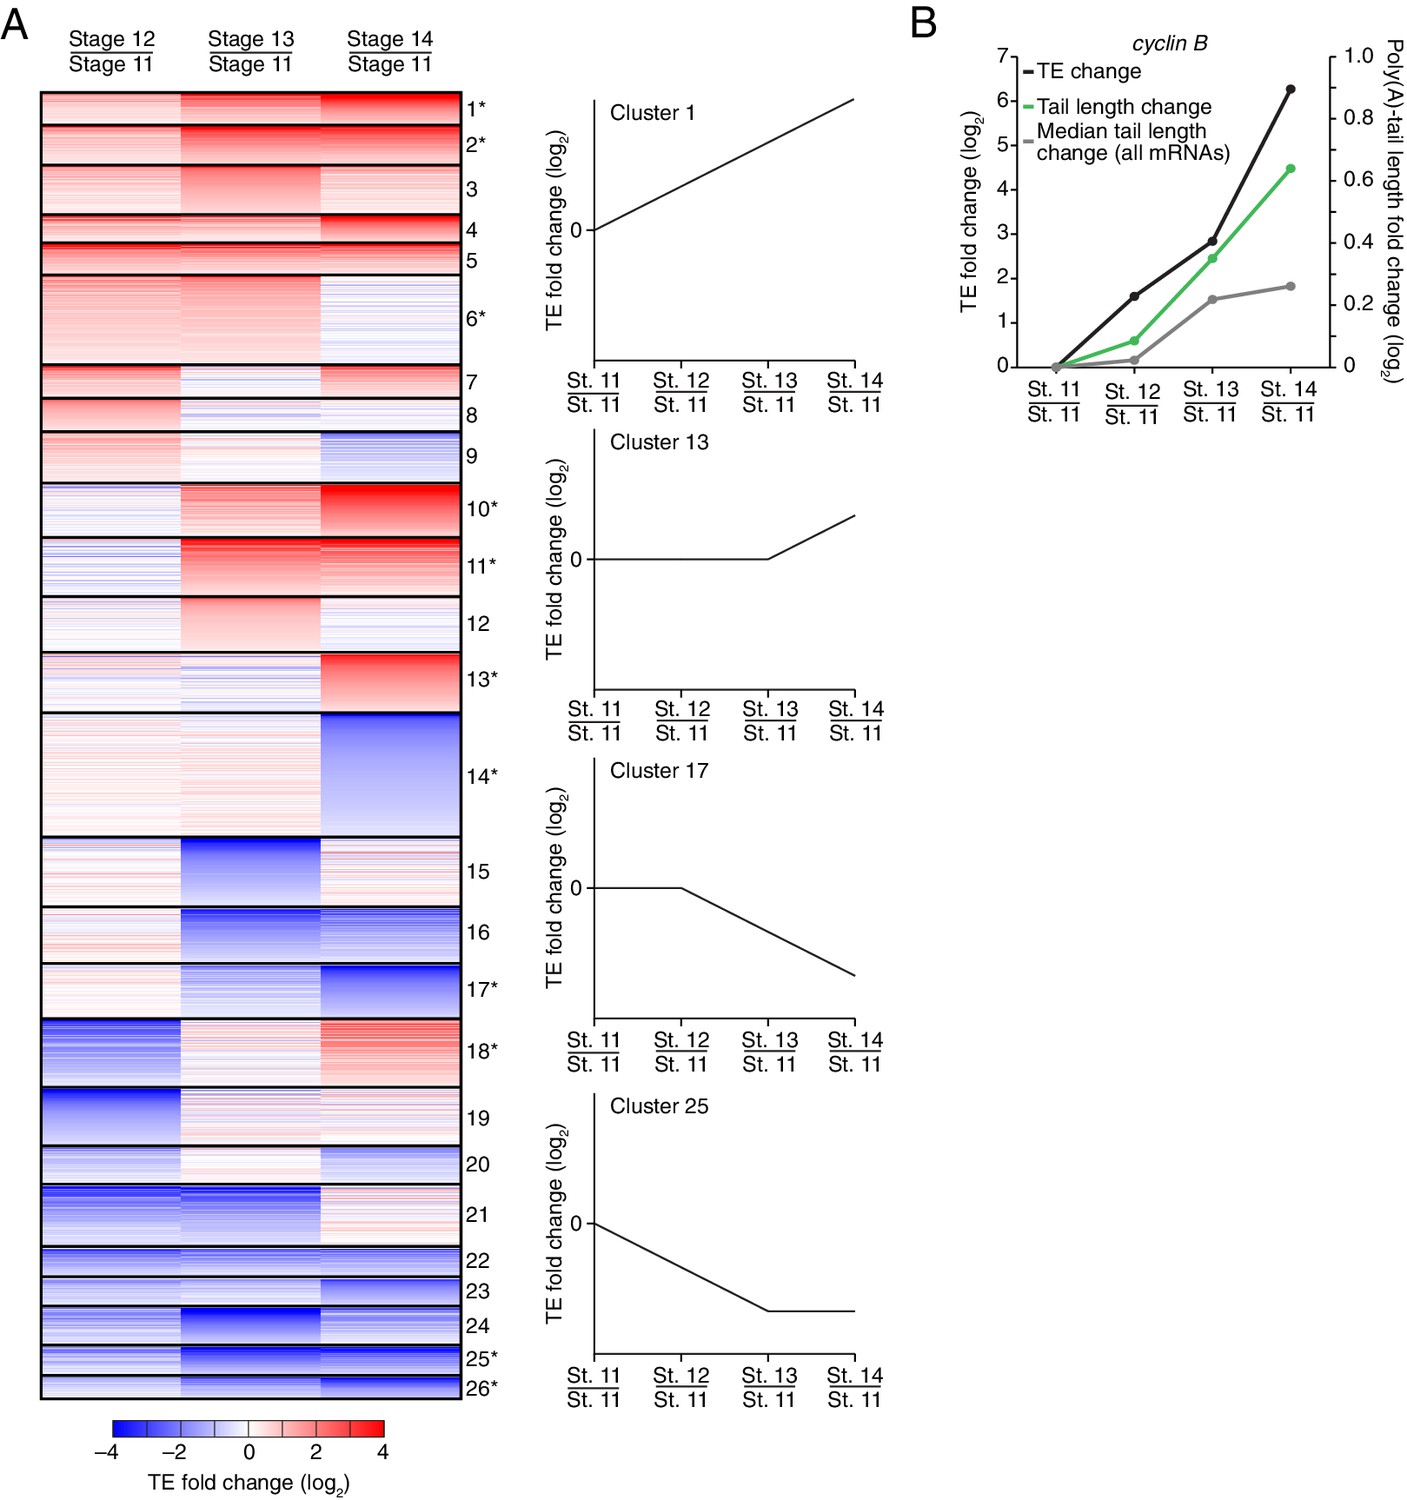
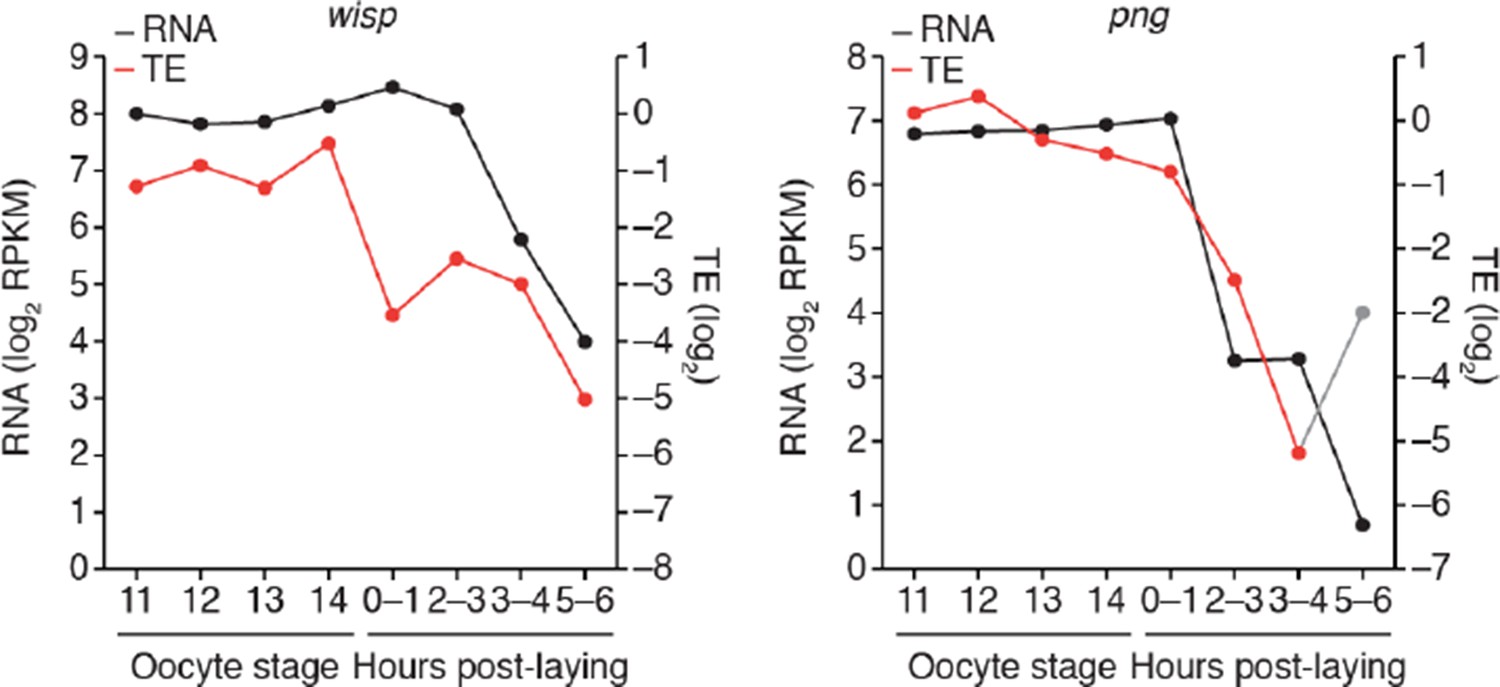
(A) Distinct patterns of TE changes during oocyte maturation. TE values (log2) for mRNAs in oocytes from stages 11 through 14 that had ≥10.0 RPM in the RNA-seq data for all samples, and ≥10.0 RPM in the ribosome-profiling data for at least one sample and >0.0 RPM in the others were median centered as in Figure 2. The median-centered TEs for stage 12, 13, and 14 oocytes were normalized to those of stage 11 oocytes and then clustered into defined patterns. The heatmap shows clustered TE changes for all mRNAs with ≥0.5 or ≤–0.5 log2 fold change between any two samples. Clusters are identified by number, and stylized graphs illustrate the TE dynamics of sample clusters. Clusters that are significantly overrepresented are marked with an asterisk (p value < 0.05, following Bonferonni correction). (B) Changes in TE (black) and mean poly(A)-tail length (green) of cyclin B mRNA during oocyte maturation. TEs (log2) were normalized as in Figure 3A, and the median of the changes in mean poly(A)-tail length (log2) for all mRNAs over these stages is shown as a grey line. Fold changes (log2) calculated relative to stage 11 oocytes are indicated on the respective y axes.
Figure 4
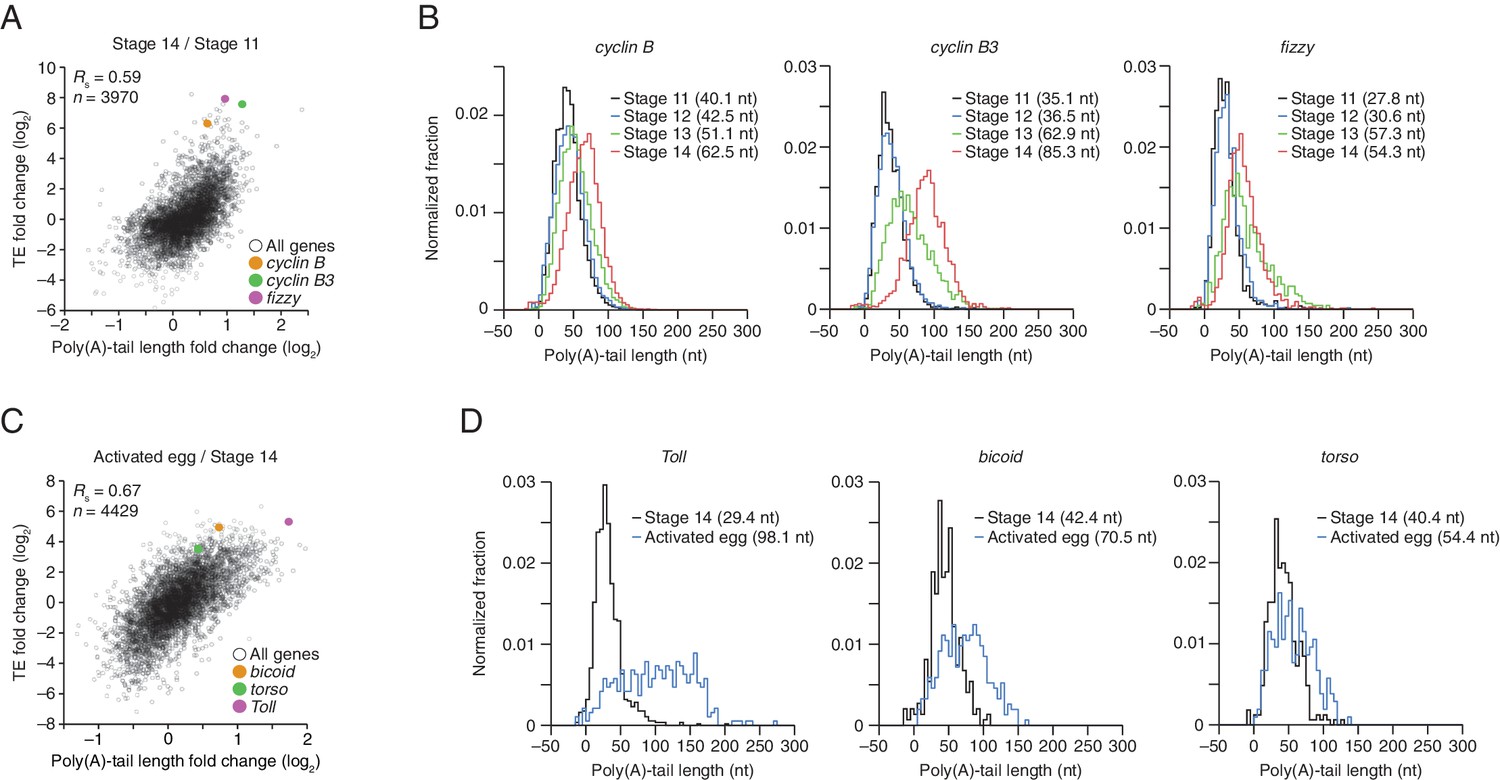
TEs and Poly(A) tail lengths of selected mRNAs during oocyte maturation and egg activation.
(A) Relationship between net tail-length and TE changes observed after oocyte maturation, highlighting the behavior of cyclin B, cyclin B3, and fizzy. The TE data for stage 14 oocytes were from Kronja et al. (2014b). Values from stage 14 oocytes are compared to those of stage 11 oocytes (median TE value used for median centering, 0.389); otherwise, as in Figure 1B. (B) Distributions of poly(A)-tail lengths of mRNAs from cyclin B (left), cyclin B3 (middle), and fizzy (right) at the indicated developmental stages. Mean poly(A)-tail lengths are in parentheses. (C) Relationship between tail-length and TE changes observed after egg activation, showing the same plot as in Figure 2 (bottom right), but highlighting the behavior of Toll, bicoid, and torso. (D) Distributions of poly(A)-tail lengths of mRNAs from Toll (left), bicoid (middle), and torso (right) at the indicated developmental stages; otherwise, as in Figure 4B.
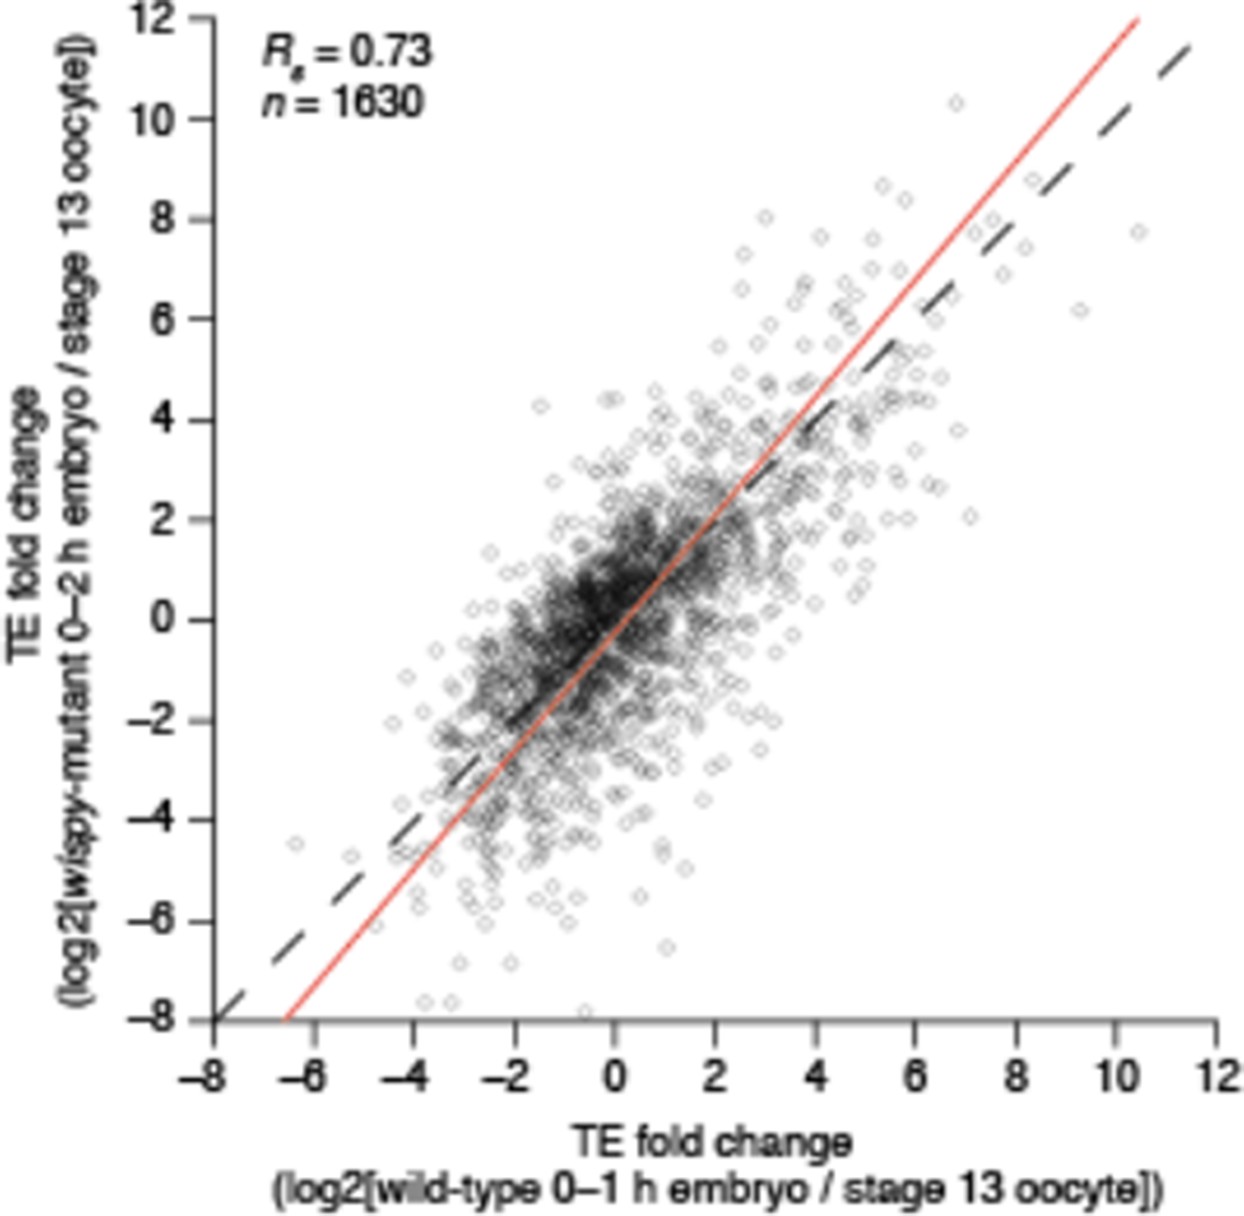
Figure 5 with 1 supplement
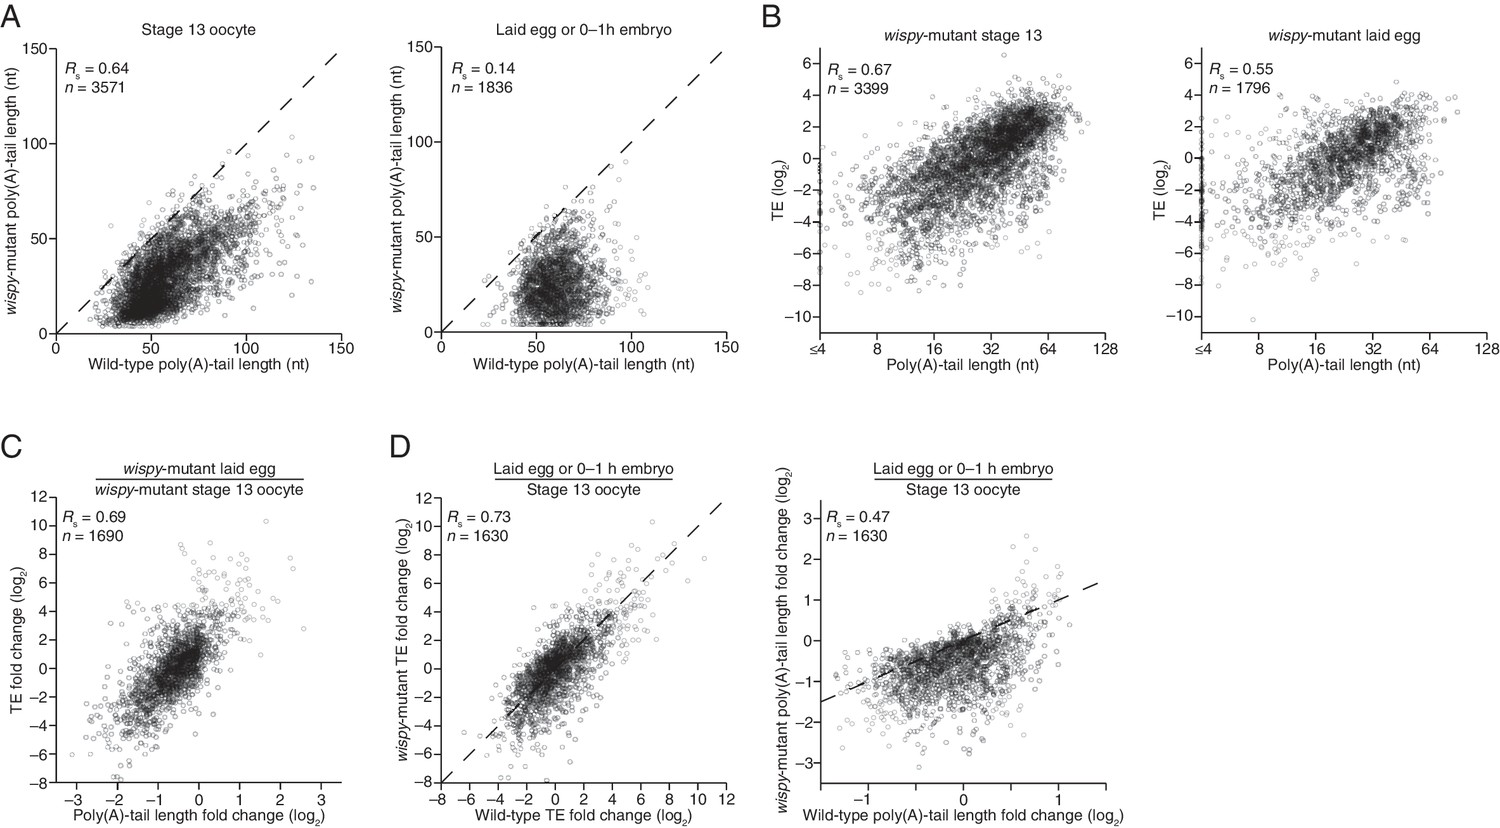
Widespread impact of Wispy on poly(A)-tail length but not TE.
(A) Comparison of mean poly(A)-tail lengths in wild-type and wispy-mutant stage 13 oocytes (left) and in wild-type cleavage-stage embryos and wispy-mutant laid eggs (right). Plotted are mean poly(A)-tail lengths of mRNAs with ≥100 poly(A) tags in both the wild-type and wispy-mutant sample at the indicated developmental stage. mRNAs that had mean tail-length values ≤4 nt are reported as 4 nt. The dashed line is for y = x. (B) Relationship between mean poly(A)-tail length and TE at the indicated developmental stage in wispy-mutant oocytes (left) and laid eggs (right). The TEs were calculated by dividing wispy-mutant stage 13 oocyte or laid egg RPF data by wild-type stage 13 oocyte or 0–1 hr embryo RNA-seq data, respectively. TE values (log2) were median centered (median values in wispy-mutant stage 13 oocytes and laid eggs, –1.0551 and 0.3302, respectively). mRNAs that had mean tail-length values ≤4 nt are reported as ≤4 nt; otherwise, as in Figure 1B. (C) Relationship between tail-length and TE changes observed between wispy-mutant laid eggs and stage 13 oocytes. TE fold-change values (log2) were median centered (median value, 0.8132); otherwise, as in Figure 1B. The mRNAs that seemed to have increased poly(A)-tail lengths over this time tended to have very short poly(A)-tails in stage 13 oocytes, suggesting that their positive fold-change values reflected difficulties in accurately measuring poly(A)-tails <8 nt using PAL-seq rather than genuine increases in poly(A)-tail length. (D) Comparison of TE changes for wild-type and wispy-mutant samples during the OET (left) and comparison of tail-length changes for wild-type and wispy-mutant samples during the OET (right). TE fold-change values (log2) were median centered (median values for the wild-type and wispy-mutant samples, 0.7207 and 0.8367, respectively). Dashed line is for y = x. Otherwise, this panel is as in Figure 1B.
Figure 5—figure supplement 1
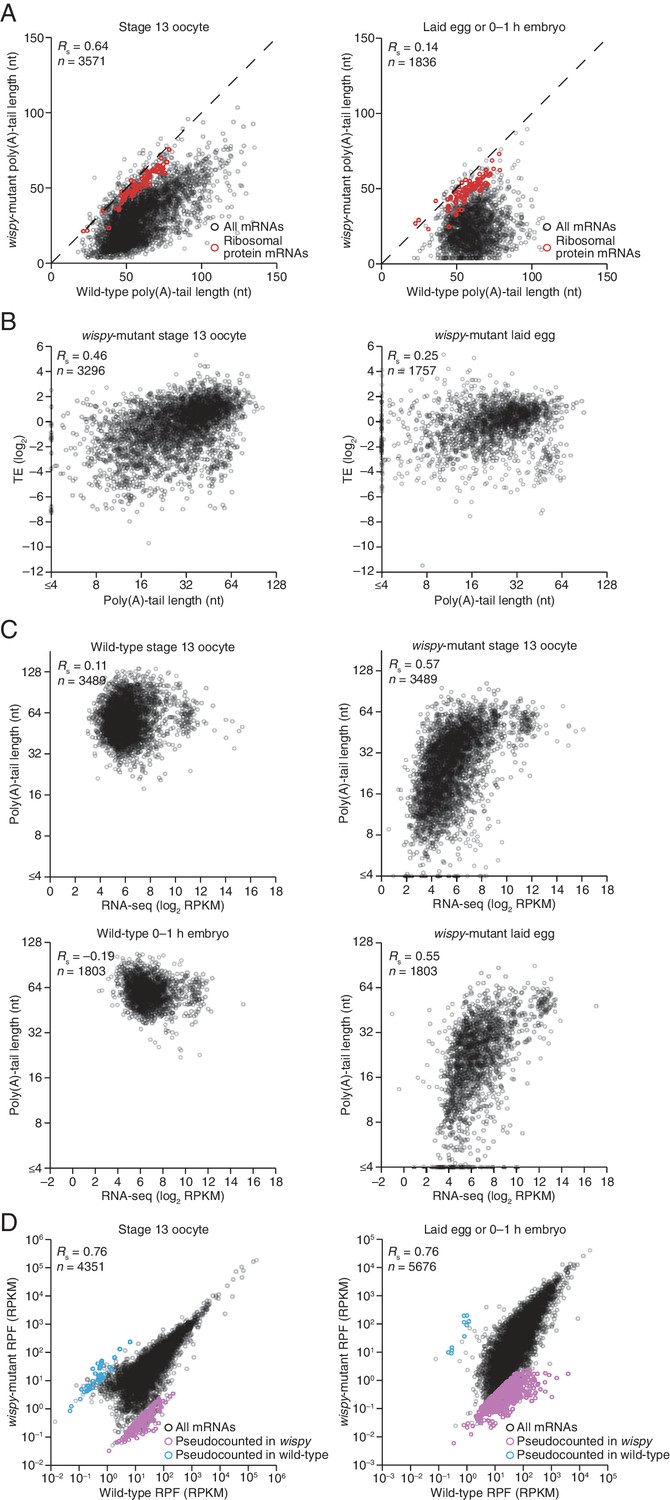
Impact of Wispy on the poly(A)-tail lengths, mRNA recovery, and RPFs.
(A) The plots from Figure 5A, highlighting mRNAs encoding ribosomal proteins in red (Supplementary file 3). (B) Relationship between mean poly(A)-tail length and TE at the indicated developmental stage in wispy-mutant samples. The TEs were calculated using wispy-mutant RNA-seq and ribosome profiling data, and are median centered (median values in stage 13 oocytes and laid eggs, –0.5729 and 0.5761, respectively); otherwise, as in Figure 5B. (C) Relationship between measured RNA abundance and poly(A)-tail length in wild-type stage 13 oocytes and 0–1 hr embryos, and in wispy-mutant stage 13 oocytes and laid eggs. Results are plotted for mRNAs that had ≥100 poly(A) tags in both the wild-type and wispy-mutant samples for the corresponding stage and ≥10.0 RPM in the RNA-seq data in the wild-type sample. The same mRNAs are plotted in corresponding wild-type and wispy-mutant samples. mRNAs that had mean tail-length values ≤4 nt are reported as ≤4 nt. (D) Comparison of RPF measurements for wild-type and wispy-mutant stage 13 oocytes (left) and 0–1 hr embryos and laid eggs (right). Results are plotted for all mRNAs with ≥10.0 RPM in the ribosome-profiling data of either the wild-type or wispy-mutant sample, and any mRNA with 0 reads in either sample was given a pseudocount of 1 read and highlighted in blue or purple (Supplementary file 3).
Figure 6 with 1 supplement
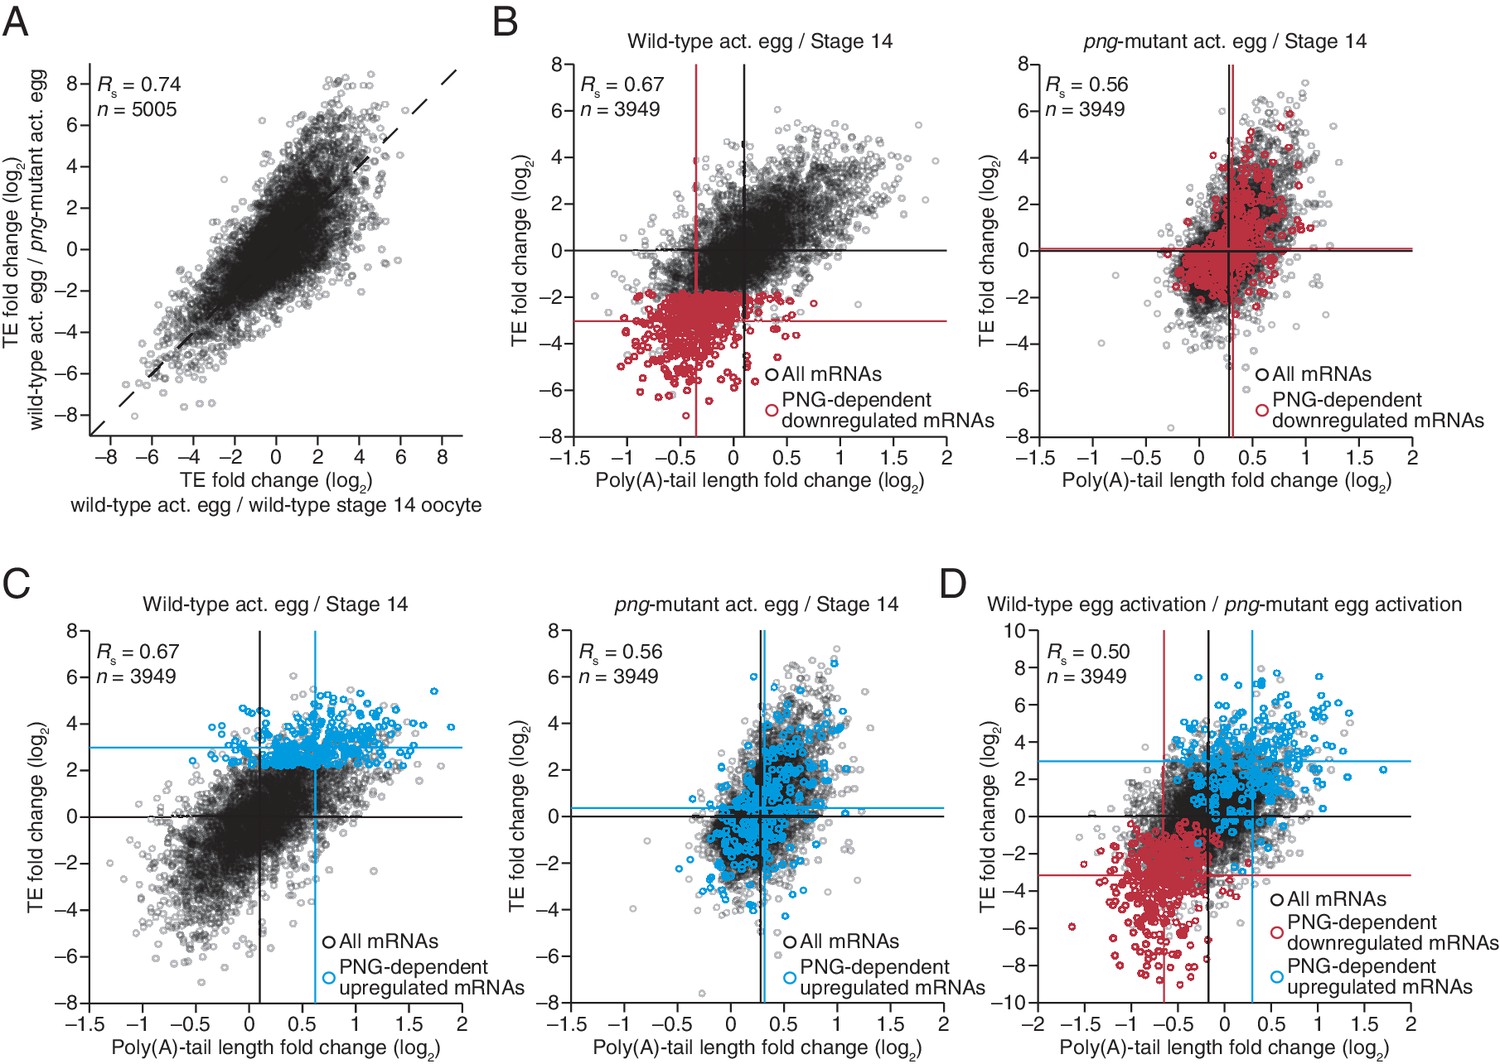
Widespread translational regulation by PAN GU primarily attributable to changes in poly(A)-tail length.
(A) Relationship between the TE changes in wild-type activated eggs relative to wild-type stage 14 oocytes and those in wild-type activated eggs relative to png-mutant activated eggs. TE fold-change values (log2) were median centered (median values for wild-type activated egg relative to stage 14 oocyte and for wild-type activated egg relative to png-mutant activated egg, 0.3065 and 0.0881, respectively). Results are plotted for all mRNAs that had ≥10.0 RPM in the RNA-seq data of all samples, and ≥10.0 RPM in the ribosome profiling data of at least one of the two samples being compared and >0.0 RPM in the other. mRNAs ≥4-fold up- or downregulated in both comparisons were defined as the PNG-dependent up- or downregulated mRNAs, respectively. The TE data for wild-type stage 14 oocytes and activated eggs and png-mutant activated eggs were from Kronja et al. (2014b). Dashed line is for y = x. (B) Relationship between mean tail-length changes and TE changes after egg activation for wild-type activated eggs (left; modified from Figure 2 to include only the mRNAs that also passed the cutoffs for the png-mutant comparison) and png-mutant activated eggs (right). The mRNAs with PNG-dependent downregulation are highlighted in red (Supplementary file 3), analyzing and highlighting the same mRNAs in both plots. TE fold-change values (log2) were median centered (median for wild-type and png-mutant samples, 0.1366 and 0.6448, respectively. Black lines indicate median values for all mRNAs, and red lines indicate median values for the PNG-dependent downregulated mRNAs. The TE data for wild-type stage 14 oocytes and activated eggs and png-mutant activated eggs are from Kronja et al. (2014b). Otherwise, this panel is as in Figure 1B. (C) The plots of panel B, highlighting the PNG-dependent upregulated mRNAs in blue (Supplementary file 3). (D) Relationship between tail-length and TE changes during egg activation in wild-type relative to the png-mutant samples, analyzing and highlighting the same mRNAs as in panels B and C. TE fold-change values (log2) were median centered (median value, –0.727). Otherwise, this panel is as in Figure 6B.
Figure 6—figure supplement 1
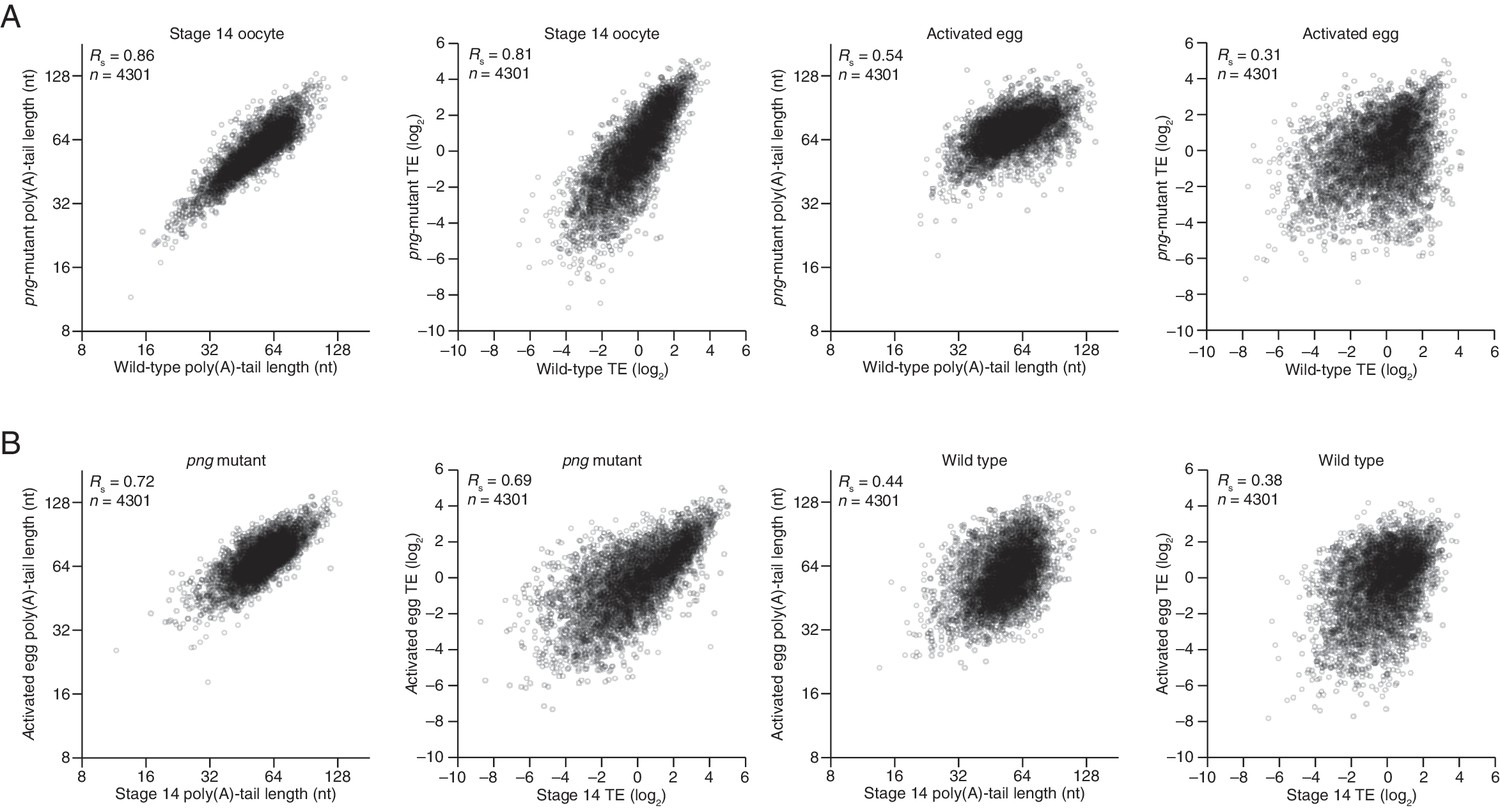
Perturbation of tail-length and TE during egg activation in png-mutant samples.
(A) Comparison of mean poly(A)-tail lengths and TEs between wild-type and png-mutant stage 14 oocytes, and between wild-type and png-mutant activated eggs. TE values (log2) were median centered (median values in wild-type and png-mutant stage 14 oocytes, –0.2182 and –1.182, respectively, and wild-type and png-mutant activated eggs 0.0724 and –0.2394, respectively. Results are plotted for mRNAs that had ≥100 poly(A) tags, ≥10.0 RPM in the RNA-seq data, and >0 RPM in the ribosome profiling data for each sample. (B) Comparison of mean poly(A)-tail lengths and TEs between png-mutant stage 14 oocytes and activated eggs, and between wild-type stage 14 oocytes and activated eggs; otherwise, as in panel A.
Figure 7 with 2 supplements
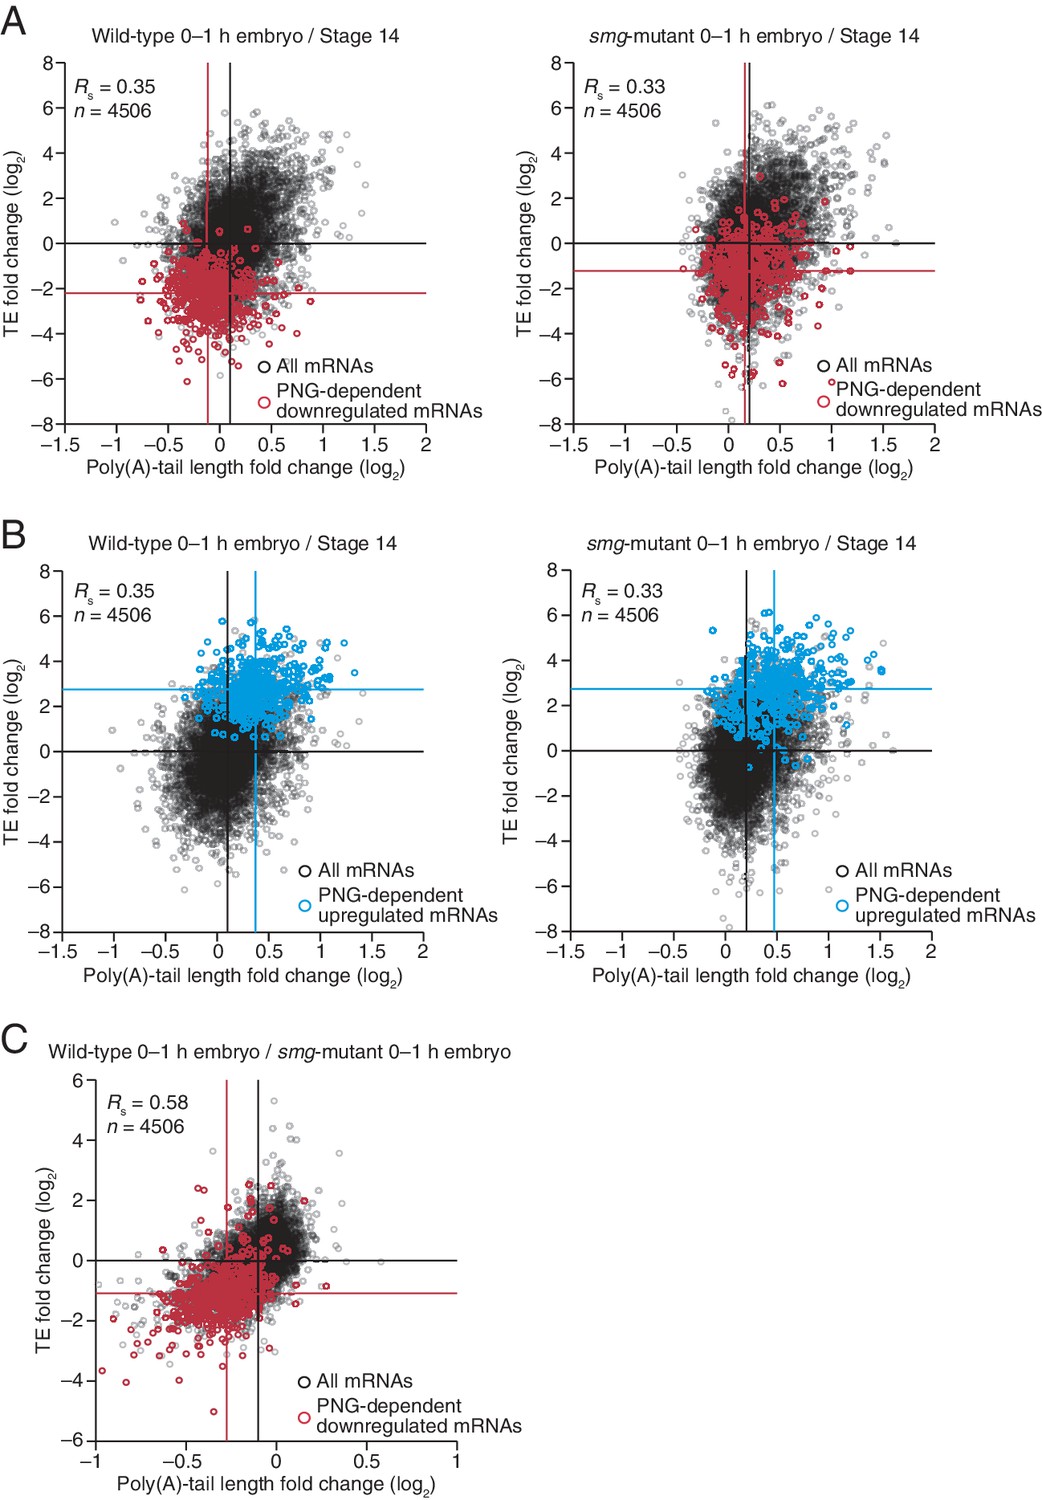
Translational regulation by Smaug primarily explained by changes in poly(A)-tail length.
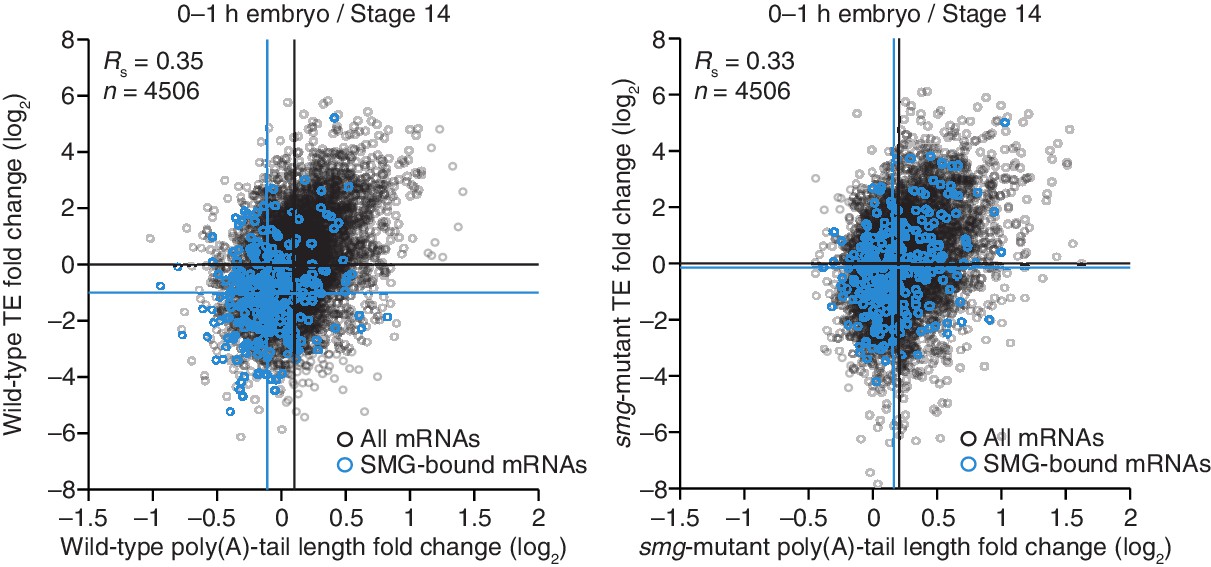
(A) Relationship between mean tail-length changes and TE changes during the OET for wild-type 0–1 hr embryos (left) and smg-mutant 0–1 hr embryos (right), comparing wild-type or smg-mutant 0–1 hr embryos to wild-type stage 14 oocytes. The wild-type plot is redrawn from Figure 1B, but includes only the mRNAs that also passed the cutoffs for the smg-mutant comparison. TE fold-change values (log2) were median centered (median for the wild-type and smg-mutant samples, 0.175 and –0.0221, respectively). The PNG-dependent downregulated mRNAs are in red (Supplementary file 3), analyzing and highlighting the same mRNAs in both plots. Otherwise, this panel is as in Figure 6B. (B) The plots of panel A, highlighting the PNG-dependent upregulated mRNAs in blue (Supplementary file 3). (C) Relationship between tail-length and TE changes for wild-type 0–1 hr embryos relative to smg-mutant 0–1 hr embryos, analyzing and highlighting the same mRNAs as in panel A. TE fold-change values (log2) were median centered (median value, 0.2634). Otherwise, this panel is as in Figure 6D.
Figure 7—figure supplement 1
Smaug-dependent translational repression of Smaug binding targets, primarily explained by changes in poly(A)-tail length.
Shown is the relationship between mean tail-length changes and TE changes during the OET for wild-type and smg-mutant 0–1 hr embryos (left and right, respectively), highlighting mRNAs previously reported to be bound by SMG in the early embryo (Chen et al., 2014); otherwise as in Figure 6B.
Figure 7—figure supplement 2
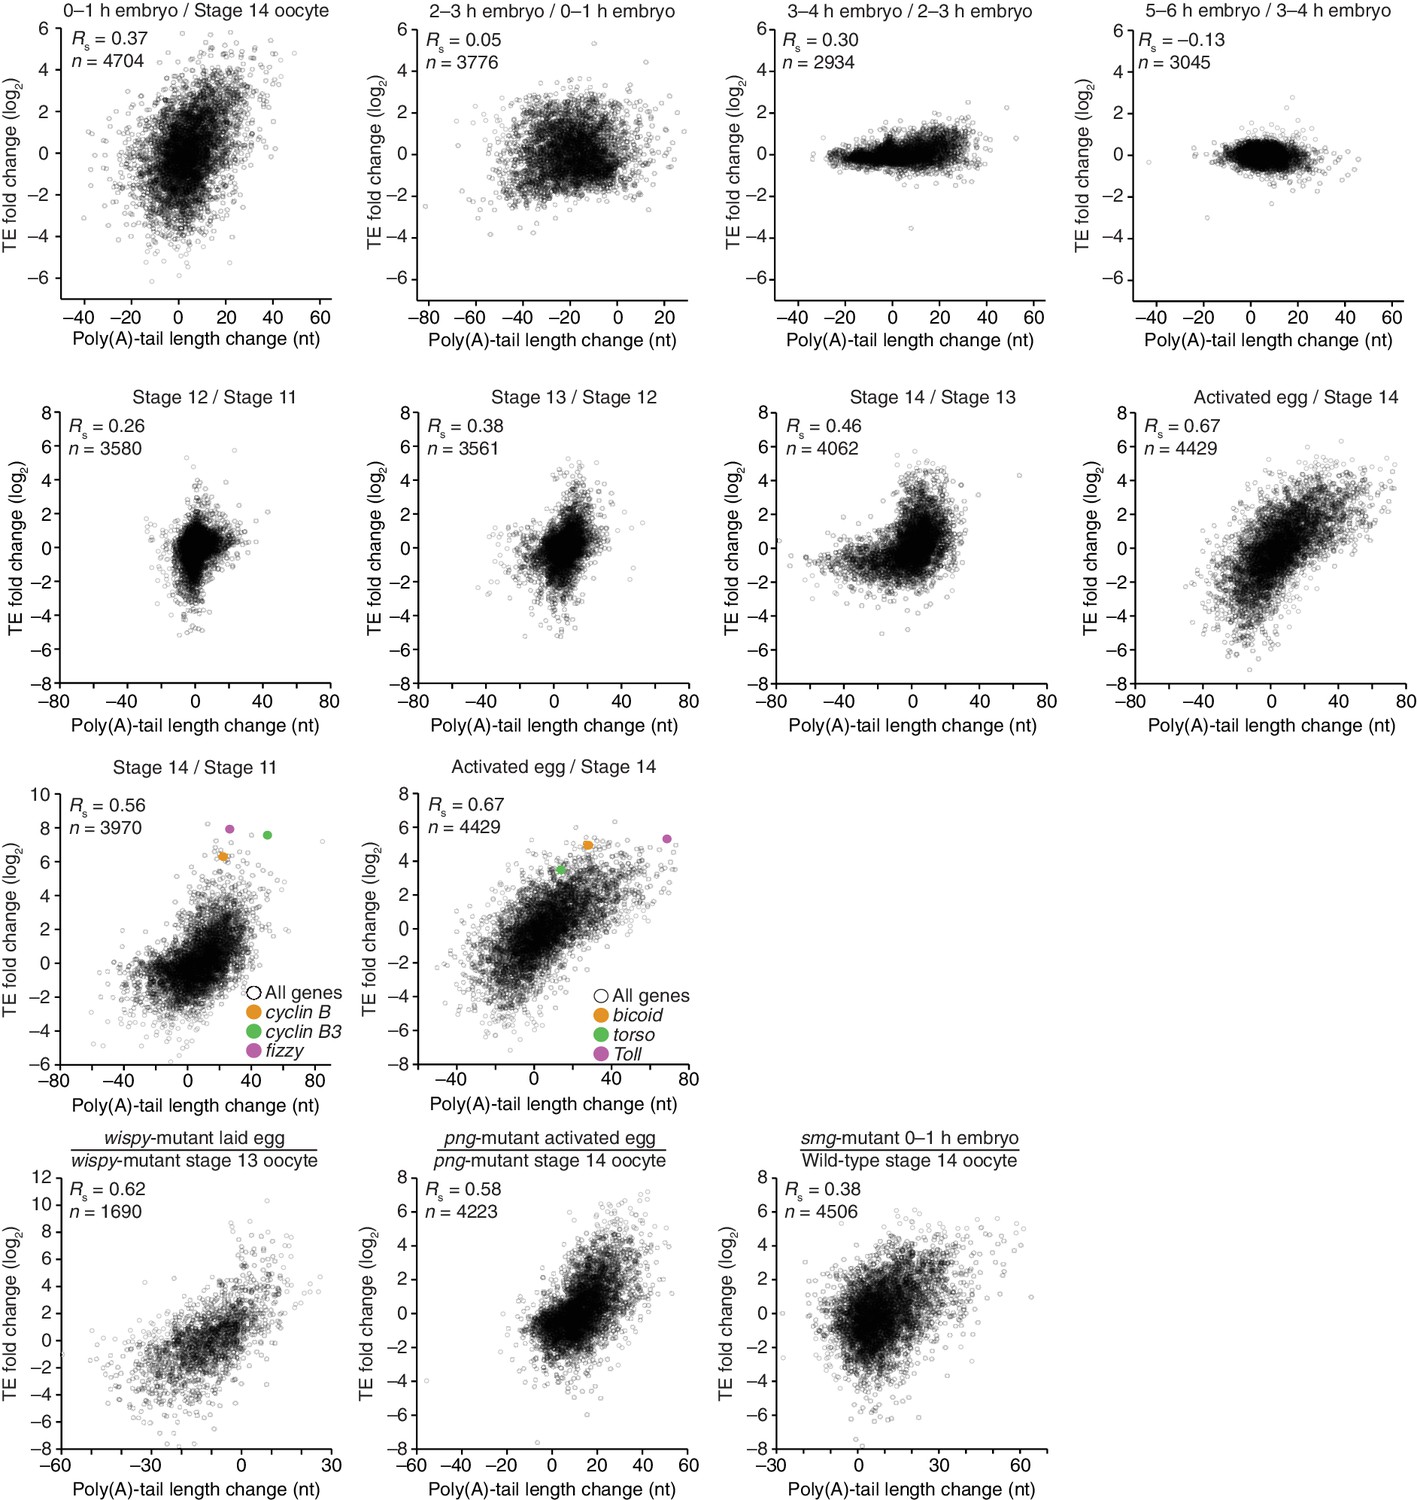
Relationship between poly(A)-tail length changes and TE changes throughout development, plotting absolute rather than relative tail-length changes.
Shown are the relationships between the absolute differences in mean tail-length and TE changes observed between stages; otherwise, as in the corresponding panels from Figures 1, 2, 4, 5, 6, and 7.
Author response image 1
Author response image 2
Additional files
-
Supplementary file 1
Relationships between RNA-seq, ribosome profiling, and PAL-seq measurements for wild-type samples at different developmental stages.
The Spearman correlation coefficients for all unique pairwise combinations of stages are shown. For the RNA-seq or ribosome-profiling comparisons, all mRNAs with ≥10.0 RPM in both samples of the respective datasets being compared were included. For the PAL-seq comparisons, all mRNAs with ≥100 poly(A) tags in both samples being compared were included.
- https://doi.org/10.7554/eLife.16955.016
-
Supplementary file 2
Processed RNA-seq, ribosome-profiling, and PAL-seq data.
Each of the 16 spreadsheets of this file reports the data for the indicated sample. Within each sheet, the initial Refseq ID is the dm6 Refseq ID that was selected for each gene on the basis of being the longest annotated isoform of that gene. For many genes, the 3' end of this gene model was extended to include the most distal isoform supported by PAL-seq data. RPKM is reads per kilobase per million mapped reads. Descriptions of the analyses include the measurement cutoffs applied to RNA-seq, ribosome profiling, and PAL-seq data, as applicable. The 8th and 9th columns specify whether a 10 RPM cutoff for RNA-seq or ribosome profiling data was met, and the 10th column specifies whether a 100 tag cutoff for PAL-seq data was met. All transcripts with a 3' UTR that overlapped a snoRNA or snRNA were excluded from analysis, as indicated in the final column.
- https://doi.org/10.7554/eLife.16955.017
-
Supplementary file 3
Lists of mRNAs highlighted in figures.
This file lists mRNAs that are highlighted in Figures 6 and 7, and Figure 2−figure supplement 1C, Figure 2−figure supplement 2, Figure 5−figure supplement 1, and Figure 7−figure supplement 1.
- https://doi.org/10.7554/eLife.16955.018
Download links
A two-part list of links to download the article, or parts of the article, in various formats.
Downloads (link to download the article as PDF)
Open citations (links to open the citations from this article in various online reference manager services)
Cite this article (links to download the citations from this article in formats compatible with various reference manager tools)
mRNA poly(A)-tail changes specified by deadenylation broadly reshape translation in Drosophila oocytes and early embryos
eLife 5:e16955.
https://doi.org/10.7554/eLife.16955


