Septin/anillin filaments scaffold central nervous system myelin to accelerate nerve conduction
- Max Planck Institute of Experimental Medicine, Germany
- University Medical Center, Johannes Gutenberg University, Germany
- Center for Nanoscale Microscopy and Molecular Physiology of the Brain, Germany
- University Hospital Basel, Switzerland
Figures
Figure 1 with 1 supplement
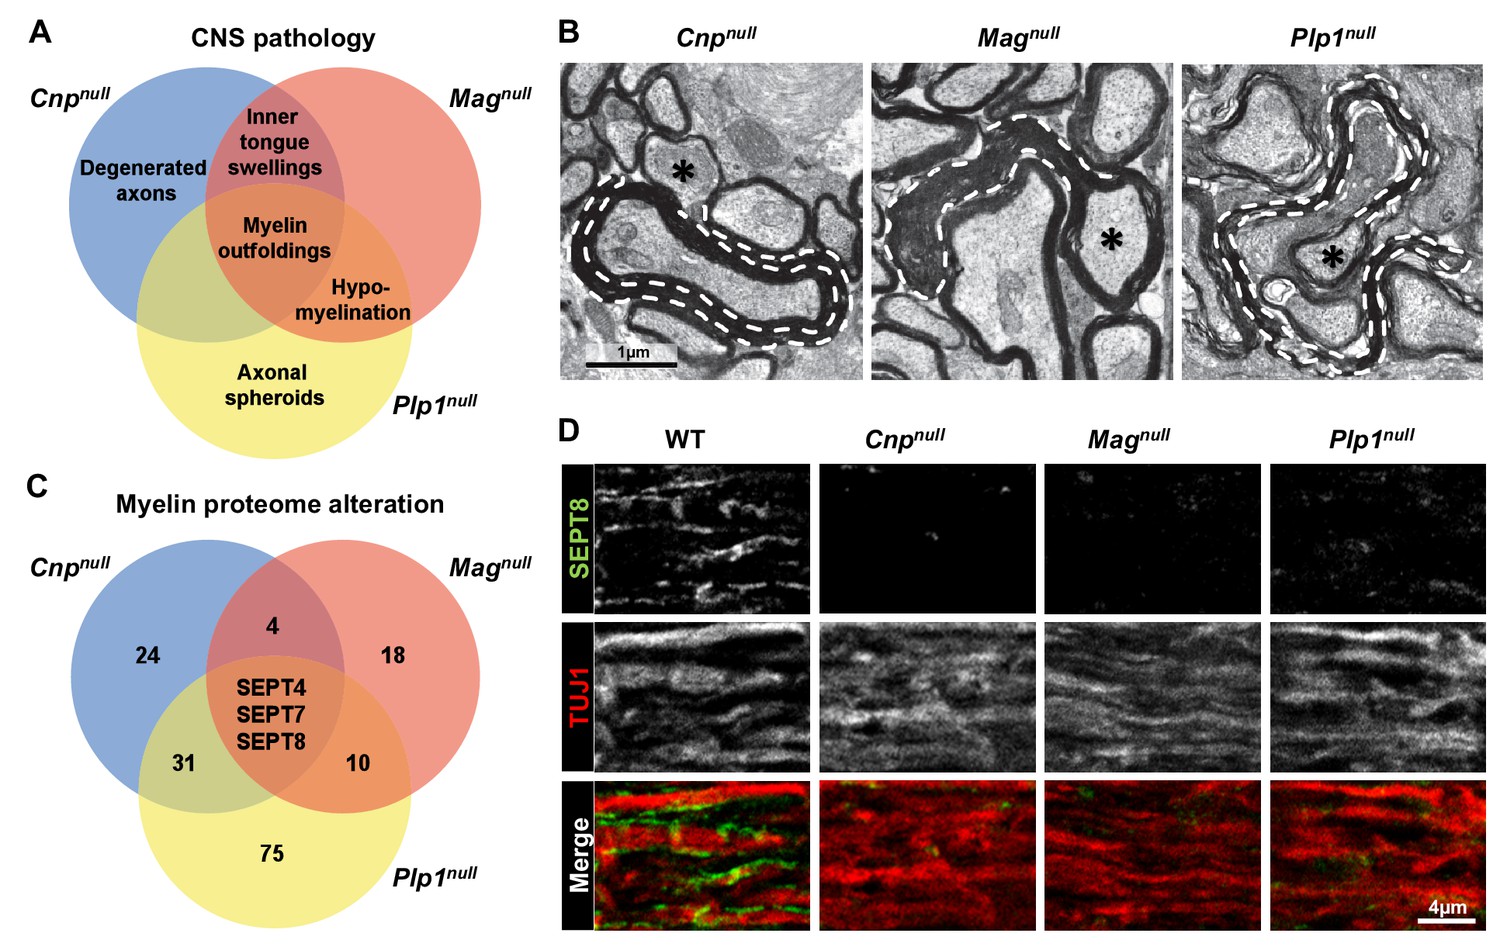
Mouse mutants with complex CNS pathology exhibit distinct but overlapping changes of myelin composition.
(A) Venn diagram summarizing CNS pathology in mice lacking the myelin proteins CNP, MAG, or PLP, according to quantitative evaluation of electron micrographs of optic nerves at P75. Note that myelin outfoldings are common to all analyzed mutants. See Figure 1—figure supplement 1A–E for quantification of these experiments. (B) Electron micrographs of P75 optic nerve cross-sections showing several myelinated axons. Myelin outfoldings and associated axons are labelled with stippled lines and asterisks, respectively. Images are representative of 4 animals per genotype, as quantified in Figure 1—figure supplement 1A. (C) Venn diagram summarizing myelin proteome alterations in Cnpnull, Magnull, and Plp1null-mice determined by quantitative mass spectrometry. Given are the numbers of proteins exhibiting significantly changed abundance in myelin purified from the brains of respective mutants at P75. Note that several septins are diminished in all analyzed mutants. n=3 animals per genotype. See Figure 1—source data 1 for entire dataset and Figure 1—figure supplement 1G–I for validation by immunoblot. (D) Immunolabelling validates diminishment of SEPT8 (green) in myelinated fibre tracts of Cnpnull, Magnull, and Plp1null-mice. Longitudinally sectioned optic nerves of P75 mice are shown. The axonal marker TUJ1 (red) was co-labelled as a control. Images are representative of three independent experiments.
-
Figure 1—source data 1
Dataset file (differential myelin proteome analyses) related to Figure 1C, Figure 1—figure supplement 1F, and Figure 6E.
- https://doi.org/10.7554/eLife.17119.004
Figure 1—figure supplement 1
Neuropathological and molecular analysis in mouse models of complex CNS pathology (Cnpnull, Magnull, and Plp1null mice).
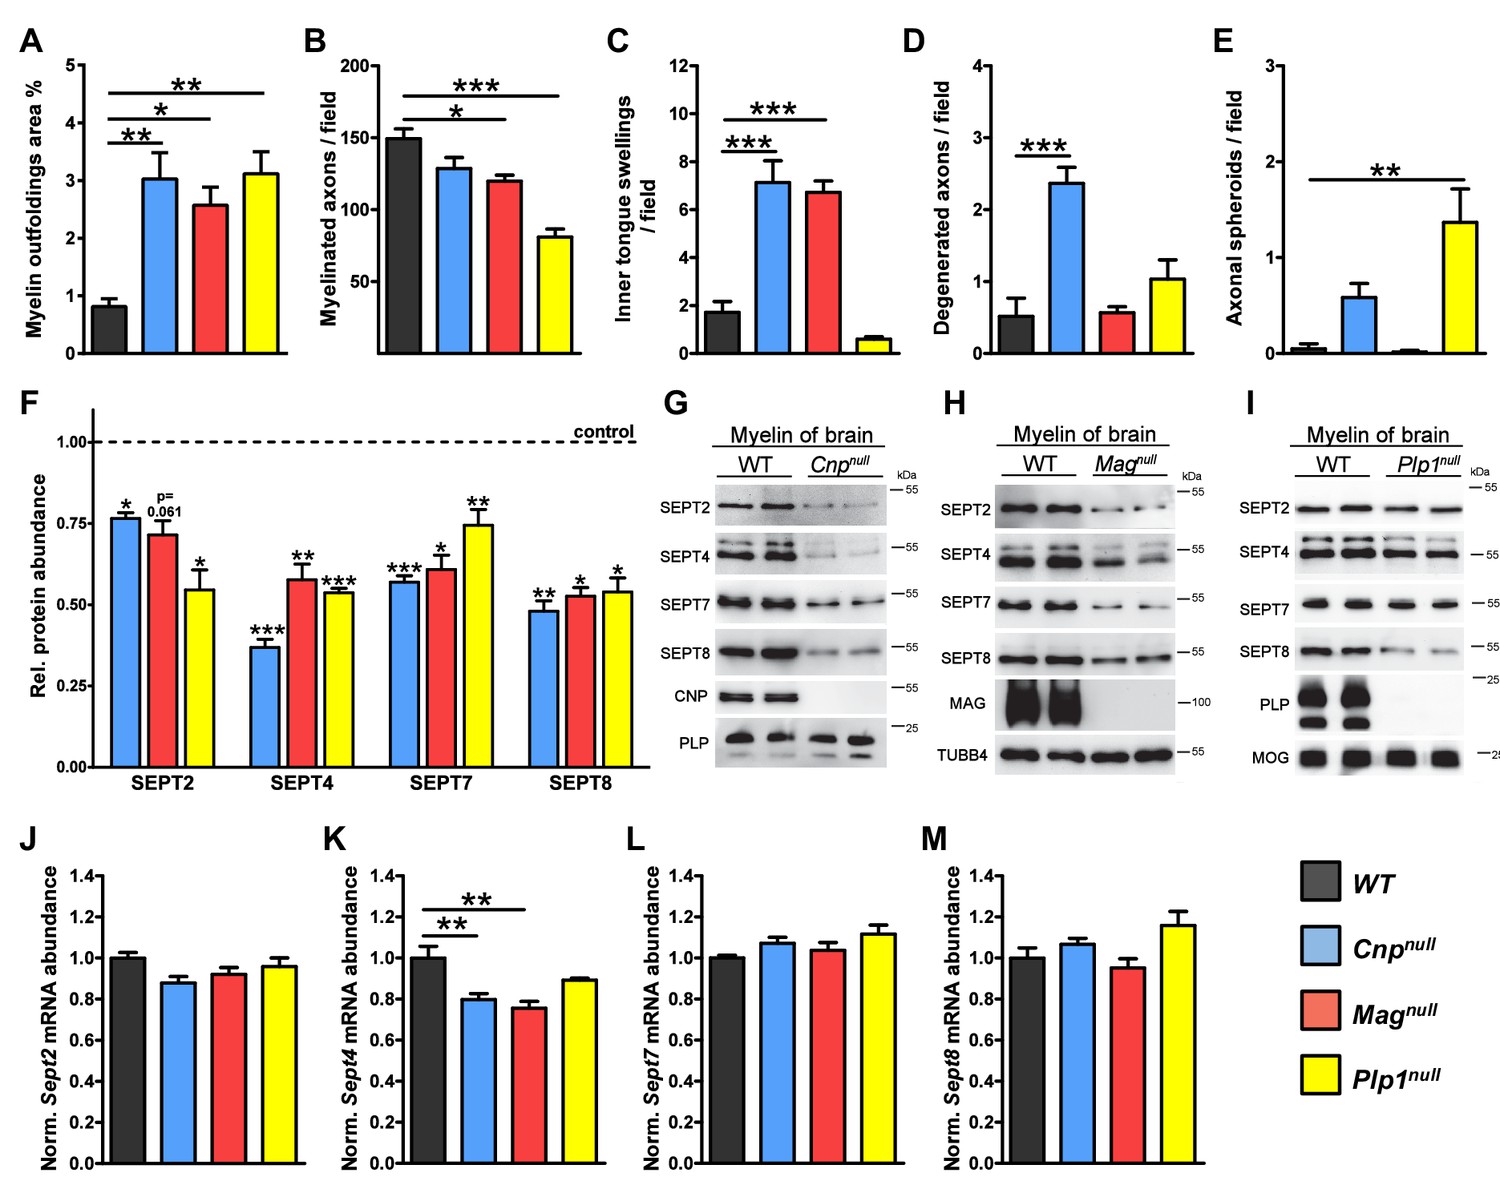
(A–E) Quantification of CNS pathology as summarized in main Figure 1A. Electron micrographs of optic nerves were evaluated for the indicated pathologies. Note that myelin outfoldings are common to all three mutants. n=4 mice per genotype; age P75; one-way ANOVA with Bonferroni’s multiple comparisons test comparing to WT. p-values are as follows: (A) WT vs. Cnpnull p=0.002, WT vs. Magnull p=0.02, WT vs. Plp1null p=0.002; (B) WT vs. Cnpnull p=0.11, WT vs. Magnull p=0.02, WT vs. Plp1null p<0.001; (C) WT vs. Cnpnullp<0.001, WT vs. Magnull p<0.001, WT vs. Plp1null p=0.56; (D) WT vs. Cnpnull p<0.001, WT vs. Magnull p>0.999, WT vs. Plp1null p=0.37; (E) WT vs. Cnpnull p=0.22, WT vs. Magnull p>0.999, WT vs. Plp1null p=0.0012. (F) Diminishment of myelin septins in models of myelin-related pathology according to label-free proteomics. Myelin was purified from the brains of the indicated mutants and littermate controls, and analyzed by quantitative mass spectrometry. Given is the abundance in myelin of SEPT2, SEPT4, SEPT7, SEPT8 relative to their respective littermate controls. Note that the abundance in myelin of SEPT4, SEPT7, and SEPT8, was significantly reduced in all analyzed mutants. The diminishment in myelin of SEPT2 was significant in Cnpnulland Plp1nullmice and at the border of significance in Magnullmice. See Figure 1—source data 1 for the entire dataset. n=3 mice per genotype; age P75; unpaired two-tailed t-test; p-values are as follows: SEPT2: p=0.012 (Cnpnull), p=0.0614 (Magnull), p=0.013 (Plp1null); SEPT4: p<0.001 (Cnpnull), p=0.002 (Magnull), p<0.001 (Plp1null); SEPT7: p<0.001 (Cnpnull), p=0.0114 (Magnull), p=0.009 (Plp1null); SEPT8: p=0.007 (Cnpnull) p=0.011 (Magnull) p=0.011 (Plp1null). (G–I) Immunoblotting validates the diminished abundance of septins (SEPT2, SEPT4, SEPT7, SEPT8) in CNS myelin of all three models. Genotypes and equal loading were controlled by immunoblotting. Blots are representative of 3 animals per genotype. (J–M) Abundance of septin-mRNAs in models of myelin-related pathology. The abundance of the indicated mRNAs in a myelin-rich white matter tract (corpus callosum) of the indicated models was determined by qRT-PCR. The abundance of Sept2, Sept7, and Sept8 mRNA was unaltered in all models (J, L, M). The abundance of Sept4 was moderately reduced in Cnpnull and Magnull corpus callosi (K). Corpus callosi of n=4 animals per genotype were analyzed. One-way ANOVA with Bonferroni’s multiple comparison test comparing to WT. (J) WT vs. Cnpnull p=0.0767, WT vs. Magnull p=0.3661, WT vs. Plp1null p> 0.9999; (K) WT vs. Cnpnull p=0.006, WT vs. Magnull p=0.0014, WT vs. Plp1null p=0.175; (L) WT vs. Cnpnull p=0.45, WT vs. Magnull, p>0.999, WT vs. Plp1null p=0.085; (M) WT vs. Cnpnull p>0.999, WT vs. Magnull p>0.999, WT vs. Plp1null p=0.14.
Figure 2 with 1 supplement
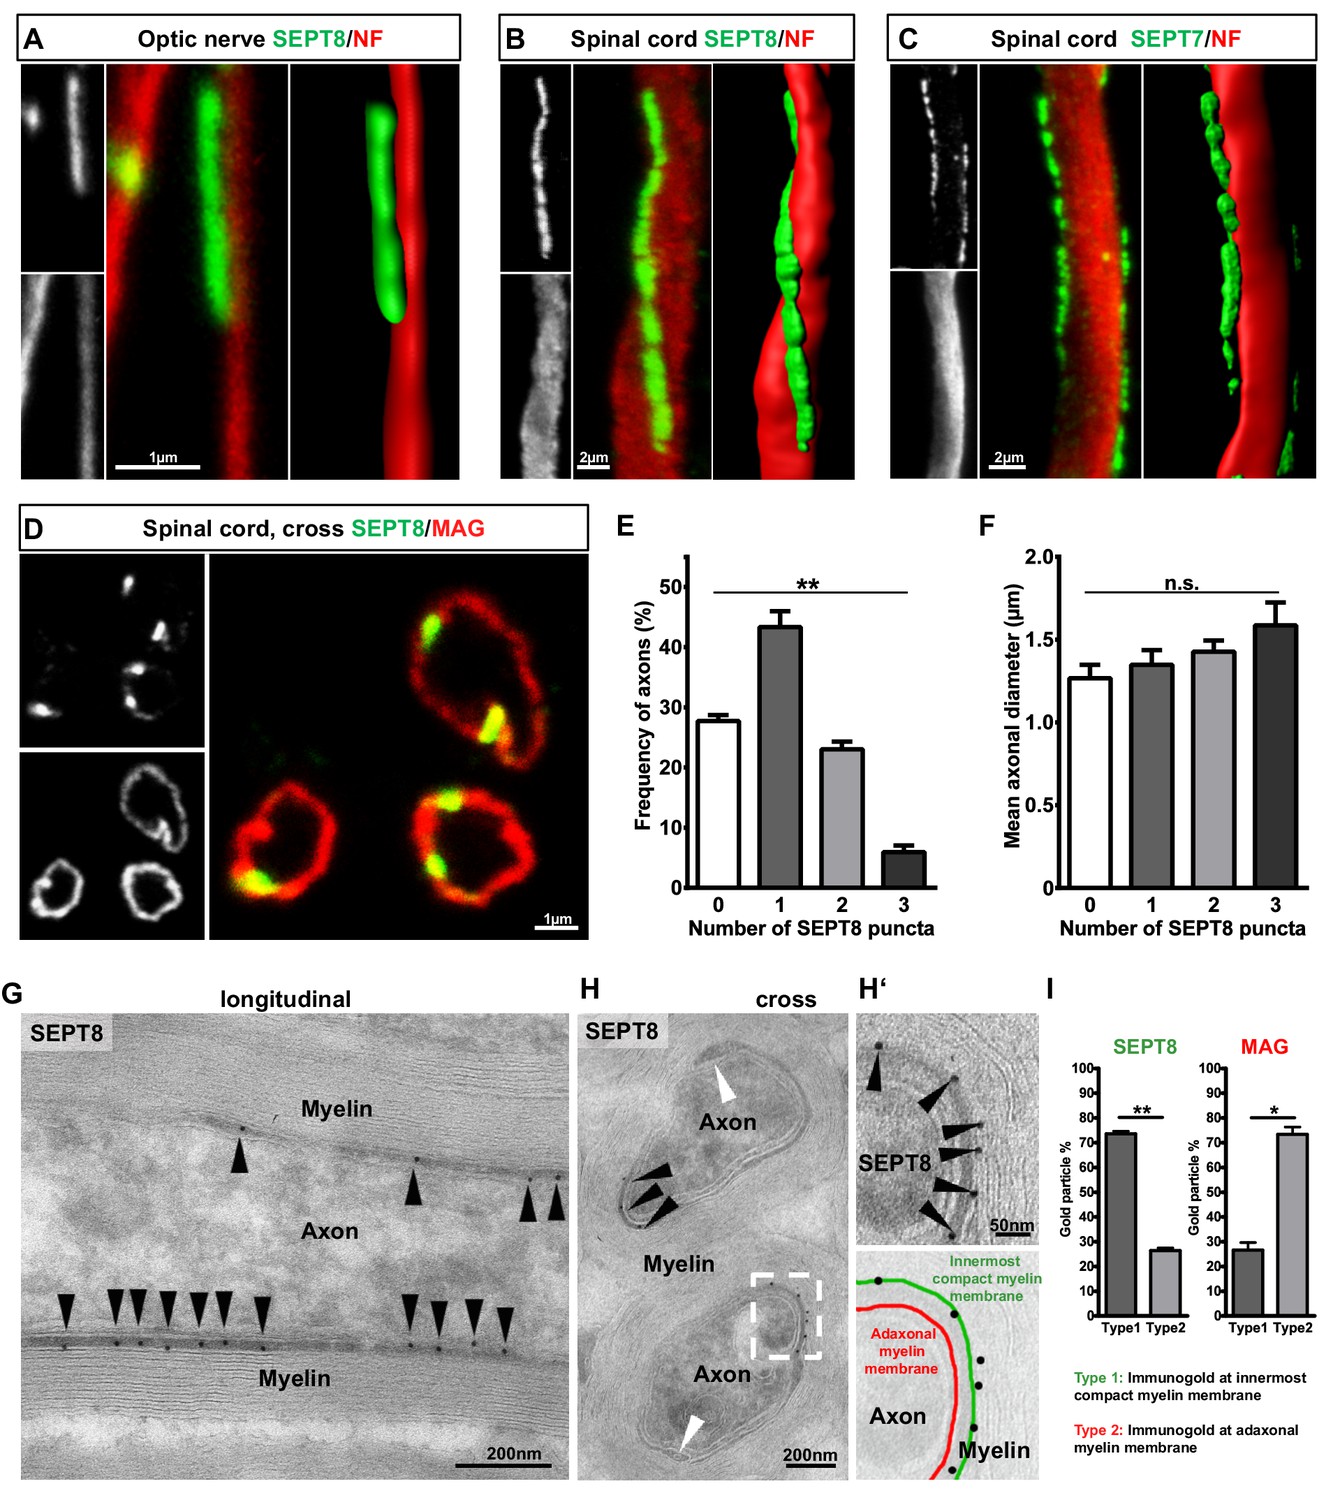
Septins form longitudinal filaments in the adaxonal compartment of mature CNS myelin.
(A–C) Immunofluorescent signal of SEPT8 and SEPT7 (green) extends longitudinally alongside axons identified by neurofilament-labelling (red). All panels show maximal projections of confocal stacks, and 3-dimensional reconstructions of longitudinally sectioned WT optic nerve (A) or spinal cord (B,C) at age P75. Images are representative of three animals. (D–F) SEPT8 (green) immunolabelling indicates that septin filaments localize to the adaxonal non-compact myelin compartment marked by MAG-immunolabelling (red) (confocal micrograph, D). The number of filaments represented by SEPT8-puncta is plotted in relation to their frequency per axon/myelin-unit (E) and the axonal diameter (F). Data are represented as mean ± SEM. Analysis of 4 animals; repeated-measures-ANOVA; **p=0.0014 (E), n.s., p=0.26 (F). (G,H) Immunogold-labelling of cryosections identifies the localization of SEPT8 in the adaxonal myelin compartment in longitudinally (G) and cross-sectioned (H) optic nerves. Black arrowheads point at immunogold; white arrowhead points at the inner mesaxon. Images are representative of three animals. (H‘) Enlargement of the boxed area in H shows immunogold labelling of SEPT8 associated with the innermost membrane layer of compact myelin (green false colour in the overlay), not with the adaxonal myelin membrane (red false colour in the overlay). (I) Quantification of immunogold labelling of SEPT8 and MAG relative to the innermost membrane layer of compact myelin (type 1) and the adaxonal myelin membrane (type 2). Note that SEPT8 immunogold labelling is associated with the innermost membrane layer of compact myelin while MAG labelling is associated with the adaxonal myelin membrane. Mean ± SEM. Analysis of 3 animals; two-tailed paired t-test; SEPT8 **p=0.002, MAG, *p=0.02.
Figure 2—figure supplement 1
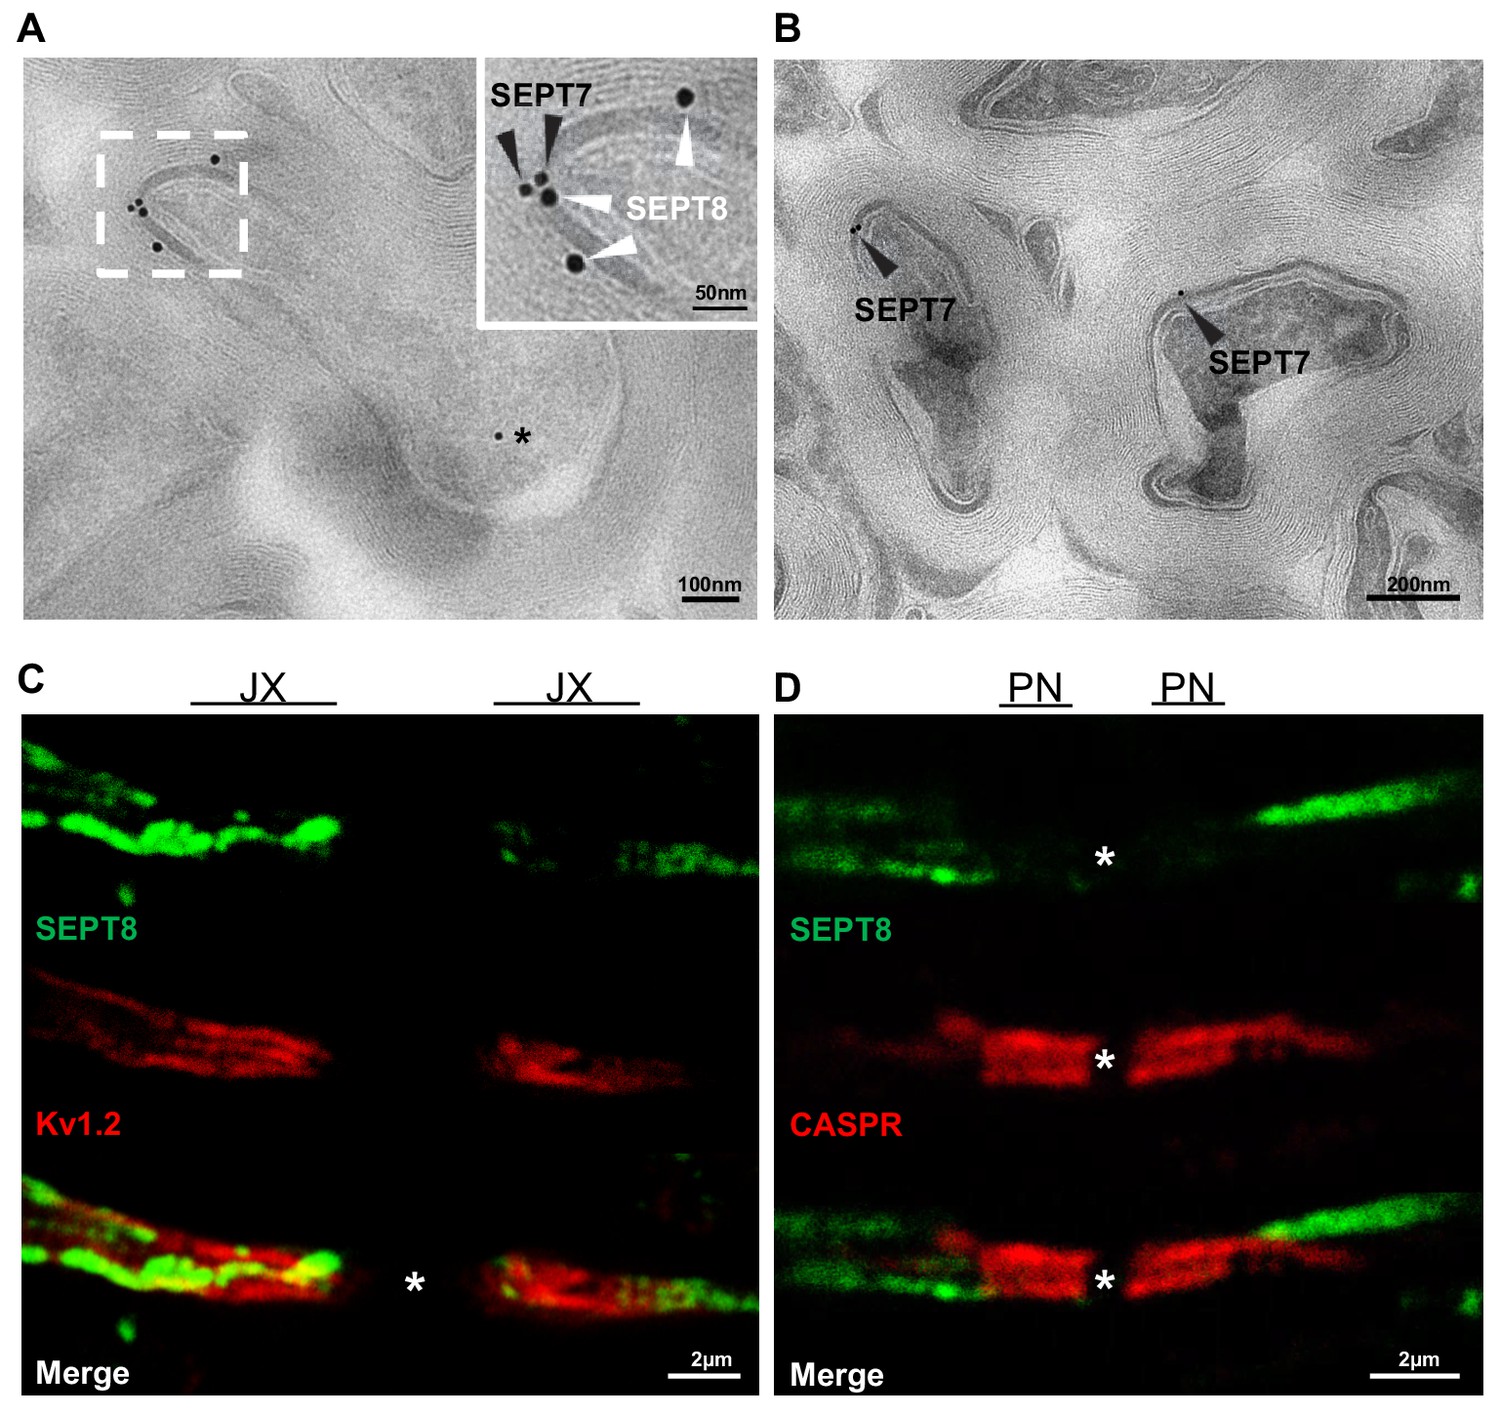
Localization of myelin septins.
(A,B) Localization of SEPT7 and SEPT8 by cryo-immuno electron microscopy. (a) Immunodetection of SEPT8 (15 nm gold particles, white arrowheads) together with SEPT7 (10 nm gold particles, black arrowheads) on optic nerve sections. Note that SEPT8 labeling was frequently found in close proximity to SEPT7 labeling and mostly confined to the adaxonal myelin compartment. Occasional SEPT7-labeling was also observed in axons (star). (B) As a control, SEPT7 (10 nm gold particles, black arrowheads) was detected individually, also displaying labeling in adaxonal myelin. (C,D) Myelin septins extend from the internodal segment into the juxtaparanodal but not the paranodal segment (C–D) Immunohistochemistry on longitudinal spinal cord sections at P75 detecting SEPT8 together with a marker for the juxtparanodal segment (Kv1.2) (C) or the paranodal segment (CASPR) (D). Note that SEPT8-labeling occasionally co-distributed with Kv1.2-labeling but not with CASPR-labeling. JX, juxtaparanode; PN, paranode.
Figure 3
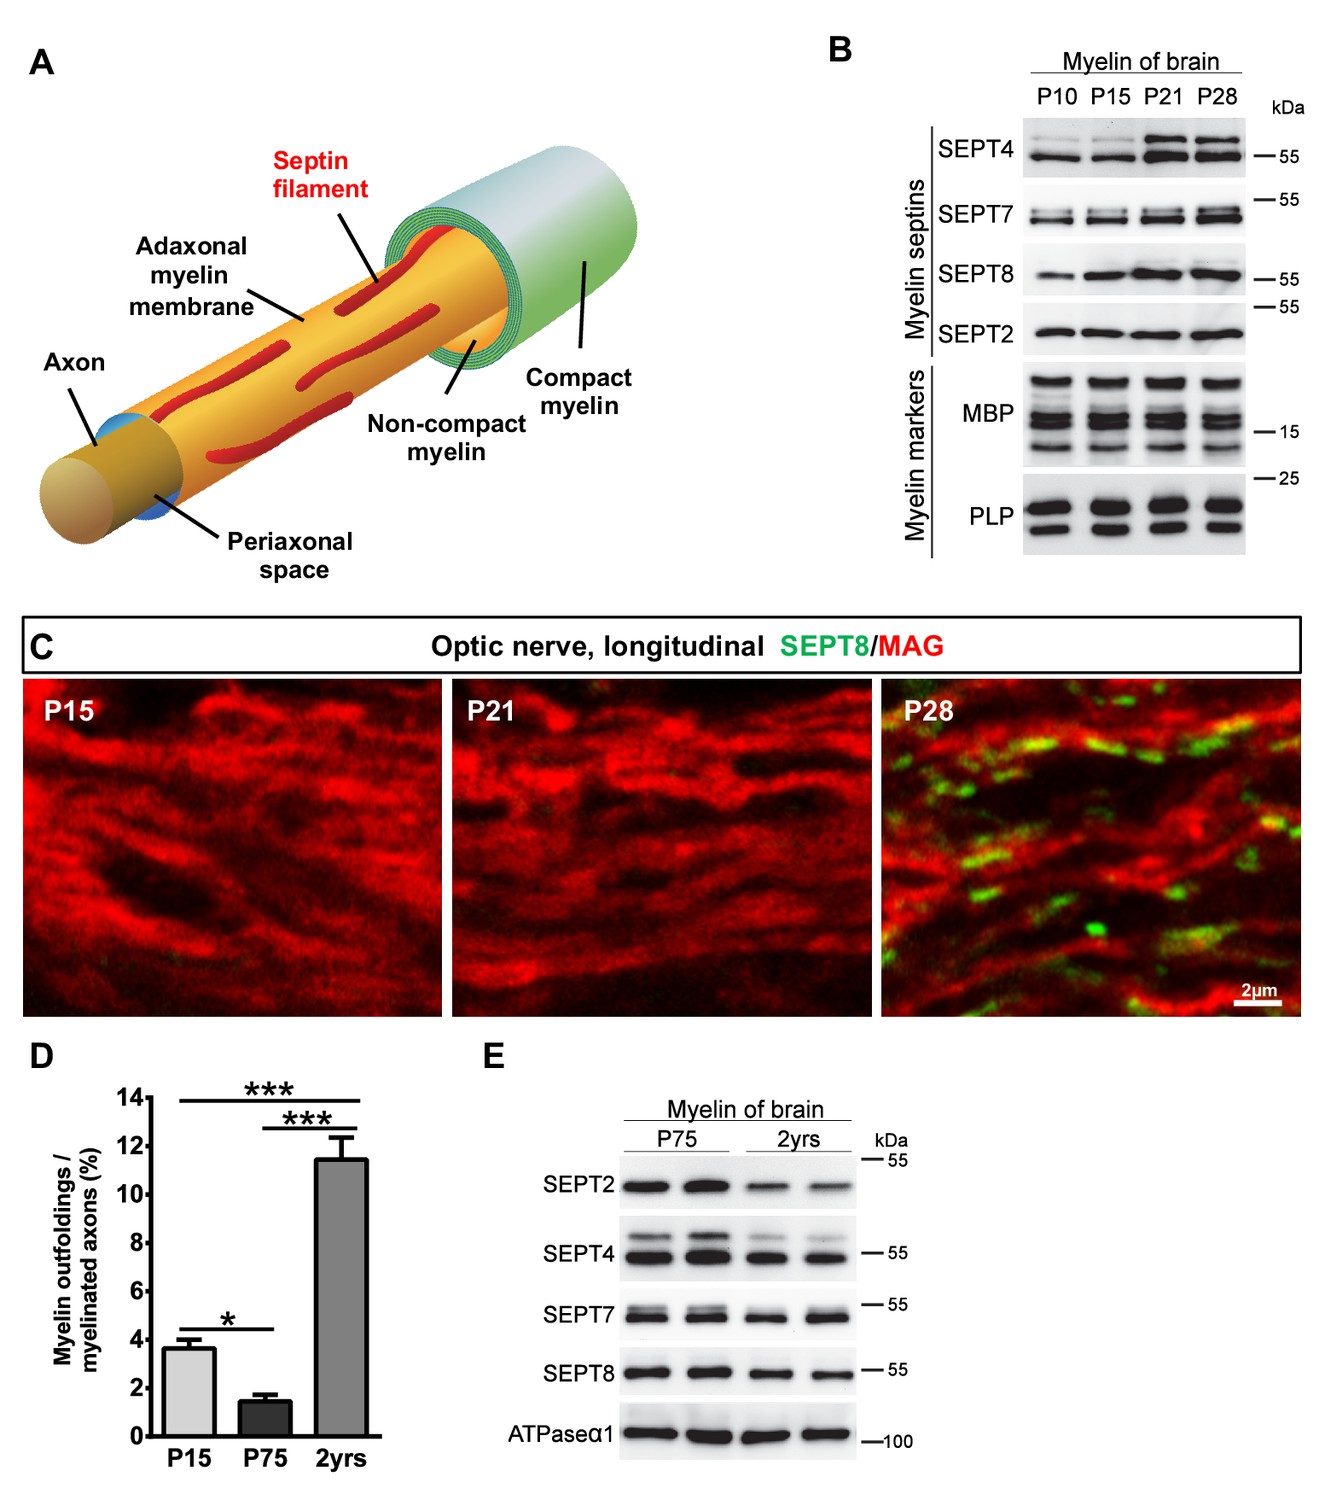
Septins in myelin development and aging.
(A) Scheme showing the localization of septin filaments (red) in healthy adaxonal myelin. Note that all experimental data support a model that myelin septins (SEPT2, SEPT4, SEPT7, SEPT8) assemble as longitudinal filaments in the non-compact adaxonal compartment of myelin, in which they underlie the innermost membrane of compact myelin. (B) Immunoblotting indicates that the abundance of several septins (SEPT4, SEPT7, SEPT8) increases with age in myelin purified from wild-type brains at P10, P15, P21, and P28, reflecting the maturation of myelin. Note that the abundance of the classical myelin markers MBP and PLP is unaltered. (C) Immunolabelling of WT optic nerves detects SEPT8 (green) at P28 but not at P15 or P21. Note that the myelin marker MAG (red) is detectable at all time points, reflecting that the optic nerve is largely myelinated by P14. Images are representative of three experiments. (D) Quantitative evaluation of electron micrographs of WT optic nerves indicates that the frequency of axon/myelin-units with myelin outfoldings declines between P15 and P75 (i.e. with myelin maturation) and is strongly increased at 2 years of age (i.e with normal aging). Mean ± SEM. n=4 animals were analyzed. One-way ANOVA with Tukey's multiple comparison test; P15 vs. P75, *p=0.044; P15 vs. 2 yrs, ***p<0.001, P75 vs. 2 yrs, ***p<0.001. (E) Immunoblotting indicates that the abundance of myelin septins is decreased in myelin purified from mice at the age of two years compared to P75, reflecting normal aging. Blot is representative of 3 animals per age. ATPase-alpha1 (ATP1A1) served as a control.
Figure 4
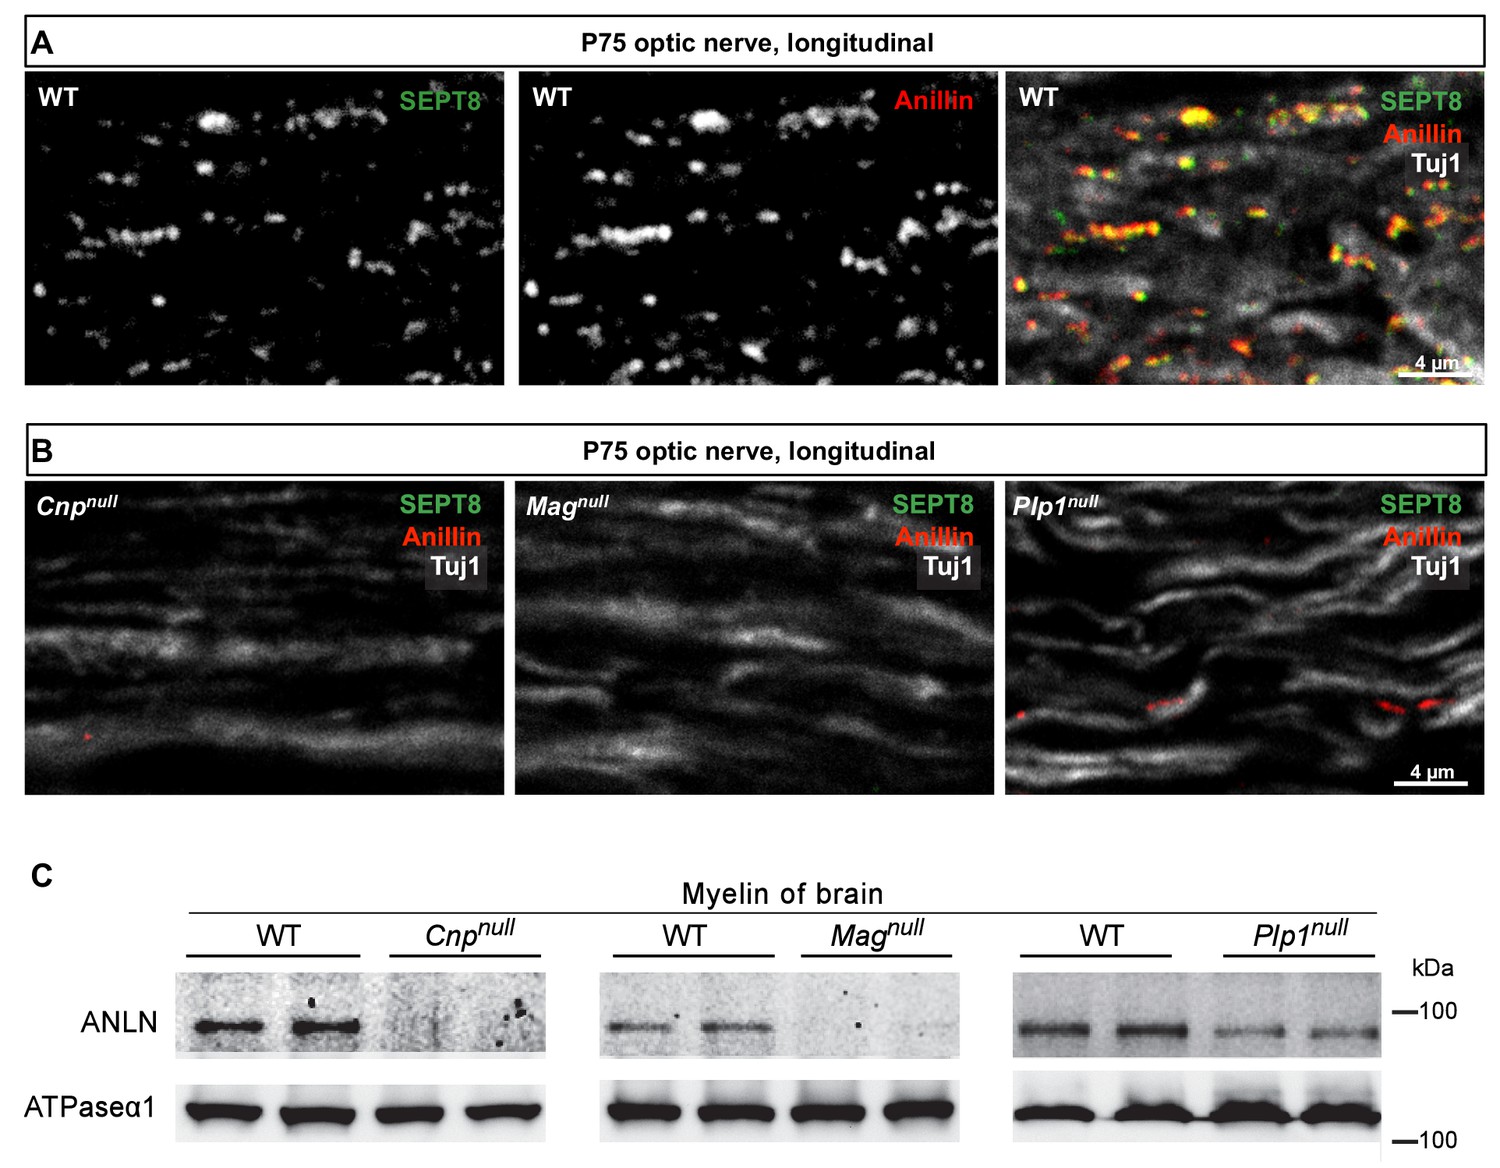
Anillin co-distributes with myelin septins.
(A) Confocal microscopy reveals proximity-labelling of SEPT8 (green) and anillin (red). The merge additionally shows the axonal marker Tuj1 (white). Longitudinally sectioned optic nerves of P75 WT mice are shown. Example is representative of three independent experiments. (B) Immunolabelling indicates diminishment of anillin (red) in myelinated fibre tracts of Cnpnull, Magnull, and Plp1null-mice similar to SEPT8 (green). The axonal marker TUJ1 (white) was co-labelled as a control. Longitudinally sectioned optic nerves of P75 mice are shown. Examples are representative of three independent experiments. (C) Immunoblotting of myelin purified from brains at P75 shows diminished abundance in Cnpnull, Magnull, and Plp1null-mice compared to WT controls. ATPase-alpha1 (ATP1A1) served as a control. Blot is representative of n=3 animals.
Figure 5
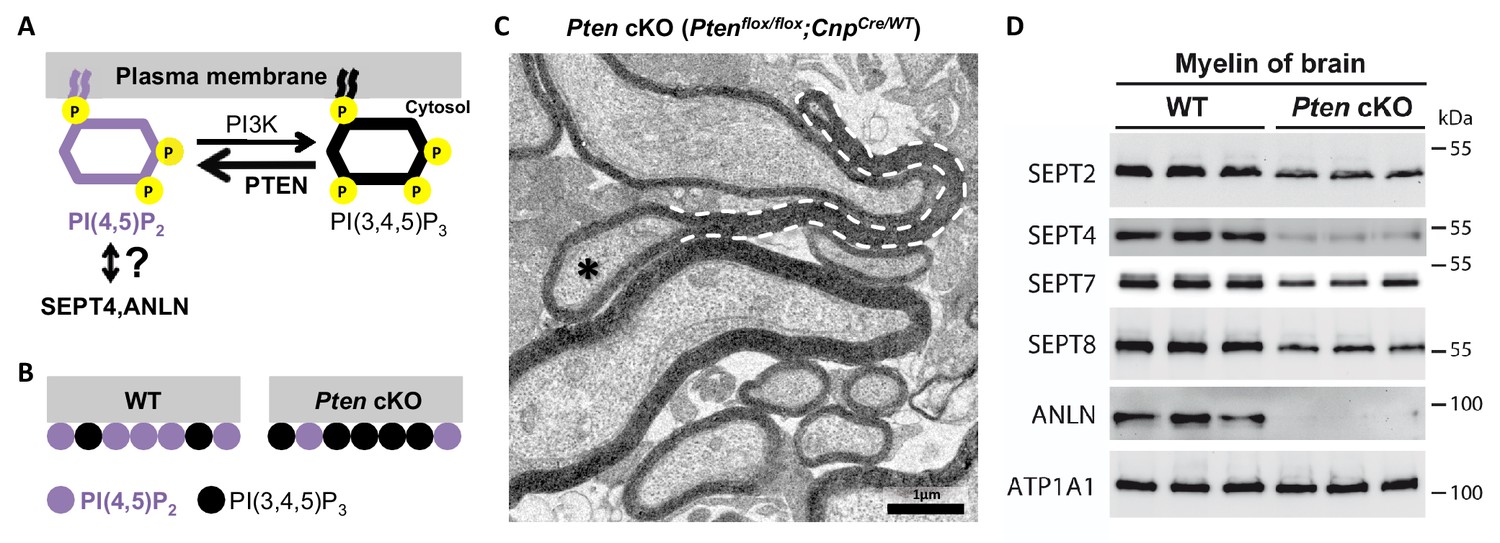
Membrane phosphoinositides mediate septin/anillin assembly in myelin.
(A) Scheme of the reaction catalyzed by the phosphatase PTEN, which converts PI(3,4,5)P3 into PI(4,5)P2. The reverse reaction is mediated by phosphatidylinositol-3-kinase (PI3K). Previous reports indicated that SEPT4 and ANLN can be recruited onto membranes via PI(4,5)P2, at least in vitro and in yeast, respectively; however an association has not yet been demonstrated in mice in vivo. (B) Ptenflox/flox;CnpCremice (Pten cKO) provide an established model in which the Cre-mediated deletion of Pten in myelinating cells causes a reduced abundance of PI(4,5)P2 (Goebbels et al., 2010). (C) Ptenflox/flox;CnpCremice display myelin outfoldings (Goebbels et al., 2010). The electron micrograph of a P75 optic nerve cross-section showing several myelinated axons. A myelin outfolding and the associated axon are labelled with stippled line and asterisk, respectively. Image is representative of 4 animals per genotype. (D) Immunoblotting of myelin purified from mouse brains at P75 indicates that the abundance of myelin septins and anillin is reduced when oligodendroglial PTEN is lacking in Ptenflox/flox;CnpCremice (Pten cKO). The blot is representative of 3 animals per genotype. ATP1A1 served as a control.
Figure 6 with 1 supplement
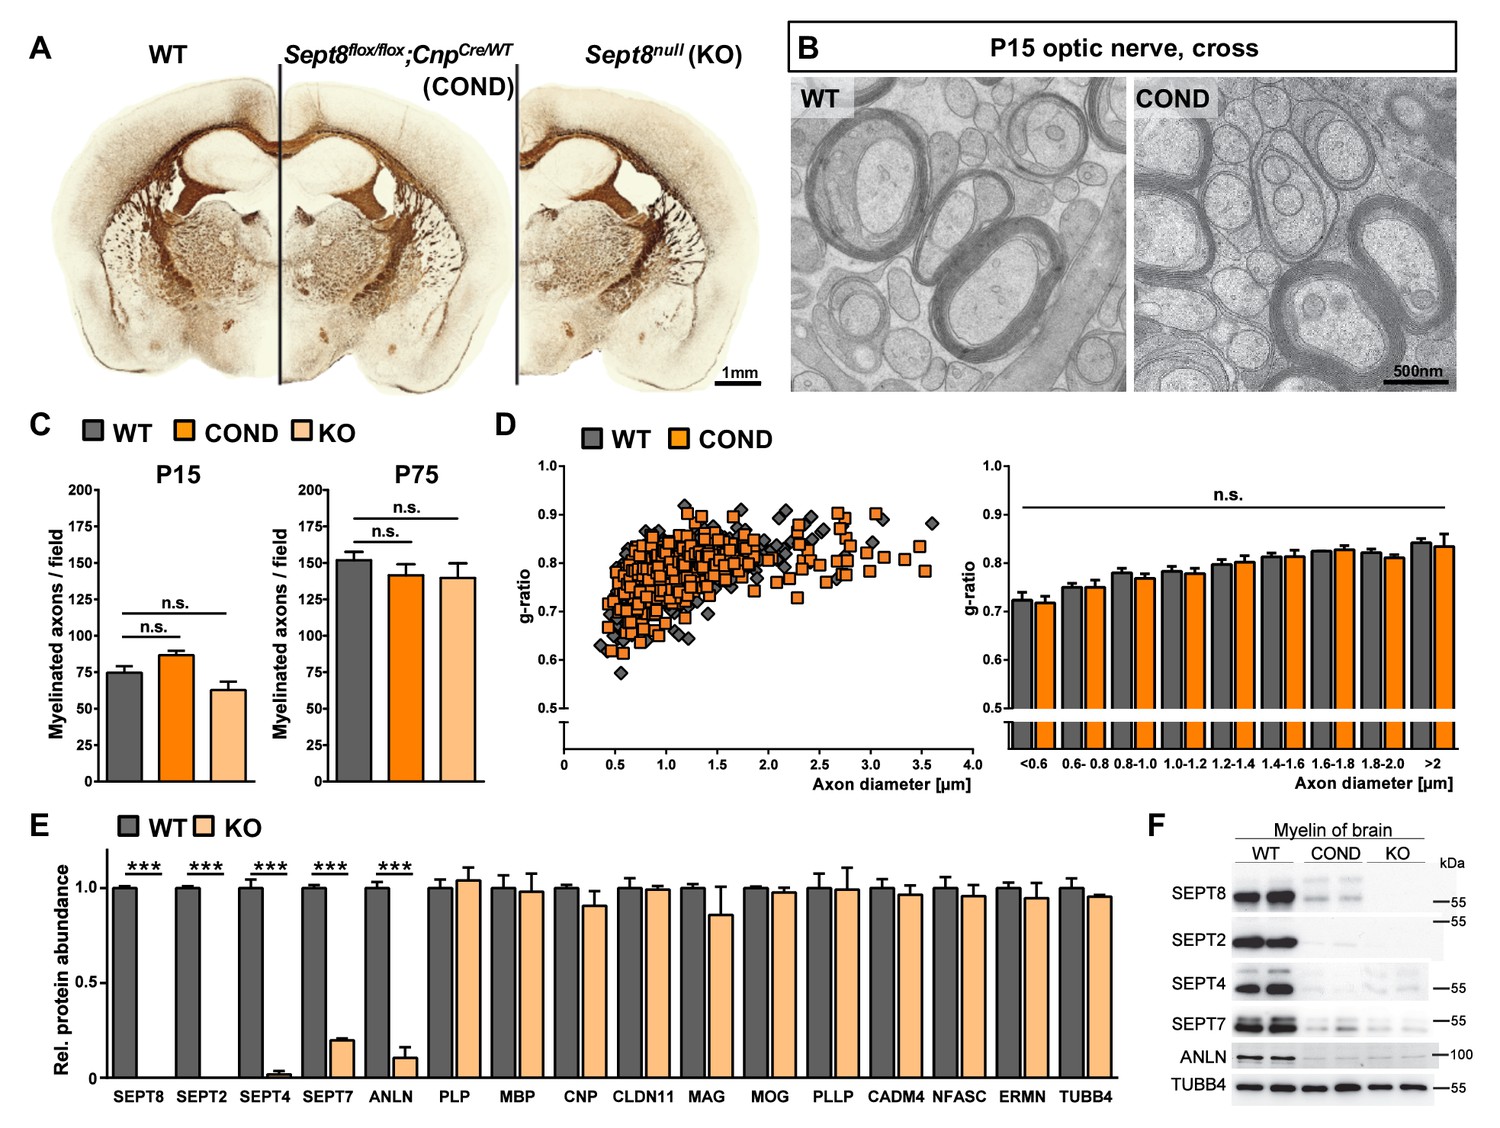
Myelination in mice lacking myelin-associated septins.
(A) Silver impregnation visualizes myelinated fibre tracts in mice lacking SEPT8 from myelinating cells (Sept8flox/flox;CnpCre/WT-mice; COND) or from all cells (Sept8null/null-mice; KO). Images are representative of three animals per genotype. See Figure 6—figure supplement 1 for generation and validation of Sept8 mutant mice. (B) Electron micrographs of cross-sectioned WT and Sept8flox/flox;CnpCre/WT-mice (COND) optic nerves fixed by high-pressure freezing indicate indistinguishable myelin ultrastructure at P15. Images are representative of three animals per genotype. (C) Quantitative evaluation of electron micrographs of optic nerves at P15 and P75 reveals a normal frequency of myelinated axons in Sept8-mutant mice (COND, KO). Mean +/ SEM. n=5 animals per condition; not significant (n.s.) according to one-way ANOVA with Tukey’s post test; see Materials and methods section for p-values. (D) g-ratio analysis of electron micrographs of optic nerves at P75 indicates normal myelin sheath thickness in Sept8flox/flox;CnpCre/WT-mice (COND). Mean +/ SEM. Not significant (n.s.) according to two-way ANOVA (p=0.7823). (E) Differential myelin proteome analysis reveals that septins (SEPT2, SEPT4, SEPT7) and anillin (ANLN) are diminished in myelin purified from Sept8null/null-mice (KO) at P75, whereas classical myelin proteins are not affected. Mean +/ SEM. n=3 animals per genotype; two-tailed unpaired t-test ***p<0.001. See Figure 1—source data 1 for the entire dataset. (F) Immunoblotting validates the lack of myelin septins and anillin (ANLN) in myelin purified from the brains of Sept8-mutant mice (COND, KO). Tubulin-beta4 (TUBB4) was detected as a control. The blot is representative of three experiments.
Figure 6—figure supplement 1
Generation of mice lacking expression of SEPT8.
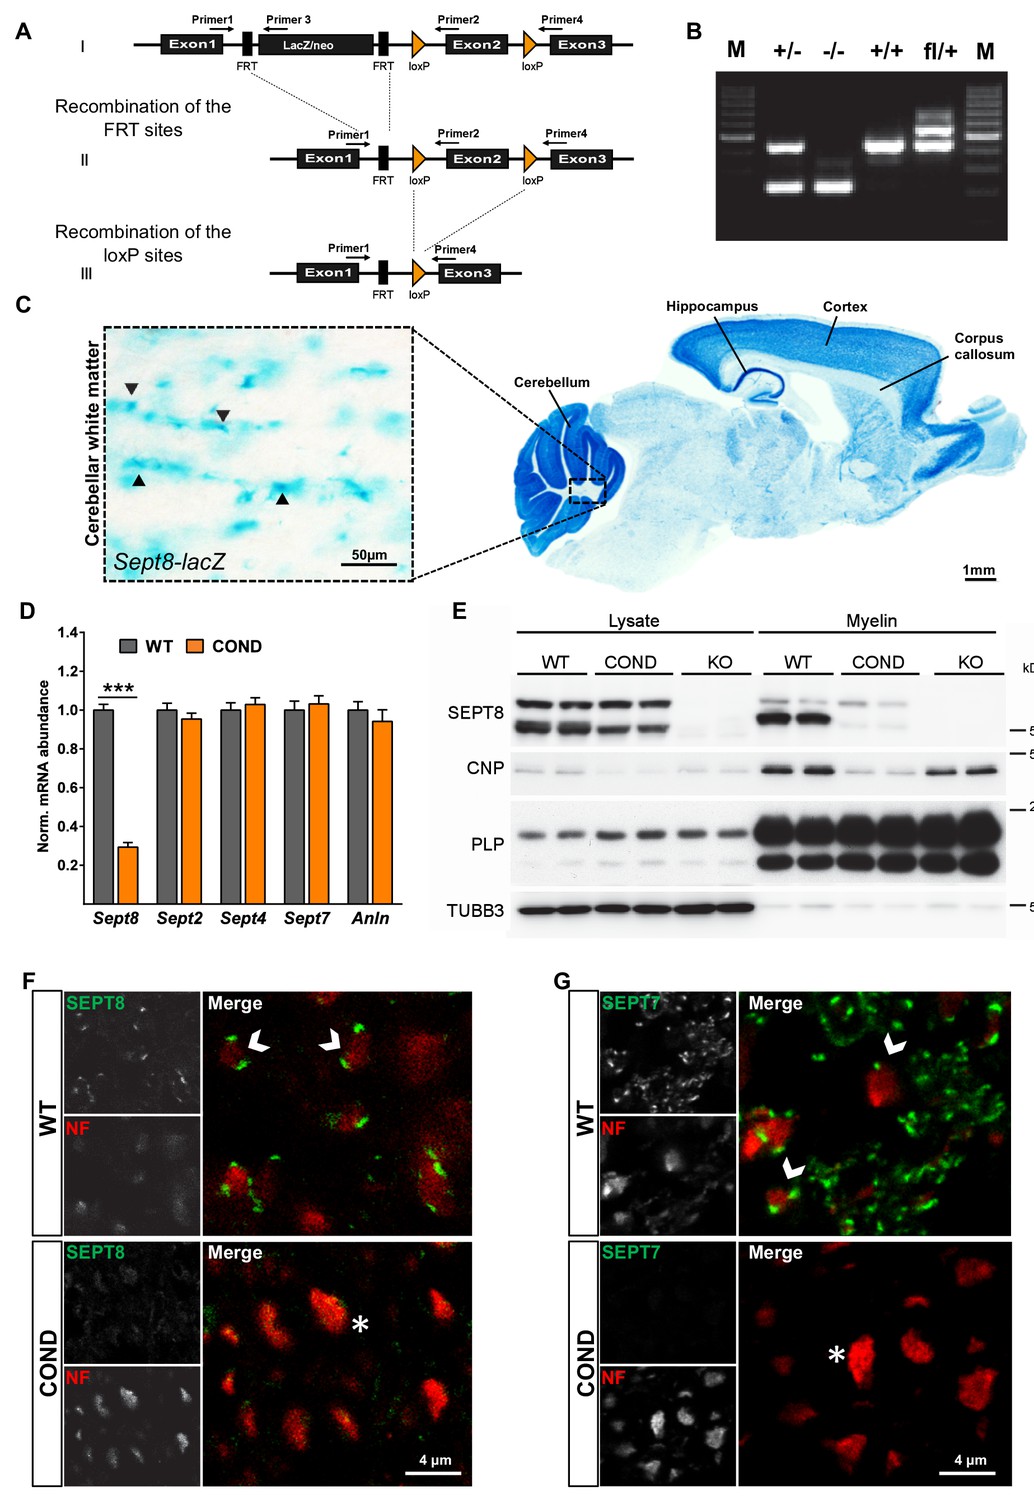
(A) Scheme of the engineered Sept8-allele before and after recombination (see Materials and methods section for details). (B) Genotyping PCR identifying the indicated alleles. (C) Histochemistry to visualize Sept8 gene activity in Sept8lacZ/WT mice. Shown is a sagitally sectioned brain (to the right) and enlarged the white matter (inset). Note strong labeling in cortex, hippocampus, and cerebellum, suggesting gene activity in neurons. Also note labeling in the white matter, in agreement with gene activity in oligodendrocytes. Image representative of 3 animals. (D) qRT-PCR to determine the abundance of myelin septin mRNAs in the white matter (corpus callosum) of wild-type (WT) and Sept8flox/flox;CnpCre/WT (COND) mice. Note that Sept2, Sept4, and Sept7 mRNAs were unaltered in abundance in COND compared to WT mice. Sept8-mRNA in COND probably represents gene activity in non-oligodendroglial cells. 4 mice per genotype; unpaired two-tailed t-test; Sept8 p<0.001, Sept2 p=0.36, Sept4 p=0.59, Sept7 p=0.63, Anln p=0.46. (E) Immunoblot analysis of brain lysates and myelin purified from wild-type (WT), Sept8flox/flox;CnpCre/WT (COND), and Sept8null/null (KO) mice. Note that none of the three isoforms of SEPT8 (arising from alternative splicing) is detectable in KO mice, whereas in COND mice only the single myelin-enriched isoform is undetectable. SEPT8-signal in COND mice represents non-oligodendroglial expression. Myelin markers (CNP, PLP) and axonal beta3-tubulin (TUBB3) were detected as controls. (F,G) Immunohistochemical detection of SEPT8 (E) or SEPT7 (F) (green) together with the axonal marker neurofilament (NF, red) on cross sectioned spinal cords of wild-type (WT) and Sept8flox/flox;CnpCre/WT (COND) mice at P75. Note that punctate septin labeling was readily detectable adjacent to NF labeling in WT in agreement with localization in the adaxonal myelin compartment but not detected in COND. Representative images of three experiments.
Figure 7 with 2 supplements
Lack of myelin septins causes myelin outfoldings and decelerated nerve conduction.
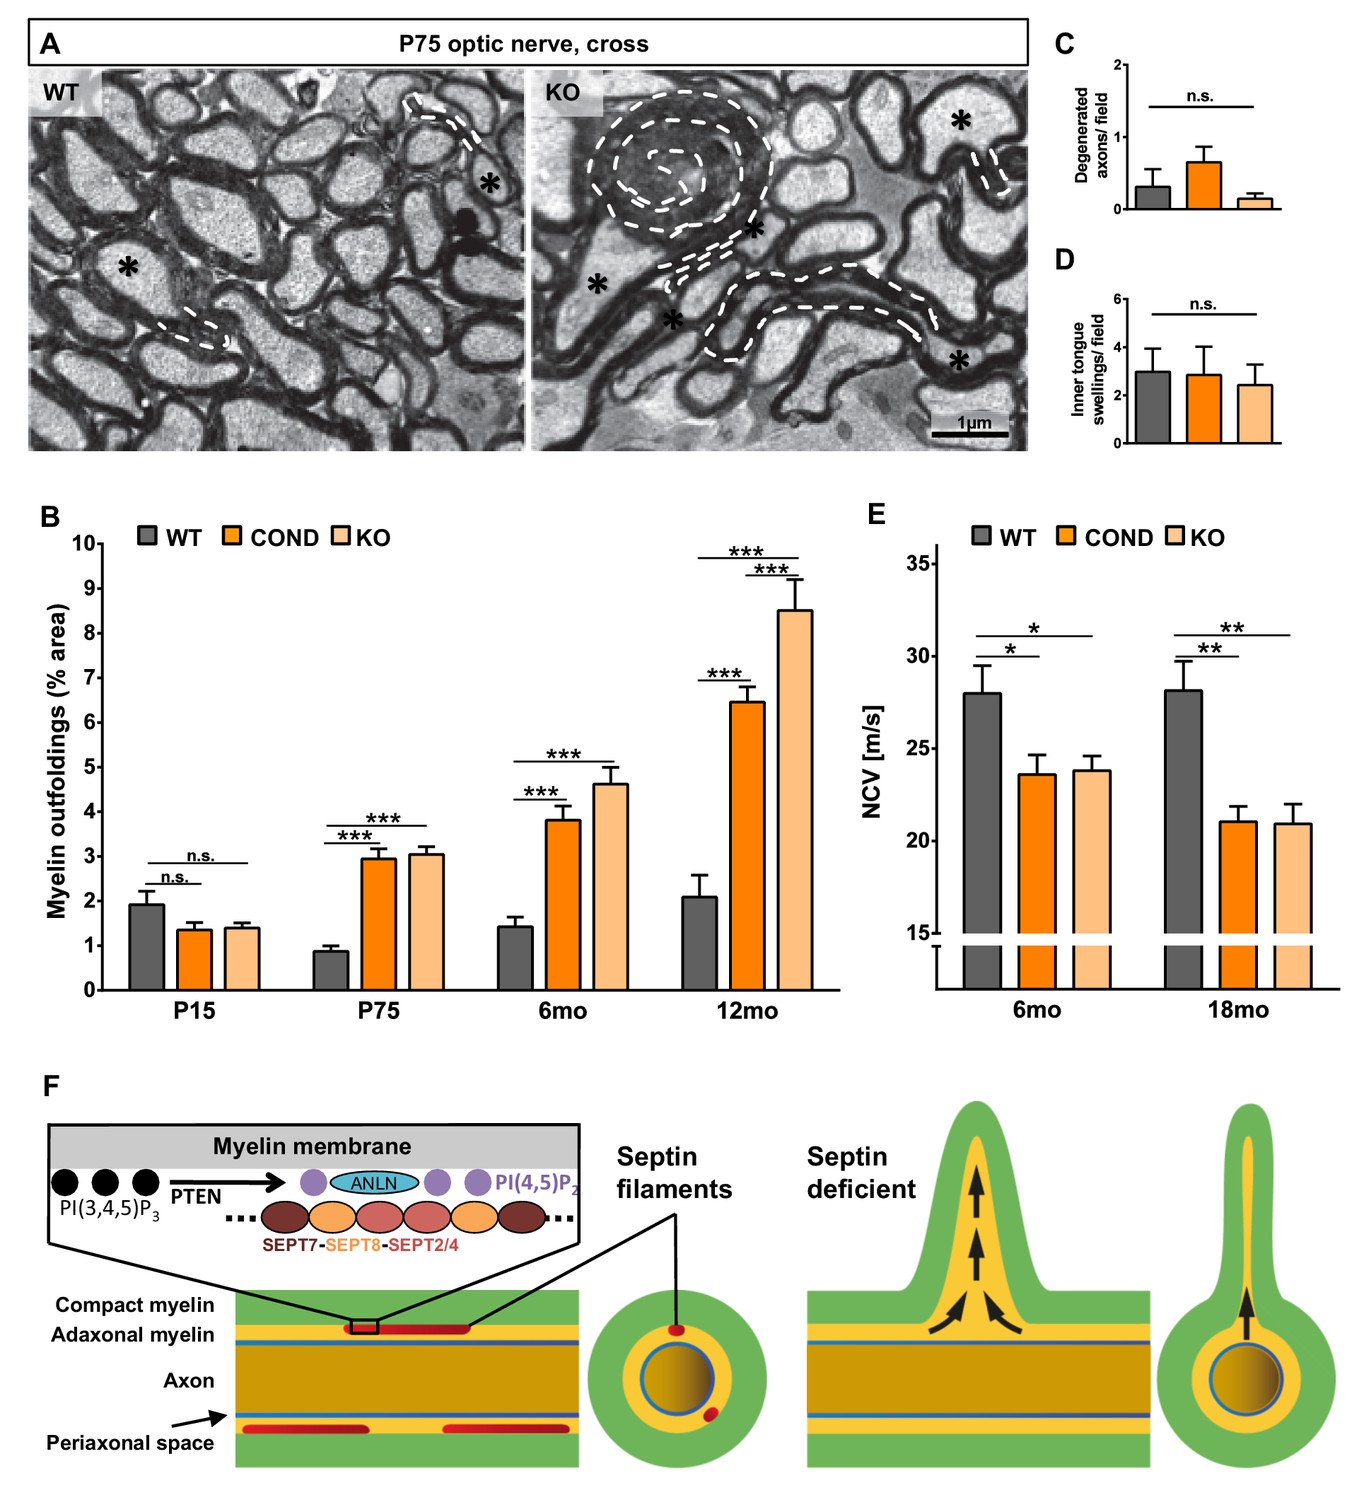
(A) Electron micrographs of optic nerves exemplify myelin outfoldings at P75. Stippled lines highlight myelin outfoldings; associated axons are marked with asterisks. (B) Quantitative evaluation of optic nerve electron micrographs reveals progressive myelin outfoldings in adult Sept8-mutant mice (COND, KO). Mean +/ SEM. n=3–6 animals per condition; significant according to two-way ANOVA for the effects of genotype (p<0.0001) and age (p<0.0001); see Materials and methods section for p-values of Tukey’s post-test. (C–D) Quantitative evaluation of electron micrographs of optic nerves at age P75 indicates the absence in Sept8-mutant mice (COND, KO) of other myelin-related pathology such as degenerated axons (C) or inner tongue swellings (D). Mean +/ SEM. n=3 animals; not significant (n.s.) according to one-way ANOVA; degenerated axons p=0.25 (C), inner tongue swellings p=0.92 (D). (E) Electrophysiological measurement reveals decelerated nerve conduction in spinal cords of Sept8-mutant mice (COND, KO) compared to controls at 6 and 18 months of age. Mean +/ SEM. n=4–9 animals per genotype and age; two-way ANOVA shows the significance for genotype-dependency of the effect (p<0.0001); for p-values of Tukey’s post-test see Materials and methods section. (F) Hypothetical model of pathological outfoldings of compact myelin (green) upon loss of myelin septins. Shown are longitudinal and cross-sectional views. Arrows indicate hydrostatic outward pressure and cytoplasm flow in adaxonal myelin (orange) unless stabilized by septin filaments (red). Inset, the septin/anillin scaffold is assembled from core-hexamers in dependence of PI(4,5)P2-levels.
Figure 7—figure supplement 1
SEPT8 deficiency does not induce astrogliosis, microgliosis or altered structure or density of the nodes of Ranvier.
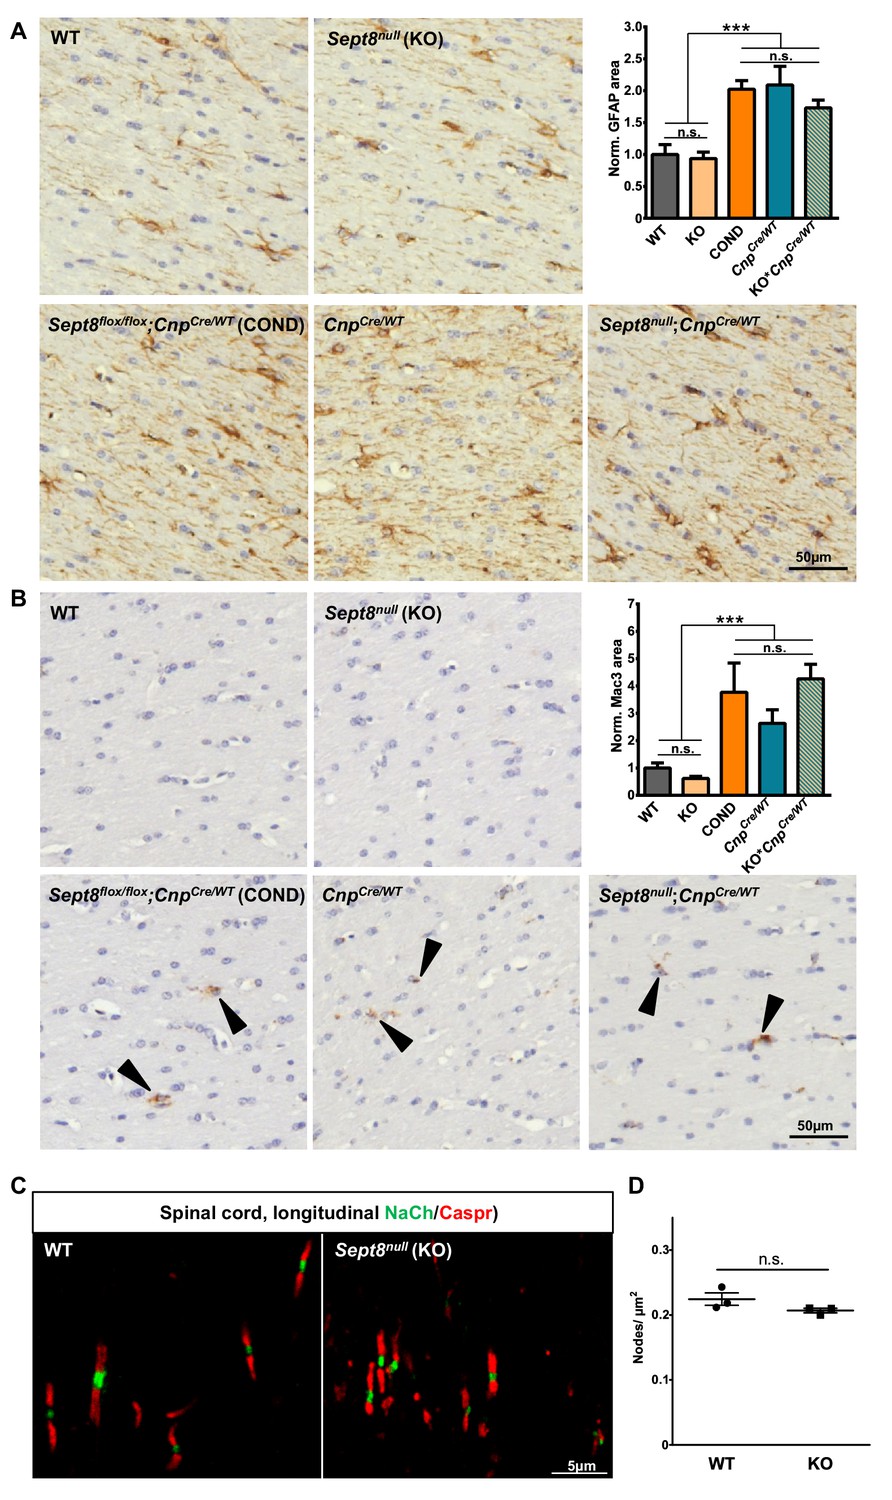
(A–B) Immunohistochemical analysis of GFAP-immunopositivity (B) and MAC3-immunopositivity (B) in the white matter (hippocampal fimbria) of wild-type (WT), Sept8null/null(KO), and Sept8flox/flox;CnpCre/WT (COND) mice at one year of age. Note the similarity of immunolabeling in KO compared to WT mice. Mild astrogliosis and microgliosis indicated by enhanced GFAP-immunopositivity and MAC3-immunopositivity was found in COND mice, which is independent of the Sept8-allele. Instead this is attributable to the heterozygosity of the Cnp gene introduced by the utilized Cre-driver line. This is indicated by similar GFAP-immunopositivity and MAC3-immunopositivity in COND mice compared to CnpCre/WT and Sept8null/null;CnpCre/WT (KO;CnpCre/WT) mice. See Materials and methods section for the procedure of quantification of the relative area of immunopositivity. n=5–7 animals per genotype; one-way ANOVA with Tukey’s multiple comparison test; p-values: (A) ANOVA p<0.001 post tests: WT vs. KO p=0.999, WT vs. COND p=0.001, WT vs. CnpCre/WT p<0.001, WT vs. KO;CnpCre/WT p=0.0352, KO vs. COND p<0.001, KO vs. CnpCre/WT p<0.001, KO vs. KO; CnpCre/WT p=0.025, COND vs. CnpCre/WT p=0.999, COND vs. KO;CnpCre/WT p=0.75, CnpCre/WT vs. KO; CnpCre/WT p=0.622, (B) ANOVA p<0.001 post tests: WT vs. KO p=0.9917, WT vs. COND p=0.0323, WT vs. CnpCre/WT p=0.4072, WT vs. KO; CnpCre/WT p=0.0091, KO vs. COND p=0.0079, KO vs. CnpCre/WT p=0.18, KO vs. KO; CnpCre/WT p=0.002, COND vs. CnpCre/WT p=0.70, COND vs. KO;CnpCre/WT p=0.98, CnpCre/WT vs. KO;CnpCre/WT p=0.37. (C–D) Immunohistochemical analysis of a marker of the nodes of Ranvier (sodium channels; NaCh, green) and a paranodal marker (CASPR) on longitudinal spinal cord sections of wild-type (WT) and Sept8null/null (KO) mice. Note that the node organization is well preserved and that the density of nodes is unaltered according to unpaired two-tailed t-test; n=3 animals per genotype; p=0.16.
Figure 7—figure supplement 2
Dynamics of septin filament degradation in myelin and emergence of myelin outfoldings in adult mice.
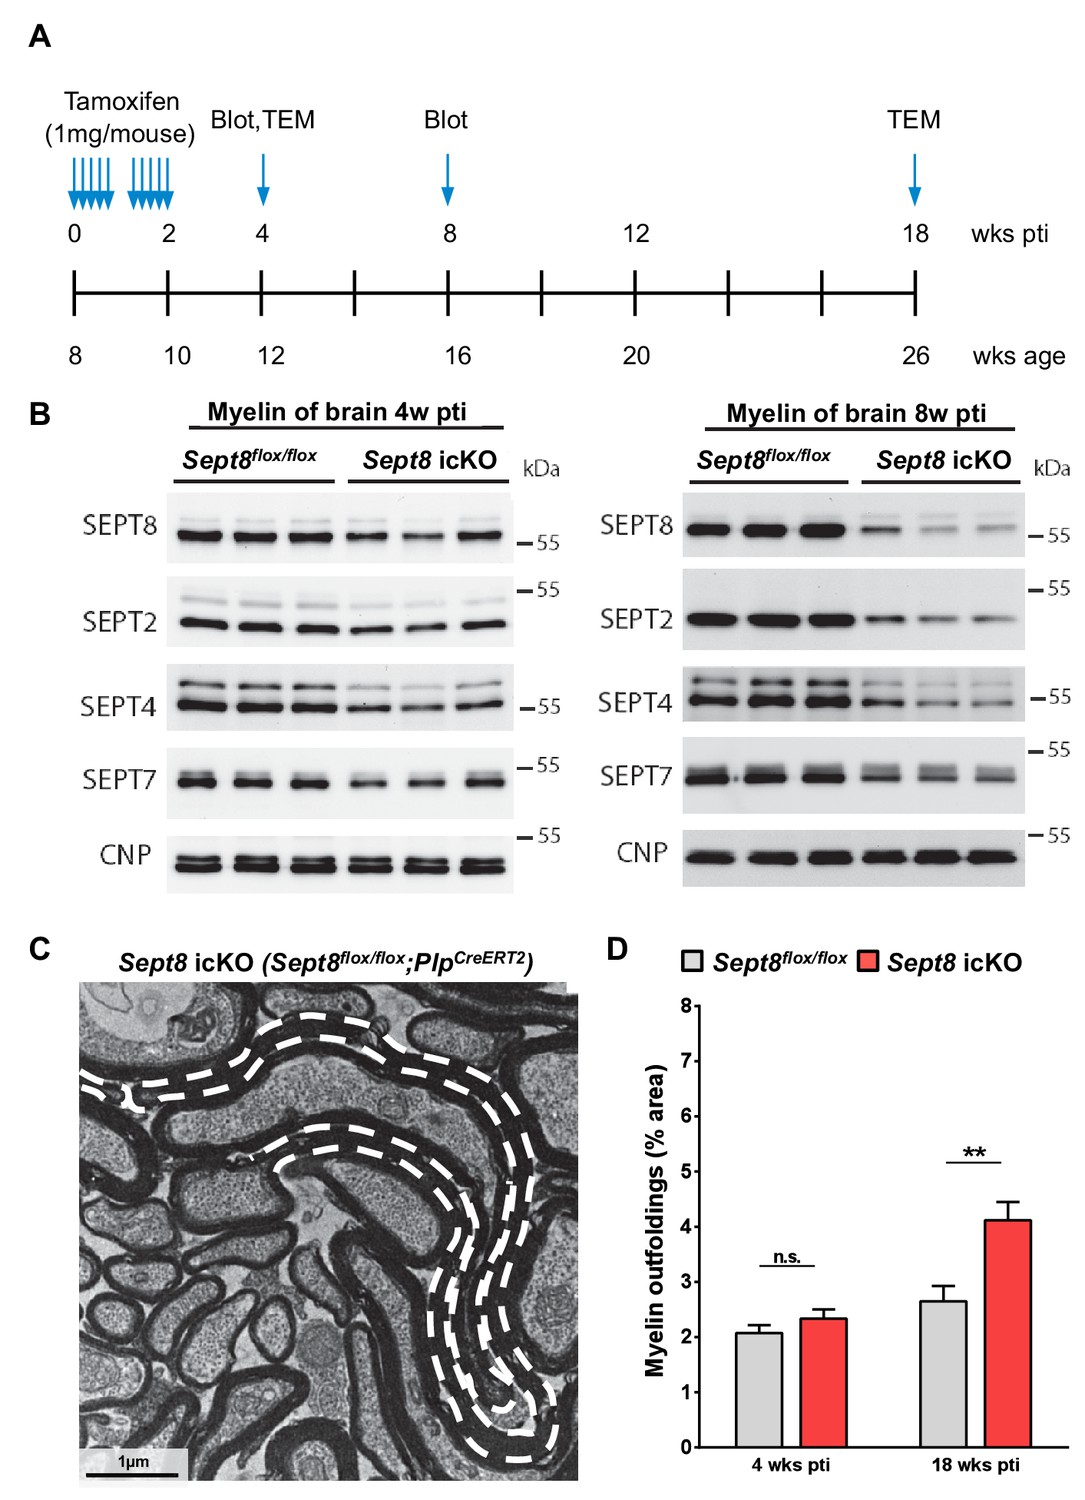
(A) Experimental scheme of Tamoxifen injection into adult Sept8flox/flox;PlpCre-ERT2 and Sept8flox/flox control mice, immunoblotting, and transmission electron microscopic analysis (TEM). wks pti, weeks post Tamoxifen injection. (B) Immunoblotting indicates that the abundance of myelin septins (SEPT2, SEPT4, SEPT7, SEPT8) is about halved in myelin purified from the brains of Sept8flox/flox;PlpCre-ERT2 (Sept8 icKO) mice 4 weeks pti and greatly reduced 8 weeks pti. (C) Electron micrograph showing several myelinated axons in the cross-sectioned optic nerve of a Sept8flox/flox;PlpCre-ERT2 mouse 18 weeks pti. A myelin outfolding is highlighted (stippled line). Image is representative of 4 animals as quantified in Figure 7—figure supplement 1D. (D) Quantitative evaluation of optic nerve electron micrographs reveals myelin outfoldings in Sept8flox/flox;PlpCre-ERT2 (Sept8 icKO) mice 18 weeks pti. Mean ± SEM; n=3–4 animals per condition; significant for the effect of genotype 18 weeks pti (**p=0.0068) and not significant (n.s.) 4 weeks pti (p=0.90) according to two-way ANOVA. p-values according to Tukey’s post-test.
Videos
Video 1
3-dimensional reconstruction of a myelin septin filament (SEPT8 immunolabelling, green) alongside an axon (neurofilament immunolabelling, red) Related to Figure 2.
https://doi.org/10.7554/eLife.17119.008Download links
A two-part list of links to download the article, or parts of the article, in various formats.
Downloads (link to download the article as PDF)
Open citations (links to open the citations from this article in various online reference manager services)
Cite this article (links to download the citations from this article in formats compatible with various reference manager tools)
Septin/anillin filaments scaffold central nervous system myelin to accelerate nerve conduction
eLife 5:e17119.
https://doi.org/10.7554/eLife.17119


