A specific role for serotonin in overcoming effort cost
- Institut du Cerveau et de la Moelle épinière, Groupe Hospitalier Pitié-Salpêtrière, France
- INSERM UMRS 1127, CNRS UMR 7225, Université Pierre et Marie Curie (UPMC-P6), France
- INSERM U992, Institut d'Imagerie Biomédicale, Direction de la recherche fondamentale, Commissariat à l'énergie atomique et aux énergies alternatives, France
- University of Oxford, United Kingdom
- The University of Manchester, United Kingdom
- Service de Psychiatrie, France
- Université Paris Descartes, Sorbonne Paris Cité, France
- INSERM U894, Université Paris Descartes, Sorbonne Paris Cité, France
- Institut Pasteur, France
Figures
Figure 1

Task design and behavioral performance.
(A) The screenshots depict a trial as it was presented to subjects.Subjects were free to allocate their effort as they wished over the 30s corresponding to the trial duration. They were instructed that their monetary payoff would be proportional to both the monetary incentive and the effort duration, i.e. the time spent squeezing a handgrip harder than a target force level, which varied with task difficulty. Subjects were provided with on-line feedback on the payoff accumulated in the trial (score on the top) and on the instantaneous pressure exerted on the grip (fluid level in the thermometer). The force time series of an example trial is shown below the screenshots, revealing 3 effort periods, with rewarded effort (force above target) plotted in black (not gray). Two factors were manipulated across trials: (i) the incentive level, shown as a coin image (1, 2 or 5p) and (ii) the difficulty level, corresponding to the same white bar in the thermometer reached with different target force levels (70%, 80% or 90% of the maximal force). The last screen summarized the payoff cumulated over preceding trials. (B) Using a double-blind procedure, healthy subjects were assigned to one of the two treatment groups, corresponding to a daily intake of either placebo or escitalopram (10 mg during the initial phase, 20 mg during the intermediate and late phase) during 9 weeks. Each subject completed the effort allocation task three times at distinct treatment phases (initial, intermediate and late). Numbers of subjects and visits correspond to data sets included in the analysis after compliance and quality checks. (C) The three left-most graphs show task performance (as reflected in monetary payoff) sorted by treatment group (black: placebo; gray: escitalopram) and time since treatment onset. Statistical significance was assessed with two-sample, two-sided t-tests. On the right-most plot, payoff was averaged over visits at the subject level. Statistical significance was assessed with ANOVAs including treatments as between-subject factors and test phase (initial, intermediate or late) as a within-subject factor. *p<0.05; **p<0.005. Error bars indicate Student's 95% confidence intervals.
-
Figure 1—source data 1
The MATLAB data file contains the payoff earned by each participant at each visit, in the placebo and escitalopram groups.
- https://doi.org/10.7554/eLife.17282.004
Figure 2
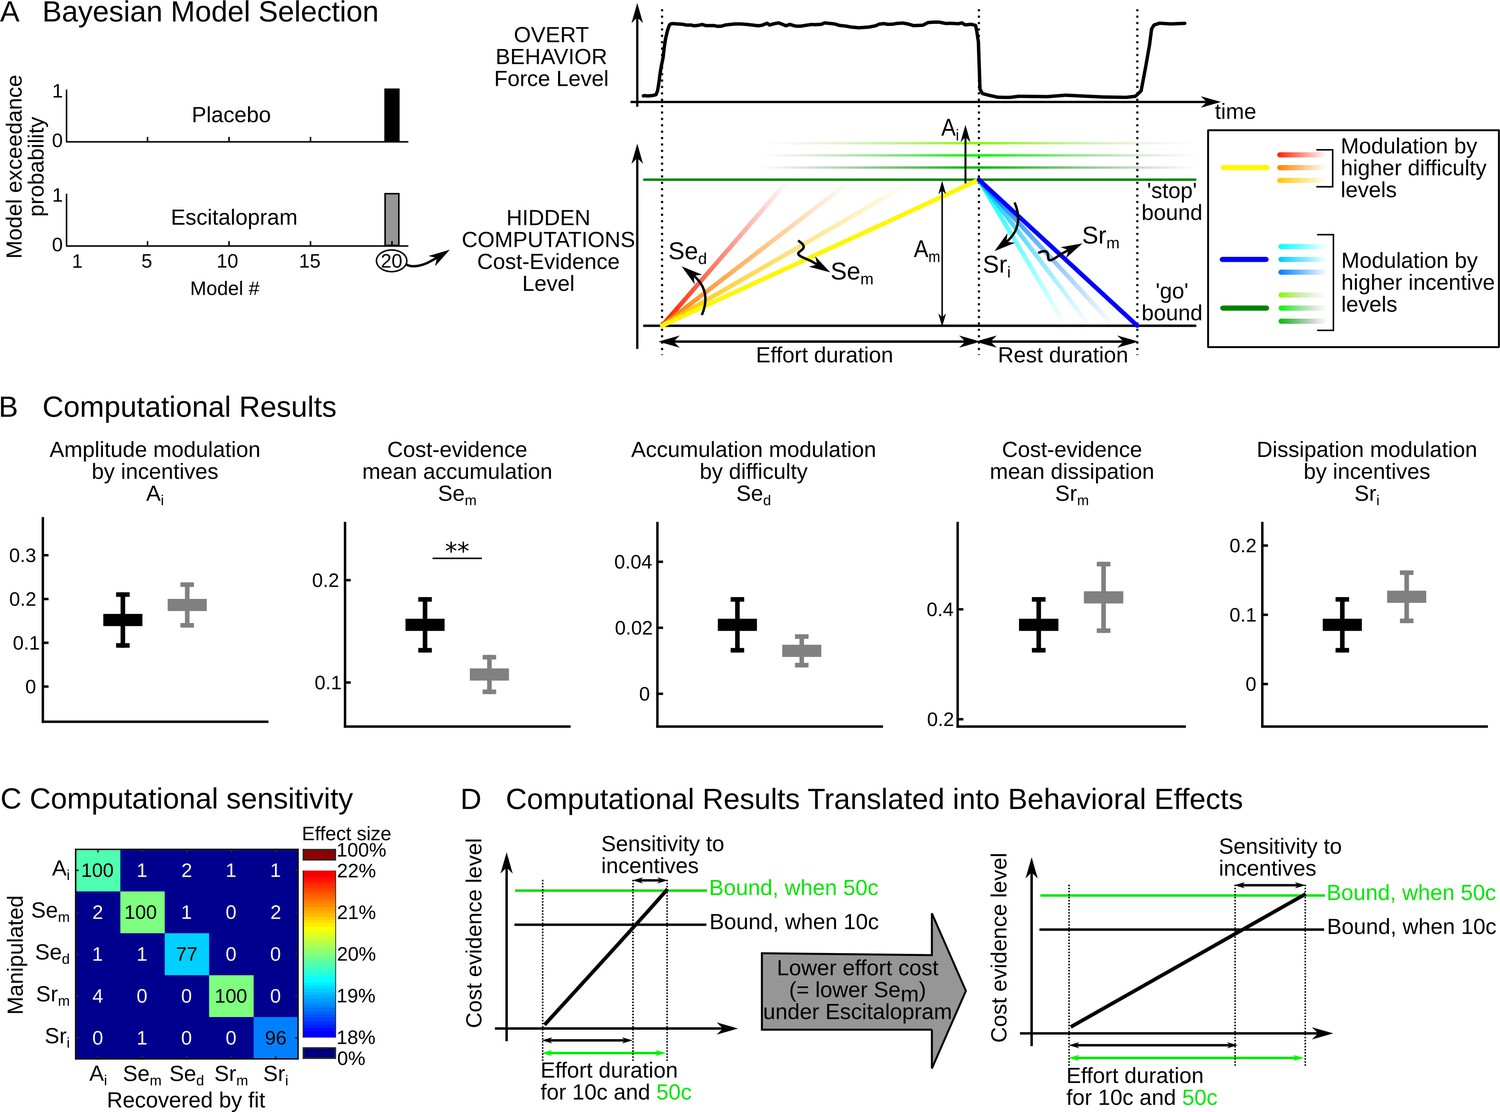
Computational results.
(A) The cost-evidence accumulation model assumes that effort and rest durations are respectively determined by the accumulation (mean slope Sem) and dissipation (mean slope Srm) of cost evidence between bounds (mean amplitude Am). Possible modulations of these parameters by incentive and difficulty levels were implemented in 20 distinct models. In the best model identified (#20) by Bayesian selection, increasing effort difficulty shortens effort duration by steepening the accumulation slope (a parametric effect controlled by parameter Sed and illustrated with colors from yellow to red). Increasing the incentive level has two effects: first, it shortens rest duration by speeding up the dissipation (parametric effect of Sri, illustrated by colors from dark to light blue); second, it lengthens effort duration by pushing back the bounds (parametric effect of Ai, illustrated by green scaling). (B) Plots show inter-subject means and Student's 95% confidence intervals obtained for the fitted values of model parameters (which were averaged over visits at the subject level). To facilitate visual comparison, scales and offsets were adjusted so that mean and error bars are visually equal across plots in the placebo group. Statistical significance corresponds to ANOVAs including treatment group (escitalopram vs. placebo) as a between-subject factor and treatment phase as a within-subject factor (initial, intermediate or late); **p<0.005. (C) Data in the placebo group served as a baseline to simulate effort and rest durations after imposing a 20% increase in computational parameters. In the table, each row corresponds to a simulated change in one single parameter. Colors denote the effect sizes recovered by model fitting for each parameter, as percent of change compared to baseline. Numbers indicate the percentage of 'hit' (on the diagonal) and 'false alarm' (off-diagonal) in detecting a significant change in parameter values with a paired t-test thresholded at p<0.01. (D) The graph illustrates why the effect of escitalopram, characterized at the computational level as a reduced accumulation slope of cost-evidence during effort (Sem), should translate at the behavioral level into both a longer effort duration and an increased sensitivity of effort duration to incentive level.
-
Figure 2—source data 1
The MATLAB data file contains the fitted value of parameters Ai, Sem, Sed, Srm, Sri (see Materials and methods, Equation 2), for each participant at each visit, in the placebo and escitalopram groups.
- https://doi.org/10.7554/eLife.17282.006
Figure 3
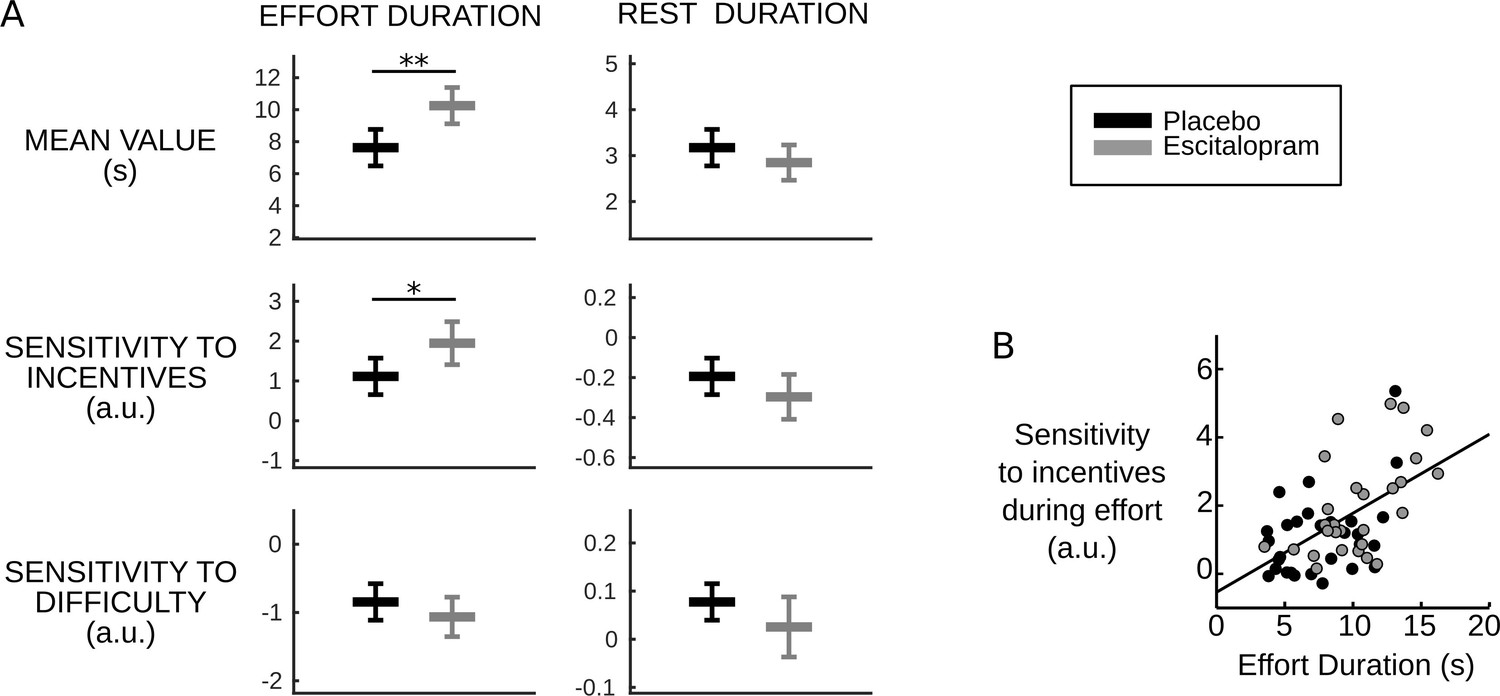
Behavioral results.
(A) Plots show inter-subject means and Student's 95% confidence intervals obtained from linear regression.Regression coefficients were averaged over visits at the subject level. To facilitate visual comparison, scales and offsets were adjusted so that mean and s.e.m. are visually equal across plots in the placebo group. Statistical significance corresponds to ANOVAs including treatment group (escitalopram vs. placebo) as a between-subject factor and treatment phase as a within-subject factor (initial, intermediate or late); *p<0.05, **p<0.005. (B) As predicted by the cost-evidence accumulation model, effort duration and its sensitivity to incentive level are correlated across subjects (one dot corresponds to one subject; values were averaged across visits for each subject). The line shows the linear regression fit obtained when pooling the two treatment groups (ρ56=0.55, p<10–5).
-
Figure 3—source data 1
The MATLAB data file contains a description of the behavior obtained by linear regressions for each participant at each visit, in the placebo and escitalopram groups.
The regression weights correspond to the mean effort duration and mean rest duration, and their modulation by incentive levels and difficulty levels.
- https://doi.org/10.7554/eLife.17282.011
Tables
Table 1
Details on participants N corresponds to the number of subjects per treatment type and phase. A few datasets were not available due technical problems and late withdrawals. Based on criteria specific to the present task (and not to the clinical trial), some subjects were excluded from the analysis ('excluded'). We report the age and sex of participants included in the analysis and the exact time of their test since the treatment onset.
| Treatment type | Treatment phase | N not available | N excluded | N after exclusion | Sex (Male / female) | Age (years) ± SD of included subjects | Time since treatment onset (days) ± SD for included subjects |
|---|---|---|---|---|---|---|---|
Placebo | Initial | 0 | 5 | 27 | 14/13 | 23.4 ± 4.35 | 3.0 ± 0.68 |
Placebo | Intermediate | 0 | 6 | 26 | 14/12 | 23.2 ± 4.33 | 13.8 ± 1.13 |
Placebo | Late | 0 | 4 | 28 | 15/13 | 23.4 ± 4.27 | 54.7 ± 4.98 |
Escitalopram | Initial | 1 | 8 | 23 | 11/12 | 24.5 ± 4.71 | 3.1 ± 0.63 |
Escitalopram | Intermediate | 1 | 6 | 25 | 12/13 | 24.5 ± 4.51 | 14.0 ± 0.87 |
Escitalopram | Late | 2 | 6 | 24 | 10/14 | 24.6 ± 4.61 | 55.3 ± 4.69 |
Table 2
Treatment effect on computational parameters and behavioral measures.
All numbers are p-values obtained from ANOVAs. p-values lower than 0.05/5=0.01 (computational parameters) and 0.05/6=0.008 (behavioral measures) appears in bold to show significant effects that survive correction for multiple comparisons.
| Variable | Treatment | Visit | Interaction |
|---|---|---|---|
Ai | 0.388 | 0.197 | 0.406 |
Sem | 0.003 | 0.039 | 0.260 |
Sed | 0.0797 | 0.543 | 0.137 |
Srm | 0.186 | 0.778 | 0.612 |
Sri | 0.130 | 0.196 | 0.557 |
Effort duration – mean | 0.002 | 0.199 | 0.875 |
Effort duration – sensitivity to incentive | 0.023 | 0.187 | 0.115 |
Effort duration – sensitivity to difficulty | 0.247 | 0.813 | 0.318 |
Rest duration – mean | 0.213 | 0.482 | 0.531 |
Rest duration – sensitivity to incentive | 0.162 | 0.937 | 0.807 |
Rest duration – sensitivity to difficulty | 0.115 | 0.423 | 0.681 |
Table 3
Model comparison assessing the specificity of treatment effect.
Data in the escitalopram group were fitted with the cost-evidence accumulation model. The parameters were fixed to the values fitted onto the placebo group, excepted when a modulation was permitted. The first row contains models that permit the modulation of one single parameter, whereas the remaining rows correspond to models that permit a combination of two modulations. Each cell gives log Bayes Factor (i.e. log model evidence) relative to the null model. Higher values denote better models.
Sem | Sed | Srm | Sri | Ai | |
|---|---|---|---|---|---|
Only one modulation | 173.6 | 19.9 | −4.2 | −3.8 | 3.7 |
Also includes Sem | 176.6 | 169.6 | 169.7 | 170.7 | |
Also includes Sed | 15.7 | 16.1 | 21.7 | ||
Also includes Srm | −7.3 | −1.1 | |||
Also includes Sri | 1.2 |
Additional files
-
Reporting standards 1
Consort 2010 checklist.
- https://doi.org/10.7554/eLife.17282.012
-
Reporting standards 2
Consort 2010 flow diagram.
- https://doi.org/10.7554/eLife.17282.013
Download links
A two-part list of links to download the article, or parts of the article, in various formats.
Downloads (link to download the article as PDF)
Open citations (links to open the citations from this article in various online reference manager services)
Cite this article (links to download the citations from this article in formats compatible with various reference manager tools)
A specific role for serotonin in overcoming effort cost
eLife 5:e17282.
https://doi.org/10.7554/eLife.17282


