Functional CRISPR screening identifies the ufmylation pathway as a regulator of SQSTM1/p62
- Novartis Institutes for BioMedical Research, United States
- Novartis Institutes for BioMedical Research, Switzerland
- Massachusetts General Hospital, Harvard Medical School, United States
Figures
Figure 1 with 1 supplement
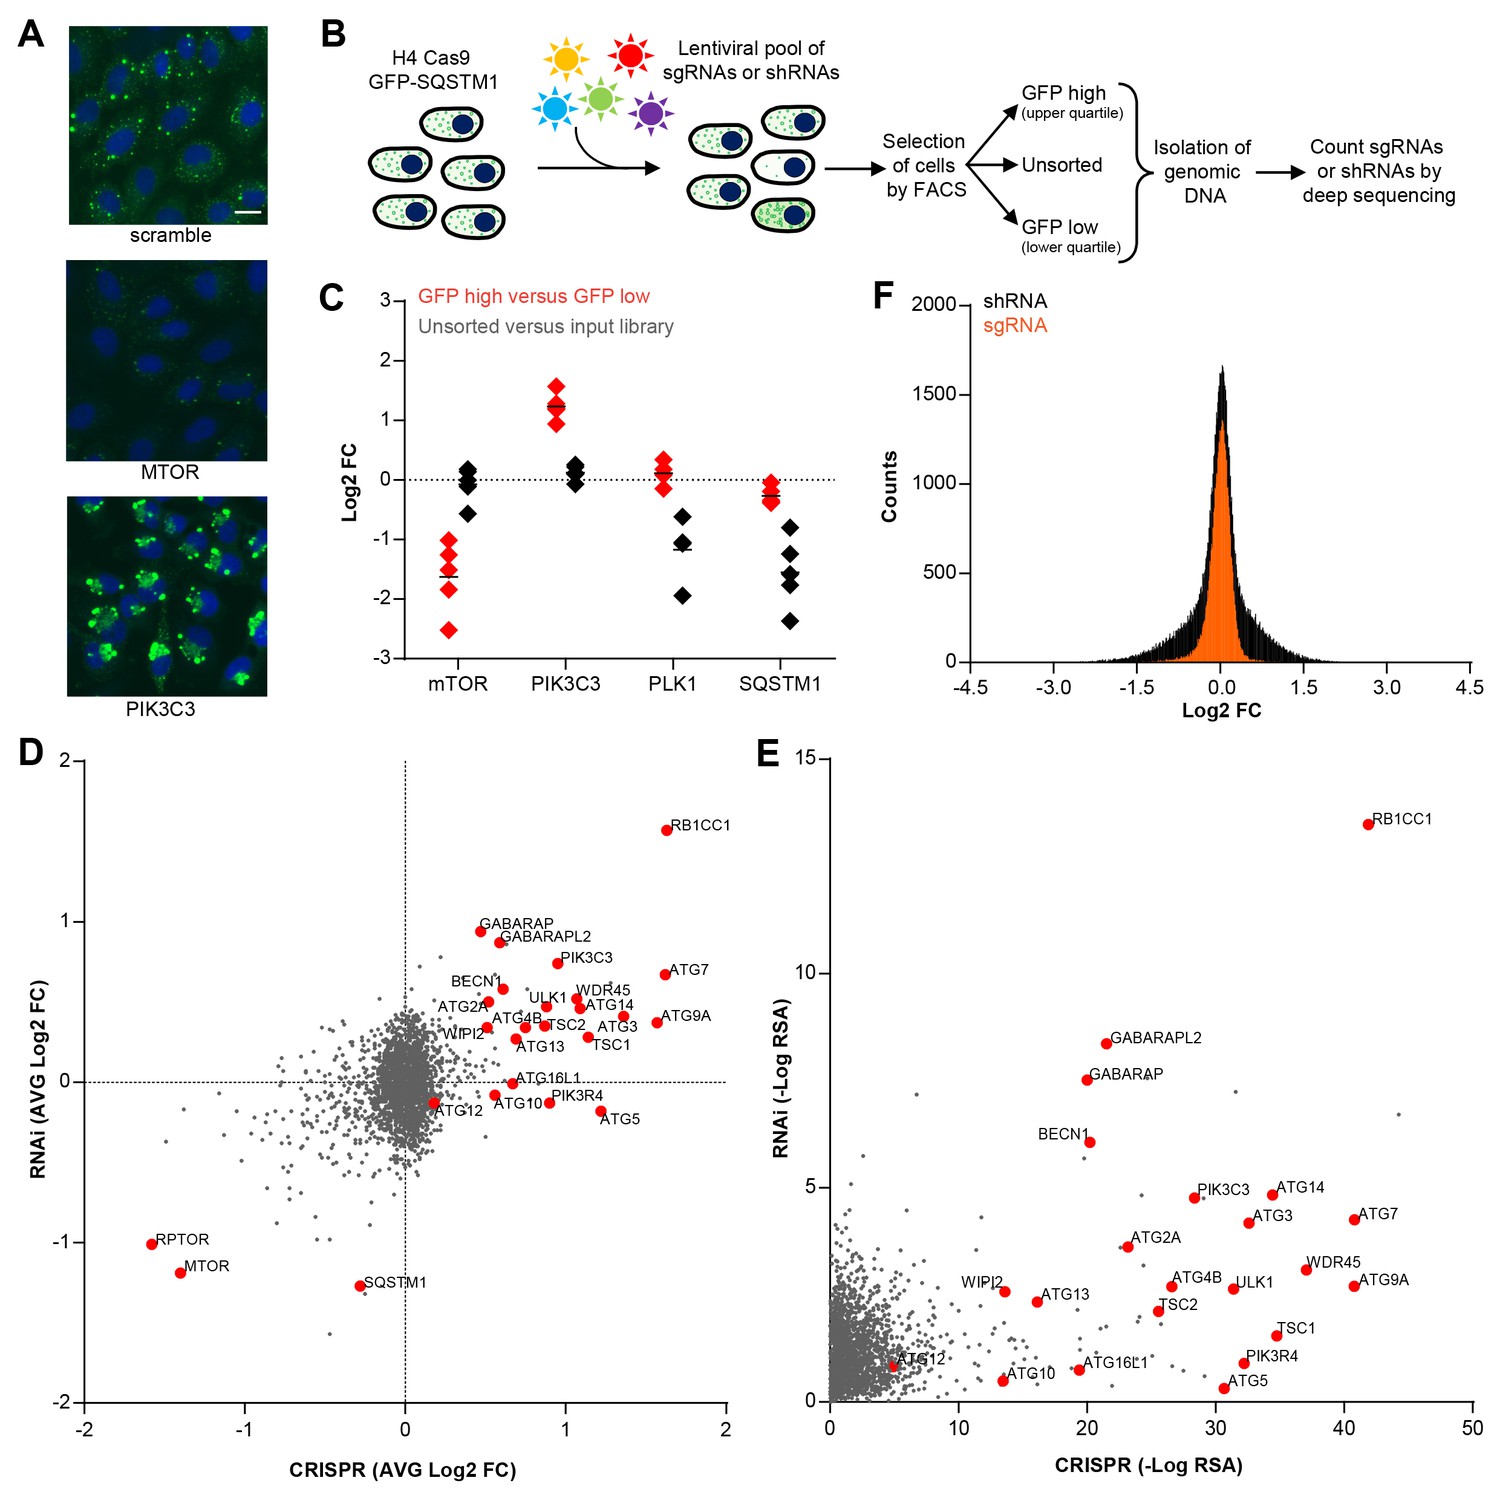
CRISPR-based screening outperforms RNAi in identifying modulators of SQSTM1.
(A) Scramble, MTOR and PIK3C3 sgRNAs were introduced into H4 Cas9 GFP-SQSTM1 cells by lentiviral infection and GFP fluorescence was analyzed after 7 days. Representative images show nuclei (blue) and GFP-SQSTM1 (green). Scale bar corresponds to 20 µm. (B) Pooled screening workflow of GFP-SQSTM1 assay. H4 Cas9 GFP-SQSTM1 cells are transduced with lentiviral libraries of sgRNAs or shRNAs and selected for stable integration. Fluorescence activated cell sorting (FACS) is used to isolate cell populations based on GFP upper quartile fluorescence (GFP high) or GFP lower quartile fluorescence (GFP low). A representative GFP FACS histogram is shown in Figure 1—figure supplement 1. Abundance of sgRNA and shRNA sequences is quantified by deep sequencing of the corresponding barcodes in the genomic DNA of the isolated cell populations as well as unsorted cells. (C) Distribution of individual sgRNAs targeting MTOR, PIK3C3, PLK1 or SQSTM1 at day 7. GFP-SQSTM1 modulation was assessed as log2 fold ratio of each sgRNA sequence based on the abundance in the GFP high versus GFP low cell population. Anti-proliferative effects were assessed as log2 fold ratio of each sgRNA based on the abundance in unsorted cells versus the input library. (D–F) H4 Cas9 GFP-SQSTM1 cells were transduced with CRISPR or RNAi lentiviral libraries covering 2677 genes with an average of 20 sgRNA or shRNA reagents per gene. Both screens were run in duplicate and the mean is shown. Gene-centric visualization of (D) average log2 fold change (FC) or (E) redundant siRNA activity (RSA) scores in GFP high versus GFP low cells. Selected autophagy and MTOR pathway components are highlighted in red. (F) Log2 fold change (FC) distribution of all shRNAs and sgRNAs in GFP high versus GFP low cells.
Figure 1—figure supplement 1
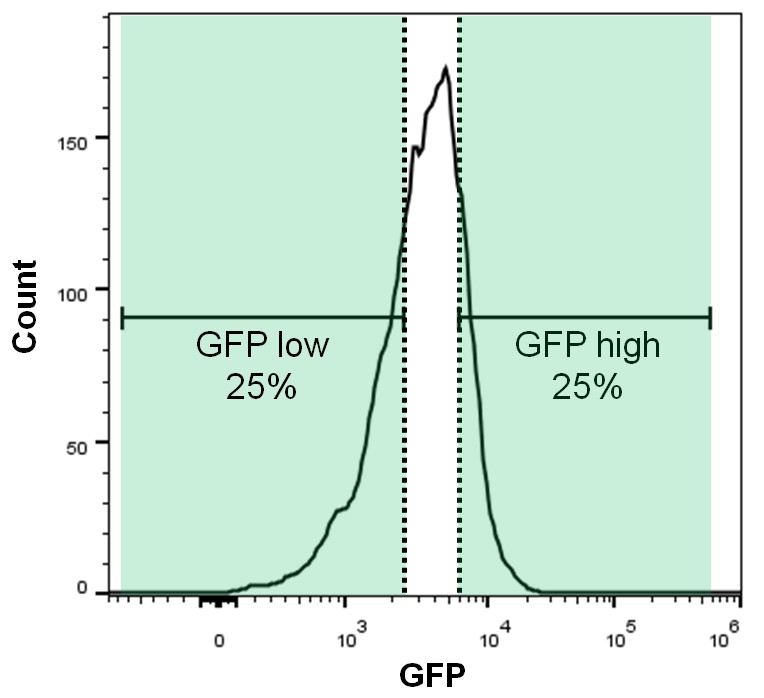
GFP FACS histogram highlighting the gates used to sort GFP high and GFP low cell populations.
https://doi.org/10.7554/eLife.17290.003
Figure 2 with 2 supplements
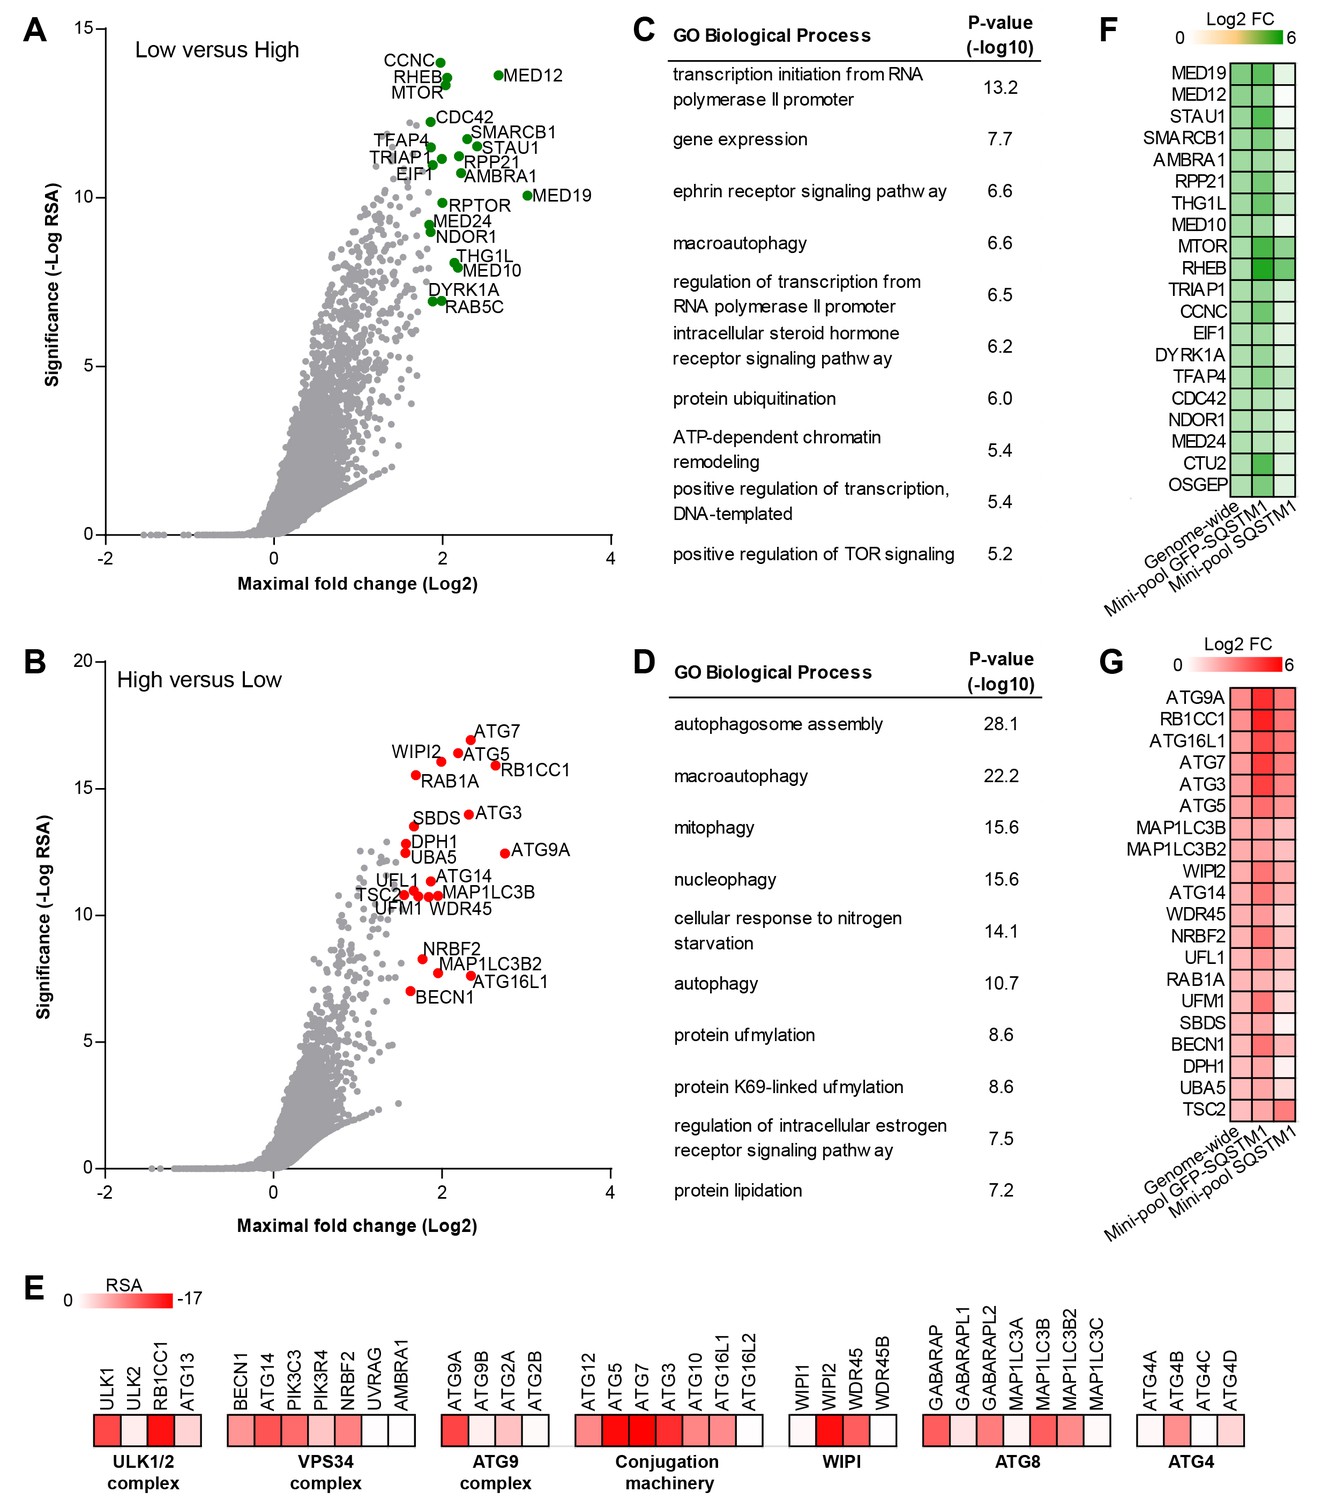
Genome-wide pooled CRISPR screening dissects canonical macroautophagy.
(A–E) H4 Cas9 GFP-SQSTM1 cells were transduced with a genome-wide CRISPR library covering 18,360 genes with an average of 5 sgRNAs per gene. 7 days post-infection, FACS was used to isolate GFP high and GFP low cell populations, and abundance of sgRNA sequences was quantified by deep sequencing. Gene-centric visualization of significance and maximal fold change in (A) GFP low versus GFP high cells, or (B) GFP high versus GFP low cells. Top scoring genes are highlighted and entire dataset is reported in Figure 2—source data 1. Gene enrichment analysis of the top ranked 100 hits in (C) GFP low versus GFP high cells, or (D) GFP high versus GFP low cells. (E) Heatmap of the RSA significance scores in GFP high versus GFP low cells for core components of canonical macroautophagy. (F–G) A mini-pool of sgRNAs was picked from the genome-wide screen targeting the top ranked 600 hits in GFP high and GFP low cells. The mini-pool was screened in H4 Cas9 GFP-SQSTM1 cells based on GFP fluorescence and in the parental H4 Cas9 cell population based on endogenous SQSTM1 staining. Heatmap of log2 fold changes (FC) for top ranked hits in (F) low versus high cells, or (G) high versus low cells. Hits are ranked based on log2 FC in the genome-wide screen. Entire mini-pool data is reported in Figure 2—source data 2.
-
Figure 2—source data 1
RSA and maximal log2 fold changes for genome-wide GFP-SQSTM1 screen.
- https://doi.org/10.7554/eLife.17290.005
-
Figure 2—source data 2
Mini-pool sgRNA sequences and corresponding log2 fold changes in genome-wide GFP-SQSTM1, mini-pool GFP-SQSTM1 and mini-pool endogenous SQSTM1 screens.
- https://doi.org/10.7554/eLife.17290.006
Figure 2—figure supplement 1
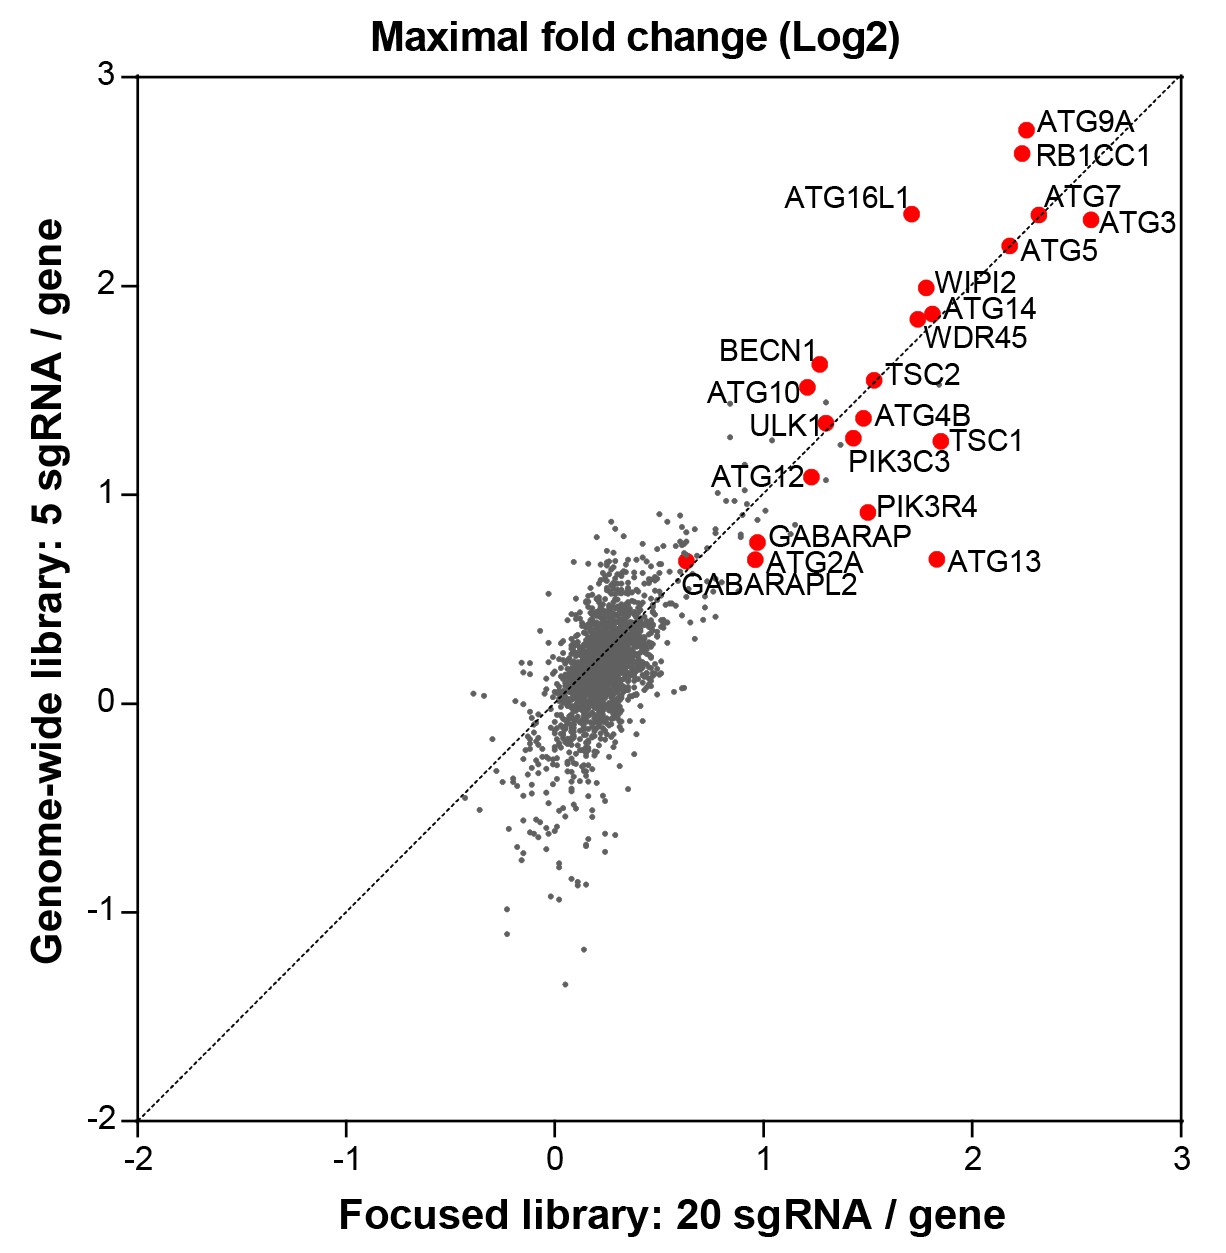
Comparison of the focused versus genome-wide sgRNA libraries.
The performance of the focused sgRNA library with 20 sgRNA per gene (Figure 1) was compared to the genome-wide library with 5 sgRNA per gene by analyzing gene-centric maximal fold changes in GFP high versus GFP low cells. Selected autophagy and MTOR pathway components are highlighted in red.
Figure 2—figure supplement 2
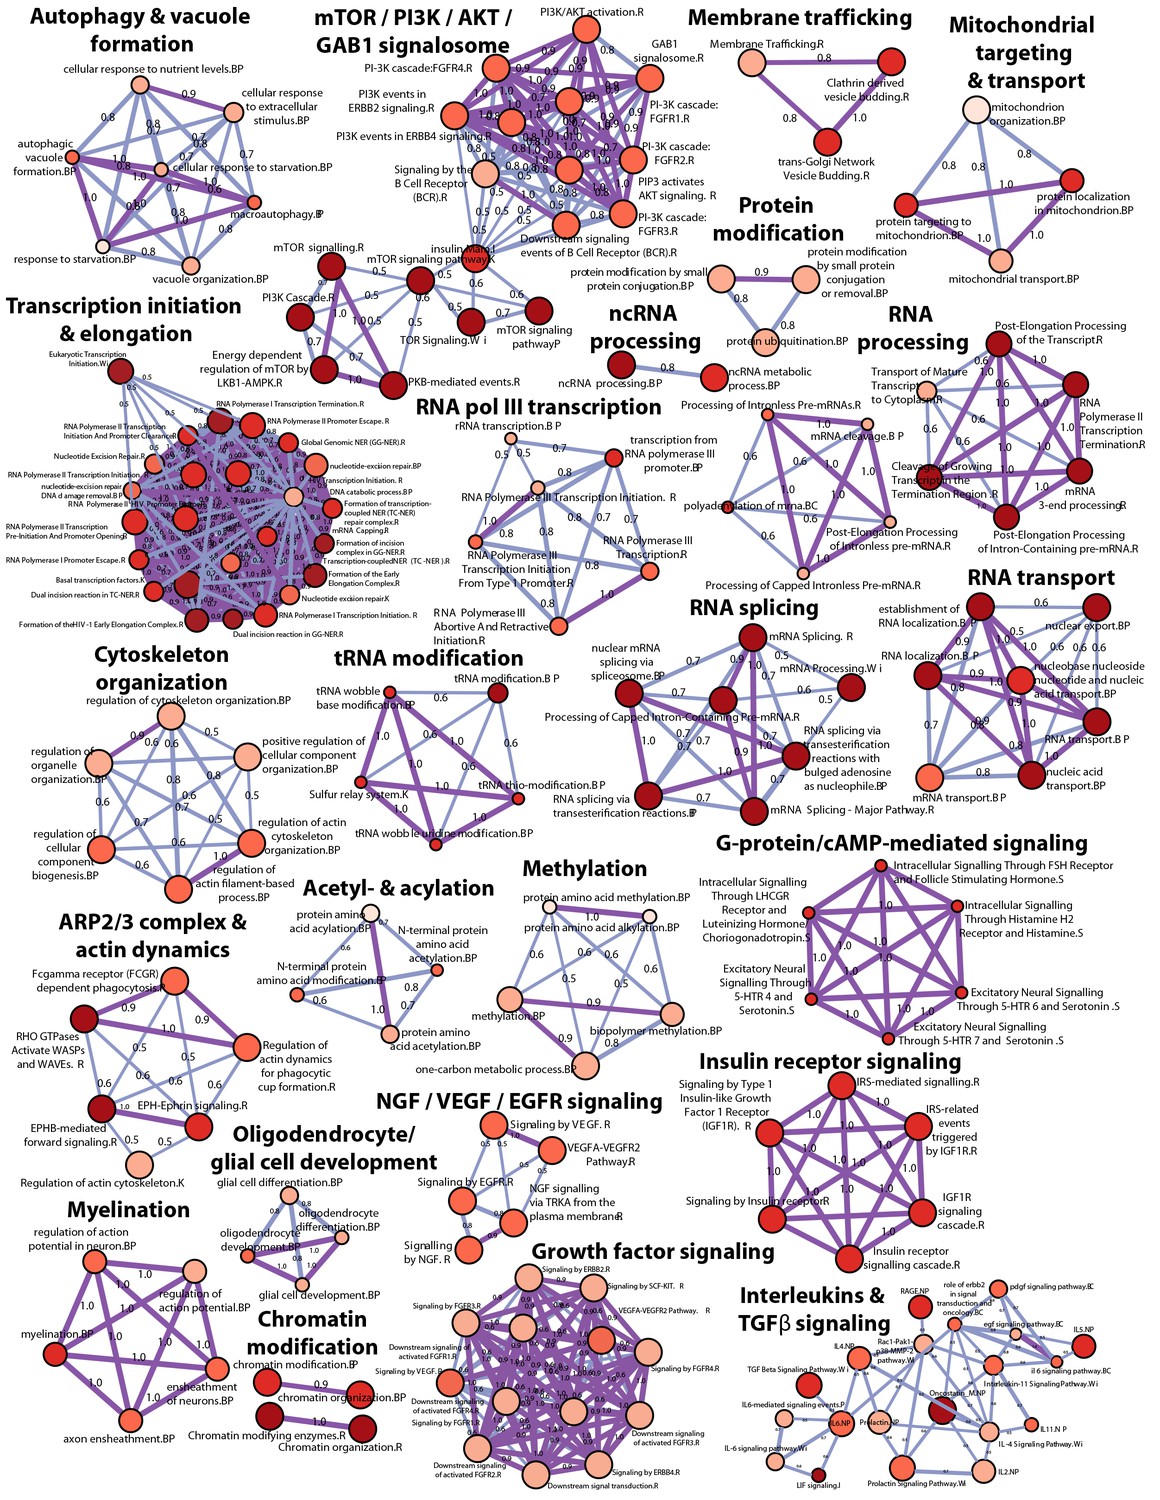
High-level concept map of enriched pathways and processes for screen hits.
The map abstracts the extent of mutual overlap between pathways and biological process-related gene sets and identifies subclusters of highly connected gene sets that are over-represented among hits from the CRISPR screen. Nodes represent enriched gene sets of biological processes, molecular function and pathways. Node size corresponds to the number of down-regulated genes in each gene set. Node color scales according to the gene set enrichment score (-Log10 P-value). All gene sets that are significantly enriched (p<0.05) are displayed in the map. The extent of mutually overlapping genes between gene sets (Jaccard coefficient) is represented by thickness & color intensity of edges connecting the nodes. Strongly connected network components were identified using Tarjan’s algorithm. With this representation, a strong enrichment and connectivity signal was observed for pathways and processes labeled in bold, including autophagy and processes regulating MTOR signaling.
Figure 3
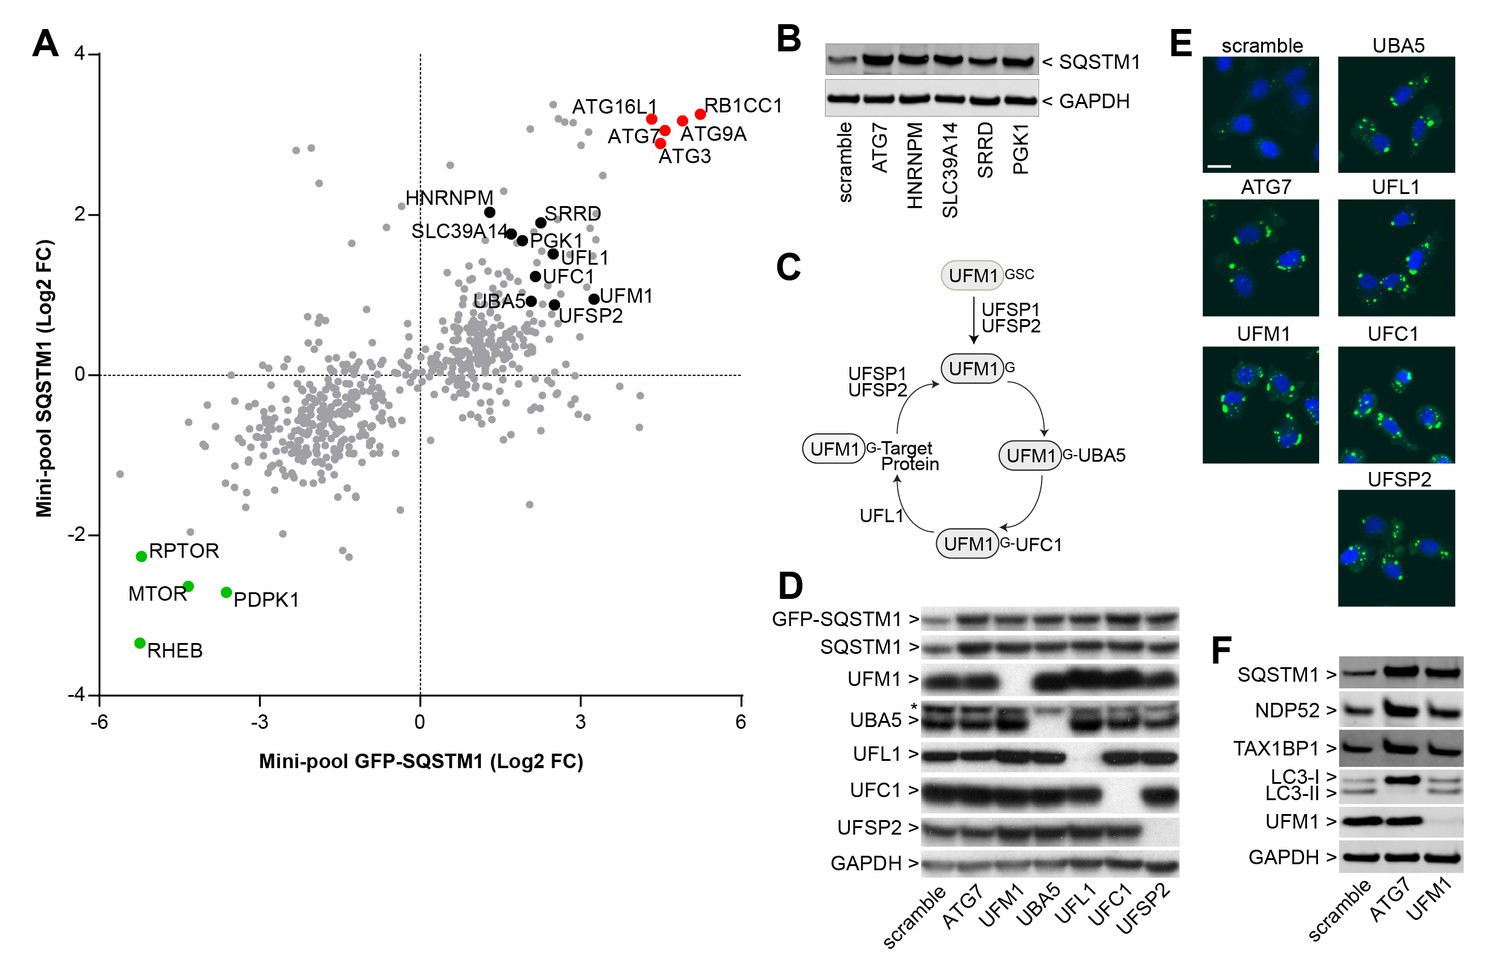
Identification of novel modulators of SQSTM1.
(A) Comparison of log2 fold changes in the mini-pool screen for GFP-SQSTM1 and endogenous SQSTM1. Selected MTOR and autophagy pathway genes are marked in green or red while novel candiates are highlighted in black. (B) Indicated sgRNAs were introduced into H4 Cas9 cells by lentiviral infection, protein lysates were collected 7 days post-infection and probed by immunoblot. (C) Cartoon of the ufmylation cascade. (D–E) Accumulation of GFP-SQSTM1 upon depletion of ufmylation. Indicated sgRNAs were introduced into H4 Cas9 GFP-SQSTM1 cells by lentiviral infection and cells were probed 7 days post-infection by (D) immunoblot or (E) high-content imaging. Representative images show nuclei (blue) and GFP-SQSTM1 (green). Scale bar corresponds to 20 µm. (F) Indicated sgRNAs were introduced into H4 Cas9 clone 4 by lentiviral infection, protein lysates collected 7 days post-infection and probed by immunoblot.
Figure 4
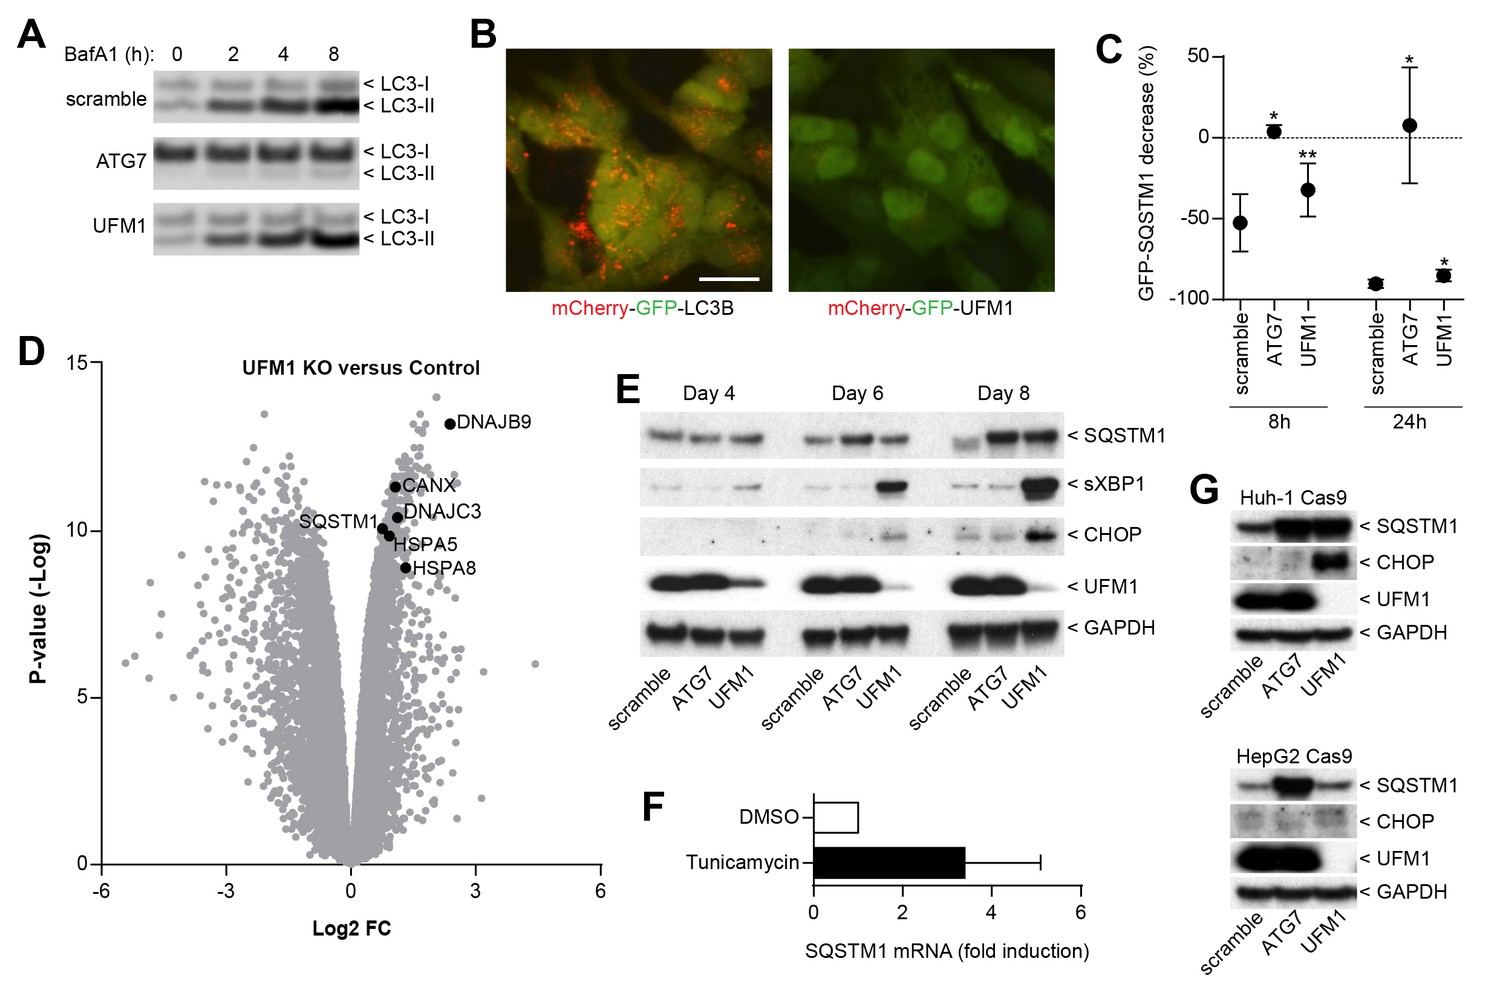
Inhibition of ufmylation elicits an ER stress response and induces SQTSM1 expression.
(A) Scramble, ATG7 and UFM1 sgRNAs were introduced into H4 Cas9 clone 4 by lentiviral infection. 7 days post-infection cells were treated with 0.1% DMSO or 50 nM Bafilomycin A1 for 2, 4 or 8 hr and protein lysates were collected and probed by immunoblot. (B) Representative images of H4 cells stably expressing mCherry-GFP-LC3B or mCherry-GFP-UFM1. Scale bar corresponds to 20 µm. Note that the absence of mCherry-positive puncta in mCherry-GFP-UFM1 expressing cells suggests that UFM1 is not delivered to endolysosomal compartments. (C) GFP-SQSTM1 clearance in ATG7- and UFM1-depleted cells. Scramble, ATG7 and UFM1 sgRNAs were introduced into H4 Cas9 GFP-SQSTM1 cells by lentiviral infection. 7 days post-infection cells were treated with 0.1% DMSO or 0.5 µM AZD8055 for 8 hr or 24 hr, fixed, and subjected to high content imaging. GFP fluorescence was quantified as ratio of GFP-SQSTM1 puncta area in DMSO- versus AZD8055-treated cells and is shown as mean +/- SD from three independent experiments. Statistical significance was assessed via a two-tailed paired t-test (*p<0.05, **p<0.01). (D) UFM1 knockout induces ER stress and increases SQSTM1 mRNA levels. Scramble and UFM1 sgRNAs were introduced into H4 Cas9 cells by lentiviral infection. 7 days post-infection total RNA was extracted and subjected to RNA sequencing. The volcano plot visualizes genes differentially expressed in UFM1-depleted versus cells infected with a scramble sgRNA. Selected ER stress markers and SQSTM1 are highlighted and entire dataset is reported in Figure 4—source data 1. (E) Time course analysis of ER stress and SQSTM1 induction. Indicated sgRNAs were introduced into H4 Cas9 cells by lentiviral infection, protein lysates collected 4, 6 and 8 days post-infection and probed by immunoblot. (F) Total RNA was collected from H4 Cas9 cells treated with 0.1% DMSO or 10 µg/ml tunicamycin for 24 hr, SQSTM1 mRNA was quantified by RT-qPCR analysis and normalized to HPRT1. The mean +/- SD of biological triplicates is shown. (G) Indicated sgRNAs were introduced into Huh-1 Cas9 or HepG2 Cas9 cells by lentiviral infection, protein lysates collected 7 days post-infection and probed by immunoblot.
-
Figure 4—source data 1
Fold change and significance of differentially regulated genes by RNA sequencing in UFM1-depleted versus scramble sgRNA-infected cells.
- https://doi.org/10.7554/eLife.17290.011
Additional files
-
Supplementary file 1
Supplementary information on reagents.
(A) Schematic representation of the CRISPR vectors used in this study. (B) PCR and sequencing primer sequences for shRNA, genome-wide sgRNA and mini-pool sgRNA libraries. (C) sgRNA sequences selected for validation experiments. (D) Primary antibody information.
- https://doi.org/10.7554/eLife.17290.012
Download links
A two-part list of links to download the article, or parts of the article, in various formats.
Downloads (link to download the article as PDF)
Open citations (links to open the citations from this article in various online reference manager services)
Cite this article (links to download the citations from this article in formats compatible with various reference manager tools)
Functional CRISPR screening identifies the ufmylation pathway as a regulator of SQSTM1/p62
eLife 5:e17290.
https://doi.org/10.7554/eLife.17290


