Thrombospondin expression in myofibers stabilizes muscle membranes
- University of Cincinnati, United States
- Emory University, United States
- Northwestern University, United States
- Temple University School of Medicine, United States
- Weizmann Institute of Science, Israel
- Howard Hughes Medical Institute, Cincinnati Children's Hospital Medical Center, United States
Figures
Figure 1 with 3 supplements
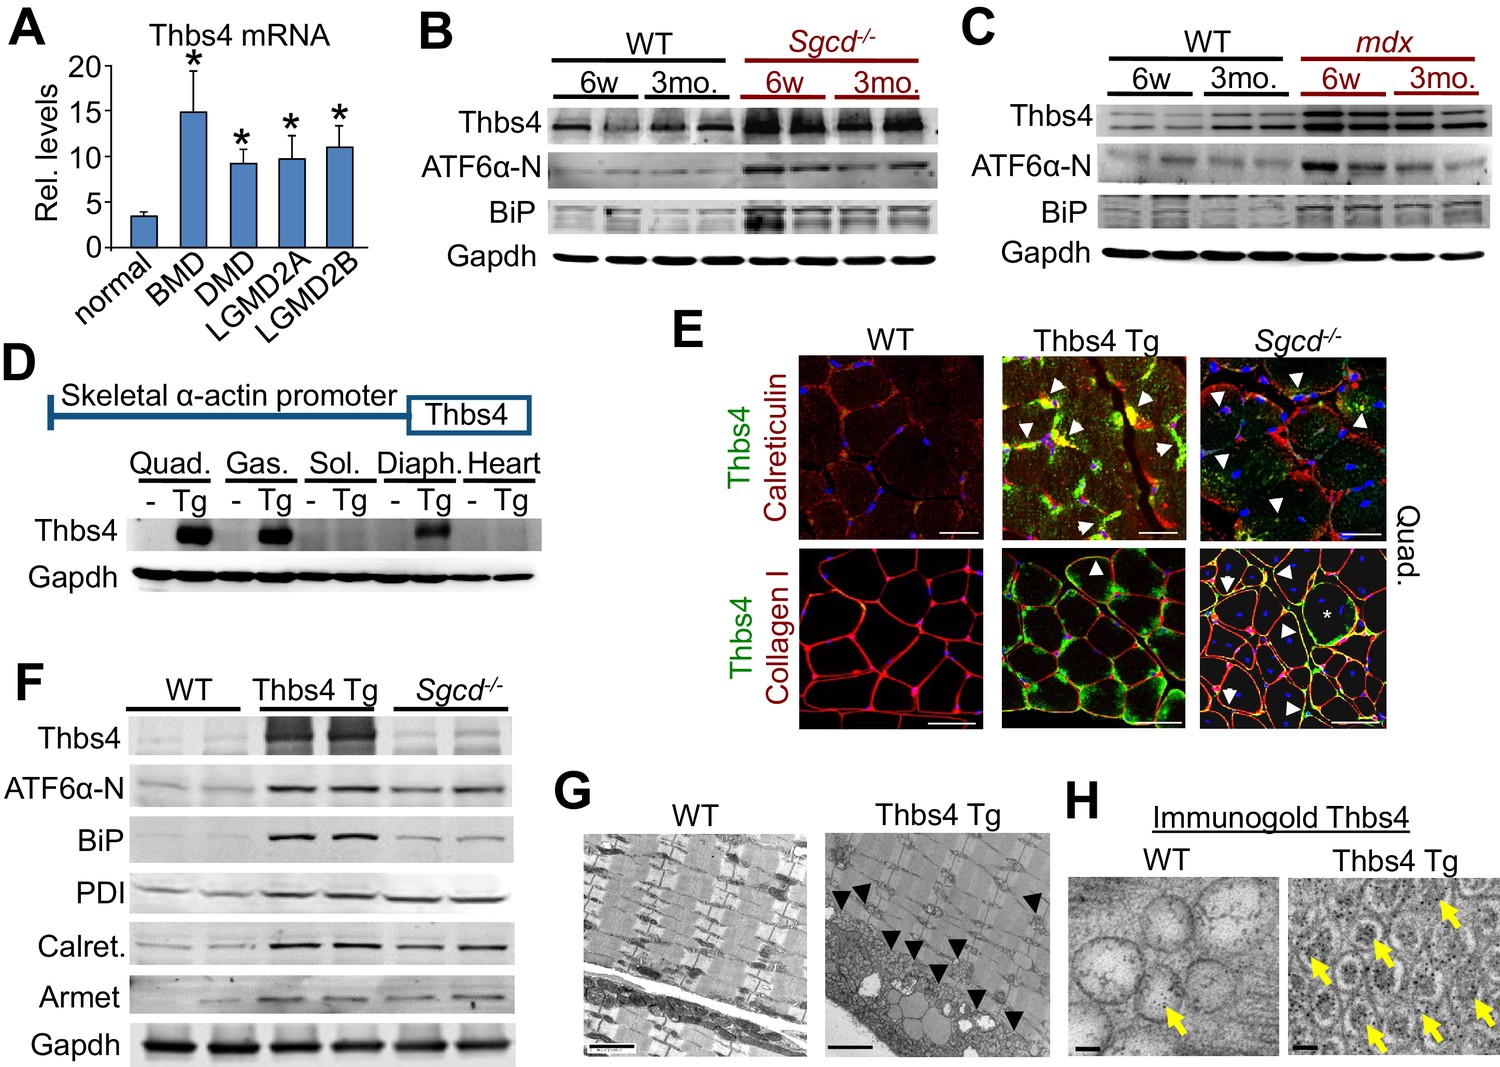
Thbs4 is induced in dystrophic skeletal muscle and its overexpression augments ER activity and vesicle content.
(A) Thbs4 mRNA levels in human skeletal muscle biopsies from normal or patients with Becker MD (BMD; n = 5), Duchenne MD (DMD; n = 10) or 2 different types of limb-girdle MD (LGMD; n = 10 for both). *p<0.05 vs. normal (n = 18) by Student’s t test. Data are presented as mean ± SEM. Full analysis including all 11 human muscle diseases is shown in Figure 1—figure supplement 1A. (B,C) Western blot for the expression of Thbs4, ATF6α-N (50 kDa, nuclear) and BiP in the quadriceps of WT, Sgcd-/- and mdx mice at six weeks (w) and three months (mo) of age (n = 4 biological replicates). (D) Schematic diagram showing the skeletal muscle-specific transgene to overexpress Thbs4 and (lower) Western blots for Thbs4 or gapdh control from WT and Tg mice at 6 w of age from Quad, quadriceps; Gas, gastrocnemius; Sol, soleus; Diaph, diaphragm; and heart (n = 2 biological replicates). (E) Upper micrographs represent co-immunofluorescent labeling of intracellular Thbs4 (green) with calreticulin (red) on paraffin embedded quadriceps (Quad.) of WT, Thbs4-Tg and Sgcd-/- mice at 3 mo of age (scale bar = 20 μm). Arrowheads indicate co-localization of Thbs4 with calreticulin in intracellular vesicles in the myofibers. Lower micrographs represent co- immunofluorescent labeling of Thbs4 (green) with collagen I (red) on cryo-embedded Quad of WT, Thbs4-Tg and Sgcd-/- mice at 3 mo of age (scale bar = 50 μm). Arrowheads indicate co-localization of Thbs4 with collagen I in the extracellular milieu; the star marks a myofiber with both intra- and extracellular Thbs4 labeling from a diseased muscle. Nuclei are visualized in blue. Representative images of 4 mice per genotype are shown. (F) Western blot analysis of Thbs4 and the ER-stress proteins ATF6α-N (50 kDa, nuclear), BiP, PDI, calreticulin (Calret.), and Armet in 6w old WT, Thbs4-Tg and Sgcd-/- quadriceps (n = 4 biological replicates). (G) Transmission electron microscopy in WT versus Thbs4 Tg quadriceps at 3 mo of age showing a massive expansion of intramyofibrillar and subsarcolemmal ER and associated vesicles with Thbs4 overexpression (arrowheads, scale bar = 2 μm). Representative images of 2 mice per genotype are shown. (H) Immunogold electron microscopy shows that Thbs4 (6 nm gold particles; yellow arrows) robustly localizes to the expanded sub-sarcolemmal vesicular compartment in Thbs4-Tg quadriceps, compared to endogenously expressed Thbs4 in WT quadriceps. Representative images of 2 mice are shown. Scale bar = 50 nm
Figure 1—figure supplement 1
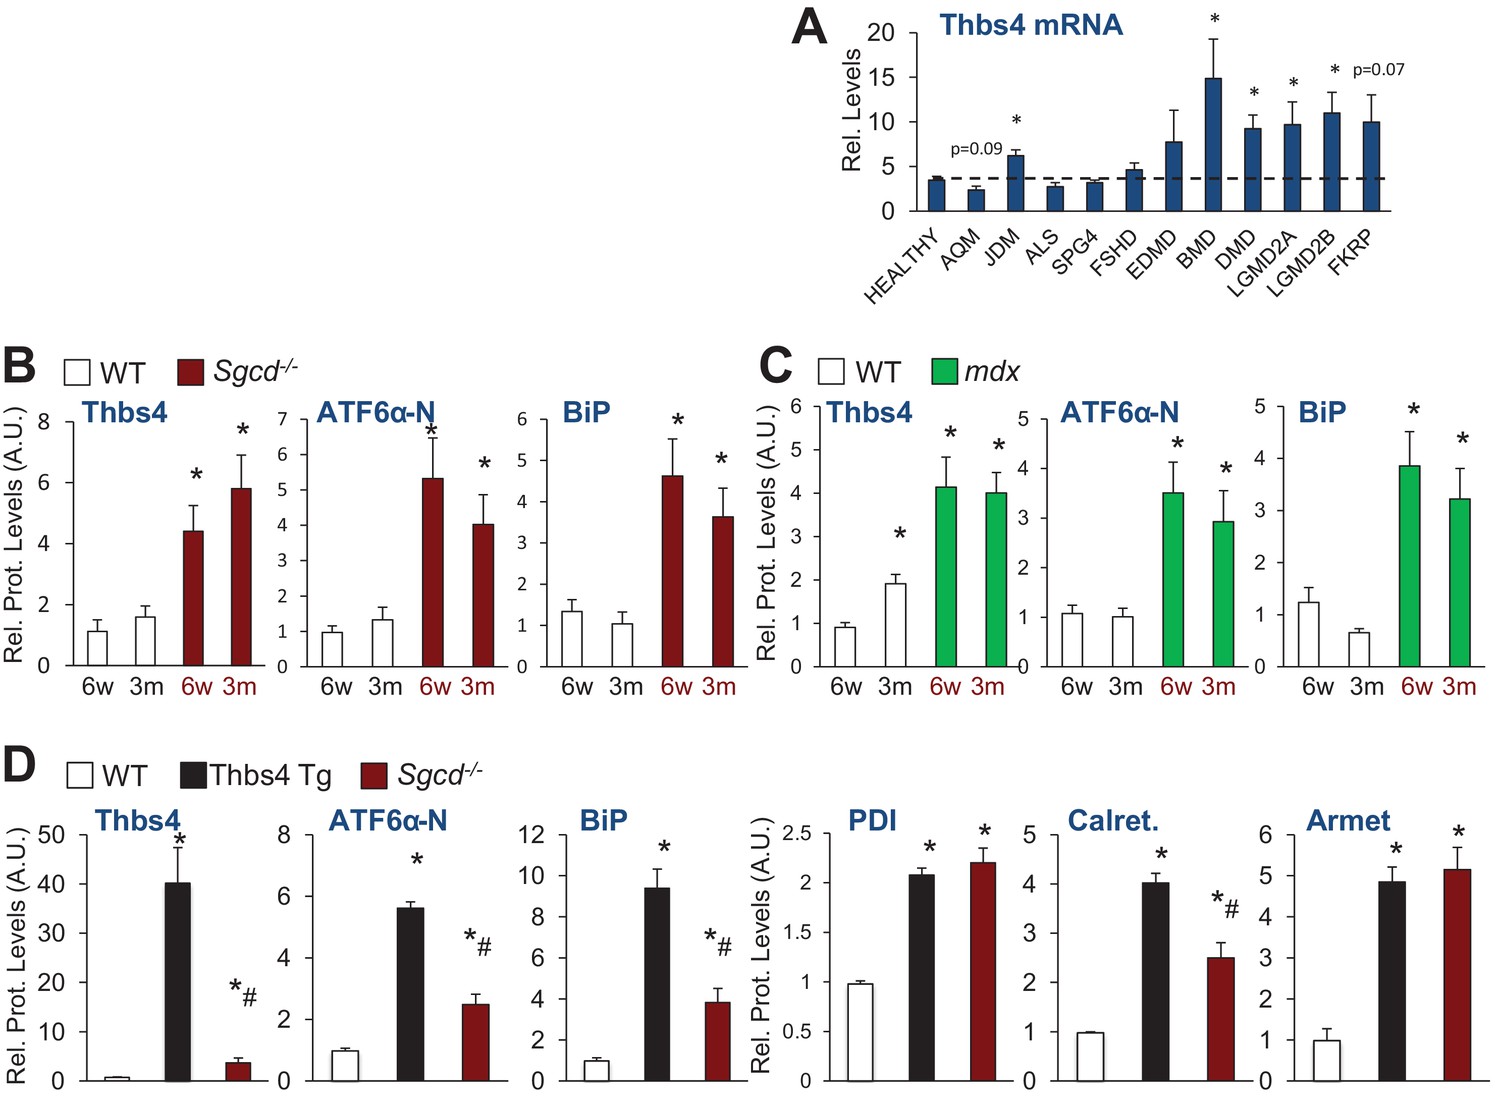
Thbs4 expression levels in human muscle diseases and quantitation of protein levels relative to Gapdh loading control of immunoblots shown in Figure 1B, C and F.
(A) RelativeThbs4 mRNA levels in human skeletal muscle biopsies from normal, healthy subjects (n = 18) or patients with acute quadriplegic myopathy (AQM; n = 5), juvenile dermatomyositis (JDM; n 21), amyotophic lateral sclerosis (ALS; n = 9), spastic paraplegia (SPG4; n = 4), fascioscapulohumeral muscular dystrophy (FSHD; n = 14), Emery Dreifuss muscular dystrophy (EDMD; n = 7), Becker muscular dystrophy (BMD; n 5), Duchenne muscular dystrophy (DMD; n = 10), calpain 3 mutation (LGMD2A; n = 10), dysferlin (LGMD2B; n = 10), FKRP (Homozygous for a missense mutation Fukutin-related protein; n = 7). *p<0.05 vs. Healthy by Student’s t test. (B) Relative protein levels for immunoblots shown in Figure 1B; (C) Relative protein levels for Figure 1C; and (D) relative protein levels for Figure 1F. An additional set of immunoblots was included to obtain an n = 4 per genotype. Relative Thbs4 protein levels were determined by quantifying both bands observed for Thbs4. *p<0.05 vs WT; #p<0.05 vs Thbs4 Tg by one-way ANOVA with post hoc Tukey’s test.
Figure 1—figure supplement 2
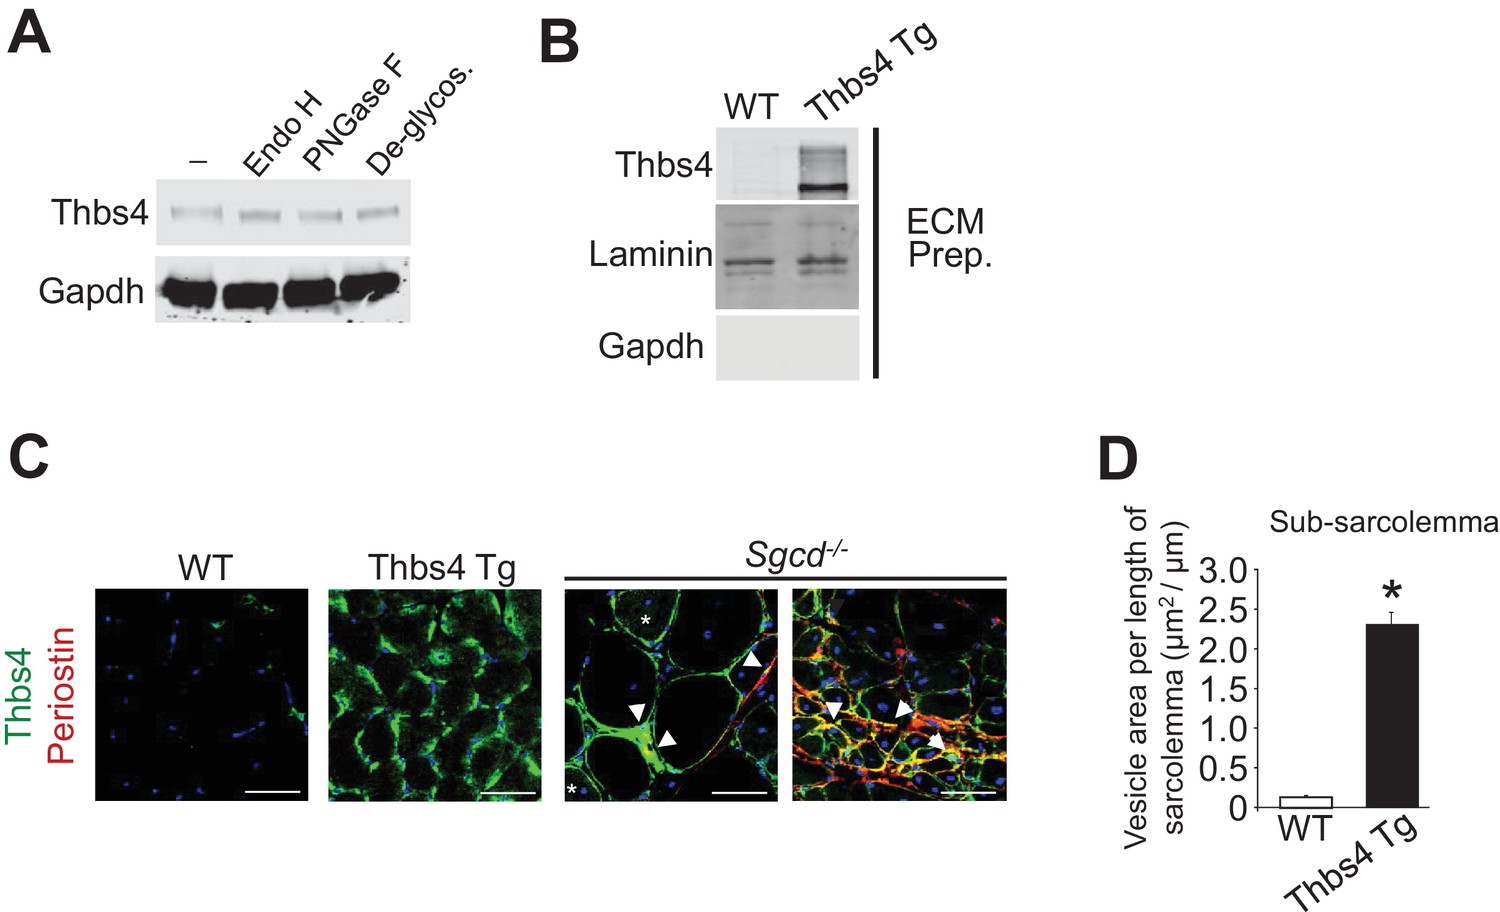
Analysis of Thbs4 glycosylation and vesicular expansion quantitation.
(A) Glycosylation pattern of Thbs4 protein from quadriceps protein extracts of Thbs4-Tg mice treated with enzymes endoglycosidase H (Endo H) and peptide N-glycosidase F (PNGase F) and compared with a total deglycosylation enzyme mix (Deglycos.). Gapdh is presented as processing and loading control (n = 4 biological replicates). Endo H cleaves high mannose residues and hybrid oligosaccharides present on proteins in the ER while PNGase cleaves both these and more complex oligosaccharides that result from processing in the Golgi. Here, both enzymes equally reduced the apparent size of Thbs4, consistent with high mannose residues typical for proteins in the ER lumen, and proteins that are transitioning to the Golgi to be secreted. (B) Representative Western blot analysis for Thbs4 from extracellular matrix (ECM) enriched protein fractions from WT and Thbs4-Tg quadriceps. Laminin is presented as ECM protein control; Gapdh as cytosolic contamination control (n = 3 biological replicates). The data show that whileoverexpressed Thbs4 in non-diseased muscle cannot be readily observed by immunohistochemistry from muscle sections, a more sensitive analysis with ECM-specific western blotting does show some Thbs4 protein outside the myofibers. (C) Micrographs representing co-immunofluorescent labeling of Thbs4 (green) with periostin (red) on cryo-embedded Quad of WT, Thbs4-Tg and Sgcd-/- mice at three months of age (scale bar = 50 μm). Nuclei are visualized in blue. Arrowheads indicate co-localization of Thbs4 with periostin in the extracellular milieu during disease; the star marks a myofiber with both intra- and extracellular Thbs4 labeling. Representative images of 4 mice per genotype are shown. (D) Quantitation of sub-sarcolemmal vesicular expansion relative to the length of the sarcolemma on transmission electron microscopy images of WT and Thbs4-Tg myofibers from quadriceps at approximately three months of age (n = 22 and 17 myofibers, respectively, from 2 mice per genotype). Data are presented as mean ± SEM; *p<0.0001 vs WT by Student’s t test.
Figure 1—figure supplement 3

Internalization of Thbs4 by cultured C2C12 myoblasts and myotubes.
(A) Representative images of C2C12 myoblasts cultured with 1 μg/ml Alexa-488 conjugated recombinant Thbs4 (rThbs4-488) or BSA-488 control for the indicated periods. Bright green vesicles containing internalized rThbs4-488, but not BSA-488 were detected in the cytoplasm of C2C12 myoblasts. Cells were counterstained with phalloidin-568 (red); nuclei are visualized in blue. Scale bar = 10 μm. (B) Representative images of C2C12 myoblasts cultured with 1 μg/ml rThbs4-488 or BSA-488 control for 24 hr showing partial co-localization of Thbs4 with a late endosome marker (Rab7) but not BSA-488 control. Phalloidin (red) was used to visualize cells; nuclei are visualized in blue. Scale bar = 10 μm. (C) Representative images of C2C12 myotubes cultured with 1 μg/ml rThbs4-488 or BSA-488 control for 24 hr. The regions marked by dotted boxes are shown on the right in higher magnification. Bright green vesicles containing internalized rThbs4-488, but not BSA-488 were detected in the cytoplasm of C2C12 myotubes after recombinant Thbs4-488 was added to the media for 24 hr. Phalloidin (red) was used to visualize cells; nuclei are visualized in blue. Scale bar = 25 μm. (D,E) Representative immunoblots and semi-quantitative analysis of rThbs4 internalization after addition of 1 μg/ml biotin labeled rThbs4 to the cultured media of C2C12 myotubes for indicated times. n = 3 experiments for all experiments presented in this figure. *p<0.05 vs untreated myotubes by Student’s t test.
Figure 2 with 4 supplements
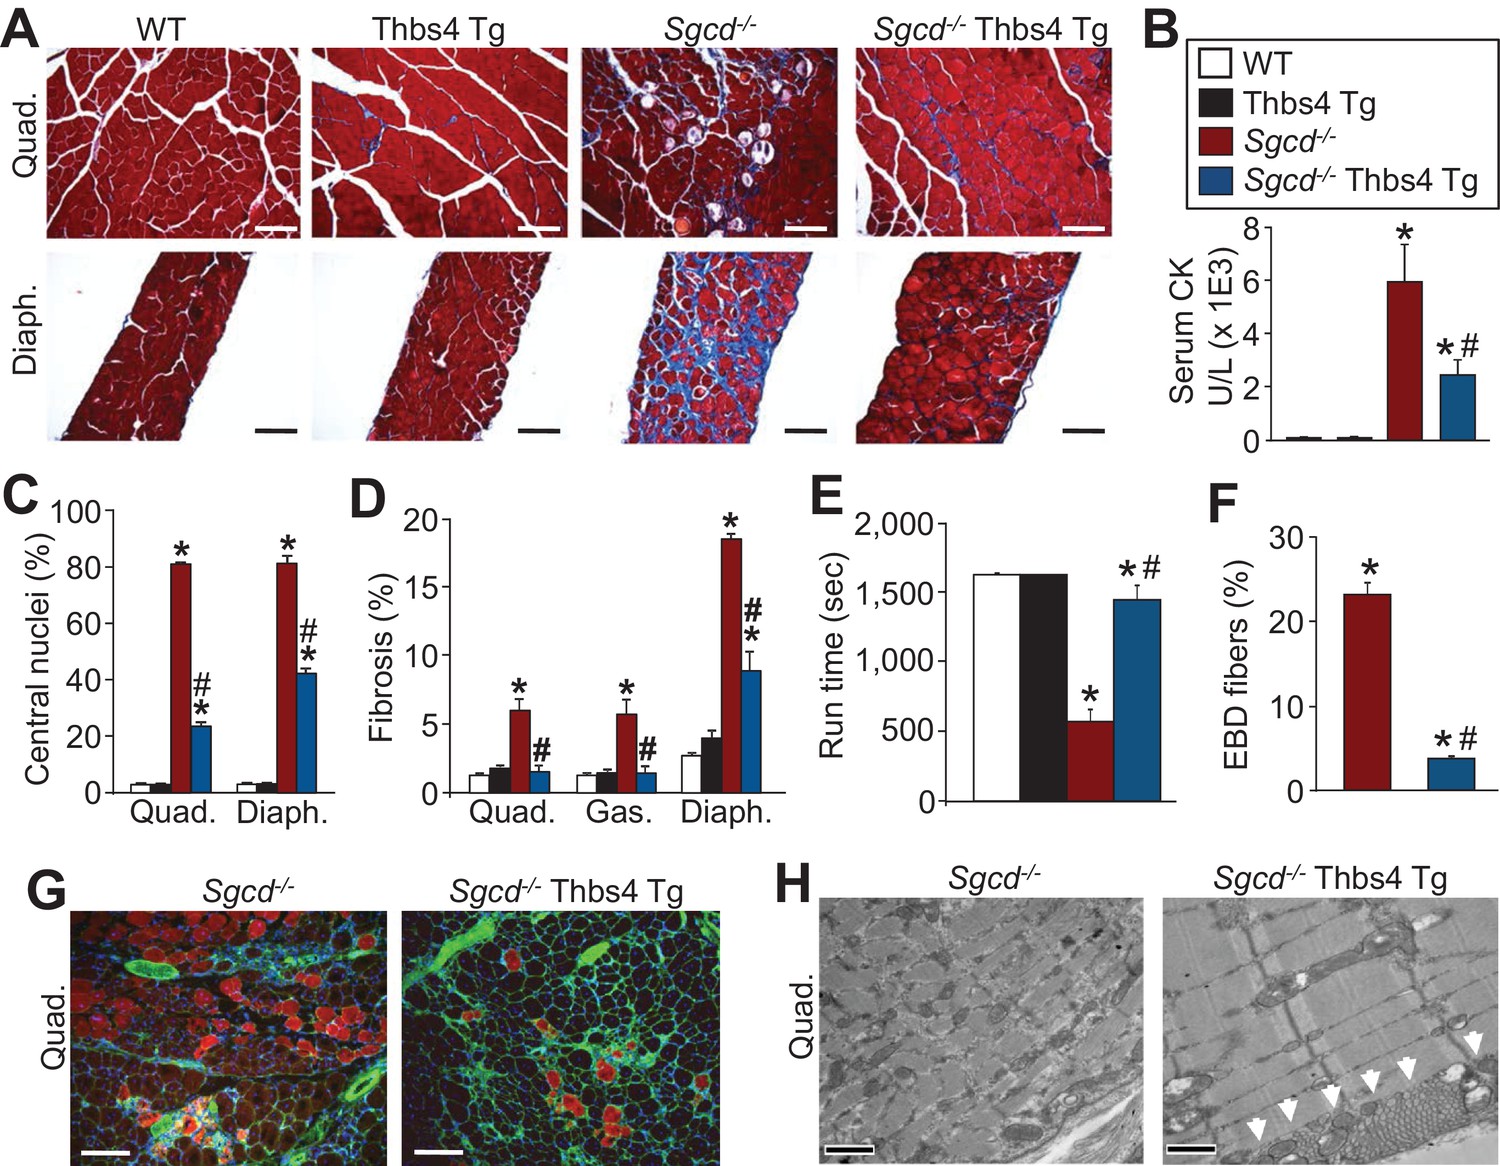
Thbs4 overexpression in skeletal muscle mitigates MD in mice.
(A) Masson’s trichrome stained sections of quadriceps (Quad.) and diaphragm (Diaph.) from WT, Thbs4-Tg, Sgcd-/- and Sgcd-/- Thbs4-Tg mice at 3 mo of age (Scale bar = 100 μm). Blue staining is fibrosis. (B) Quantitation of serum CK levels (units/liter) in indicated genotypes at 3 mo of age. *p<0.05 vs WT; #p<0.05 vs Sgcd-/- by one-way ANOVA with post hoc Tukey’s test. N = 8 mice for WT, Thbs4 Tg and Sgcd-/-Thbs4 Tg and n = 7 mice for Sgcd-/-. The legend in this panel also refers to panels C–F. (C) Percentage of myofibers with centrally located nuclei in Quad and Diaph from H&E-stained histological sections at 3 mo of age. Representative images are shown in Figure 2—figure supplement 3. *p<0.05 vs WT; #p<0.05 vs Sgcd-/- by one-way ANOVA with post hoc Tukey’s test. (D) Interstitial fibrosis analyzed in trichrome stained histological sections from Quad, gastrocnemius (Gas) and Diaph at three months of age. *p<0.05 vs WT; #p<0.05 vs Sgcd-/- by one-way ANOVA with post hoc Tukey’s test. N = 6 mice for WT and Thbs4 Tg and n = 8 mice for Sgcd-/-and Sgcd-/-Thbs4 Tg in panel A, C and D. (E) Time to fatigue in seconds with forced downhill treadmill running at 3 mo of age in the indicated genotypes of mice. *p<0.05 vs WT; #p<0.05 vs Sgcd-/- by one-way ANOVA with post hoc Tukey’s test. N = 6 mice per genotype. (F,G) Quantitation of total Evan’s blue dye (EBD) positive fibers and representative immunofluorescent images of EBD uptake (red) in Quad of three month-old mice. Membranes of myofibers are shown in green. *p<0.05 vs WT; #p<0.05 vs Sgcd-/- by one-way ANOVA with post hoc Tukey’s test. N = 5 mice per genotype in panel F. Scale bar = 100 μm. (H) Transmission electron microscopy of quadriceps muscle in Sgcd-/-Thbs4 Tg mice compared to Sgcd-/- mice at 3 mo of age. The arrowheads show subsarcolemmal vesicular expansion due to the Thbs4 Tg. Representative images of 2 mice per genotype are shown. Scale bar = 500 nm. All data are represented as mean ± SEM.
Figure 2—figure supplement 1
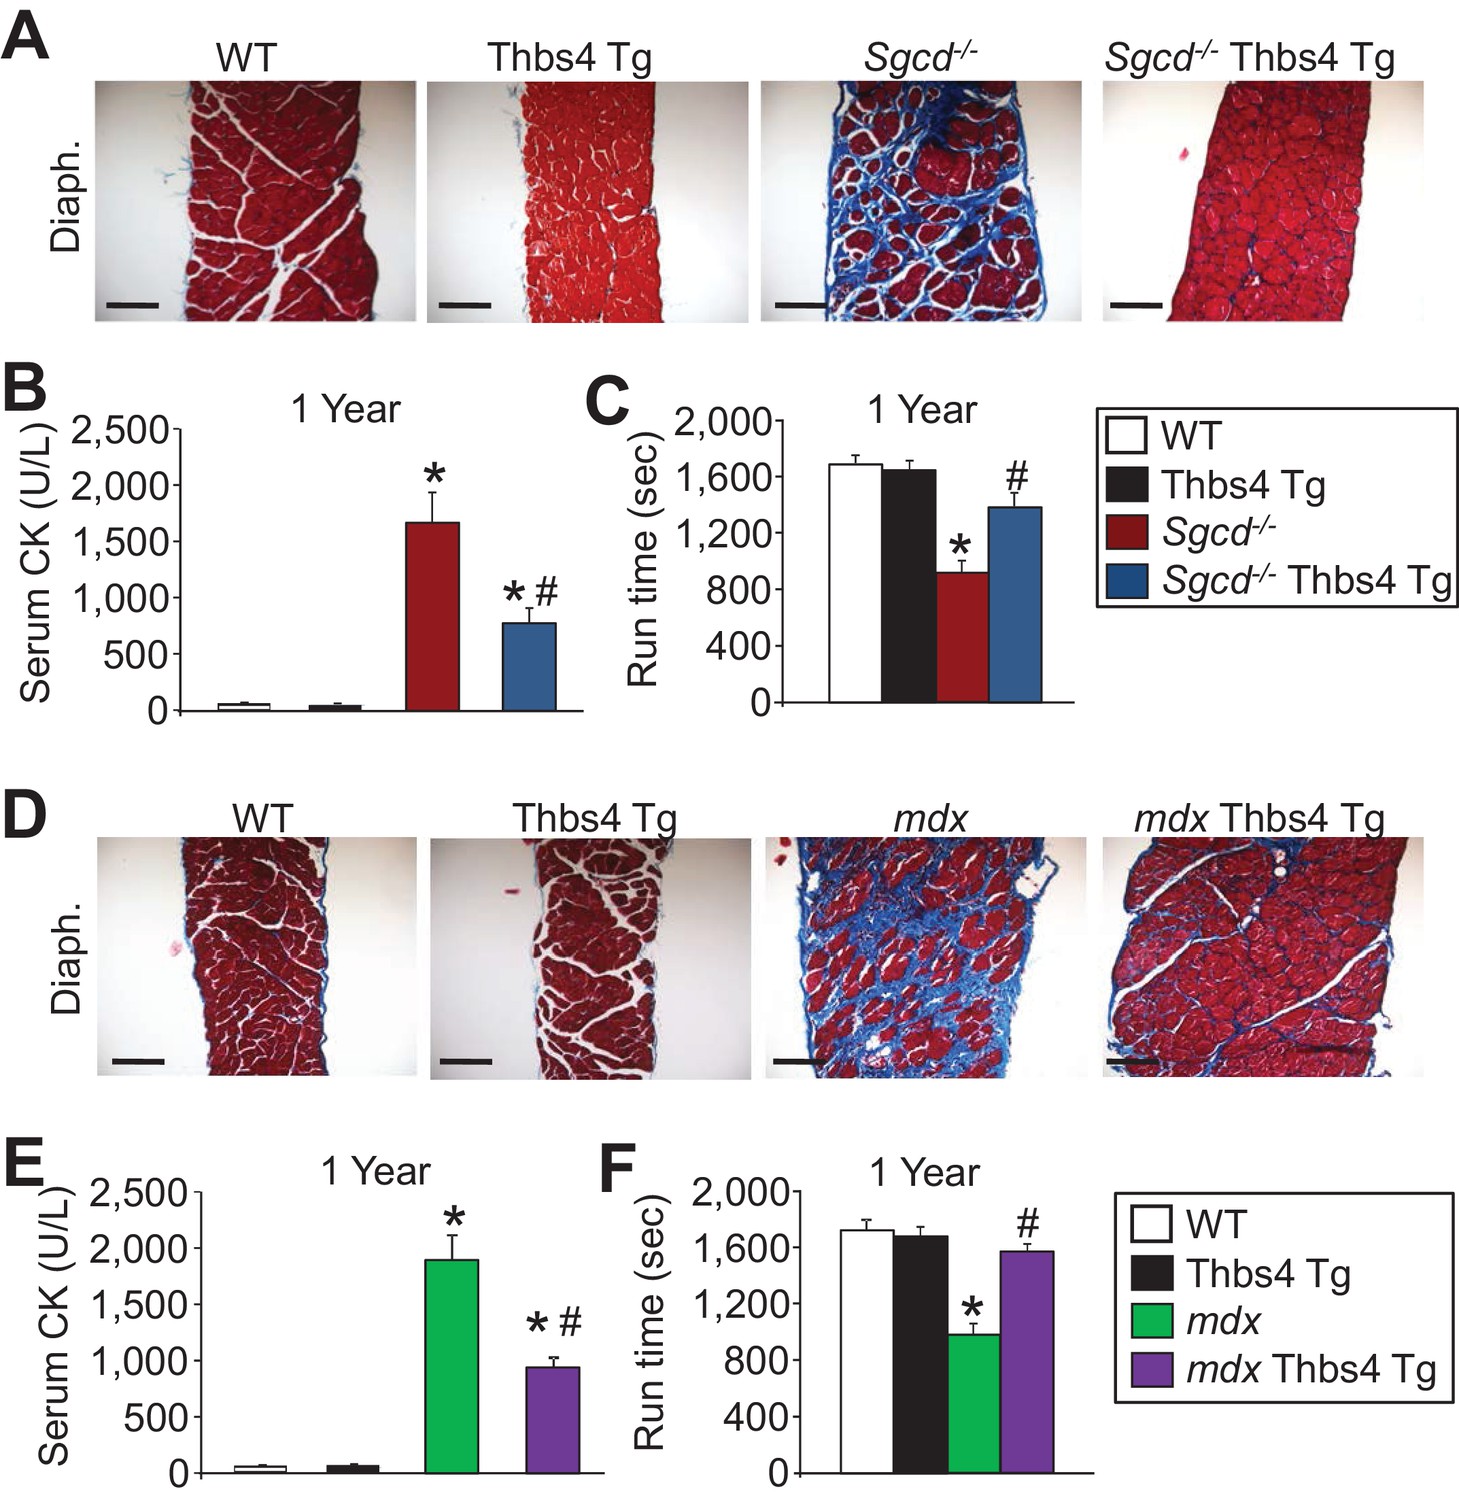
Thbs4 overexpression mitigates muscular dystrophy in Sgcd-/- and mdx mice with aging to one year.
(A) Masson’s trichrome-stained histological sections of quadriceps (Quad.) and diaphragm (Diaph.) from WT, Thbs4-Tg, Sgcd-/- and Sgcd-/-Thbs4-Tg mice at one year of age. Blue color represents fibrosis. Representative images of 6 mice per genotype are shown. Scale bars = 100 μm. (B,C) Quantitation of serum creatine kinase (CK) levels (units/liter) and time to fatigue in seconds with forced downhill treadmill running for the indicated genotypes at one year of age. For panel B, n = 9 mice for WT, n = 8 mice for Thbs4 Tg, n = 6 mice for Sgcd-/- and n = 7 mice for Sgcd-/-Thbs4 Tg; and for panel C, n = 5 mice for WT and Thbs4 Tg, and n = 6 mice for Sgcd-/- and Sgcd-/-Thbs4 Tg. Data are presented as mean ± SEM; *p<0.05 vs WT; #p<0.05 vs. Sgcd-/- by one-way ANOVA with post hoc Tukey’s test. (D) Masson’s trichrome stained histological sections of quadriceps (Quad.) and diaphragm (Diaph.) from WT, Thbs4-Tg, mdx and mdx Thbs4-Tg mice at one year of age. Blue color represents fibrosis. Representative images of 6 mice per genotype are shown. Scale bars = 100 μm. (E,F) Quantitation of serum CK levels (units/liter) and time to fatigue in seconds with forced downhill treadmill running for the indicated genotypes at one year of age. For panel E, n = 9 mice for WT, n = 8 mice for Thbs4 Tg, n = 10 mice for mdx and n = 6 mice for mdx Thbs4 Tg. For panel F, n = 5 mice for WT and Thbs4 Tg, n = 7 mice for mdx and n = 6 mice for mdx Thbs4 Tg. Data are presented as mean ± SEM; *p<0.05 vs WT; #p<0.05 vs. mdx by one-way ANOVA with post hoc Tukey’s test.
Figure 2—figure supplement 2
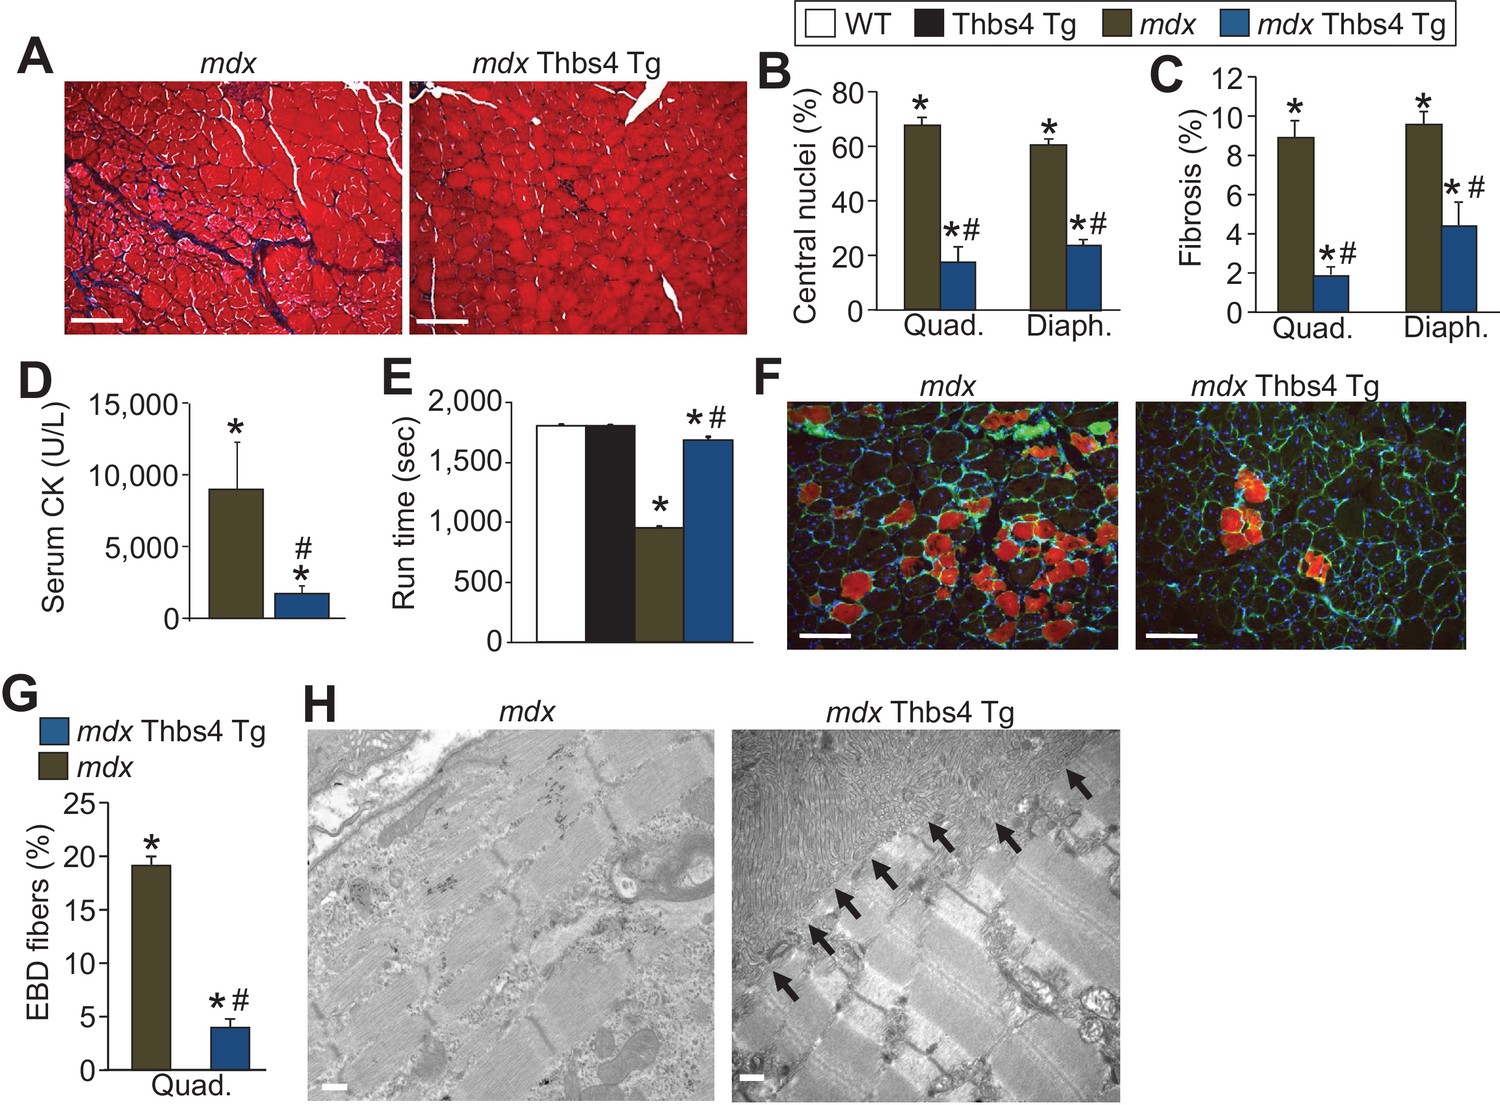
Thbs4 overexpression mitigates MD in mdx mice at three months of age.
(A) Masson’s trichrome histological staining of mdx and mdx Thbs4 Tg quadriceps at three months of age. Blue areas represent fibrosis. Representative images of 6 mice for mdx and 7 mice for mdx Thbs4 Tg are shown. Scale bars = 100 μm. (B) Percentage of myofibers with centrally located nuclei in histological sections from quadriceps (Quad) and diaphragm (Diaph) in the indicated groups of mice at three months of age. Representative images are shown in Figure 2—figure supplement 3. N = 6 mice for WT and Thbs4 Tg, n = 7 mice for mdx and n = 8 mdx Thbs4 Tg. *p<0.05 vs WT; #p<0.05 vs. mdx by one-way ANOVA with post hoc Tukey’s test. Data are presented as mean ± SEM. (C) Interstitial fibrosis analyzed in Quad and Diaph from histological sections at three months of age in the indicated groups of mice. N = 7 mice for WT and mdx Thbs4 Tg, n = 6 mice for Thbs4 Tg and mdx. *p<0.05 vs WT; #p<0.05 vs. mdx by one-way ANOVA with post hoc Tukey’s test. Data are presented as mean ± SEM. (D) Quantitation of serum CK levels (units/liter) in the indicated genotypes of mice at three months of age. n = 7 mice for mdx and n = 6 mdx Thbs4 Tg. *p<0.05 vs WT; #p<0.05 vs. mdx by one-way ANOVA with post hoc Tukey’s test. Data are presented as mean ± SEM. (E) Time to fatigue in seconds with forced downhill treadmill running at three months of age in the indicated genotypes of mice. N = 6 for indicated genotypes. *p<0.05 vs WT; #p<0.05 vs. mdx by one-way ANOVA with post hoc Tukey’s test. Data are presented as mean ± SEM. (F,G) Representative immunofluorescent images and quantitation of total Evan’s blue dye (EBD) uptake and positive fibers (red) in Quad in three month-old mice subjected to downhill running for 30 min during a 24 hr period of time when EBD is circulating in the mouse. Membranes of myofibers are shown in green. Scale bars = 75 μm. n = 6 for indicated genotypes. *p<0.05 vs WT; #p<0.05 vs. mdx by one-way ANOVA with post hoc Tukey’s test. Data are presented as mean ± SEM. (H) Transmission electron microscopy of quadriceps showing preservation of muscle architecture with a dramatic sub-sarcolemmal accumulation of ER and vesicles (arrows) in mdx Thbs4-Tg mice, compared with noticeable disease and few vesicles in mdx. Representative images of 2 mice per genotype are shown. Scale bar: 500 nm.
Figure 2—figure supplement 3

In depth imaging of H&E sections showing how Thbs4 overexpression reduces myofiber degeneration-regeneration (central nucleation) in both Sgcd-/-and mdx dystrophic quadriceps.
(A, B) representative images and higher magnification inset from H&E-stained histology from quadriceps at three months of age from the indicated genotypes (Scale bar = 100 μm and 50 μm, respectively). Note the significant reduction in myofiber degeneration-regeneration cycles marked by reduced centrally located nuclei upon overexpression of Thbs4 in both Sgcd-/- and mdx quadriceps. Quantification is shown in Figure 2C and Figure 2—figure supplement 2B.
Figure 2—figure supplement 4
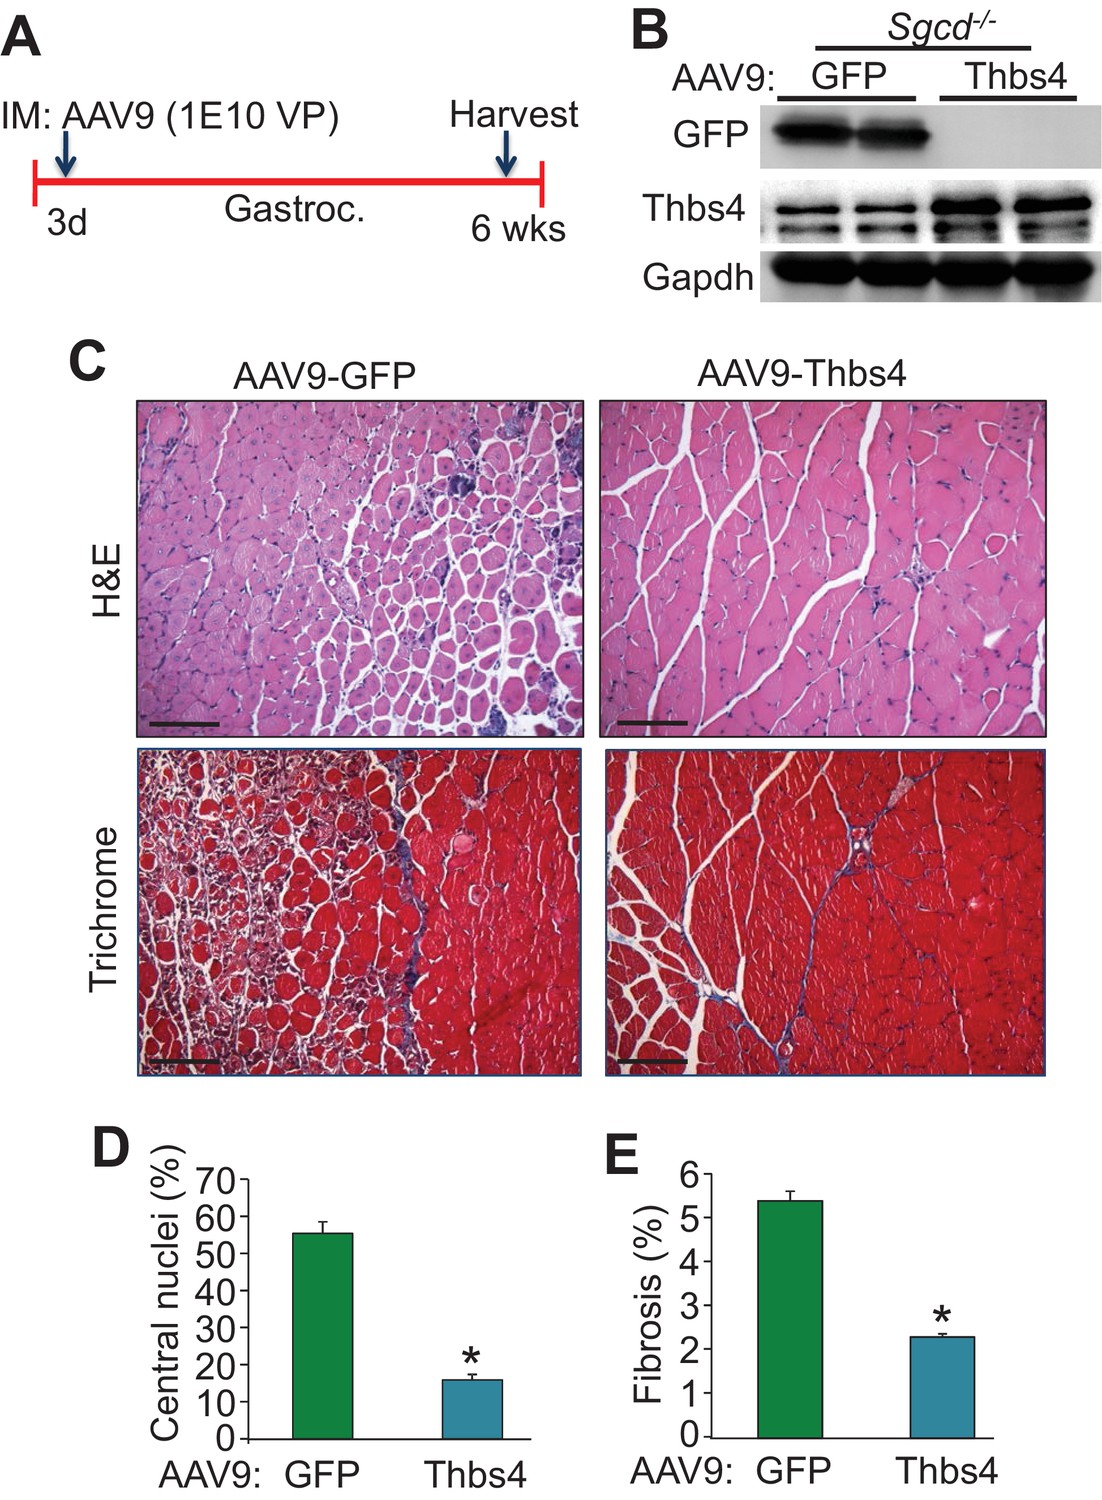
Intramuscular AAV9-mediated overexpression of Thbs4 mitigates MD in Sgcd-/- mice.
(A) Separate three day-old Sgcd-/-mouse pups were injected in the gastrocnemius (Gastroc.) with 1E10 viral particles of either adeno-associated virus 9 (AAV9)-Thbs4 or AAV9-eGFP control. The gastroc. was then harvested at six weeks of age for further analysis. (B) Representative Western blots showing robust overexpression of eGFP or Thbs4 (Gapdh as loading control, n = 3 biological replicates) in Sgcd-/-gastrocnemius treated with AAV9-eGFP or AAV9-Thbs4, respectively. (C) Representative H&E and Masson’s trichrome-stained histological sections from Sgcd-/- gastrocnemius (Gastroc.) treated with control AAV9-eGFP or experimental AAV9-Thbs4 at six weeks of age (separate mice). Representative images of 5 mice per genotype are shown. Scale bar = 100 μm. (D,E) Percent myofiber central nucleation and fibrosis from histological sections of the gastrocnemius taken from Sgcd-/- mice six weeks after AAV9-Thbs4 or control AAV9-eGFP treatment. n = 5 mice per treatment group. Data are represented as mean ± SEM; *p<0.05 vs. eGFP by Student’s t test.
Figure 3 with 1 supplement
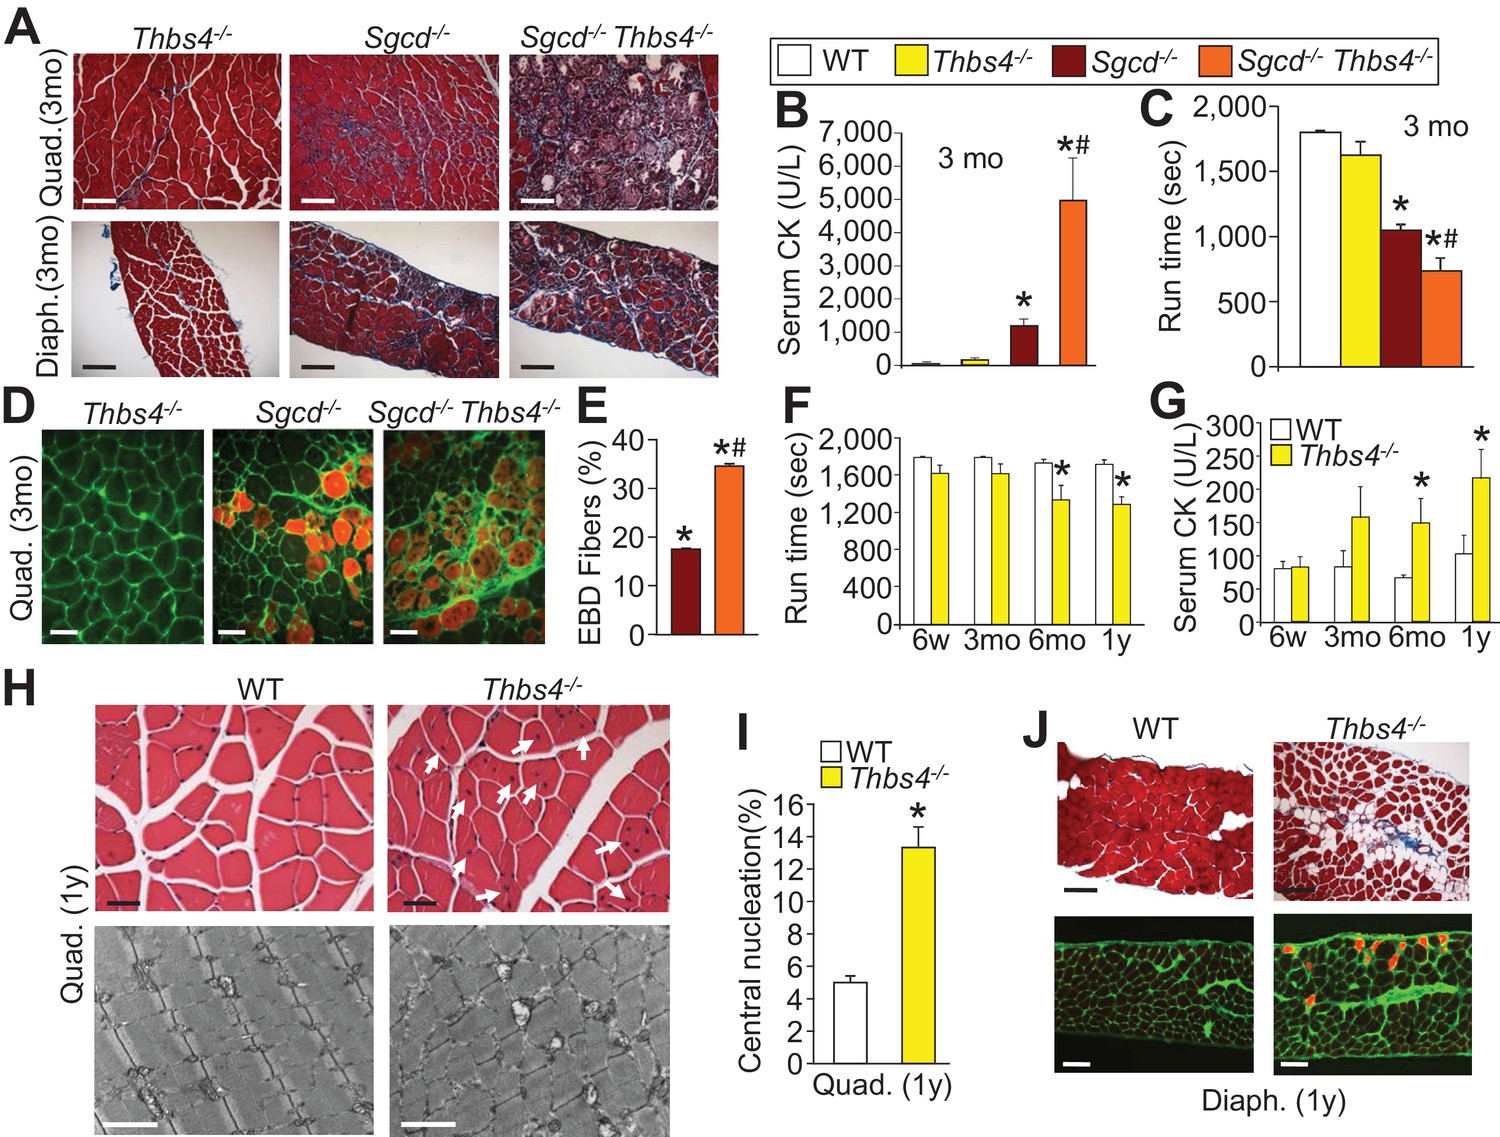
Loss of Thbs4 induces and exacerbates MD in mice.
(A) Masson’s trichrome stained histological sections of Quad and Diaph at three months (mo) of age in Thbs4-/-, Sgcd-/- and Sgcd-/-Thbs4-/- mice. Representative images of 6 mice for WT and Thbs4 Tg mice and 8 mice for Sgcd-/-and Sgcd-/-Thbs4 Tg. Scale bar = 100 μm. (B) Quantitation of serum CK (units/liter) in the indicated genotypes shown in the legend, at 3 mo of age. *p<0.05 vs. WT; #p<0.05 vs Sgcd-/- by one-way ANOVA with post hoc Tukey’s test. N = 5 mice for WT and n = 6 mice for Thbs4-/-, Sgcd-/- and Sgcd-/-Thbs4-/-. (C) Time to fatigue in seconds with forced downhill treadmill running in mice at three months of age. *p<0.05 vs. WT; #p<0.05 vs. Sgcd-/- by one-way ANOVA with post hoc Tukey’s test. N = 5 mice per genotype. The legend above panels B and C applies to the remainder of the figure. (D,E) Representative immunofluorescent images of EBD (red fluorescence) uptake and quantitation in Quad histological sections from three month-old mice. Membranes of myofibers are shown in green. *p<0.05 vs WT; #p<0.05 vs. Sgcd-/- by one-way ANOVA with post hoc Tukey’s test. N = 5 and 6 mice for Sgcd-/- and Sgcd-/-Thbs4-/-, respectively. Scale bar = 40 μm. (F,G) Time to fatigue in seconds with forced downhill treadmill running and quantitation of serum CK levels in WT and Thbs4-/- mice at the indicated ages; abbreviations, y = year. n = 6 mice per genotype per age for panel F. For panel G, n = 7 mice per genotype at six weeks of age; n = 5 WT and 6 Thbs4-/-mice at three months of age, n = 5 mice per genotype at six months of age and n = 9 WT and 8 Thbs4-/-mice at one year of age. *p<0.05 vs WT at the same age by Student’s t test. (H) H&E histological staining (upper) and transmission electron microscopy (lower) of tissue pathology in Quad at one year of age in WT and Thbs4-/-mice. The H&E scale bar = 25 μm. The electron microscopy scale bar = 2 μm. The arrows show myofibers with central nucleation due to loss of the Thbs4 gene. Representative images of 6 mice per genotype for H&E staining and 2 mice per genotype for electron microscopy. (I) Percentage of myofibers with centrally located nuclei in Thbs4-/- compared to WT Quad at one year of age. *p<0.001 vs WT by Student’s t test. n = 6 mice per genotype. (J) Masson’s trichrome stained (upper) and EBD uptake (lower) histological images in WT and Thbs4-/-mice in the Diaph at one year of age. The EBD images show membranes in green and fibers with EBD uptake produce red fluorescence. Representative images of 6 mice per genotype studied. Scale bars = 50 μm. All data are represented as mean ± SEM.
Figure 3—figure supplement 1
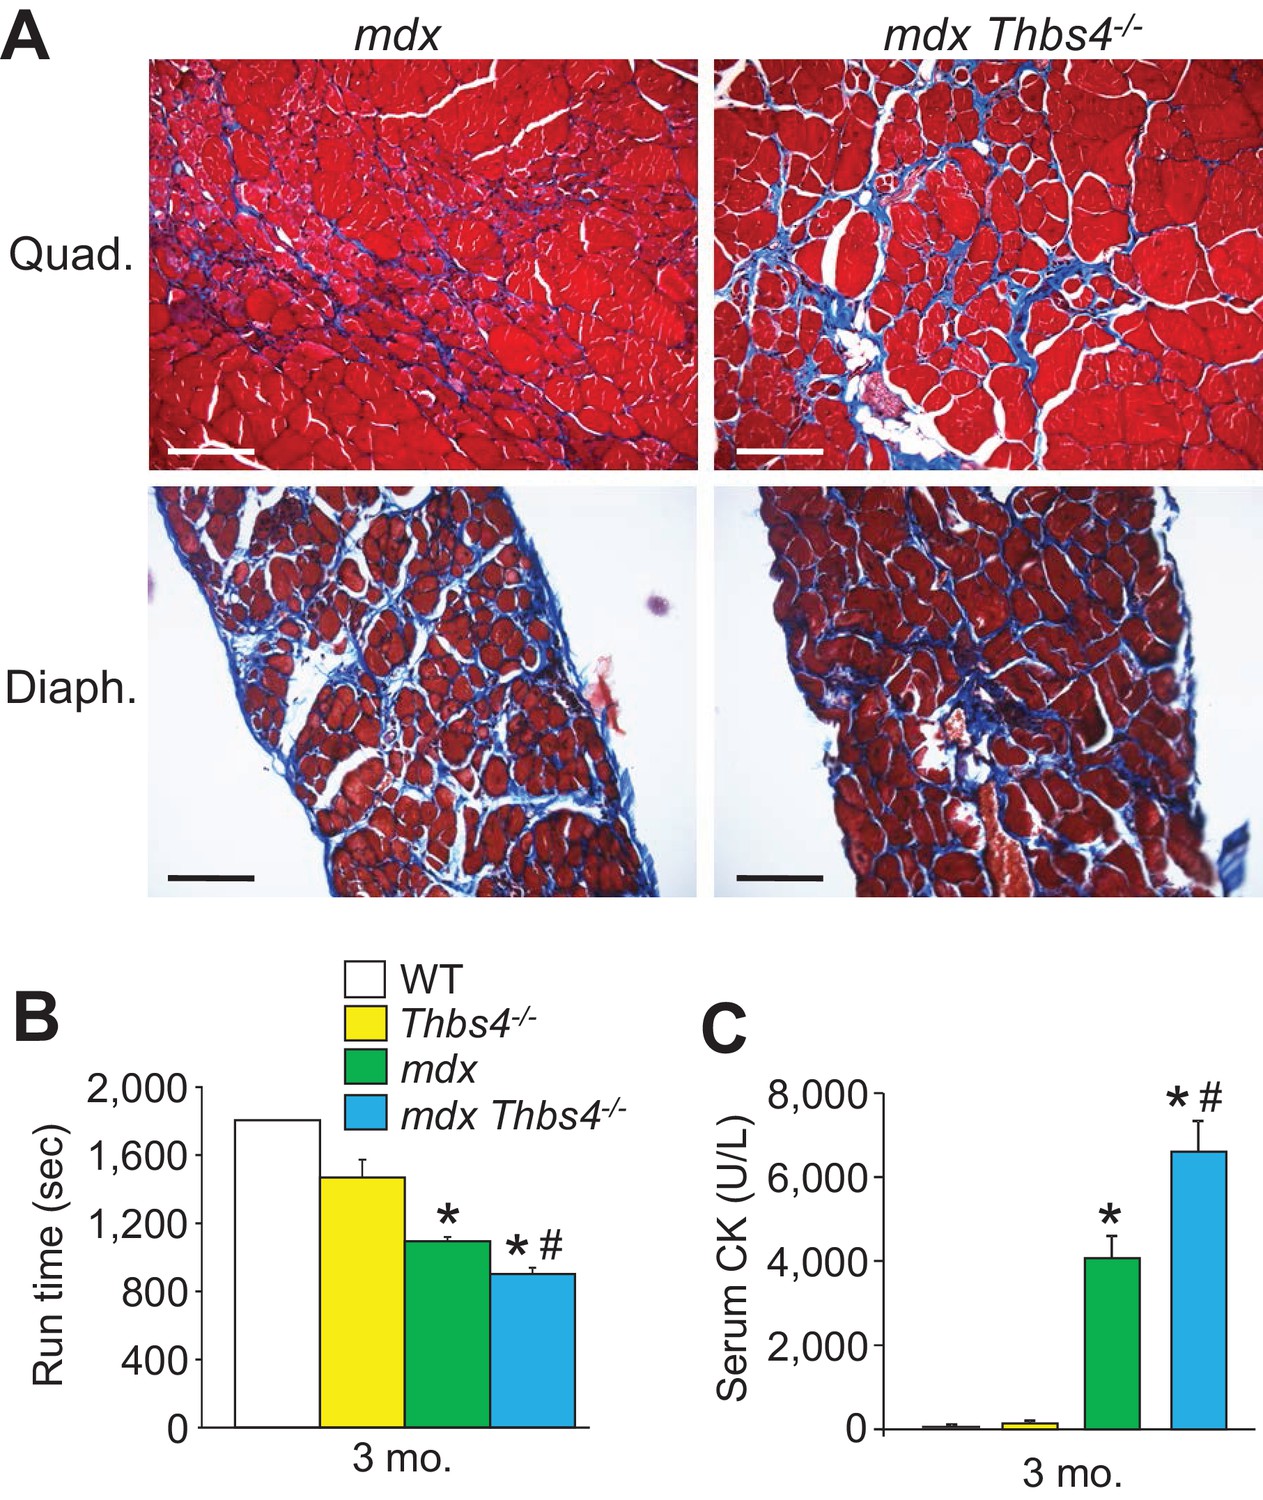
Thbs4-/- mice show enhanced MD pathology in the mdx background.
(A) Masson’s trichrome-stained histological sections of quadriceps (Quad) and diaphragm (Diaph) from mdx and mdx Thbs4-/- mice at three months of age. Blue staining shows fibrosis. Representative images of 6 mice per genotype are shown. Scale bars = 100 μm. (B) Time to fatigue in seconds with forced downhill treadmill running of the indicated genotypes of mice at three months of age. n = 6 mice per genotype. *p<0.05 vs WT and Thbs4-/-; #p<0.05 vs. mdx by one-way ANOVA with post hoc Tukey’s test. Data are presented as mean ± SEM. (C) Quantitation of serum CK (units/liter) levels in the indicated genotypes of mice at three months of age. n = 9 mice for WT and n = 6 mice for Thbs4-/-, mdx, and mdx Thbs4-/-. *p<0.05 vs WT and Thbs4-/-; #p<0.05 vs. mdx by one-way ANOVA with post hoc Tukey’s test. Data are presented as mean ± SEM.
Figure 4 with 1 supplement
Thbs4 regulates skeletal muscle sarcolemma stability.
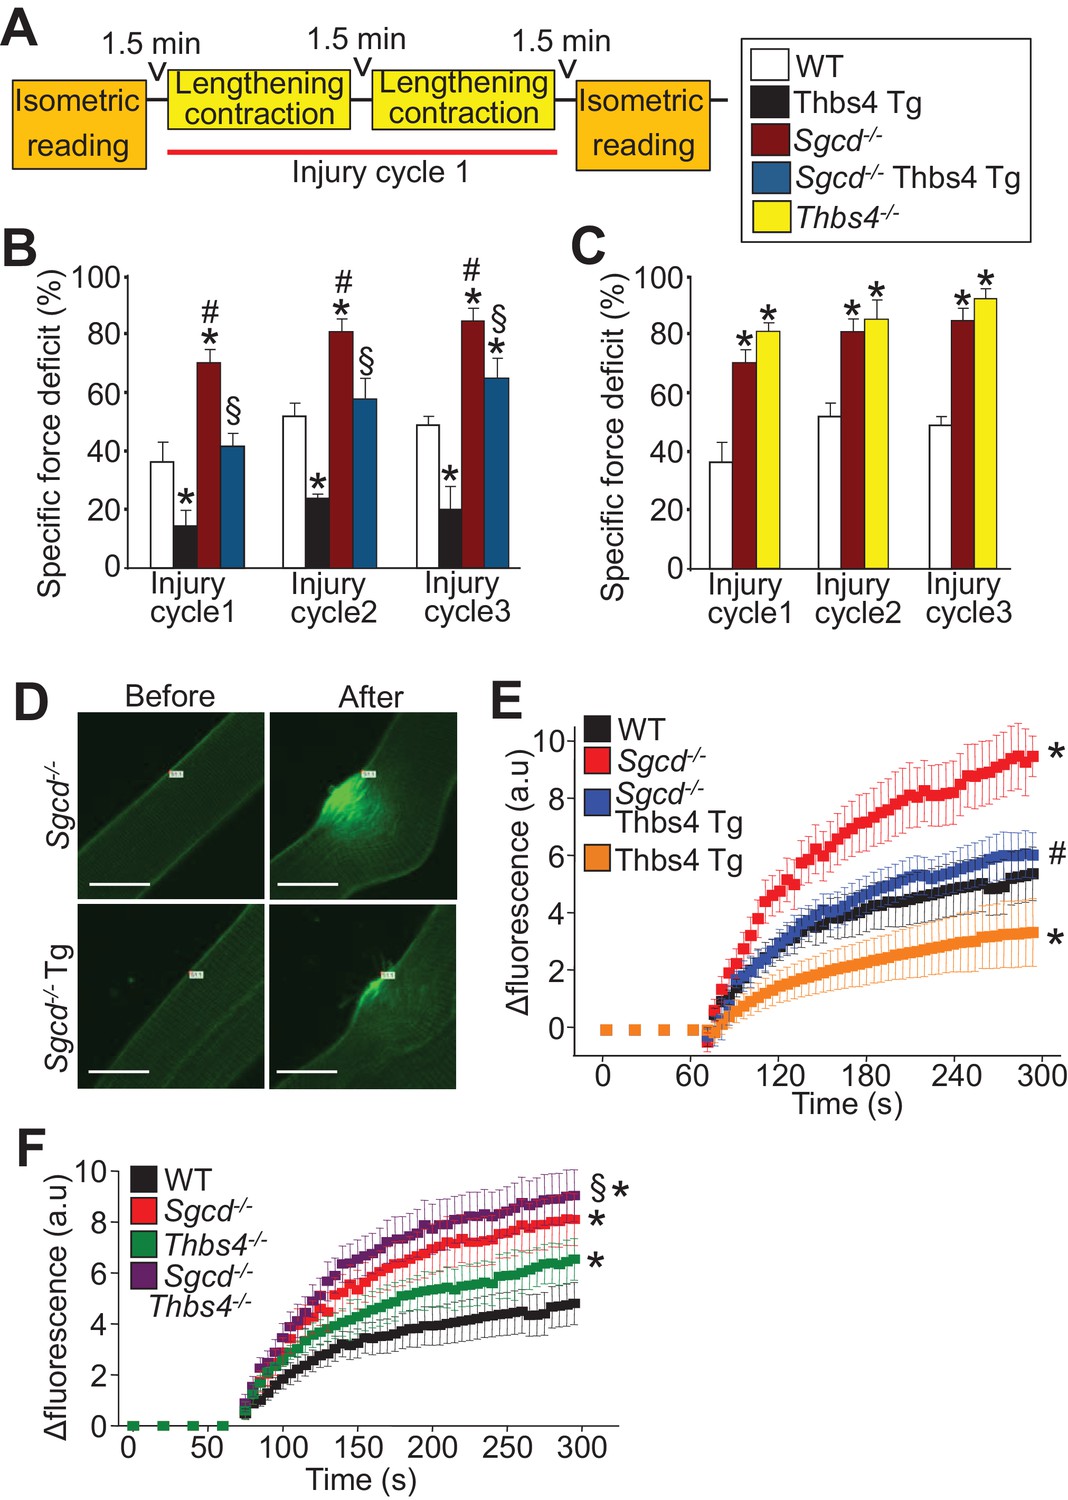
(A) Schematic representing the first of 3 consecutive lengthening contraction-induced muscle injury cycles using an in situ tibialis anterior (TA) muscle preparation. Briefly, an isometric contraction was performed to determine baseline force generation, followed by 2 consecutive eccentric contractions and finally another isometric contraction (= injury cycle 1). The force deficit shown in panels B and C was calculated between the first and second isometric contraction in between the two lengthening-contractions, which was repeated 3 cycles total. (B,C) Reduction in isometric force generation as a percentage of baseline force after each lengthening contraction injury cycle in the indicated genotypes of mice shown in the legend. *p<0.05 vs WT; #p<0.05 vs WT and Thbs4-Tg; §P<0.05 vs Sgcd-/-and Thbs4-Tg by one-way ANOVA with post hoc Tukey’s test. n = 6 mice for WT, Thbs4 Tg and Sgcd-/-Thbs4 Tg and n = 10 mice for Sgcd-/- for panel B. n = 6 mice for WT, n = 10 mice for Sgcd-/- and n = 5 mice for Thbs4-/- for panel C. (D) Representative images before and after laser injury and influx of FM1-43 dye (green fluorescence) in FDB myofibers in the presence of 1.25 mM Ca2+ isolated from indicated genotypes. The white tag in each image is the position for the laser injury. Scale bars = 10 μm. (E,F) Quantitative time course in seconds of FM1-43 fluorescent dye entry in FDB myofibers from the indicated genotypes of mice in the presence of 1.25 mM Ca2+. Laser injury occurred at 60 s. n = 6 fibers per animal from 3 animals per genotype for panels D–F; *p<0.05 vs WT; #p<0.05 vs Sgcd-/-; §p<0.05 vs Thbs4-/- by one-way ANOVA with post hoc Tukey’s test. Data points for Sgcd-/-in panel E and F were derived from a single set of experiments. All data are represented as mean ± SEM.
Figure 4—figure supplement 1

Thbs4 alters the mechanical and structural properties of muscle and tendons.
(A) Passive tibialis anterior (TA) muscle elasticity measured prior to the lengthening contraction protocol in WT (n = 6), Thbs4 Tg (n = 6) and Thbs4-/-mice (n = 12). *p<0.05 compared WT by Student’s t test. Data are presented as mean ± SEM. (B) Specific isometric force generation averaged over 5 contractions at L0 from in situ TA preparations for the indicated genotypes. n = 6 mice for WT, Thbs4 Tg, and Sgcd-/- Thbs4 Tg, n = 10 mice for Sgcd-/-, n = 5 for Thbs4-/- and n = 8 for Sgcd-/-Thbs4-/-. p-value is not significant by one-way ANOVA with post hoc Tukey’s test. Data are presented as mean ± SEM. (C) Percentage of tendon breaks recorded during the during the lengthening contraction protocol in WT, Thbs4-/-and Sgcd-/-Thbs4-/- mice. Tendon breaks were assessed by complete physical rupture of the tendon at the muscle aponeurosis. n = 6 for WT, n = 10 for Sgcd-/-, and n = 12 for Thbs4-/- and for Sgcd-/-Thbs4-/-.
Figure 5 with 1 supplement
Thbs4 enhances intracellular vesicular trafficking through its ATF6α interacting region.
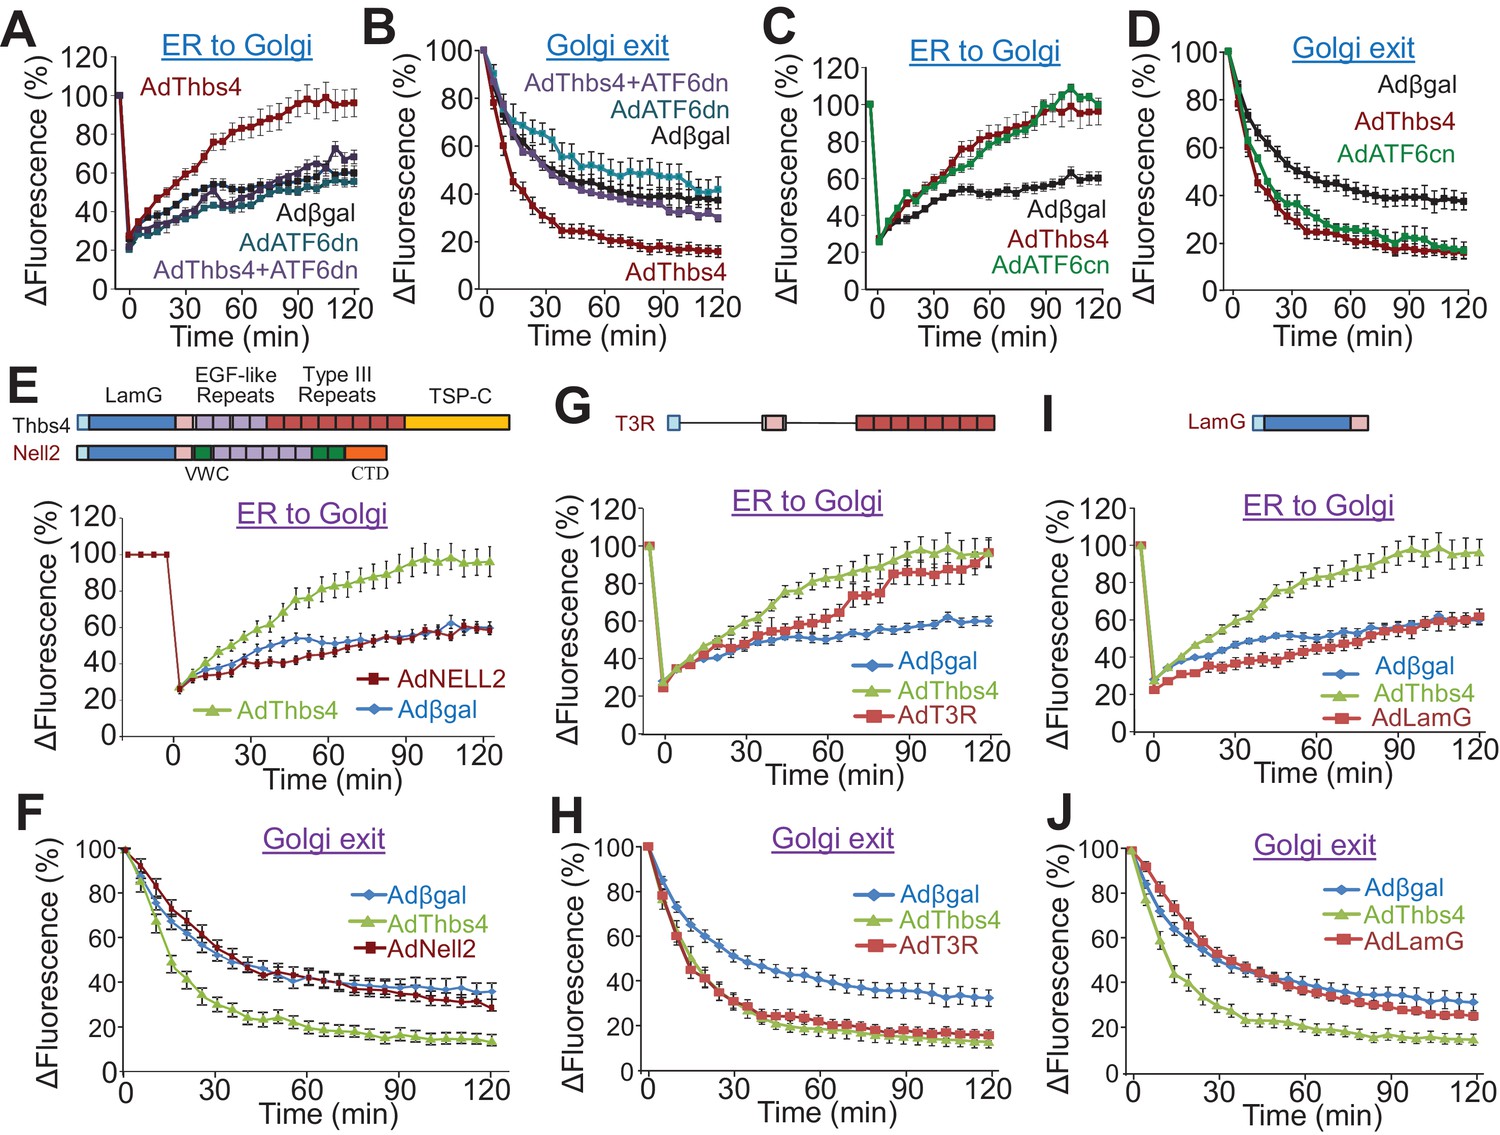
(A–D) Time course of GalNac-T2-RFP or VSVG-eGFP fluorescence changes in cultured neonatal ventricular myocytes infected with the indicated adenoviruses to overexpress Thbs4 (maroon line, n = 18), a dominant negative (dn) ATF6α (turquoise line, n = 8) or in combination with Thbs4 (purple line, n = 13), a constitutively nuclear (cn) ATF6α (green line, n = 12), or βgal expressing control (black line, n = 14). Change in fluorescence was after FRAP or iFRAP to measure ER-to-Golgi or Golgi to the membrane trafficking, respectively. (E,G,I) Quantitative time course of GalNac-T2-RFP recovery in the Golgi network after FRAP to measure ER to Golgi vesicular trafficking in primary neonatal rat ventricular myocytes infected with adenoviral Thbs4 (green line, n = 18), Nell2 (red line, n = 9), the Type III repeat (AdT3R; red line, n = 8) domain of Thbs4, the N-terminal Laminin G (AdLamG, red line, n = 7) domain of Thbs4, or βgal control (blue line, n = 14). Shown above these graphs is a schematic diagram depicting the domain structure of Thbs4, Nell2 and T3R or LamG of Thbs4. All data are represented as mean ± SEM. (F,H,J) Quantitative time course of loss of VSVG-eGFP fluorescence in the Golgi after iFRAP as a measurement for Golgi-to-membrane (Golgi exit) vesicular trafficking in primary neonatal rat ventricular myocytes infected with adenoviral Thbs4 (green line, n = 18), Nell2 (red line, n = 8), the Type III repeat (AdT3R; red line, n = 8) domain of Thbs4, the N-terminal Laminin G (AdLamG; red line, n = 7), or βgal control (blue line, n = 14). All data are represented as mean ± SEM. Each cell imaged per experimental condition represents an independent experiment.
Figure 5—figure supplement 1
Thbs4 enhances intracellular vesicular trafficking.
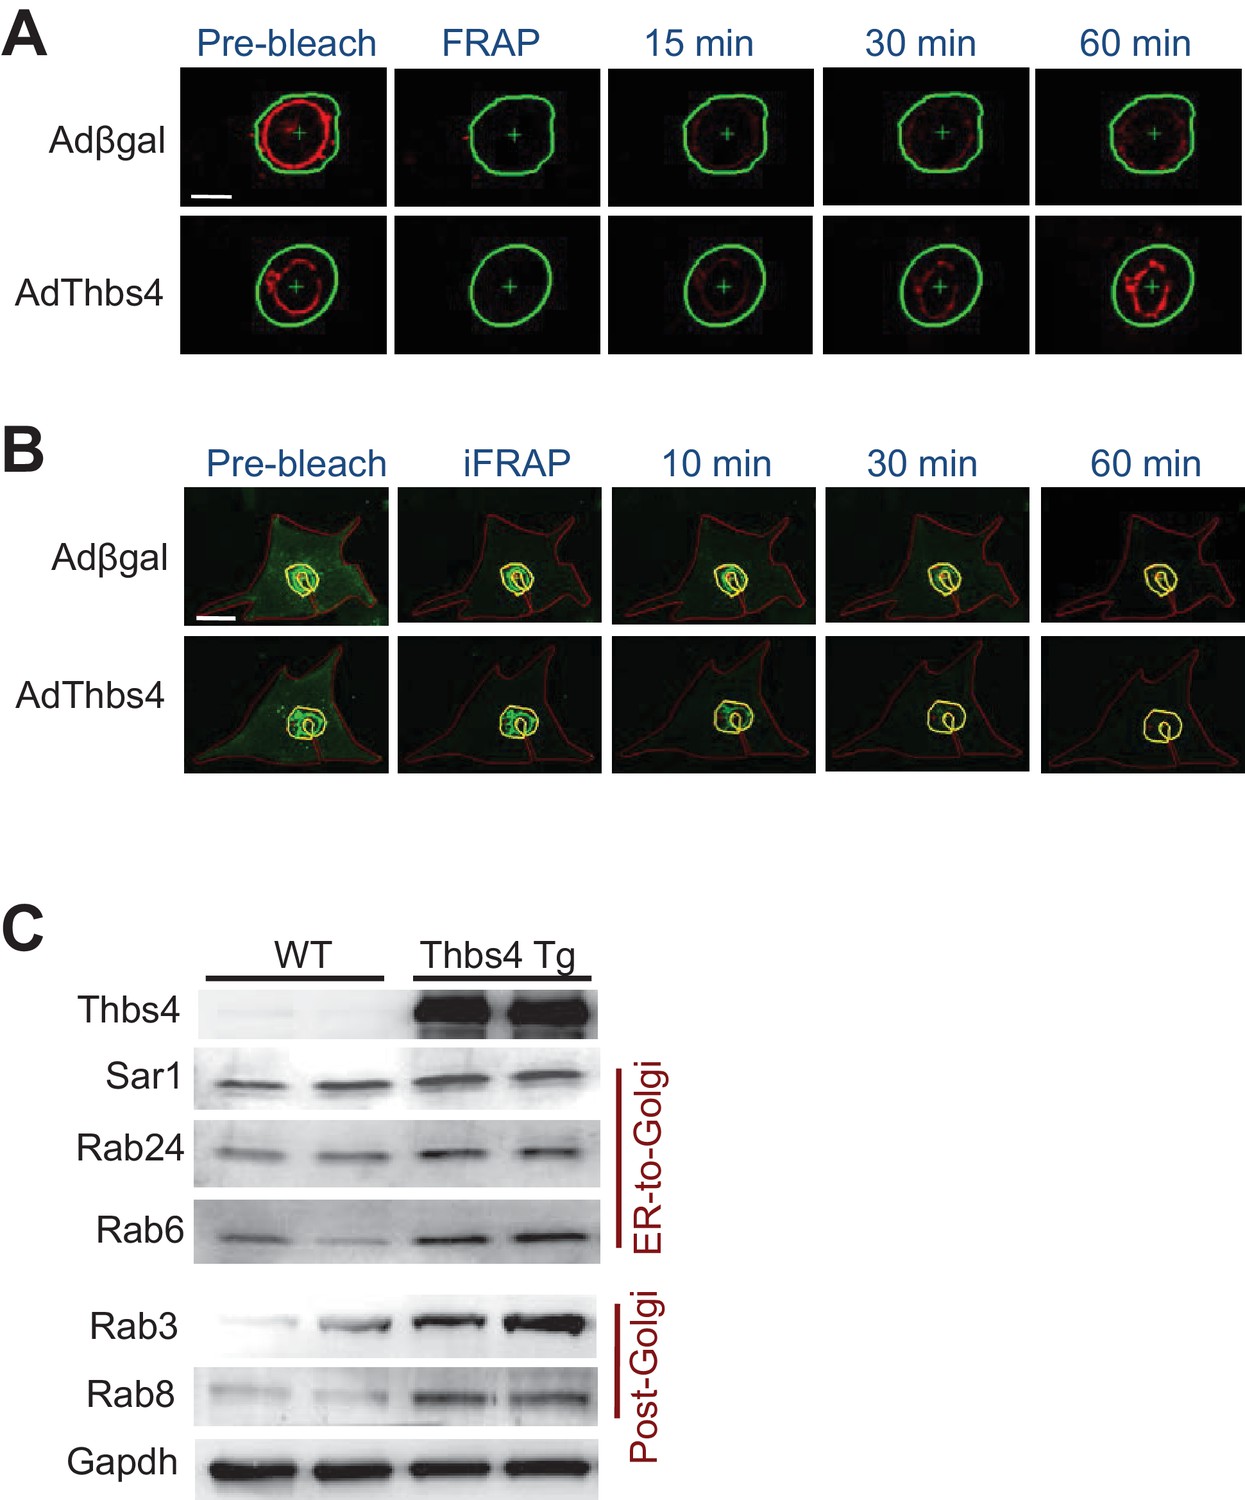
(A) Representative images showing the recovery of GalNacT2-RFP fluorescence (red) into the photobleached Golgi network (FRAP; outlined green area) over time in primary neonatal rat ventricular myocytes infected with an adenovirus expressing Thbs4 (AdThbs4) or a βgal control. Recovery of Golgi fluorescence was monitored as a measure for ER-to-Golgi vesicular trafficking. Scale bar = 10 μm. (B) Representative images of VSVG-eGFP fluorescence (green) before and after inverse FRAP (iFRAP, outlined area, red) in primary neonatal rat ventricular myocytes. Adenovirus expressing Thbs4 or βgal (control) were used. Reduction in Golgi fluorescence (outlined in yellow) was monitored as a measure for Golgi-to-membrane vesicular trafficking. Scale bar = 25 μm. (C) Western blots from quadriceps muscle of WT and Thbs4 Tg mice for vesicular markers associated with ER to Golgi trafficking: Sar1, Rab24 and Rab6, and vesicular markers associated with Golgi-to-membrane trafficking (secretory vesicles): Rab3 and Rab8 (n = 3 biological replicates). Gapdh is presented as processing and loading control.
Figure 6 with 1 supplement
Thbs4 enhances stabilizing proteins at the sarcolemma.
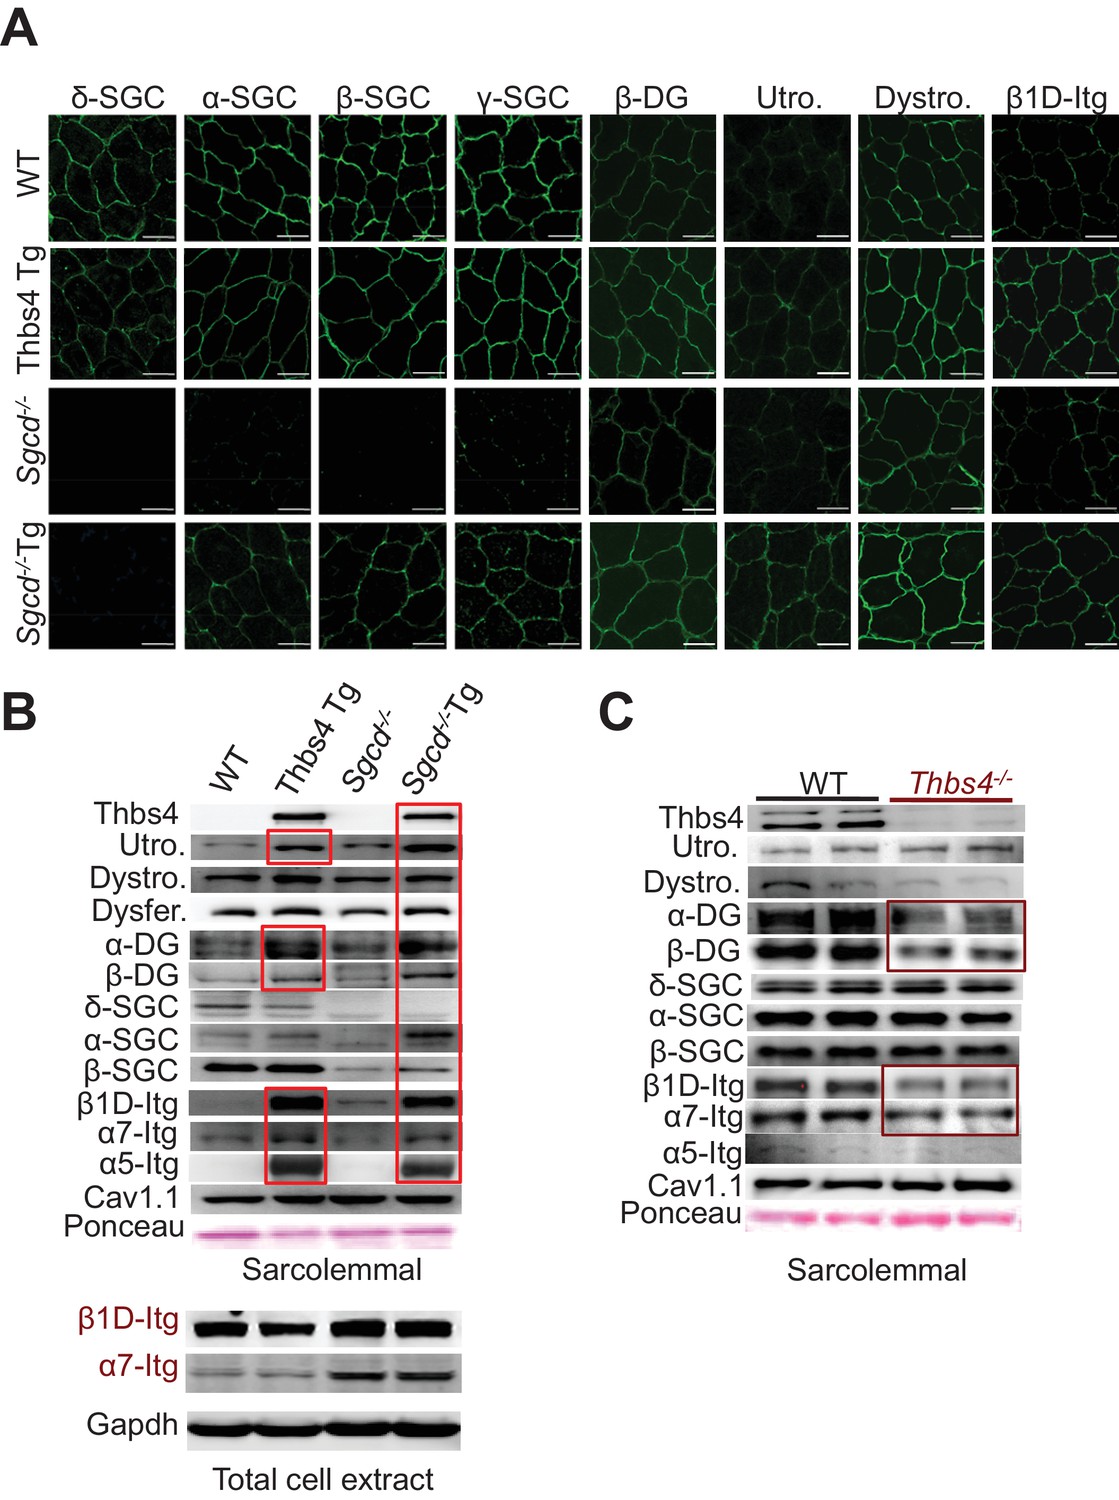
(A) Immunofluoresence (green) detection of δ-, α-, β-, and γ-sarcoclycan (SGC), β-dystroglycan (β-DG), utrophin (Utro.), dystrophin (Dystro.) and β1D-integrin in littermates of three month-old WT, Thbs4-Tg, Sgcd-/- and Sgcd-/-Thbs4-Tg quadriceps. Representative images of 4 mice per genotype are shown. Scale bar = 25 μm. (B) Representative Western blots of sarcolemmal protein extracts (upper) or total cytoplasmic protein extracts (lower) from the quadriceps of the indicated groups of mice for the indicated proteins (n = 4–5 biological replicates). Abbreviations: Utro, utrophin; Dystro, dystrophin; Dysfer, dysferlin; α-DG, α-dystroglycan; β-DG, β-dystroglycan; δ-SCG, δ-sarcoglycan; α-SCG, α-sarcoglycan; β-SGC, β-sarcoglycan; β1D-, α7- and α5- integrin. The red boxes show increased protein levels. Also see Figure 6—figure supplement 1 for replicates. (C) Representative immunoblotting for structural components of the DGC- and integrin-associated protein complexes in sarcolemmal preparations from Thbs4-/- and WT quadriceps at four months of age (n = 4 biological replicates). The burgundy-boxed areas show reduced protein levels. Ponceau staining of a nonspecific band and dihydropyridine receptor α1 (Cav1.1) were used as loading controls for sarcolemmal protein extracts; Gapdh was used as loading control for total cell protein extracts.
Figure 6—figure supplement 1

Thbs4 enhances stabilizing proteins at the sarcolemma and directly interacts with integrins.
(A,B) Representative Western blots of sarcolemmal protein extracts from the quadriceps of the indicated groups of mice at three months of age (n = 4–5 biological replicates). Sgcd-/- Tg and mdx Tg indicate Sgcd-/- and mdx with skeletal muscle specific Thbs4 overexpression, respectively. Ponceau staining of a nonspecific band and dihydropyridine receptor α1 (Cav1.1) were used as loading controls. Abbreviations: Utro, utrophin; Dystro, dystrophin; Dysfer, dysferlin; α-DG, α-dystroglycan; β-DG, β-dystroglycan; δ-SCG, δ-sarcoglycan; α-SCG, α-sarcoglycan; β-SGC, β-sarcoglycan; β1D-, α7- and α5-itg (integrin). (C) Immunoblots for β1D- and α7-Integrin (Itg), β-dystroglycan (DG) and Thbs4 (Flag) from neonatal rat ventricular myocyte extracts immunoprecipitated with a Flag antibody (Thbs4). Adβgal was used as a control infection (n = 3 biological replicates). An adenovirus expressing a Flag-tagged Thbs4 protein was used to achieve high level of this protein to identify the interaction. (D,E) Representative Western blots for Thbs4, α5- and β1D-integrin (itg) from intracellular vesicular isolates from WT and Thbs4 Tg quadriceps (D) or WT and Sgcd-/-quadriceps (E) that were immunoprecipitated with an antibody raised against the cytoplasmic domain of β1D-integrin (n = 3 biological replicates), showing that Thbs4 and α5-integrin localize to β1D-integrin-positive intracellular vesicles. α-tubulin and Gapdh are presented as loading control.
Figure 7 with 3 supplements

Skeletal muscle specific ATF6α overexpression drives ER stress and intracellular vesicular expansion, but not protection against MD.
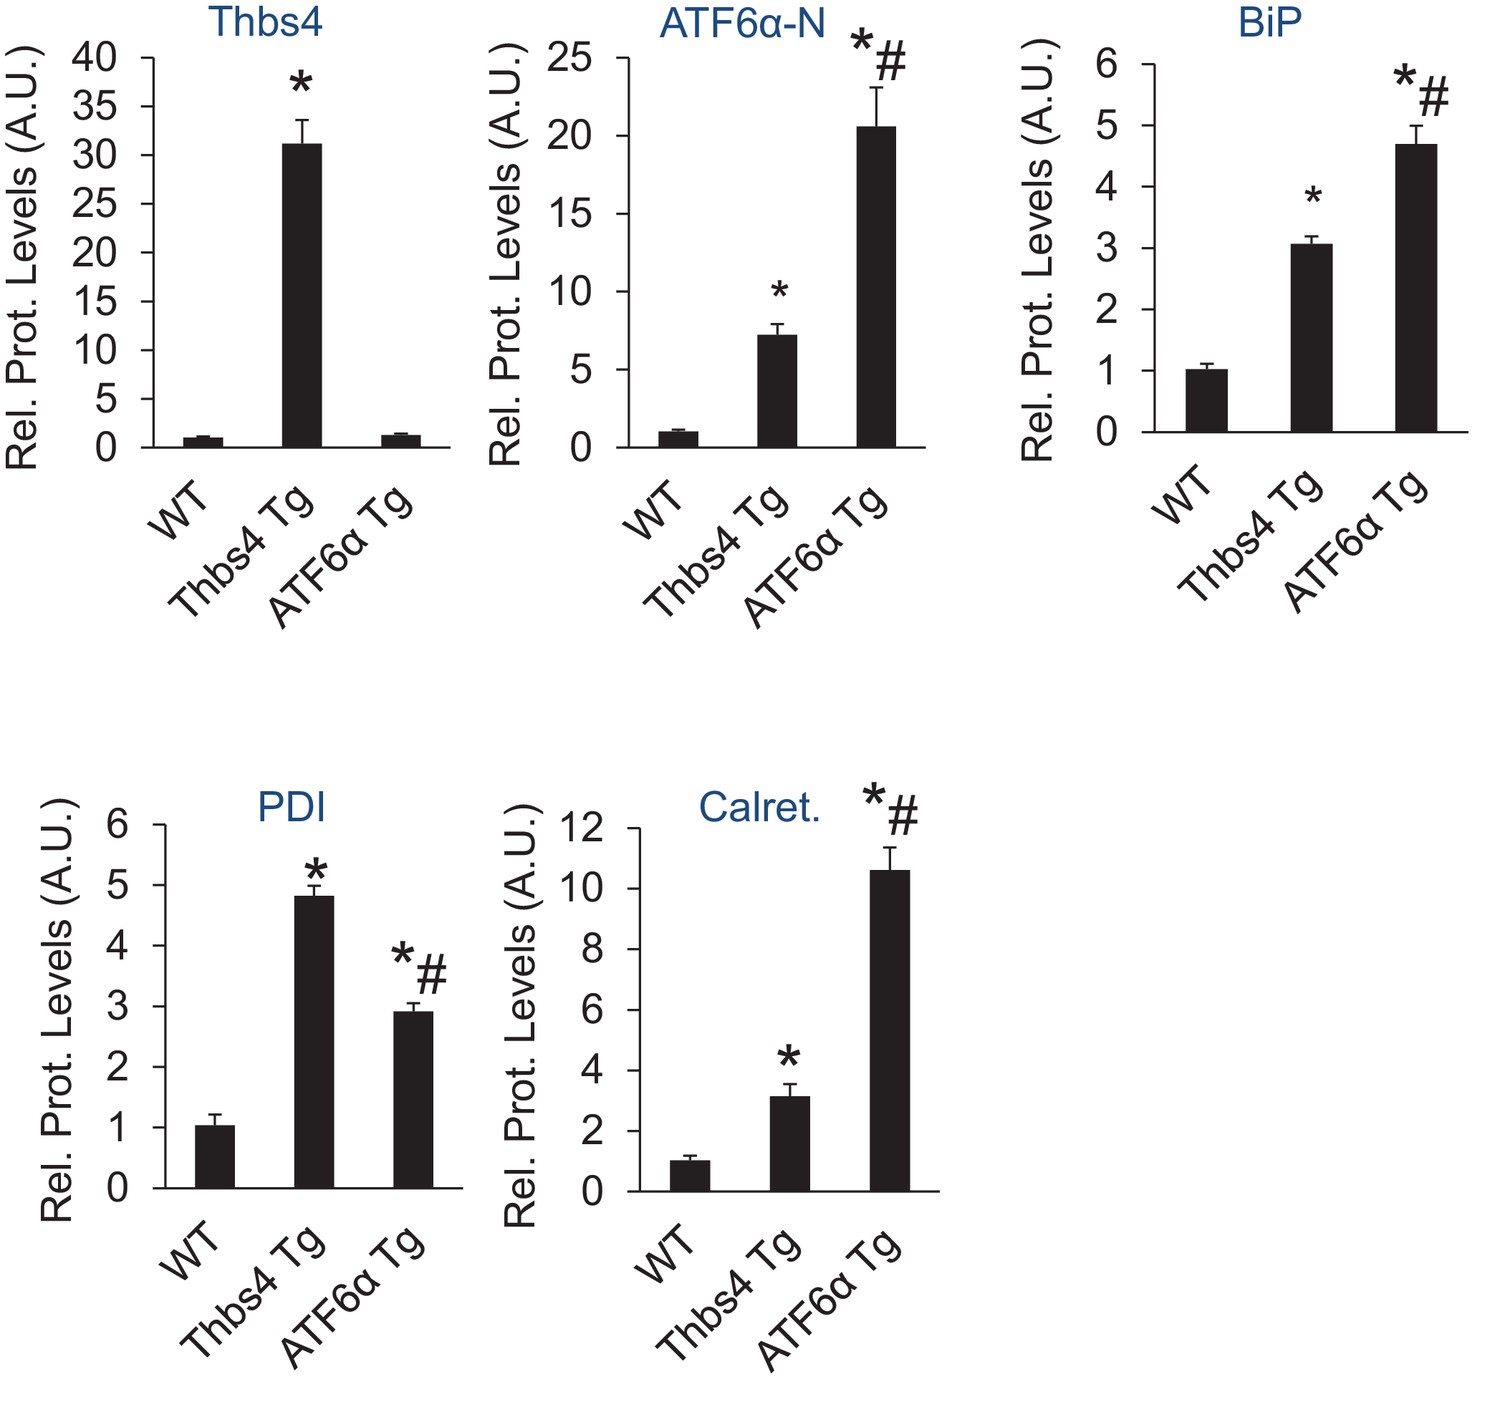
(A) Schematic diagram of the transgene (Tg) used to overexpress ATF6α in skeletal muscle. (B) Western blot analysis for Thbs4, ATF6α, BiP, PDI and calreticulin (Calret.) expression in quadriceps (Quad) from WT, Thbs4 Tg and ATF6α Tg mice at six weeks of age. Gapdh is a processing and loading control (n = 6 biological replicates). (C) Masson’s trichrome-stained histological sections from Quad of WT and ATF6α-Tg littermates at six weeks of age. Representative images of 5 mice per genotype are shown. Scale bar = 100 μm. (D) Transmission electron micrographs in Quad from WT and ATF6α-Tg mice at six weeks of age. The white arrows show dramatic expansion of ER and associated vesicles throughout the cell and especially in the sub-sarcolemmal region. Representative images of 2 mice per genotype are shown. Scale bar = 2 μm. (E) Masson’s trichrome stained histological sections of Quad from Sgcd-/-and Sgcd-/-ATF6α Tg mice at six weeks of age. Representative images of 5 mice per genotype are shown. Scale bar = 100 μm. (F) Quantitation of serum CK levels (units/liter) in the indicated genotypes of mice shown in the legend below the graph at six weeks of age. n = 10 mice for WT and n = 8 mice for the remaining genotypes. *p<0.05 versus WT by one-way ANOVA with post hoc Tukey’s test. (G,H) Histological analysis of the Quad showing percentage of myofibers with centrally located nuclei (n = 5 mice for WT and ATF6α Tg, and n = 6 mice for Sgcd-/-and Sgcd-/-ATF6α Tg) and interstitial fibrosis (n = 5 mice per genotype) at six weeks of age in WT, ATF6α Tg, Sgcd-/-and Sgcd-/-ATF6α Tg mice. *p<0.05 versus WT by one-way ANOVA with post hoc Tukey’s test. (I) Time to fatigue in seconds with forced downhill treadmill running in the indicated genotypes of mice shown in the legend. n = 6 mice per genotype. *p<0.05 versus WT by one-way ANOVA with post hoc Tukey’s test. (J) Representative immunofluorescent images of EBD (red) uptake in myofibers in the Quad of six week-old mice of the indicated genotypes. Membranes of myofibers are shown in green. Scale bars = 75 μm. Percent EBD-positive myofibers is indicated. Six mice per genotype were analyzed for EDB uptake. (K) Western for structural components of the DGC and integrin-associated protein complexes in sarcolemmal protein preparations from Quad of WT, ATF6α Tg, Sgcd-/-and Sgcd-/-ATF6α Tg littermates at six weeks of age. Ponceau staining of a nonspecific band and dihydropyridine receptor α1 (Cav1.1) were used as loading controls (n = 3 biological replicates). Abbreviations: Utro, utrophin; Dystro, dystrophin; α-DG, α-dystroglycan; β-DG, β-dystroglycan; δ-SCG, δ-sarcoglycan; α-SCG, α-sarcoglycan; β-SGC, β-sarcoglycan; β1D-, α7- and α5-Itg (integrin). All data are represented as mean ± SEM.
Figure 7—figure supplement 1
Relative protein levels for immunoblots shown in Figure 7B.
An additional set of immunoblots was included to obtain an n = 6 per genotype. *p<0.05 vs WT; #p<0.05 vs Thbs4 Tg by one-way ANOVA with post hoc Tukey’s test.
Figure 7—figure supplement 2
ATF6α skeletal muscle-specific Tg mice are not protected from MD in the mdx genetic background.
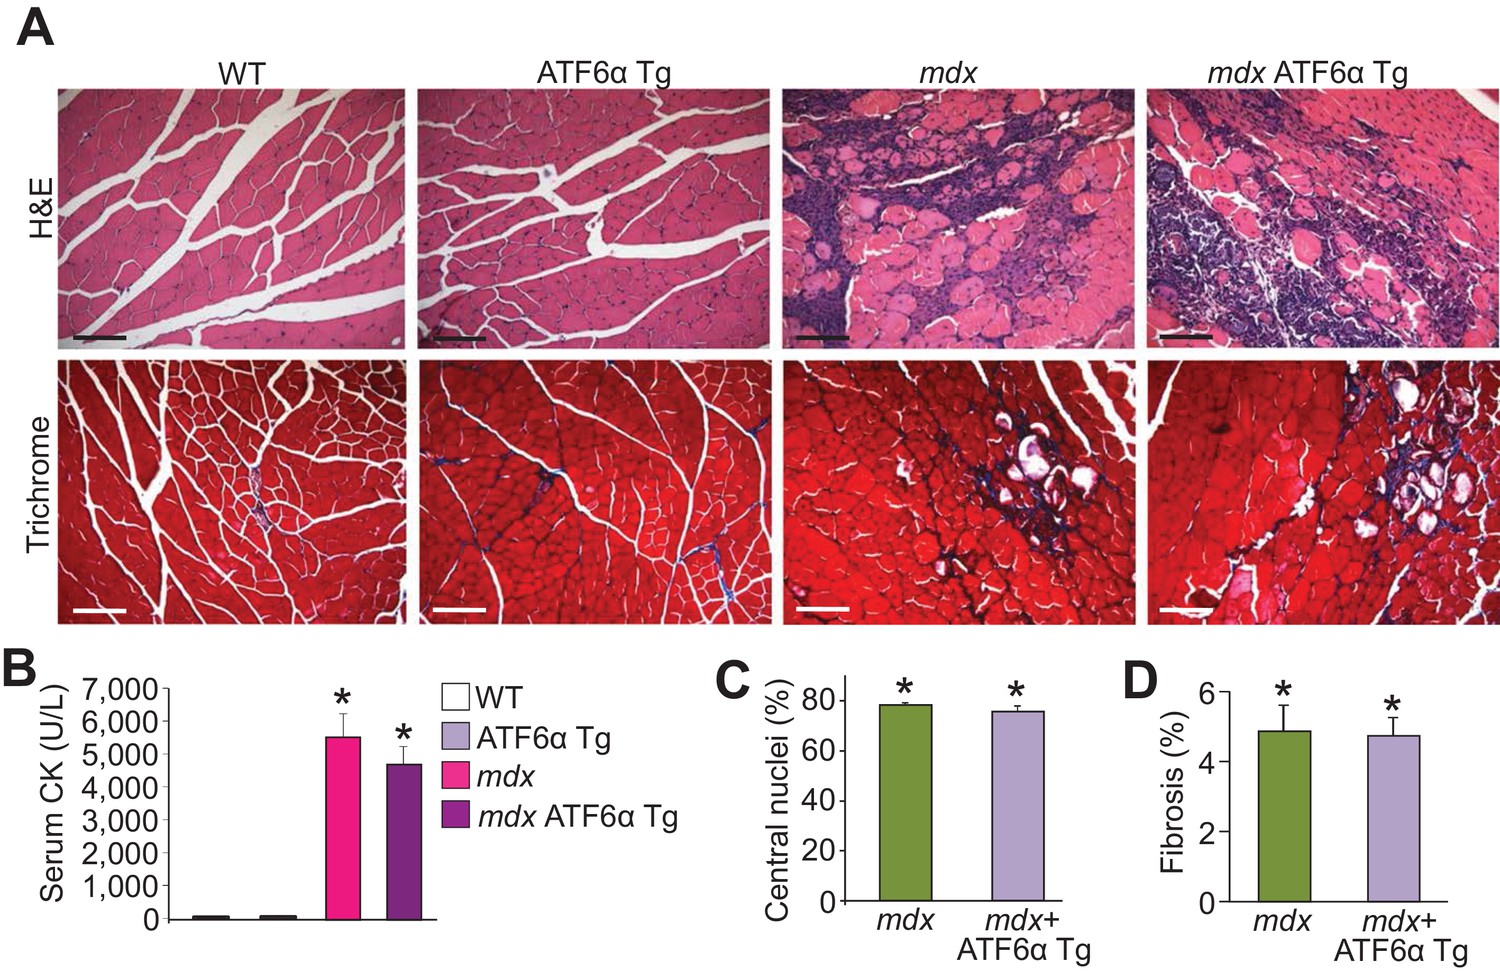
(A) H&E and Masson’s trichrome-stained histological sections of quadriceps from WT, ATF6α Tg, mdx and mdx ATF6α Tg at six weeks of age. Representative images of 6 mice per genotype are shown for H&E, whereas n = 6 mice for WT, ATF6α Tg, and mdx ATF6α Tg, and n = 7 mice for mdx are shown for Masson’s trichrome staining. Scale bar = 100 μm. (B) Quantitation of serum CK levels (units/liter) in WT, ATF6α Tg, mdx and mdx ATF6α Tg at six weeks of age. n = 10 mice for WT, n = 8 mice for ATF6α Tg, n = 7 mice for mdx, n = 6 mice for mdx ATF6α Tg. *p<0.05 vs WT by one-way ANOVA with post hoc Tukey’s test. Data are represented as mean ± SEM. (C,D) Percent central nucleated myofibers and interstitial fibrosis in histological sections from the quadriceps of the indicated genotypes of mice at six weeks of age. n = 6 mice for indicated genotypes in panel C; and n = 7 and 6 mice for mdx and mdx ATF6α Tg, respectively, in panel D. *p<0.05 vs WT by one-way ANOVA with post hoc Tukey’s test. Data are represented as mean ± SEM.
Figure 7—figure supplement 3
Complete membrane trafficking of Thbs4 is essential for its membrane stabilizing function.
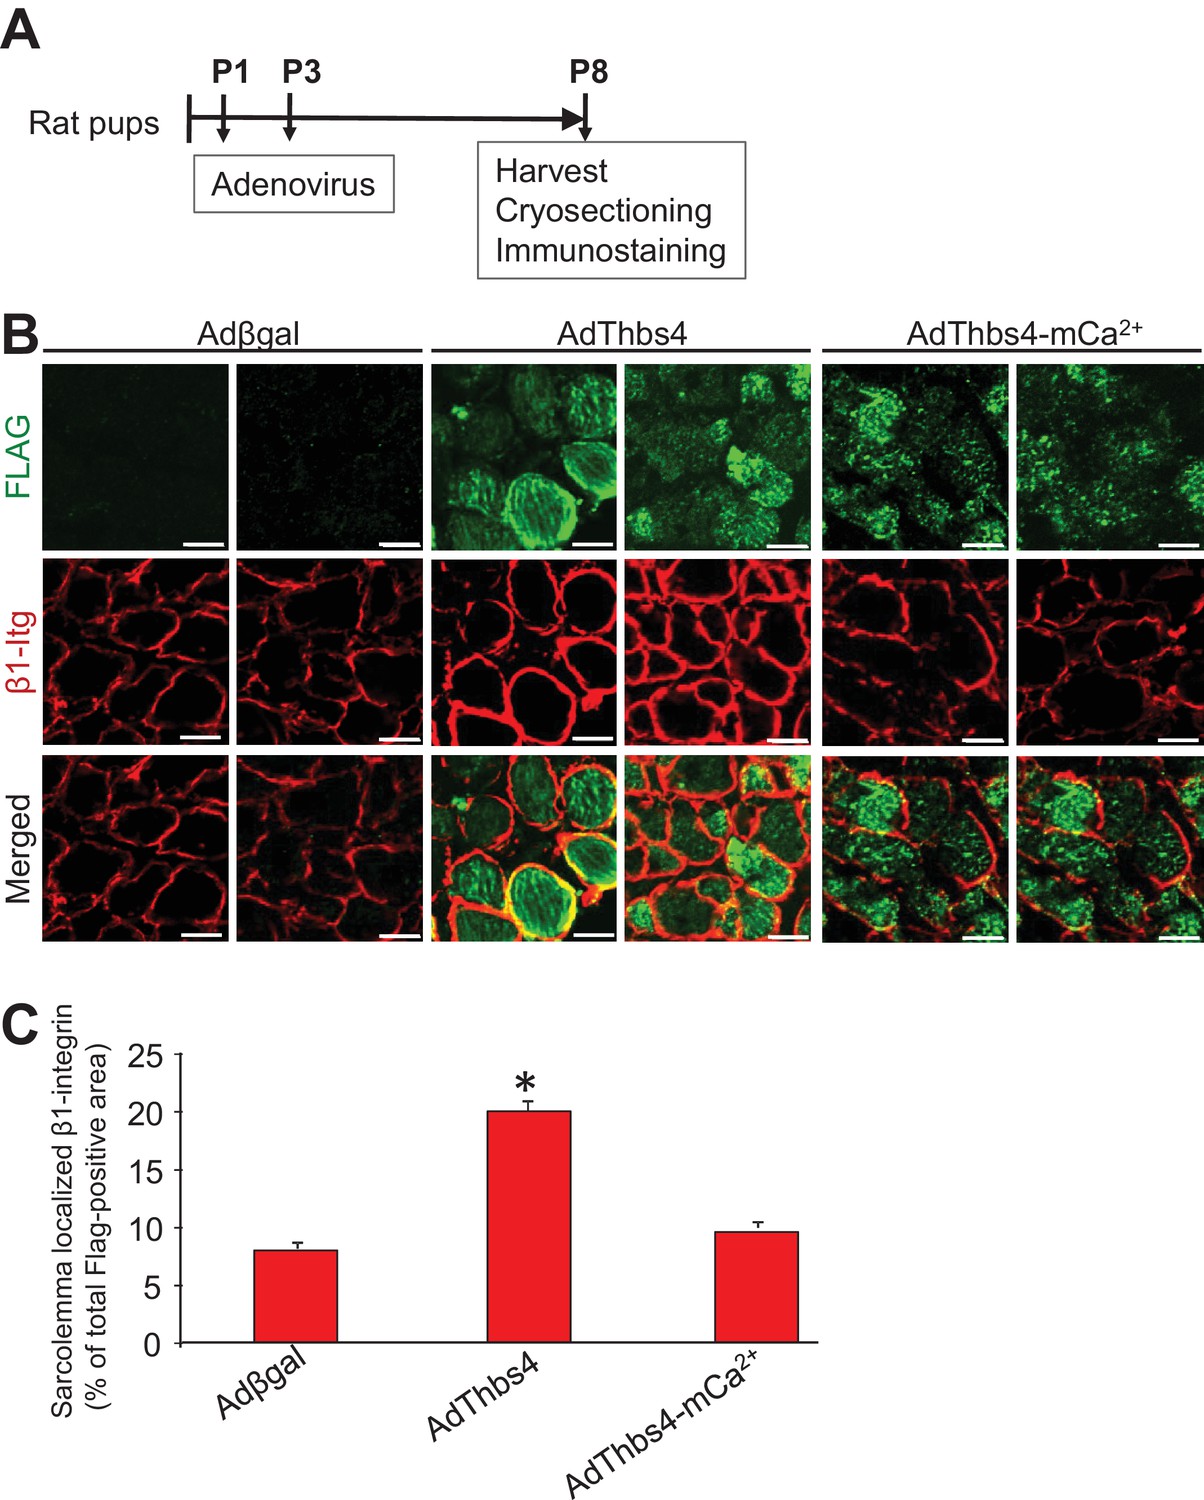
(A) Schematic of the experimental protocol used. Briefly, purified adenoviral (Ad) constructs encoding Flag-tagged full-length Thbs4 (AdThbs4), Flag-tagged Thbs4 calcium-binding mutant (AdThbs4-mCa2+, which induces ER-stress but isretained in the ER) or βgal control were injected into the gastrocnemius (Gastroc.) muscles of postnatal day one rat pups, followed by a second ‘boost’ injection 48 hr later (108 viral particles per injection). Muscle tissue was harvested at postnatal day eight, cryo-sectioned and co-immunostained for Thbs4 and β1-integrin (Itg). (B) Immunofluorescence detection of Thbs4 and Thbs4-mCa2+ (both Flag tagged; green) and β1-integrin (red) from muscles infected with indicated Thbs4 constructs or βgal control. Representative images of 3 muscles per condition are shown. Scale bar = 10 μm. (C) Quantitative analysis of sarcolemma localized β1-integrin positive immunofluorescence. Data are presented as % β1-integrin positive area from total muscle area infected with the indicated Thbs4 constructs (Flag-positive) or from total muscle area in the case of βgal control. N = 3 per treatment condition. *p<0.05 vs. Adβgal and AdThbs4-mCa2+ by Student’s t test.
Figure 8 with 1 supplement
Thbs4 regulates muscle membrane integrity in Drosophila.
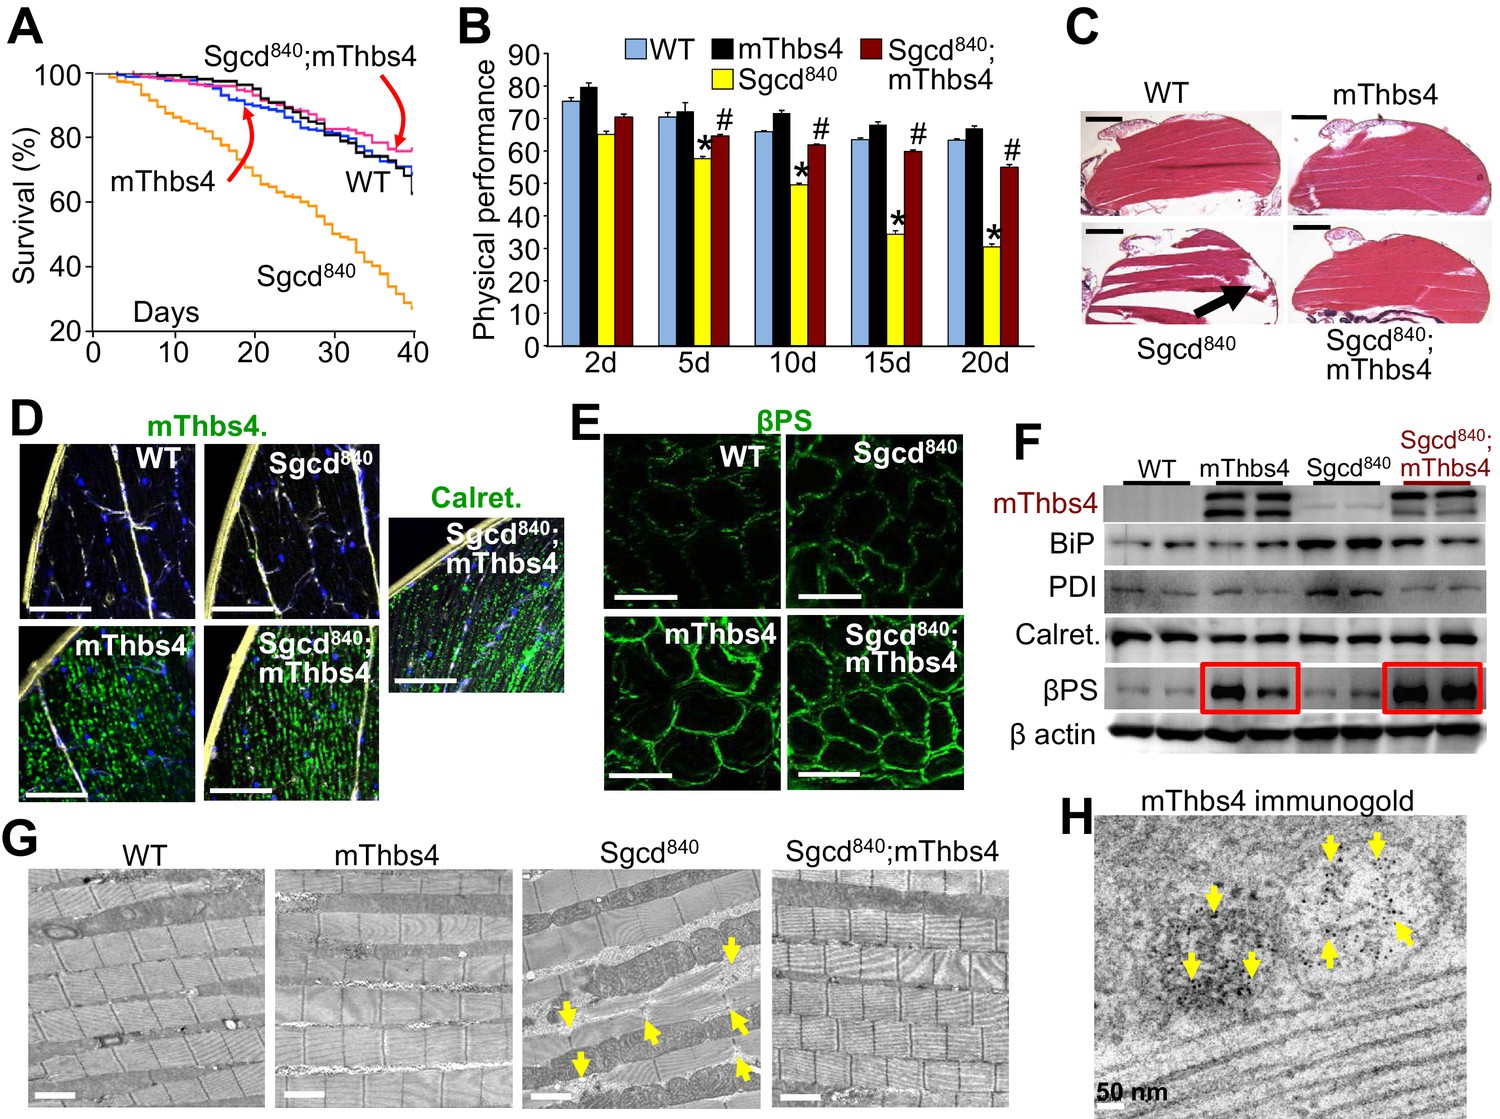
(A) Survival of the Drosophila lines shown over a period of 40 days. p<0.001 for Drosophila line 840 lacking the δ-sarcoglycan homologue gene (Sgcd840) versus Sgcd840;mThbs4 line that express the mouse Thbs4 protein in muscle. N = 358 for WT; 163 for mThbs4; 395 for Sgcd840; 300 for Sgcd840;mThbs4. Statistical analysis performed with log rank, Mantel-Cox test. (B) Physical performance with a negative geotaxis assay of WT (n = 208), mThbs4 (n = 190), Sgcd840 (n = 203), and Sgcd840;mThbs4 Drosophila (n = 205) at the indicated ages. All data are represented as mean ± SEM. *p<0.05 vs WT and mThbs4; #p<0.05 vsSgcd840 by one-way ANOVA with post hoc Tukey’s test. (C) Representative H&E stained histological sections of the dorsal median indirect flight muscles at 30 days of age in the indicated genotypes of Drosophila. Representative images of 14 Drosophila per genotype studied. The arrow shows a prominent area of muscle rupture in the Sgcd840 MD Drosophila line. Scale bar = 200 μm. (D) Immunohistochemistry showing increased intracellular mThbs4 and calreticulin (Calret.; both green) in longitudinal sections of the dorsal median indirect flight muscle of 30 day-old mThbs4 and Sgcd840; mThbs4 expressing flies compared to WT and Sgcd840 lines. Membranes are shown in yellow, nuclei in blue. Representative images of 14 Drosophila per genotype studied. Scale bars = 10 μm. (E) Immunofluorescence detection of fly βPS integrin (green) in cross-sections the dorsal median indirect flight muscle of 30 day-old Drosophila of the indicated genotypes. Representative images of 10 Drosophila per genotype studied. Scale bars = 10 μm. (F) Representative Western blot of mThbs4 and ER-stress proteins BiP, PDI, calreticulin (Calret.), as well as βPS integrin in 15 day-old WT, mThbs4, Sgcd840, and Sgcd840;mThbs4 lines (n = 4 biological replicates). β actin was used as loading control. The red boxes show upregulation of βPS integrin with muscle specific mThbs4 overexpression in the WT and Sgcd840 mutant lines. (G) Transmission electron microscopy of the dorsal median indirect flight muscle of WT, mThbs4, Sgcd840, and Sgcd840;mThbs4 Drosophila. Arrows indicate the characteristic sarcomeric tears and disorganization present in the Sgcd840 line. Representative images of 4 Drosophila studied for the WT, mThbs4, and Sgcd840;mThbs4 lines, and 5 Drosophila for the Sgcd840 line. Scale bar = 2 μm. (H) Immunogold-transmission electron microscopy of mThbs4 in longitudinal section of the dorsal median indirect flight muscle of mThbs4 Drosophila. The arrows indicate mThbs4 (6 nm gold particles) localized to intracellular vesicles. Representative images of 4 Drosophila are shown. Scale bar = 50 nm.
Figure 8—figure supplement 1
Tsp expression in muscle of Drosophila rescues MD due to deletion of the δ-sarcoglycan-like gene (Sgcd840).
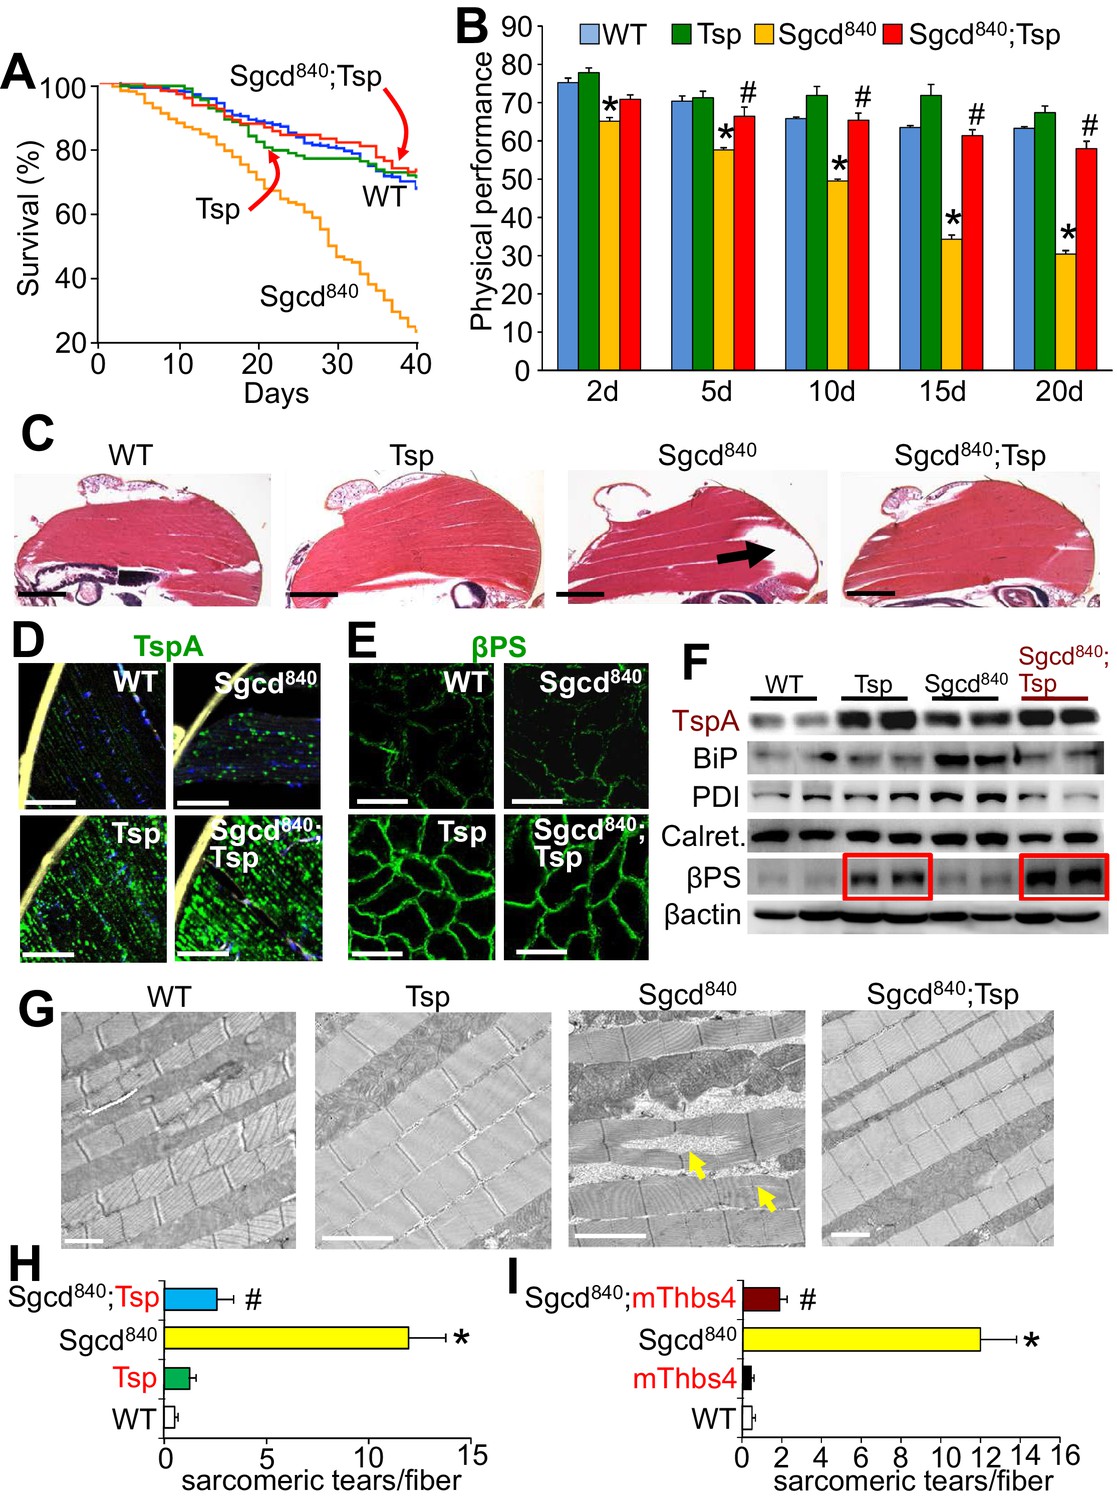
(A) Fly survival was compared over a period of 40 days. p<0.001 for the muscular dystrophy Drosophila line lacking the δ-sarcoglycan homologue gene (Sgcd840) compared to Sgcd840 mutant Drosophila line expressing the single Drosophila Tsp gene in a muscle specific manner using the MEF2 driver (Sgcd840;Tsp) with the GAL4-UAS system. N = 379 for WT; 118 for Tsp; 478 for Sgcd840; 189 for Sgcd840;Tsp. Results were compared by Kaplan–Meier statistical analysis with log rank, Mantel-Cox test. The data show that Tsp overexpression in muscle rescues foreshortened life span in the Sgcd840 line, back to that of WT flies. (B) Physical performance with a negative geotaxis assay of WT, Tsp, Sgcd840 mutant, and Sgcd840;Tsp Drosophila at the indicated ages. n = 208 for WT, n = 55 for Tsp, n= 203 for Sgcd840 mutant and n = 145 for Sgcd840;Tsp Drosophila. All data are represented as mean ± SEM. *p<0.05 vs WT and Tsp; #p<0.05 vsSgcd840 mutants by one-way ANOVA with post hoc Tukey’s test. (C) Representative H&E staining of histological sections from the dorsal median indirect flight muscle of 30 day-old flies of the indicated genotypes. The arrow shows a prominent area of muscle rupture in the Sgcd840 mutant line, which is rescued by overexpression of the Drosophila Tsp gene in muscle. Representative images of 14 Drosophila per genotype studied. Scale bar = 200 μm. (D) Immunohistochemistry showing increased intracellular Tsp protein (green) in longitudinal sections of the dorsal median indirect flight muscle of 30 day-old WT, Tsp, Sgcd840 mutant, and Sgcd840;Tsp Drosophila. Membranes are shown in yellow, nuclei in blue. Representative images of 14 Drosophila per genotype studied. Scale bars = 10 μm. (E) Immunofluorescence detection of Drosophila βPS integrin (green) in histological cross-sections of the dorsal median indirect flight muscle of 30 day-old lines is shown. Representative images of 10 Drosophila per genotype studied. Scale bars = 10 μm. (F) Representative Western blot of Drosophila Tsp and ER-stress proteins BiP, PDI, calreticulin (Calret.), as well as βPS integrin in 15-day-old WT, Tsp, Sgcd840,and Sgcd840;Tsp lines (n = 4 biological replicates). β-actin was used as loading control. The red boxes show upregulation of βPS integrin with muscle-specific Tsp overexpression in the WT and Sgcd840 mutant lines. (G) Transmission electron microscopy of the dorsal median indirect flight muscle of 25 day-old WT, Tsp, Sgcd840,and Sgcd840;Tsp Drosophila. Arrows indicate the characteristic sarcomeric tears and disorganization present in the Sgcd840 line. Representative images of 4 Drosophila studied for the WT, mThbs4, and Sgcd840;mThbs4 lines, and 5 Drosophila for the Sgcd840 line. Scale bar = 2 μm. (H,I) Quantitative transmission electron microscopy analysis of the number of sarcomeric tears per myofiber in the dorsal median indirect flight muscle of WT (n = 14 fibers from 4 Drosophila), Tsp (n = 17 fibers from 4 Drosophila), mThbs4 (n = 14 fibers from 4 Drosophila), Sgcd840 (n = 23 fibers from 5 Drosophila), Sgcd840;Tsp (n = 16 fibers from 4 Drosophila), and Sgcd840;mThbs4 (n = 21 fibers from 4 Drosophila). All data are represented as mean ± SEM. *p<0.001 vs all other lines; #p<0.001 vs Sgcd840 mutants by one-way ANOVA with post hoc Tukey’s test.
Figure 9
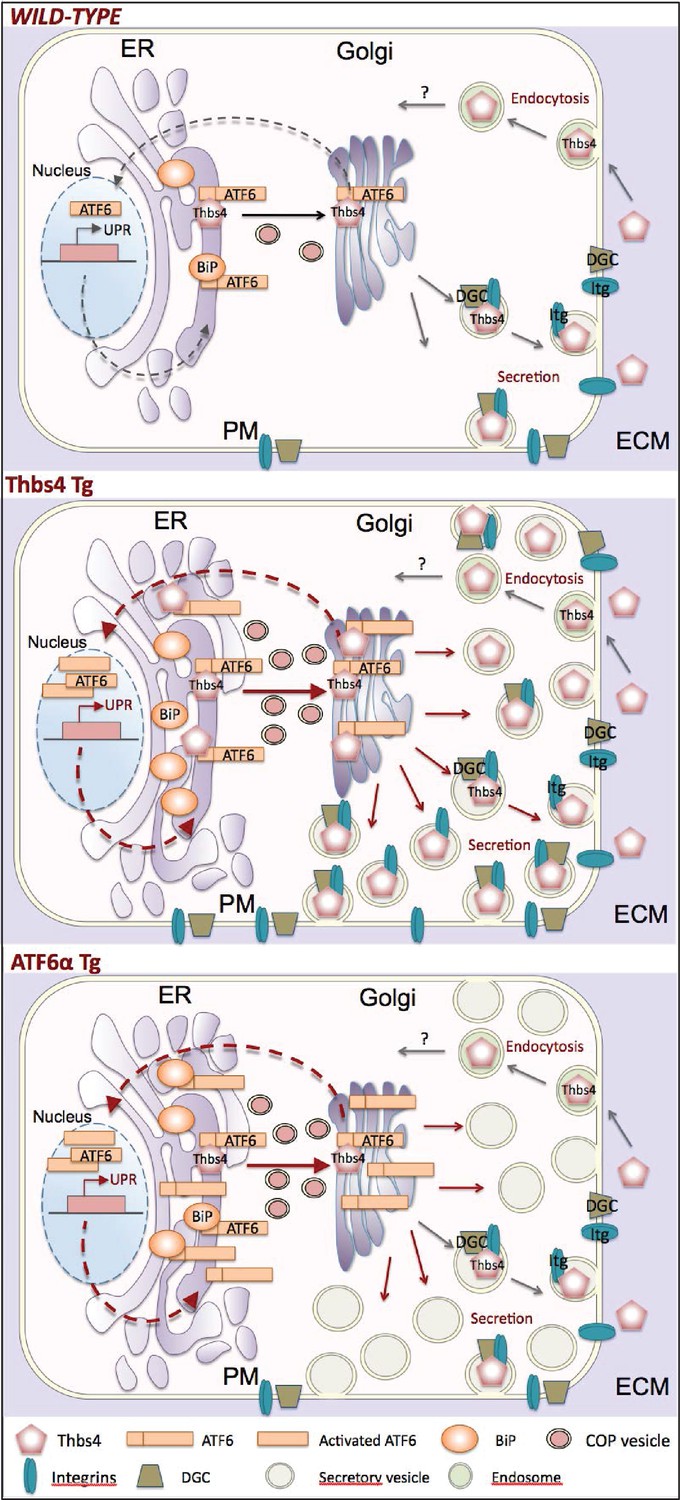
Model of how Thbs4 functions as an intracellular regulator of muscle cellular attachment and membrane stability.
As a matricellular protein, thrombospondin-4 (Thbs4) pentamers are synthesized in the ER lumen and then transported to the Golgi, where after they traverse the secretory pathway to fuse with the plasma membrane for secretion. Thbs4 can then reside within the extracellular matrix (ECM) or be actively endocytosed and returned to the intracellular compartment by a recycling receptor. In addition to its established extracellular functions, combined studies in the heart and skeletal muscle now reveal that while in the ER, Thbs4 can compete with BiP (GRP78) for binding to the ER-resident transcription factor ATF6α, thereby facilitating ATF6α translocation to the Golgi for processing and subsequent shuttling to the nucleus where it regulates expression of ER stress responsive genes that are also part of the unfolded protein response (UPR). ATF6α induction in cardiac and skeletal muscle, or by overexpression in Tg mice (lower panel) causes a dramatic expansion of the ER and post-ER vesicles, as well as increased vesicular trafficking to the membrane. The ability of Thbs4 to induce ATF6α processing and nuclear trafficking also causes this same ER expansion and augmentation of intracellular vesicular trafficking to the membrane. However, Thbs4 uniquely regulates trafficking of selected integrins and dystrophin-associated glycoprotein complexes (DGC) members to the sarcolemma, thereby enhancing the mechanical stability of the myofiber, such as observed in Thbs4 Tg muscle (middle panel).
Download links
A two-part list of links to download the article, or parts of the article, in various formats.
Downloads (link to download the article as PDF)
Open citations (links to open the citations from this article in various online reference manager services)
Cite this article (links to download the citations from this article in formats compatible with various reference manager tools)
Thrombospondin expression in myofibers stabilizes muscle membranes
eLife 5:e17589.
https://doi.org/10.7554/eLife.17589


