RING finger E3 ligase PPP1R11 regulates TLR2 signaling and innate immunity
- University of Pittsburgh, United States
Figures
Figure 1 with 4 supplements
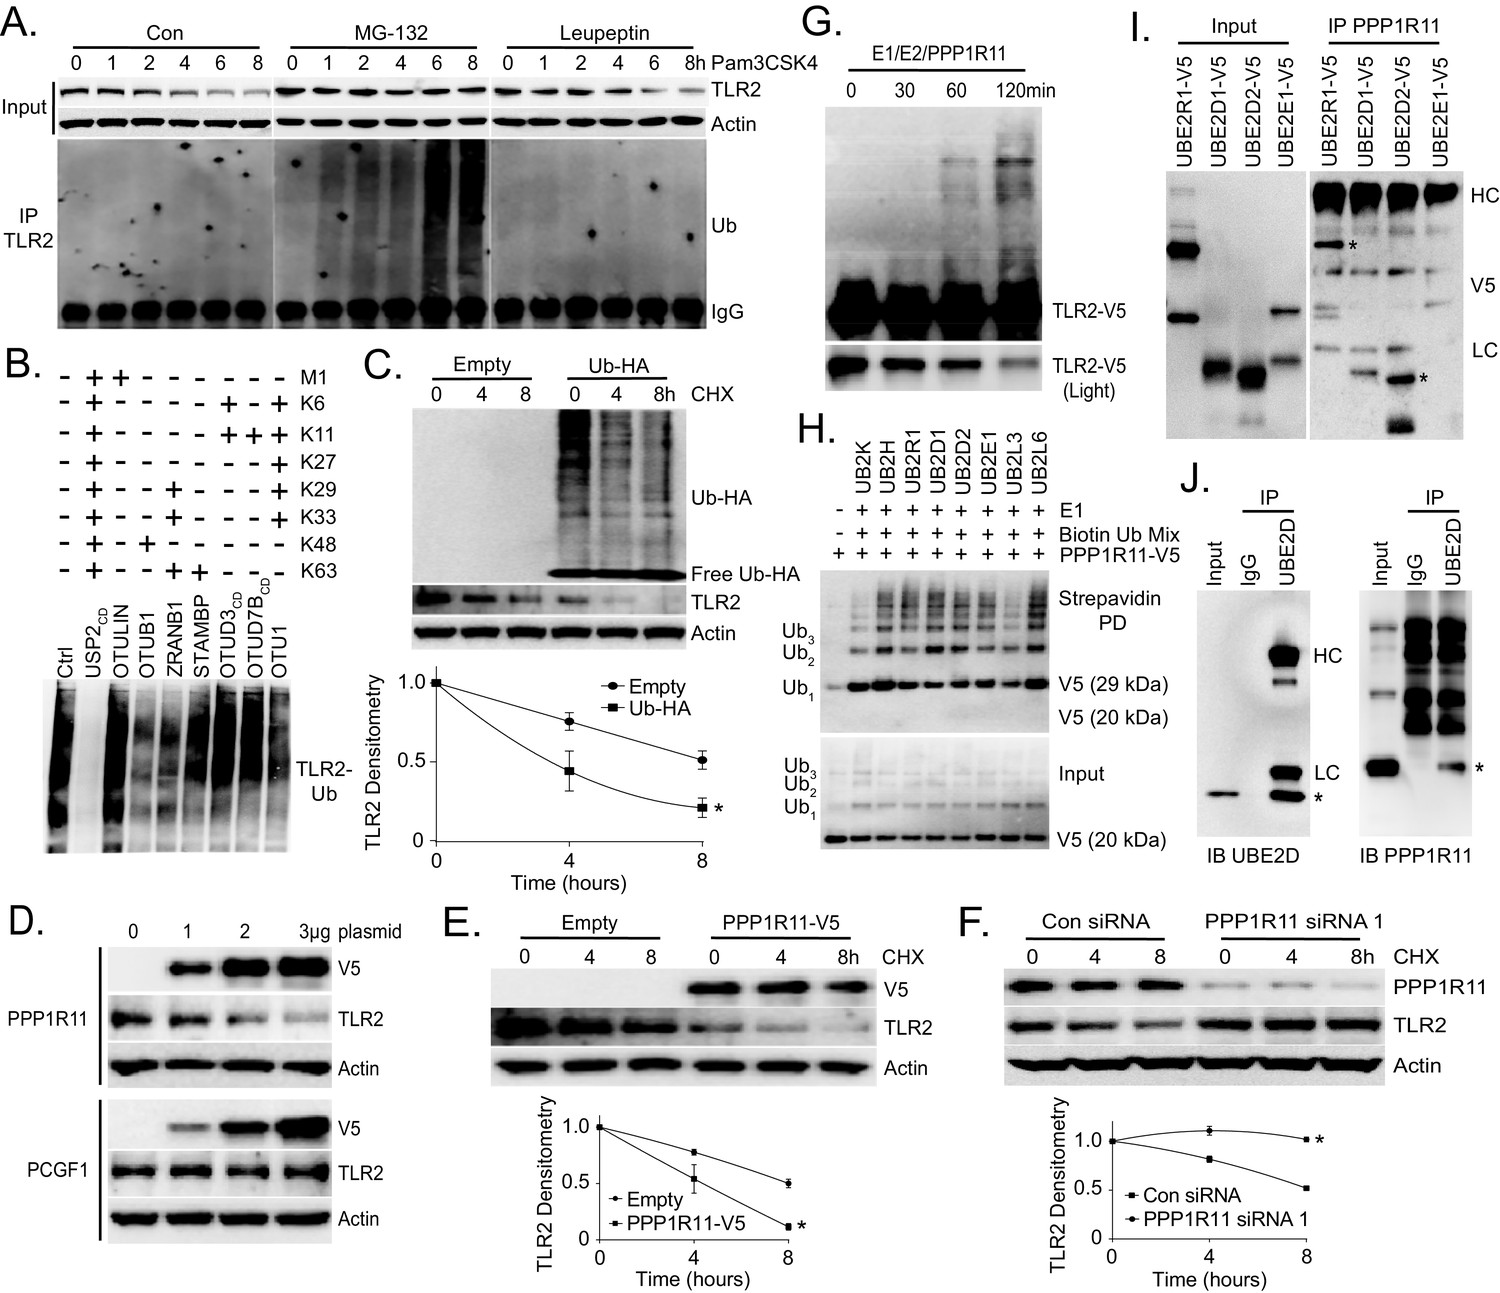
TLR2 polyubiquitination is regulated by PPP1R11.
(A) Murine lung epithelial (MLE) cells were treated with Pam3CSK4 with or without MG-132 or Leupeptin in a time-dependent manner. Cells were collected and immunoblotted for TLR2 and Actin. Endogenous TLR2 was also immunoprecipitated and followed by Ubiquitin immunoblotting. (B) MLE cells were pretreated with MG-132 for 18 hr to induce accumulation of polyubiquitinated TLR2 protein. Endogenous TLR2 was immunoprecipitated using TLR2 antibody and protein A/G beads. After washing, TLR2 beads were then incubated with different DUBs before being assayed for ubiquitin immunoblotting. (C) TLR2 protein half-life determination in MLE cells transfected with Empty plasmid or Ubiquitin plasmid. Cells were collected and immunoblotted for TLR2, HA, and Actin. Below the panel levels of each protein on immunoblots were quantified densitometrically (Normalized to time zero) and shown graphically. The data represent mean values ± SEM (n = 3); *, p<0.05, significant compared to Control, Student’s t-test. (D) Immunoblots showing levels of TLR2 proteins, V5, and Actin after PPP1R11 or PCGF1 plasmid dose over-expression. (E–F) TLR2 protein half-life determination in MLE cells with empty or PPP1R11 plasmid expression (E); TLR2 protein half-life determination with Control or PPP1R11 siRNA expression (F). Below each panel levels of each protein on immunoblots were quantified densitometrically (Normalized to time zero) and shown graphically. The data represent mean values ± SEM (n = 3); *p<0.05, significant compared to Control, Student’s t-test. (G) In vitro ubiquitination assay. Purified E1 and E2 components were incubated with TLR2-V5, PPP1R11, and the full complement of ubiquitination reaction components for different lengths of time. (H) In vitro ubiquitination assay. PPP1R11-V5 was incubated with purified E1, varying E2s, biotinylated ubiquitin, and the full complement of ubiquitination reaction components. The reaction mixture was subjected to streptavidin pulldown prior to V5 immunoblotting. (I) PPP1R11 protein was immunoprecipitated from cell lysate using a PPP1R11 antibody and coupled to protein A/G beads. PPP1R11 beads were then incubated with in vitrosynthesized products expressing V5‐tagged E2 conjugating enzymes. After washing, proteins were eluted and processed for V5 immunoblotting. (J) Endogenous PPP1R11 was also immunoprecipitated and immunoblotted for UBE2D.
-
Figure 1—source data 1
This file contains raw source data used to create graphs in Figure 1.
- https://doi.org/10.7554/eLife.18496.003
Figure 1—figure supplement 1
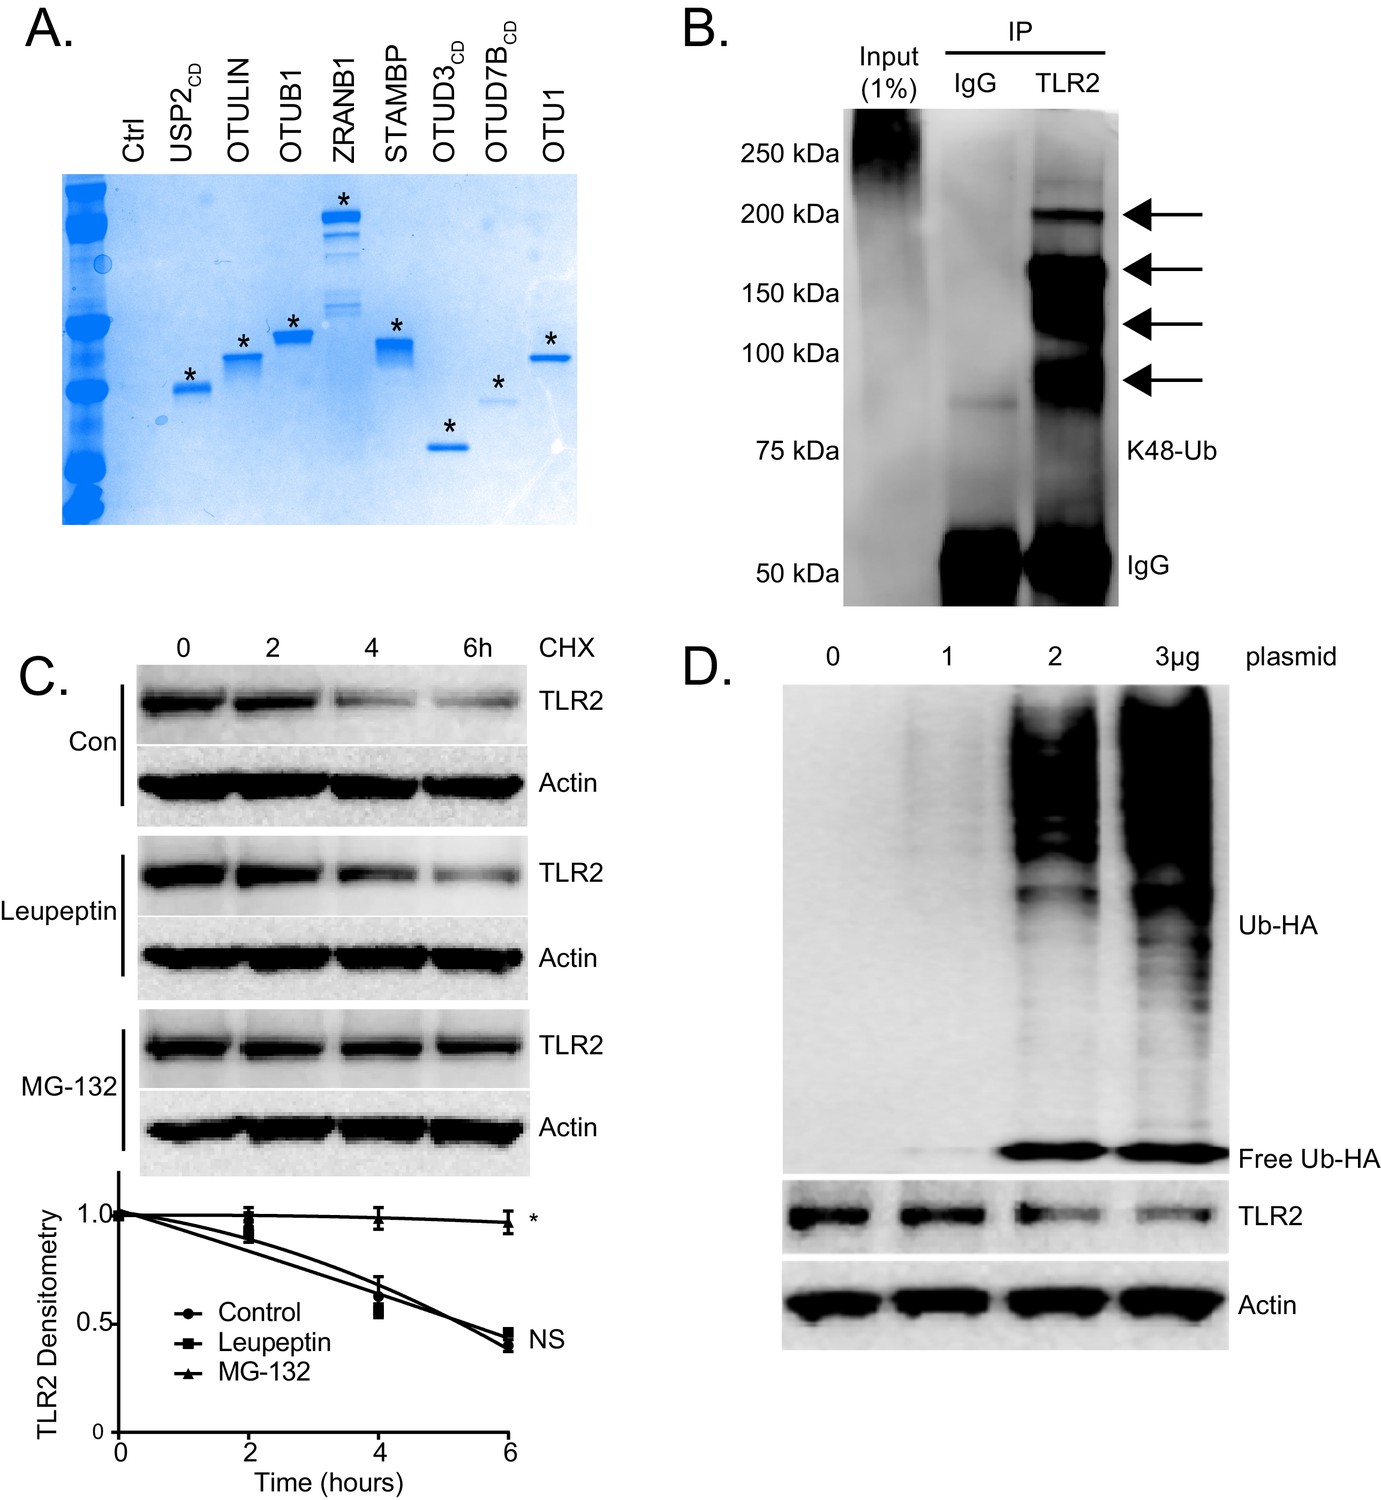
TLR2 is regulated by Ubiquitination.
(A) Coomassie blue staining of UBICrest supernatant following DuB assay. Stars represent indicated Dub signal (Figure 1B). (B) TLR2 immunoprecipitation from MLE cells prior to immunoblotting for K48-specific ubiquitin linkages. (C) TLR2 protein half-life study with MG132 or Leupeptin. Below the panel levels of each protein on immunoblots were quantified densitometrically and shown graphically. Data represent mean values ± SEM (n = 3); *p<0.05, significant compared to Control, Student’s t-test. (D) Immunoblots showing levels of TLR2 proteins and HA-Ubiquitin after ectopic Ubiquitin plasmid expression.
-
Figure 1—figure supplement 1—source data 1
This file contains raw source data used to create graphs in Figure 1—figure supplement 1.
- https://doi.org/10.7554/eLife.18496.005
Figure 1—figure supplement 2

The RING E3 ligase PPP1R11 regulates TLR2 stability.
(A) MLE cells were transfected with LacZ or one of the other 10 randomly selected Ring-finger E3 ligases. 18 hr later, cells were collected and immunobloted. (B) TLR2 mRNA levels from MLE cells transfected with increasing amounts of PPP1R11. (C) TLR2 protein half-life determination with CON siRNA or PPP1R11 siRNA expression. Next to the panel levels of each protein on immunoblots were quantified densitometrically (Normalized to Time zero) and shown graphically. The data represent mean values ± SEM (n = 3); *p<0.05, significant compared to Control, Student’s t-test (D) Half-life determination with PCGF1 expression and (E) PCGF1 silencing in MLE cells. Next to the panel levels of each protein on immunoblots were quantified densitometrically (Normalized to Time zero) and shown graphically. The data represent mean values ± SEM (n = 3); NS, p>0.05, not significant compared to Control, Student’s t-test (F) Correlation between TLR2 and PPP1R11 levels in white blood cell samples from control patients (n = 8) compared to S. aureus-infected patients (n = 9).
-
Figure 1—figure supplement 2—source data 1
This file contains raw source data used to create graphs in Figure 1—figure supplement 2.
- https://doi.org/10.7554/eLife.18496.007
Figure 1—figure supplement 3
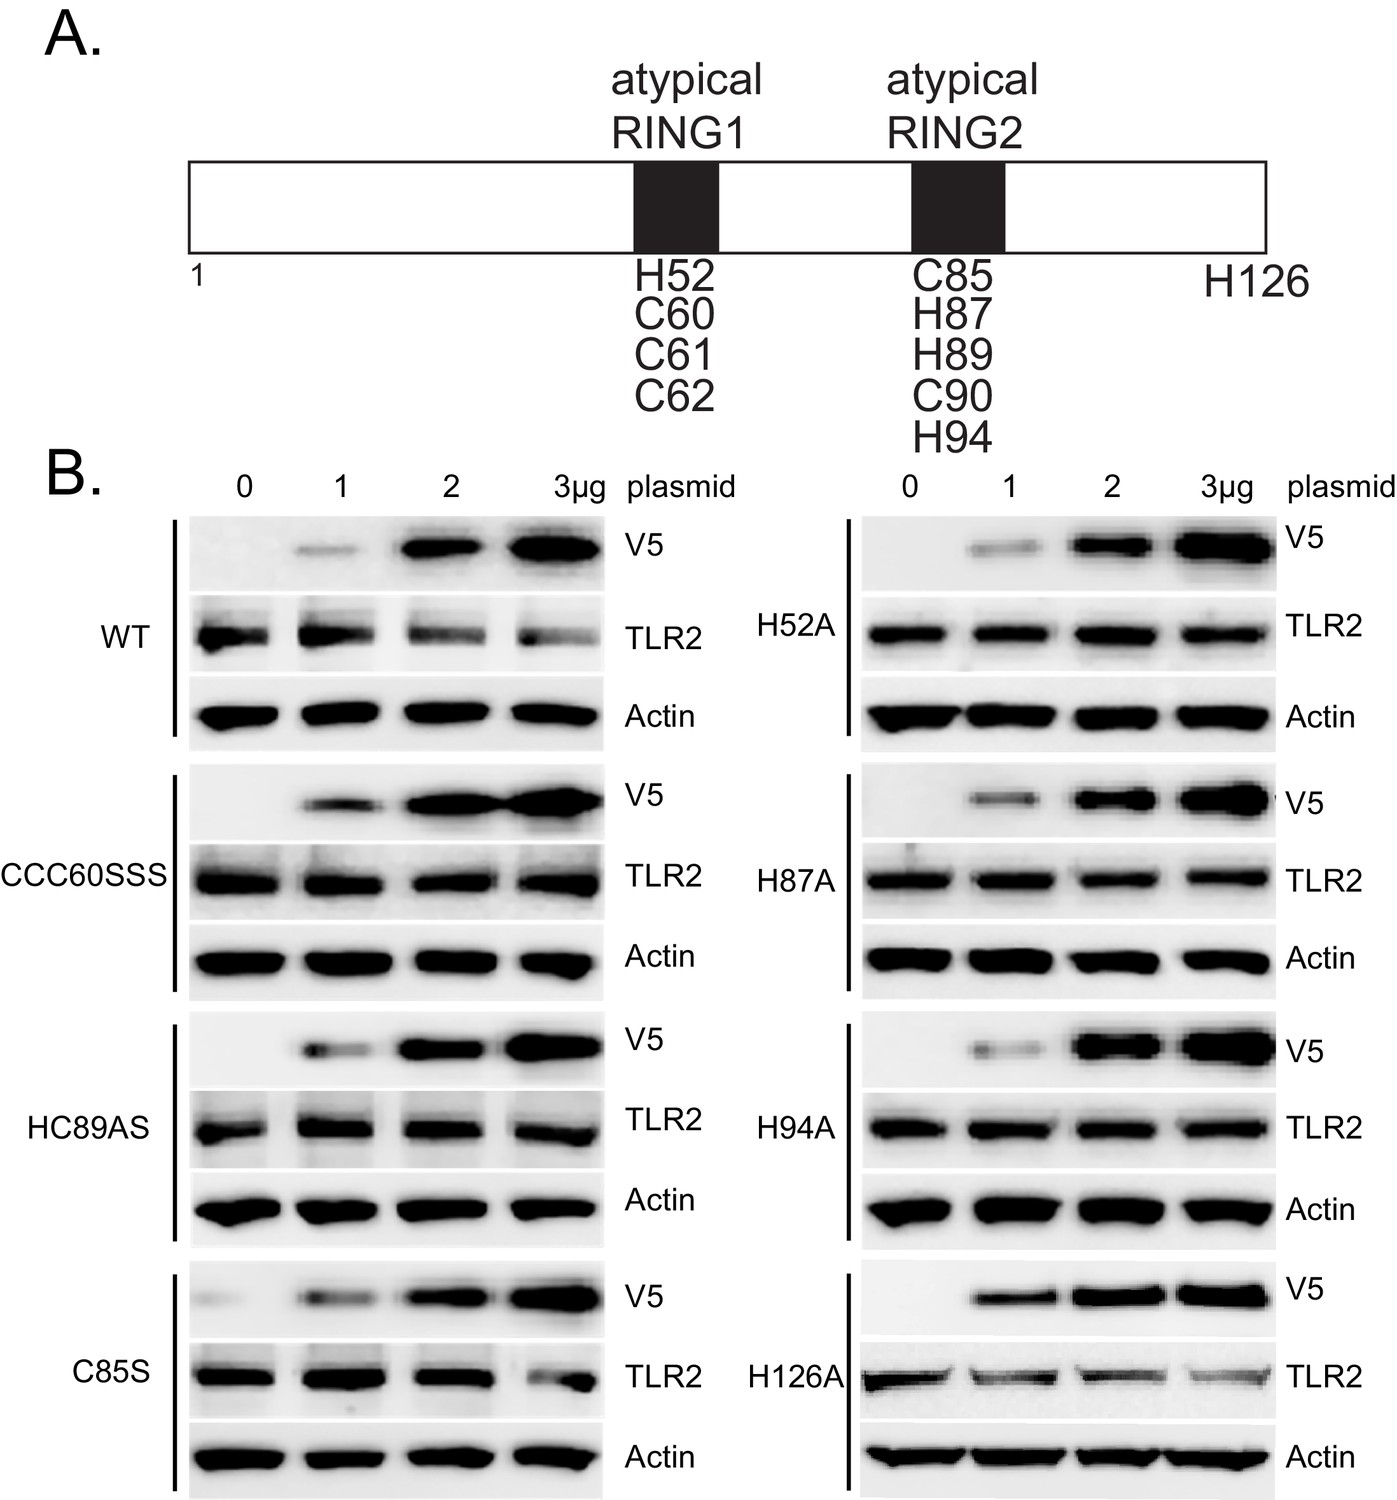
PPP1R11 is a non-canonical RING E3 ligase.
(A) Schematic of putative atypical RING domains within PPP1R11. Candidate cysteine and histidine residues are listed, as well as a non-candidate H126. (B) MLE cells were transfected with increasing amounts of plasmid encoding WT or mutant PPP1R11. 18 hr later, cells were collected and immunoblotted for TLR2.
Figure 1—figure supplement 4

PPP1R11 does not regulate the stability of other TLR receptors.
MLE cells were co-transfected with V5 tagged TLRs and increasing amounts of plasmid encoding PPP1R11. 18 hr later, cells were collected and immunoblotted for V5.
Figure 2 with 2 supplements
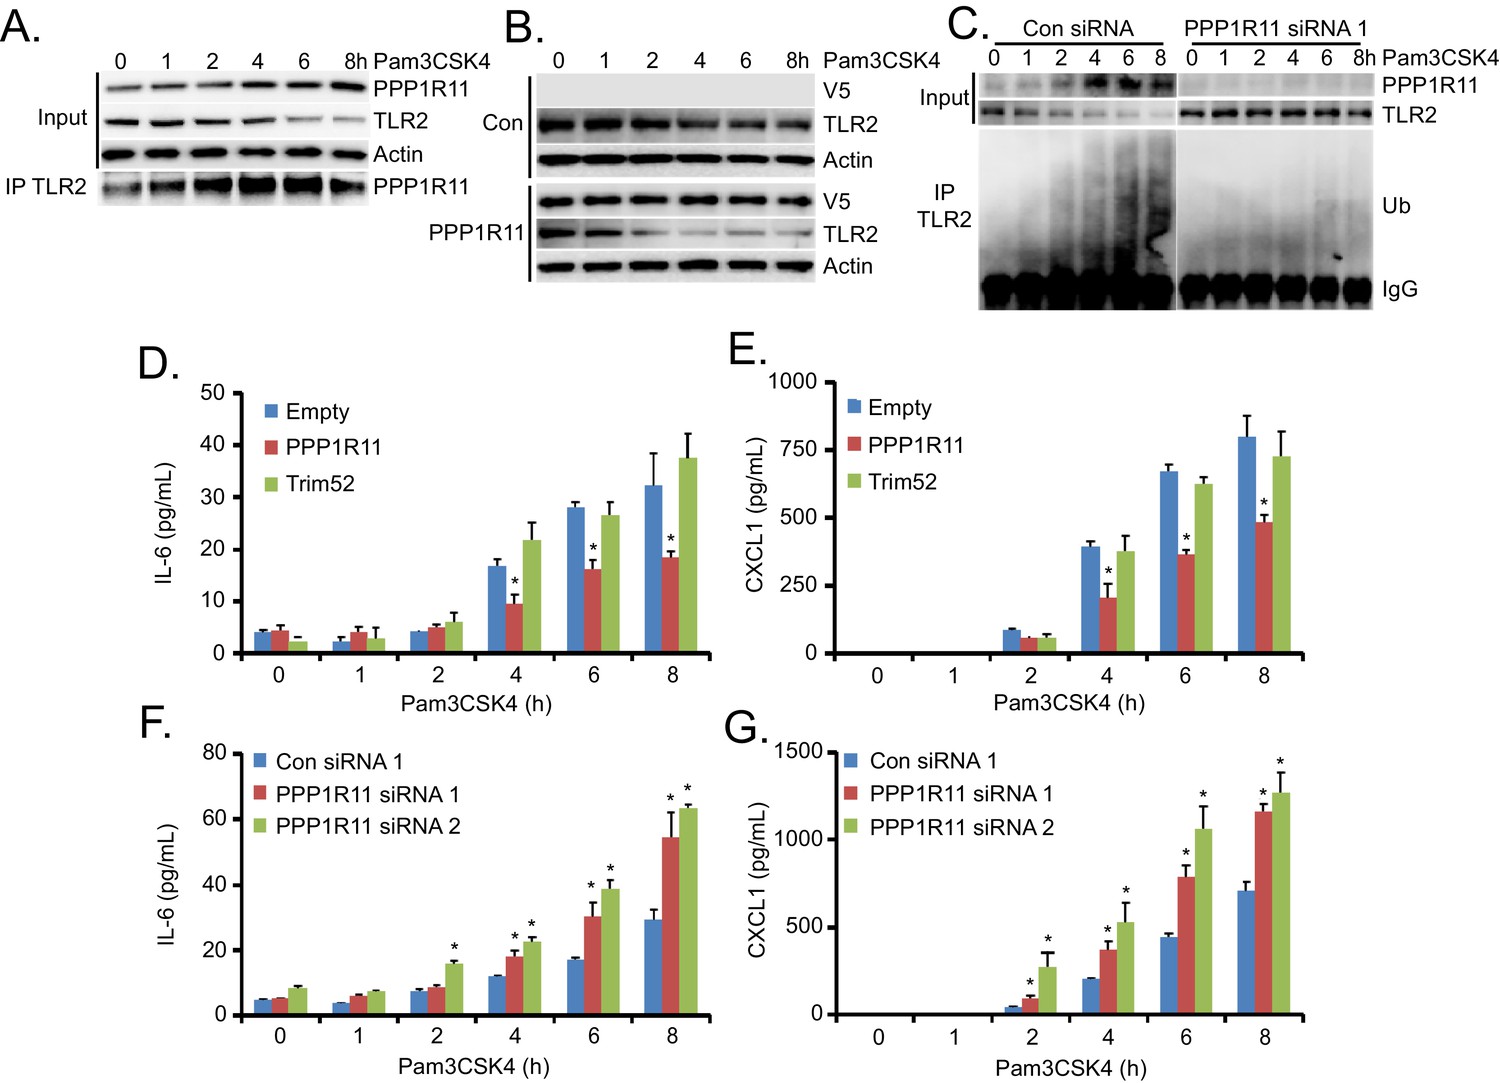
PPP1R11 regulates Pam3CSK4-induced TLR2 protein degradation and inflammation.
(A) MLE cells were treated with Pam3CSK4 in a time-dependent manner. Cells were collected and immunoblotted for PPP1R11, TLR2, and Actin. Endogenous TLR2 was also immunoprecipitated and immunoblotted for PPP1R11. (B) MLE cells were transfected with either empty or PPP1R11 plasmid. 24 hr later, cells were exposed to Pam3CSK4 in a time-dependent manner. Cells were collected and immunoblotted for V5, TLR2, and Actin. (C) MLE cells were transfected with either control or PPP1R11 siRNA. 48 hr later, cells were exposed to Pam3CSK4 in a time-dependent manner. Cells were collected and immunoblotted for V5, TLR2, and Actin. Endogenous TLR2 was also immunoprecipitated and followed by ubiquitin immunoblotting. (D–E) MLE cells were transfected with either empty, PPP1R11, or TRIM52 plasmid. 24 hr later, cells were exposed to Pam3CSK4 in a time-dependent manner. Cell media was then collected and assayed for IL-6 and CXCL1 (Data represent mean values ± SEM n = 4; *p<0.05, significant compared to Control, Student’s t-test). (F–G) MLE cells were transfected with either control or PPP1R11 siRNA. 48 hr later, cells were exposed to Pam3CSK4 in a time-dependent manner. Cell media was then collected and assayed for IL-6 and CXCL1 (Data represent mean values ± SEM n = 4; *p<0.05, significant compared to Control, Student’s t-test).
-
Figure 2—source data 1
This file contains raw source data used to create graphs in Figure 2.
- https://doi.org/10.7554/eLife.18496.011
Figure 2—figure supplement 1
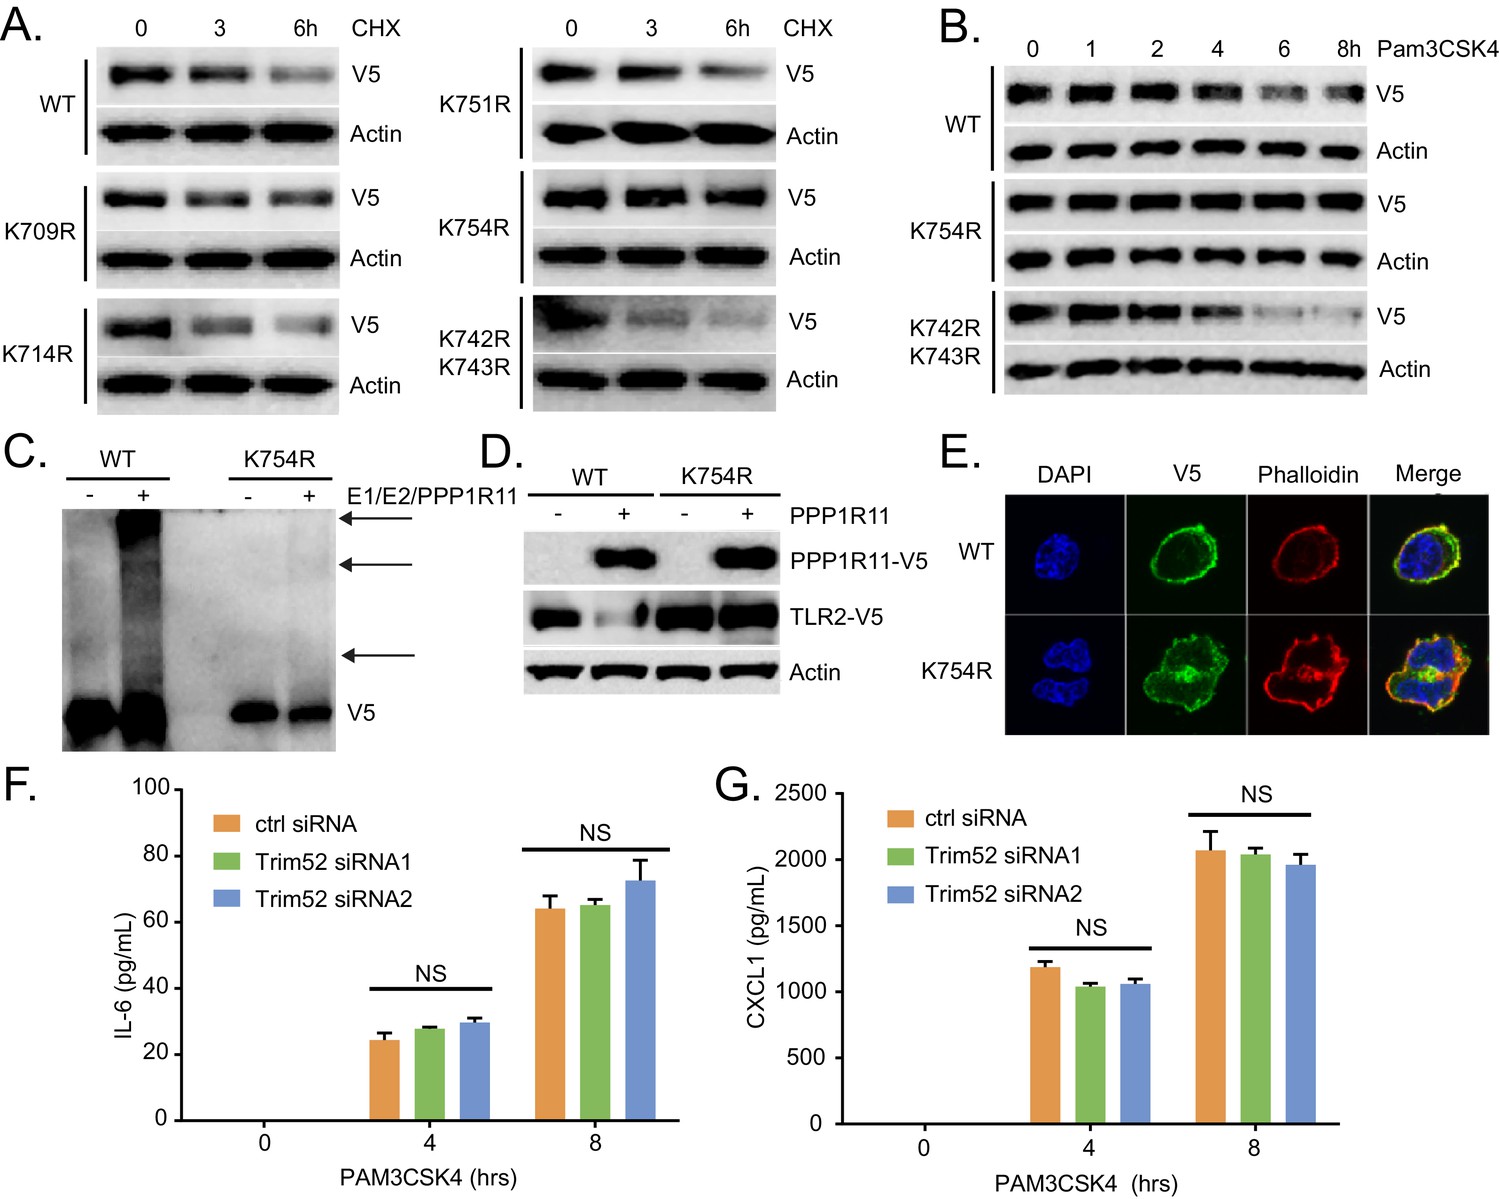
TLR2 ubquitination is regulated through Lysine 754.
(A) Half-life study of WT and lysine mutant TLR2 in MLE cells. (B) MLE cells were transfected with WT or mutant TLR2 before Pam3CSK4 treatment. Cells were then immunoblotted for V5-TLR2. (C) In vitro ubiquitination assay using WT or K754R TLR2 as the substrate. (D) MLE cells were co-transfected with WT or TLR2 lysine mutants with or without PPP1R11. Cells were then collected and assayed for immunoblotting. (E) V5 tagged WT and K754R TLR2 were transfected in MLE cells. 18 hr later, cells were fixed, permeabilized, immunostained for V5 (Green). The nucleus was counterstained with DAPI, and F-actin was counterstained with Alexa 488-Phalloidin. (F–G) MLE cells were transfected with either control or Trim52 siRNA. 72 hr later, cells were exposed to Pam3CSK4 in a time-dependent manner. Cell media was then collected and assayed for IL-6 and CXCL1 (Data represent mean values ± SEM n = 3; NS, p>0.05, not significant compared to Control, Student’s t-test).
-
Figure 2—figure supplement 1—source data 1
This file contains raw source data used to create graphs in Figure 2—figure supplement 1.
- https://doi.org/10.7554/eLife.18496.013
Figure 2—figure supplement 2
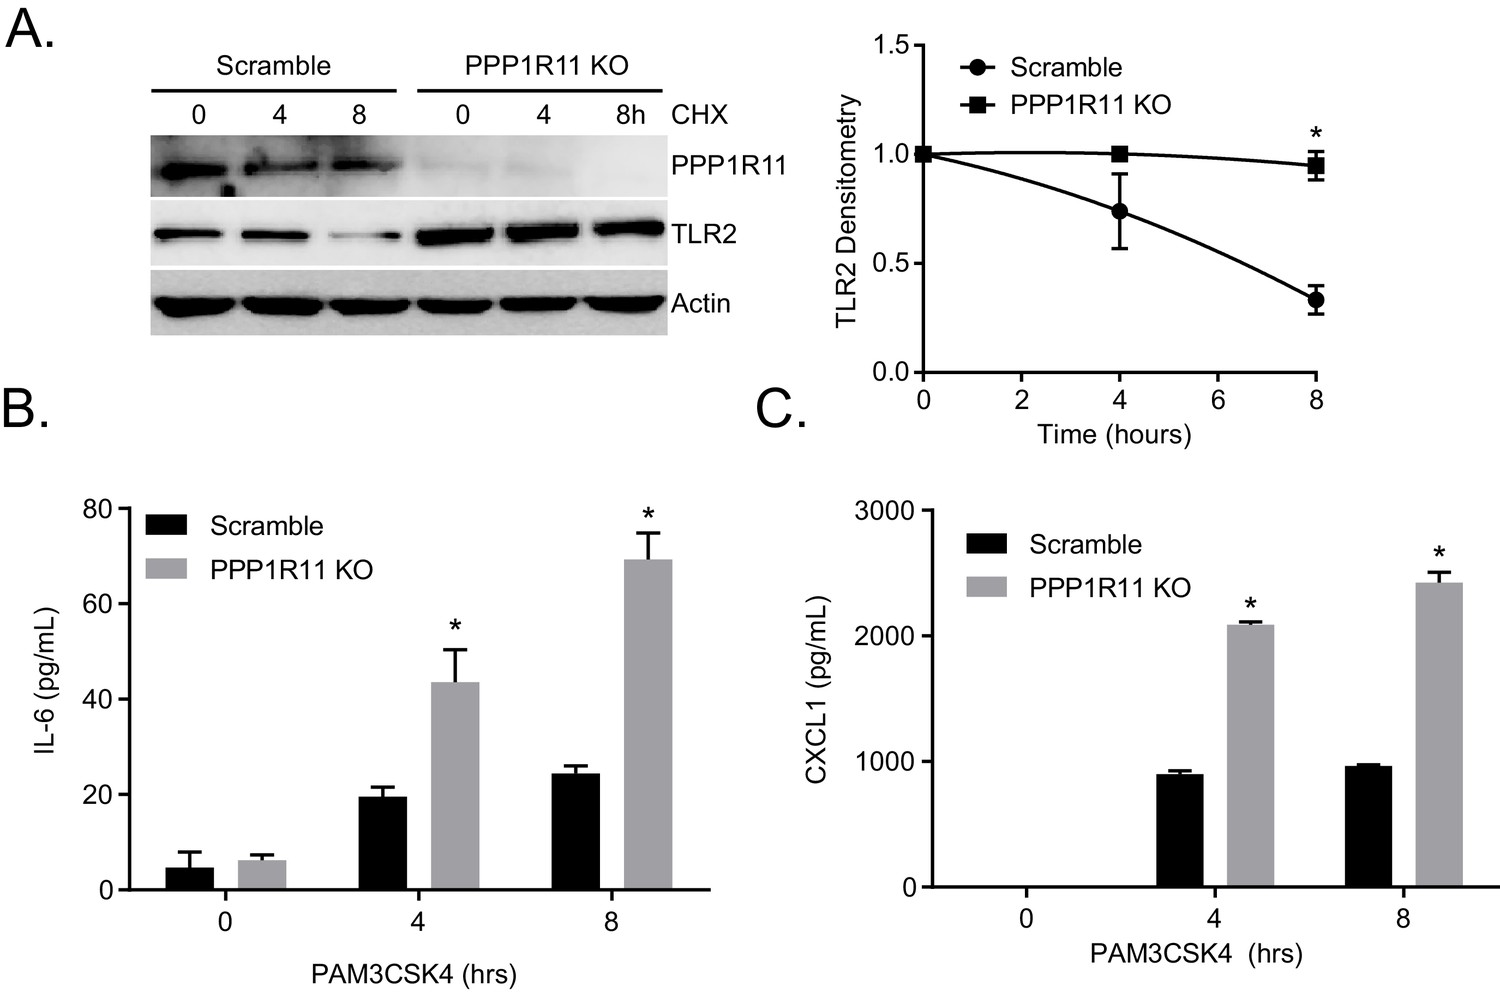
Ppp1r11 KO cells rescue TLR2 stability and function.
(A) Half-life study of TLR2 in Ppp1r11 CRISPR KO MLE cells and Ctrl MLE cells. The levels of each protein on immunoblots were quantified densitometrically (Normalized to Time zero) and shown graphically. The data represent mean values ± SEM (n = 3); *p<0.05, significant compared to Control, Student’s t-test. (B–C) Ppp1r11 KO and control cells were exposed to Pam3CSK4 in a time-dependent manner. Cell media was then collected and assayed for IL-6 and CXCL1 (Data represent mean values ± SEM n = 3; *p<0.05, significant compared to Control, Student’s t-test).
-
Figure 2—figure supplement 2—source data 1
This file contains raw source data used to create graphs in Figure 2—figure supplement 2.
- https://doi.org/10.7554/eLife.18496.015
Figure 3
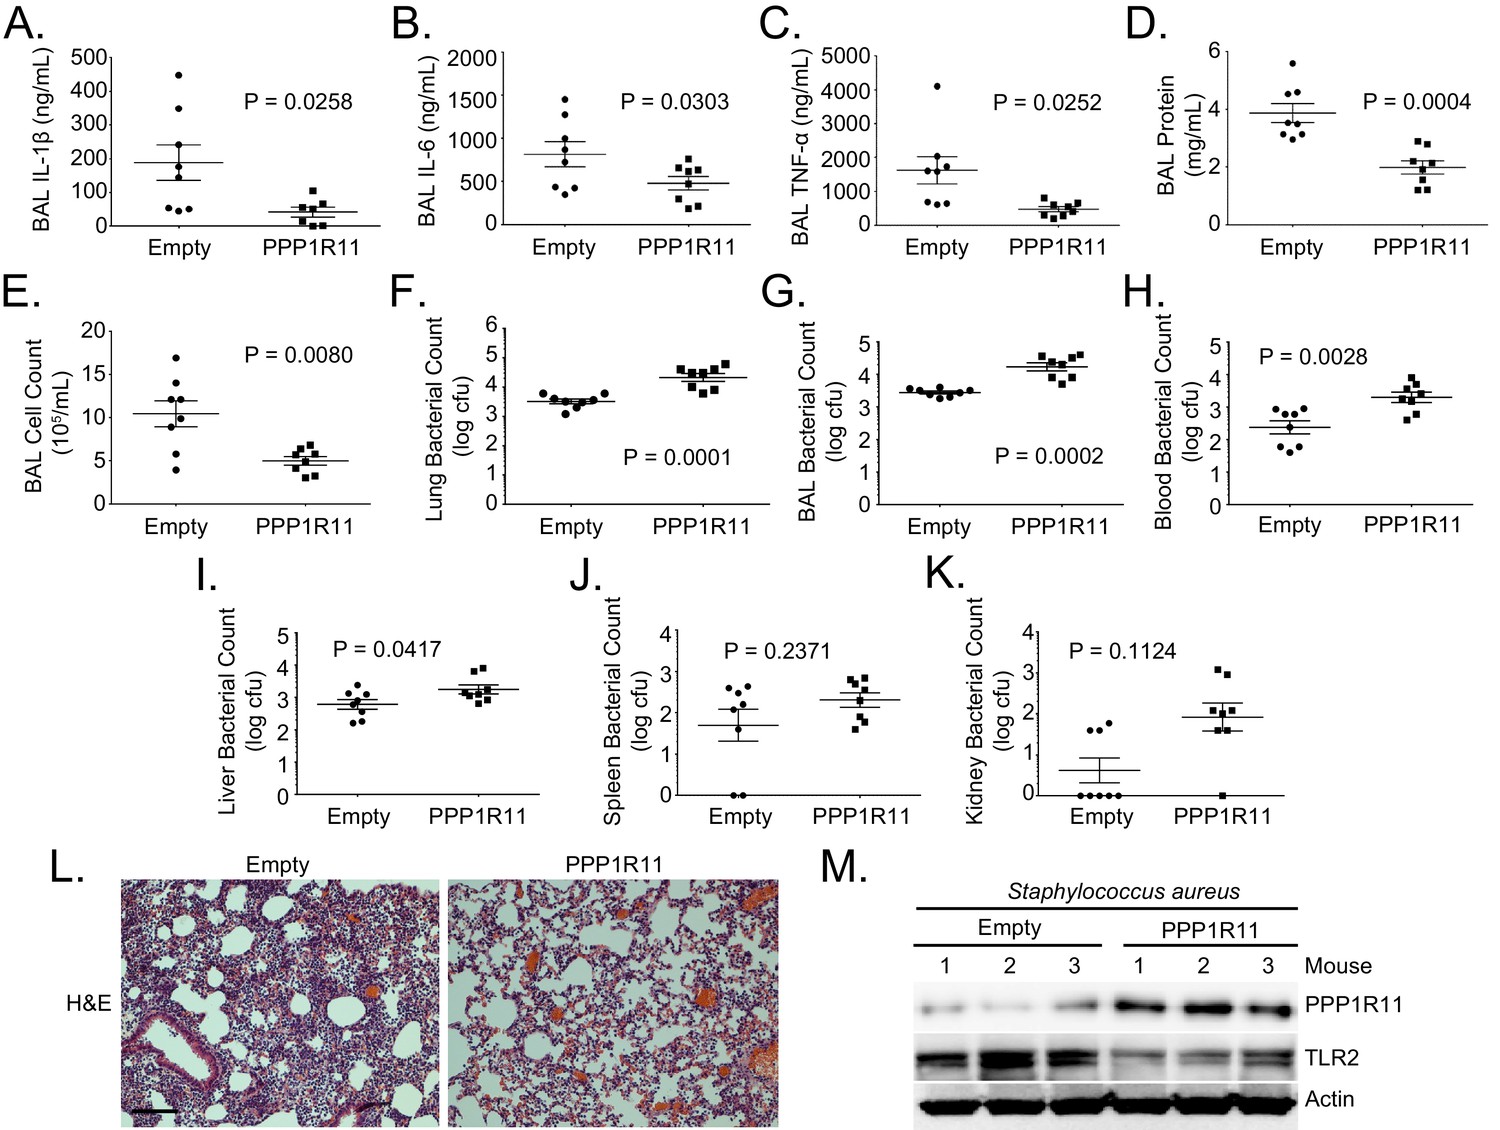
PPP1R11 gene transfer in the lung reduces lung inflammation and decreases bacterial clearance.
Lenti-Empty or Lenti-PPP1R11 (107PFU/mouse) was administered i.t. to C57BL/6J mice for 144 hr; mice were then infected i.t. with S. aureus (108 CFU). Mice were euthanized after 18 hr, and lungs were lavaged with saline, harvested, and then homogenized. Blood, liver, spleen, and kidney were also harvested and homogenized. (A–E) and (G). Lavage cytokines, BAL protein, BAL cell counts, and BAL bacterial counts were measured. The data represent mean values ± SEM (n = 8 mice per group; p<0.05, significant compared to Control, Student’s t-test). (F) and (H–K). Lung, blood, liver, spleen, and kidney bacterial counts were measured. The data represent mean values ± SEM (n = 8 mice per group; p<0.05, significant compared to Control, Student’s t-test). (L) H and E staining was performed on lung samples. Original magnification, 20X. Bar indicates 100 μm. (M) Mice lungs were isolated and assayed for TLR2, PPP1R11, and Actin immunoblotting.
-
Figure 3—source data 1
This file contains raw source data used to create graphs in Figure 3.
- https://doi.org/10.7554/eLife.18496.017
Figure 4
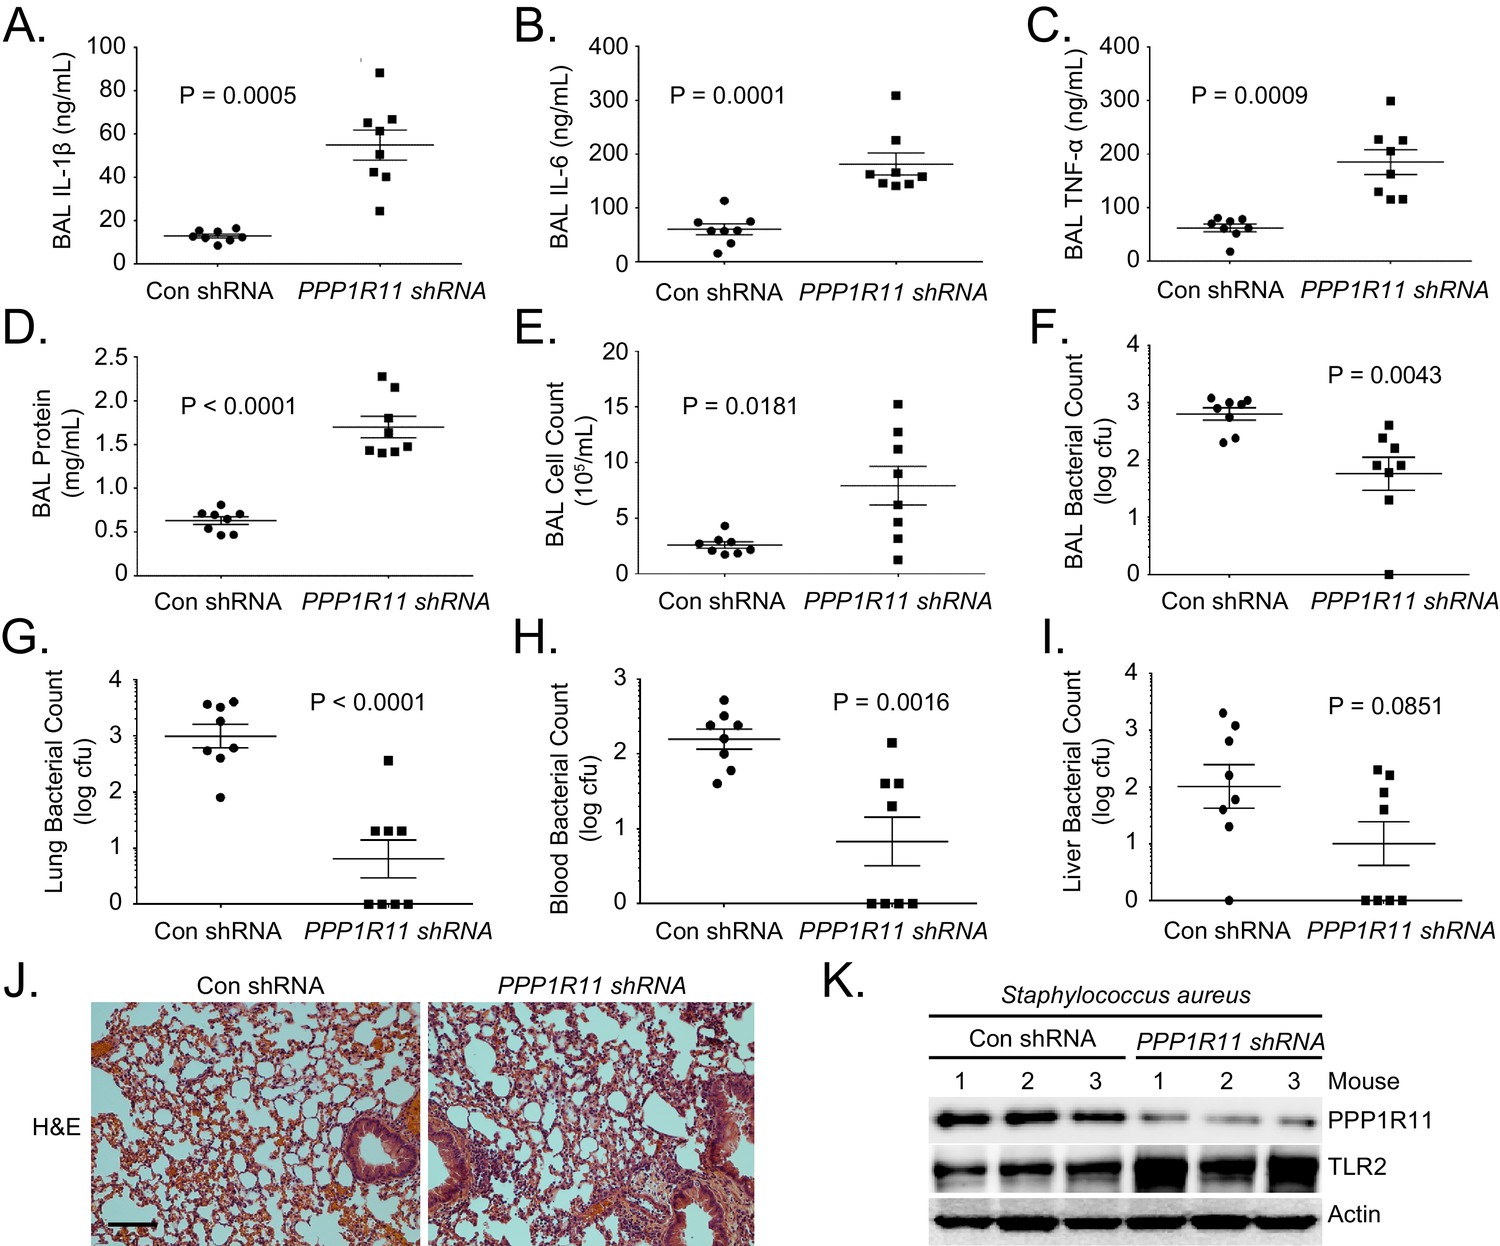
PPP1R11 knockdown induces lung inflammation and increases bacterial clearance.
Lenti-control shRNA or Lenti-PPP1R11 shRNA (107 PFU/mouse) was administered i.t. to C57BL/6J mice for 144 hr; mice were then infected i.t. with S. aureus (2.5*107 CFU). Mice were euthanized after 18 hr, and lungs were lavaged with saline, harvested, and then homogenized. Blood, liver, spleen, and kidney were also harvested and homogenized. (A–F) Lavage cytokines, BAL protein, BAL cell counts, and BAL bacterial counts were measured. The data represent mean values ± SEM (n = 8 mice per group; p<0.05, significant compared to Control, Student’s t-test). (G–I). Lung, blood, and liver bacterial counts were measured. The data represent mean values ± SEM (n = 8 mice per group; p<0.05, significant compared to Control, Student’s t-test).(J) H and E staining was performed on lung samples. Original magnification, 20X. Bar indicates 100 μm. (K) Mice lungs were isolated and assayed for TLR2, PPP1R11, and Actin immunoblotting.
-
Figure 4—source data 1
This file contains raw source data used to create graphs in Figure 4.
- https://doi.org/10.7554/eLife.18496.019
Download links
A two-part list of links to download the article, or parts of the article, in various formats.
Downloads (link to download the article as PDF)
Open citations (links to open the citations from this article in various online reference manager services)
Cite this article (links to download the citations from this article in formats compatible with various reference manager tools)
RING finger E3 ligase PPP1R11 regulates TLR2 signaling and innate immunity
eLife 5:e18496.
https://doi.org/10.7554/eLife.18496


