Structural characterization of encapsulated ferritin provides insight into iron storage in bacterial nanocompartments
- The University of Edinburgh, United Kingdom
- Newcastle University, United Kingdom
Figures
Figure 1 with 1 supplement
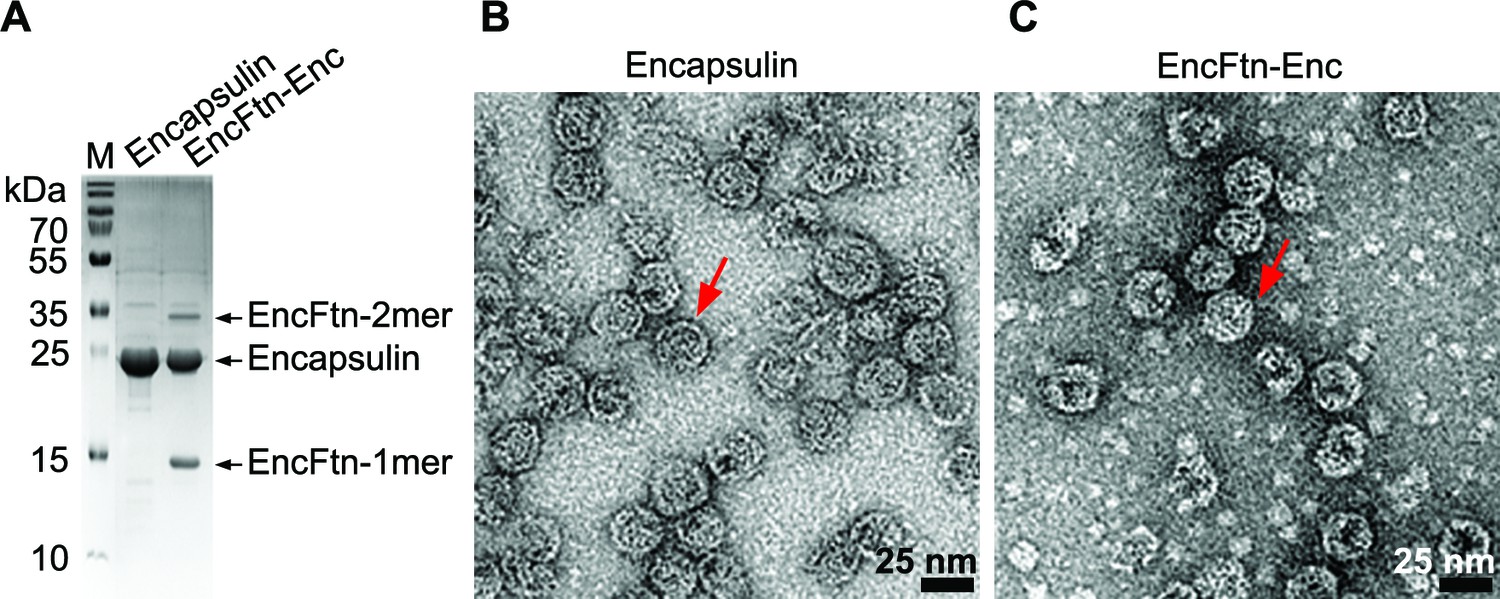
Purification of recombinant R. rubrum encapsulin nanocompartments.
(A) Recombinantly expressed encapsulin (Enc) and co-expressed EncFtn-Enc were purified by sucrose gradient ultracentrifugation from E. coli B834(DE3) grown in SeMet medium. Samples were resolved by 18% acrylamide SDS-PAGE; the position of the proteins found in the complexes as resolved on the gel are shown with arrows. (B/C) Negative stain TEM image of recombinant encapsulin and EncFtn-Enc nanocompartments. Samples were imaged at 143,000 x magnification, with scale bar shown as 25 nm. Representative encapsulin and EncFtn-Enc complexes are indicated with red arrows.
Figure 1—figure supplement 1
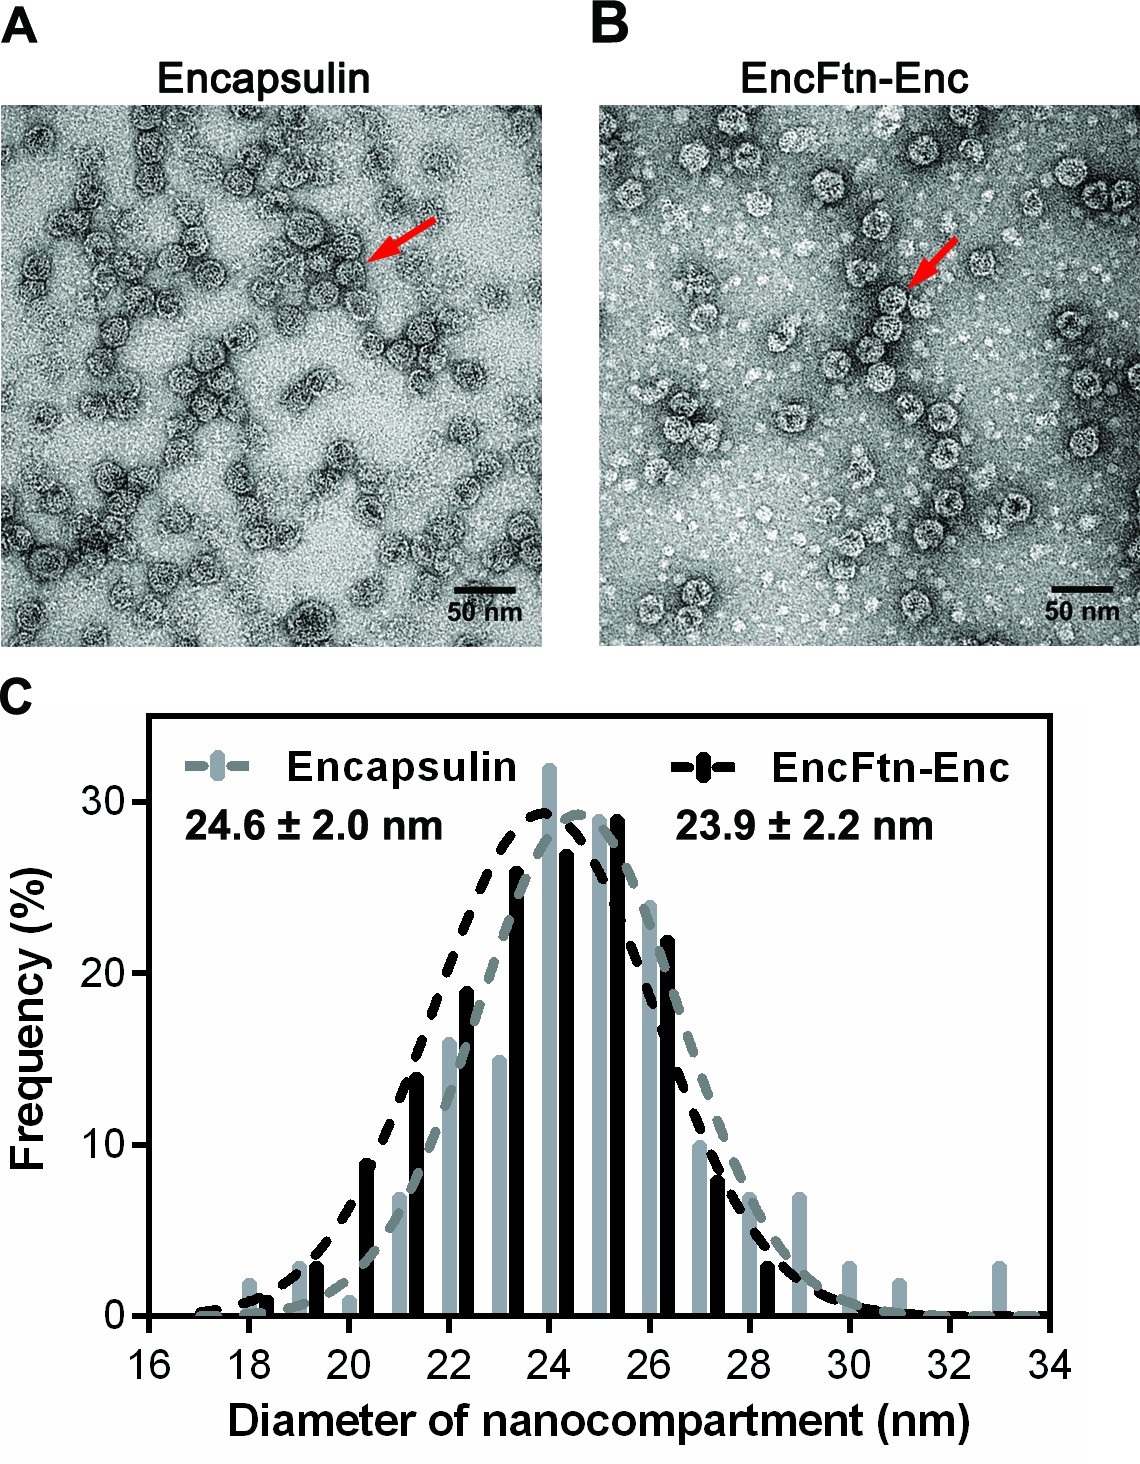
Full-frame transmission electron micrographs of R. rubrum nanocompartments.
(A/B) Negative stain TEM image of recombinant R. rubrum encapsulin and EncFtn-Enc nanocompartments. All samples were imaged at 143,000 x magnification; the scale bar length corresponds to 50 nm. (C) Histogram showing the distribution of nanocompartment diameters. A model Gaussian nonlinear least square function was fitted to the data to obtain a mean diameter of 24.6 nm with a standard deviation of 2.0 nm for encapsulin (grey) and a mean value of 23.9 nm with a standard deviation of 2.2 nm for co-expressed EncFtn and encapsulin (EncFtn-Enc, black).
Figure 2
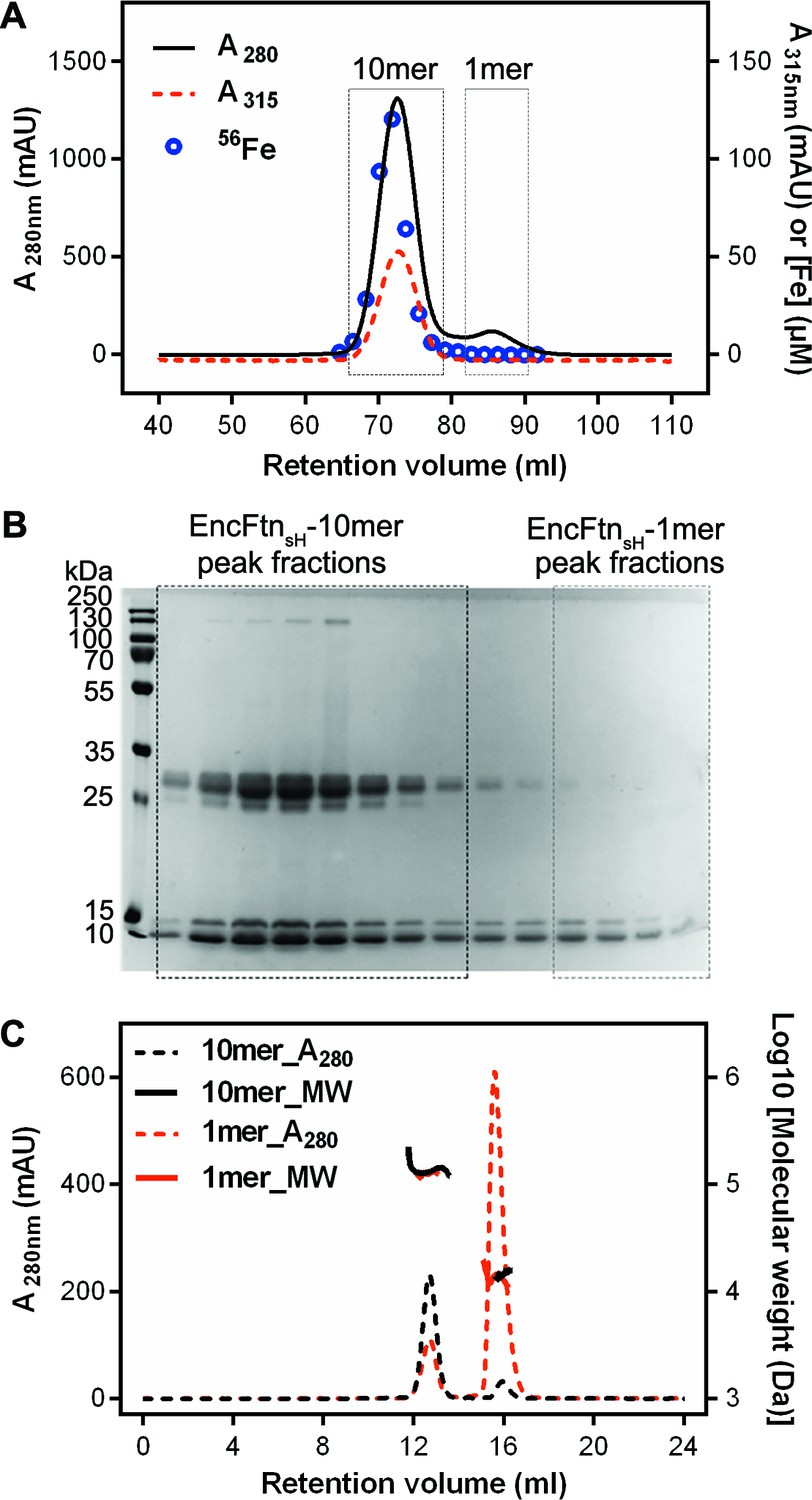
Purification of recombinant R. rubrum EncFtnsH.
(A) Recombinant SeMet-labeled EncFtnsH produced with 1 mM Fe(NH4)2(SO4)2 in the growth medium was purified by nickel affinity chromatography and size-exclusion chromatography using a Superdex 200 16/60 column (GE Healthcare). Chromatogram traces measured at 280 nm and 315 nm are shown with the results from ICP-MS analysis of the iron content of the fractions collected during the experiment. The peak around 73 ml corresponds to a molecular weight of around 130 kDa when compared to calibration standards; this is consistent with a decamer of EncFtnsH. The small peak at 85 ml corresponds to the 13 kDa monomer compared to the standards. Only the decamer peak contains significant amounts of iron as indicated by the ICP-MS analysis. (B) Peak fractions from the gel filtration run were resolved by 15% acrylamide SDS-PAGE and stained with Coomassie blue stain. The bands around 13 kDa and 26 kDa correspond to EncFtnsH, as identified by MALDI peptide mass fingerprinting. The band at 13 kDa is consistent with the monomer mass, while the band at 26 kDa is consistent with a dimer of EncFtnsH. The dimer species only appears in the decamer fractions. (C) SEC-MALLS analysis of EncFtnsH from decamer fractions and monomer fractions allows assignment of an average mass of 132 kDa to decamer fractions and 13 kDa to monomer fractions, consistent with decamer and monomer species (Table 2).
Figure 3 with 2 supplements

Effect of Fe2+ and protein concentration on the oligomeric state of EncFtnsH in solution.
(A) Recombinant EncFtnsH was purified by Gel filtration Superdex 200 chromatography from E. coli BL21(DE3) grown in MM or in MM supplemented with 1 mM Fe(NH4)2(SO4)2 (MM+Fe2+). A higher proportion of decamer (peak between 65 and 75 ml) is seen in the sample purified from MM+Fe2+ compared to EncFtnsH-MM, indicating that Fe2+ facilitates the multimerization of EncFtnsH in vivo. (B) EncFtnsH-monomer was incubated with one molar equivalent of Fe2+ salts for two hours prior to analytical gel-filtration using a Superdex 200 PC 3.2/30 column (GE Healthcare). Both Fe2+ salts tested induced the formation of decamer indicated by the peak between 1.2 and 1.6 ml. Monomeric and decameric samples of EncFtnsH are shown as controls. Peaks around 0.8 ml were seen as protein aggregation. (C) Analytical gel filtration of EncFtn monomer at different concentrations to illustrate the effect of protein concentration on multimerization. The major peak shows a shift towards a dimer species at high concentration of protein, but the ratio of this peak (1.5–1.8 ml) to the decamer peak (1.2–1.5 ml) does not change when compared to the low concentration sample.
Figure 3—figure supplement 1

Effect of metal ions on the oligomeric state of EncFtnsH in solution.
(A/B) EncFtnsH-monomer was incubated with one mole equivalent of various metal salts for two hours prior to analytical gel-filtration using a Superdex 200 PC 3.2/30 column. Co2+ and Zn2+ induced the formation of the decameric form of EncFtnsH; while Mn2+, Mg2+ and Fe3+ did not significantly alter the oligomeric state of EncFtnsH.
Figure 3—figure supplement 2
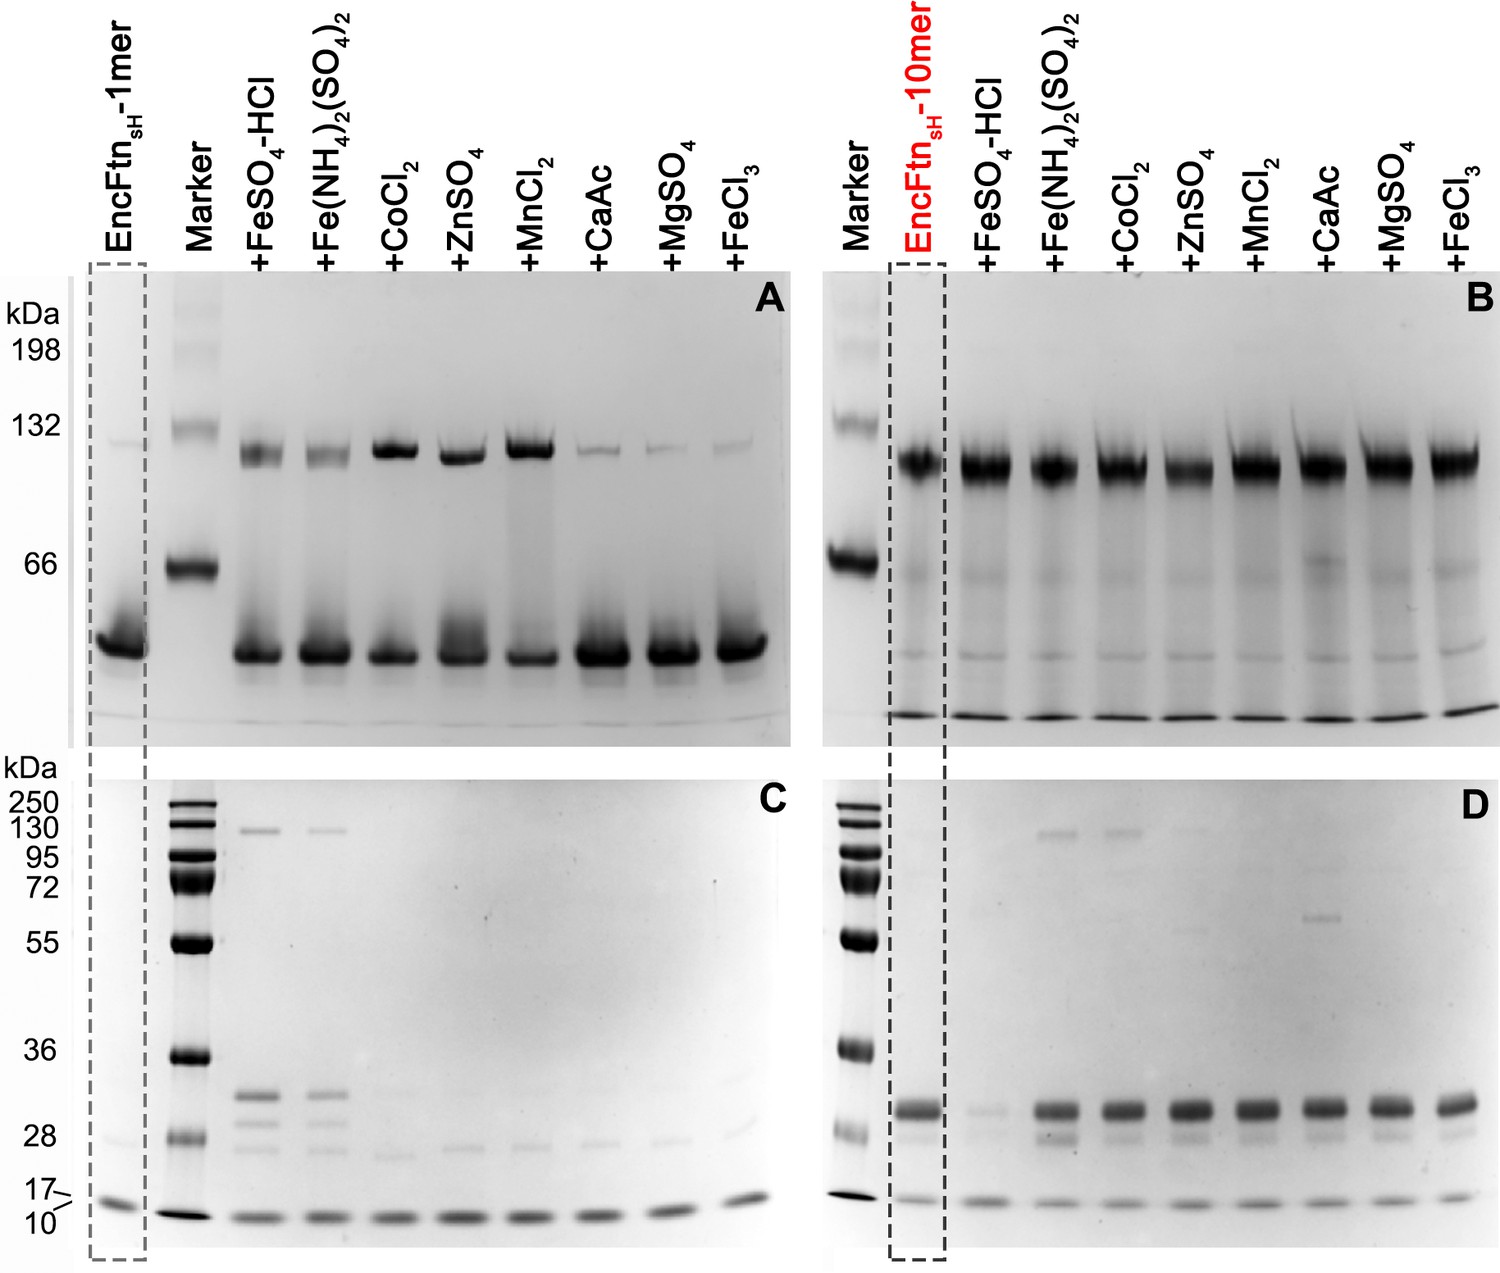
PAGE analysis of the effect of metal ions on the oligomeric state of EncFtnsH.
50 µM EncFtnsH monomer or decamer samples were mixed with equal molar metal ions including Fe2+, Co2+, Zn2+, Mn2+, Ca2+, Mg2+ and Fe3+, which were analyzed by Native PAGE alongside SDS-PAGE. (A) 10% Native PAGE analysis of EncFtnsH monomer fractions mixed with various metal solutions; (B) 10% Native PAGE analysis of EncFtnsH decamer fractions mixed with various metal solutions; (C) 15% SDS-PAGE analysis on the mixtures of EncFtnsH monomer fractions and metal solutions; (D) 15% SDS-PAGE analysis on the mixtures of EncFtnsH decamer fractions and metal solutions.
Figure 4 with 1 supplement
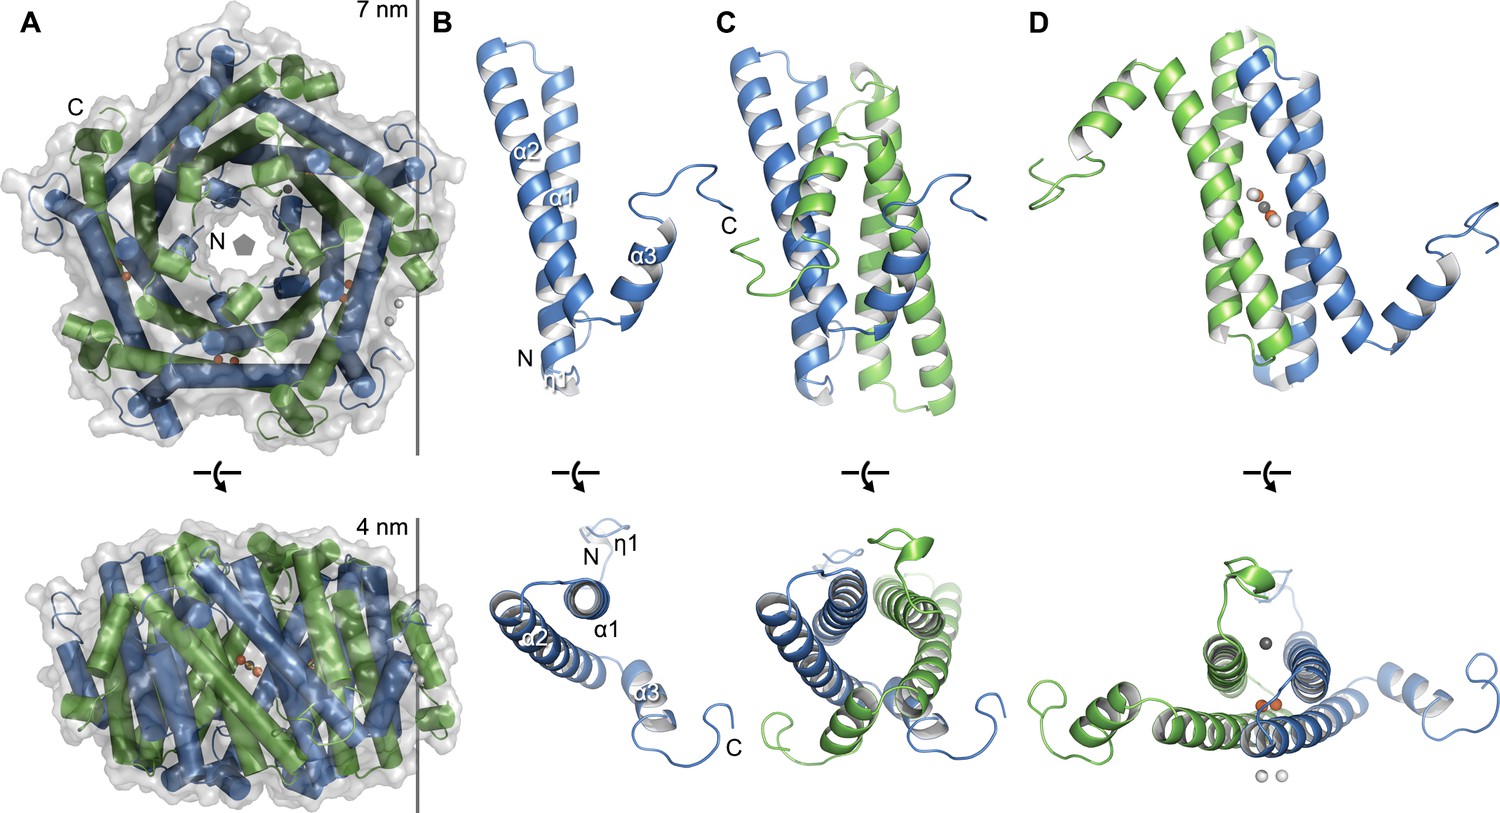
Crystal structure of EncFtnsH.
(A) Overall architecture of EncFtnsH. Transparent solvent accessible surface view with α-helices shown as tubes and bound metal ions as spheres. Alternating subunits are colored blue and green for clarity. The doughnut-like decamer is 7 nm in diameter and 4.5 nm thick. (B) Monomer of EncFtnsH shown as a secondary structure cartoon. (C/D) Dimer interfaces formed in the decameric ring of EncFtnsH. Subunits are shown as secondary structure cartoons and colored blue and green for clarity. Bound metal ions are shown as orange spheres for Fe3+ and grey and white spheres for Ca2+.
Figure 4—figure supplement 1
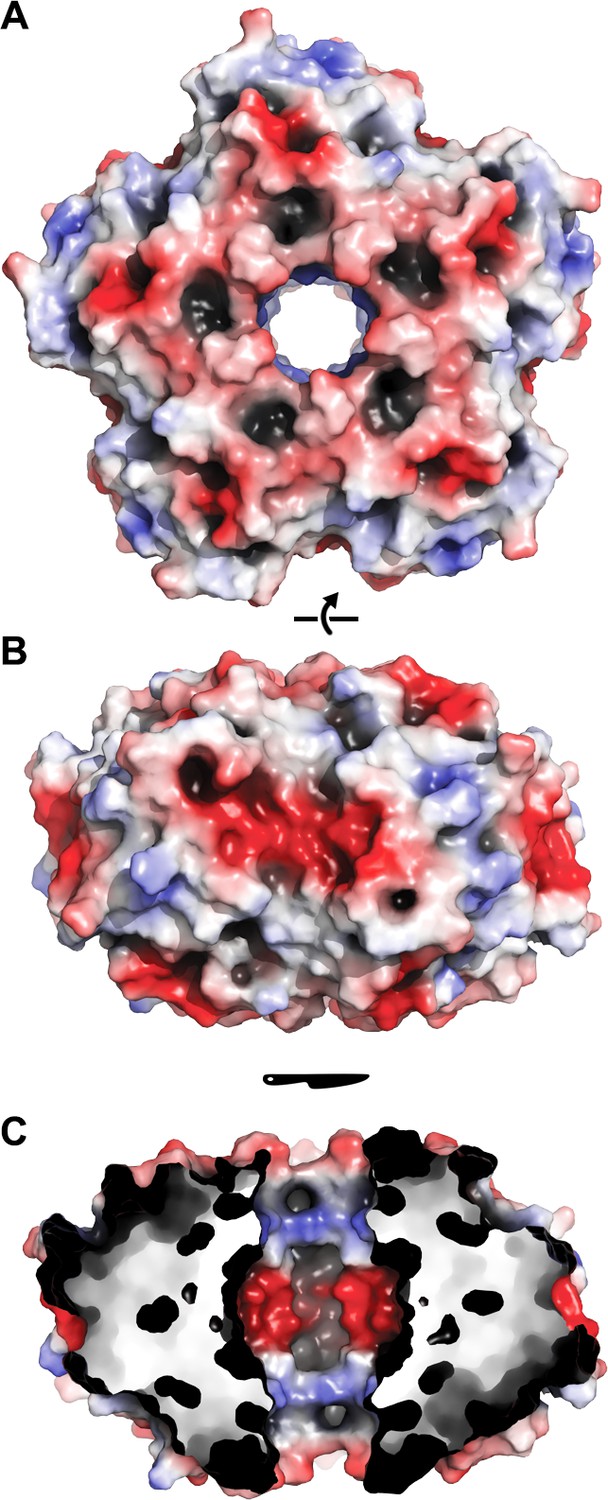
Electrostatic surface of EncFtnsH.
The solvent accessible surface of EncFtnsH is shown, colored by electrostatic potential as calculated using the APBS plugin in PyMOL. Negatively charged regions are colored red and positive regions in blue, neutral regions in grey. (A) View of the surface of the EncFtnsH decamer looking down the central axis. (B) Orthogonal view of (A). (C) Cutaway view of (B) showing the charge distribution within the central cavity.
Figure 5 with 1 supplement
EncFtnsH metal binding sites.
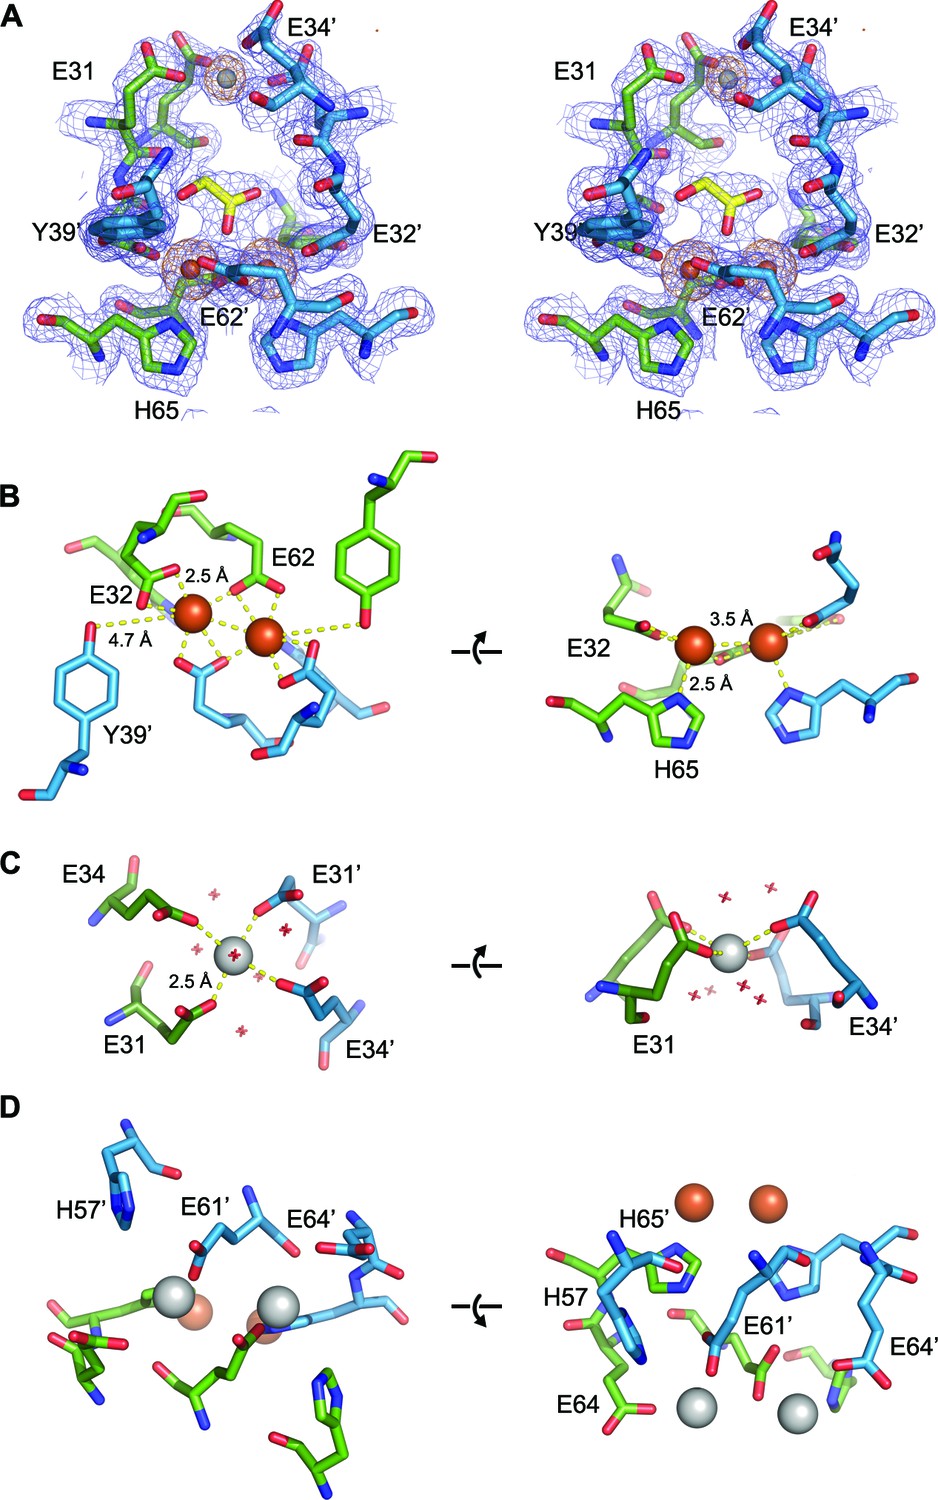
(A) Wall-eyed stereo view of the metal-binding dimerization interface of EncFtnsH. Protein residues are shown as sticks with blue and green carbons for the different subunits, iron ions are shown as orange spheres and calcium as grey spheres, and the glycolic acid ligand is shown with yellow carbon atoms coordinated above the di-iron center. The 2mFo-DFc electron density map is shown as a blue mesh contoured at 1.5 σ and the NCS-averaged anomalous difference map is shown as an orange mesh and contoured at 10 σ. (B) Iron coordination within the FOC including residues Glu32, Glu62, His65 and Tyr39 from two chains. Protein and metal ions are shown as in A. Coordination between the protein and iron ions is shown as yellow dashed lines with distances indicated. (C) Coordination of calcium within the dimer interface by four glutamic acid residues (E31 and E34 from two chains). The calcium ion is shown as a grey sphere and water molecules involved in the coordination of the calcium ion are shown as crosses. (D) Metal coordination site on the outer surface of EncFtnsH. The two calcium ions are coordinated by residues His57, Glu61 and Glu64 from the two chains of the FOC dimer, and are located at the outer surface of the complex, positioned 10 Å away from the FOC iron.
Figure 5—figure supplement 1
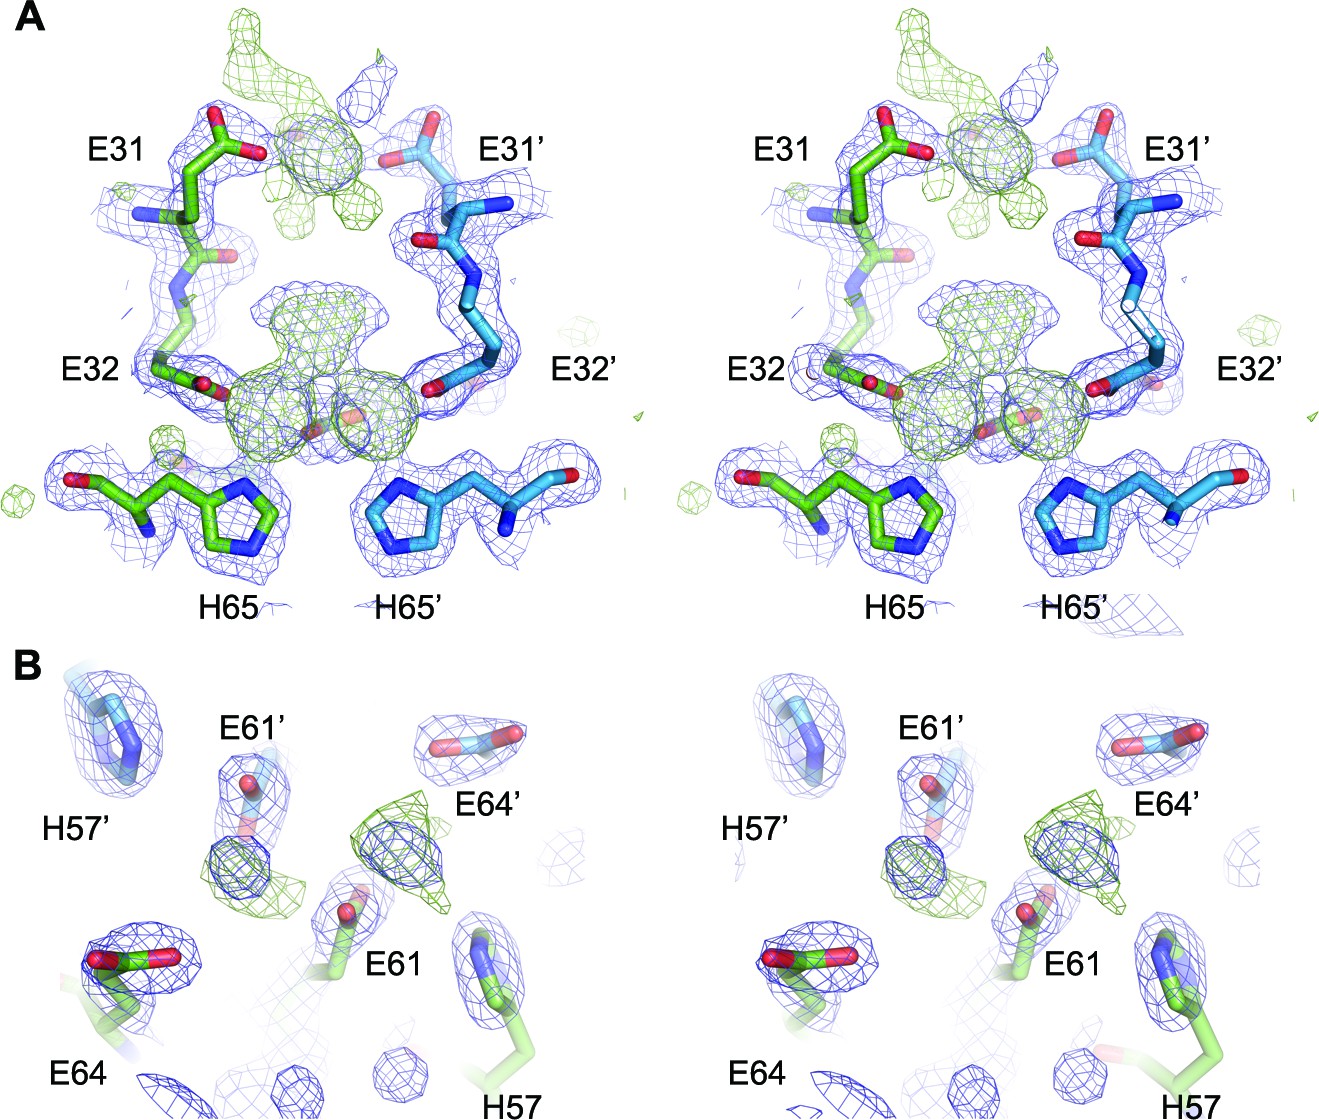
Putative ligand-binding site in EncFtnsH.
(A) Wall-eyed stereo view of the dimer interface of EncFtn. Protein chains are shown as sticks, with 2mFo-DFc electron density shown in blue mesh and contoured at 1.5 σ and mFo-DFc shown in green mesh and contoured at 3 σ. (B) Wall-eyed stereo view of putative metal binding site at the external surface of EncFtnsH. Protein chains and electron density maps are shown as in (A).
Figure 6 with 1 supplement
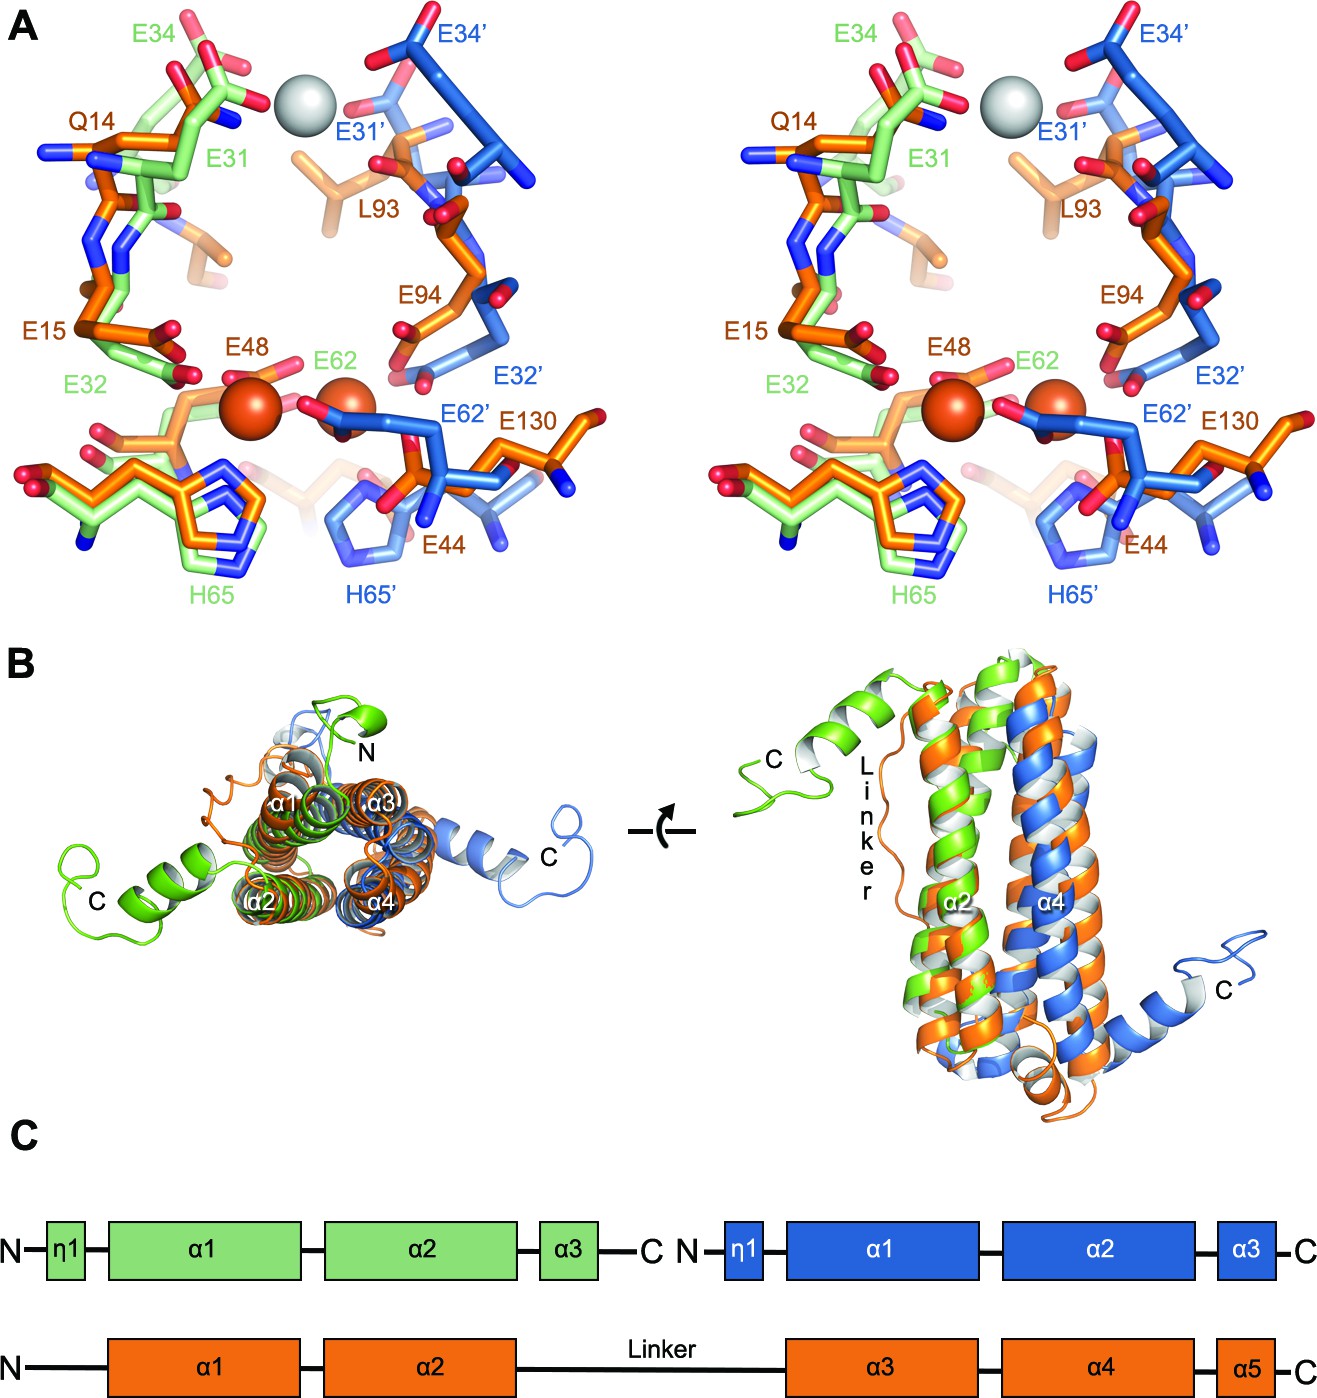
Comparison of the symmetric metal ion binding site of EncFtnsH and the ferritin FOC.
(A) Structural alignment of the FOC residues in a dimer of EncFtnsH (green/blue) with a monomer of Pseudo-nitzschia multiseries ferritin (PmFtn) (PDBID: 4ITW) (orange) (Pfaffen et al., 2013). Iron ions are shown as orange spheres and a single calcium ion as a grey sphere. Residues within the FOC are conserved between EncFtn and ferritin PmFtn, with the exception of residues in the position equivalent to H65’ in the second subunit in the dimer (blue). The site in EncFtn with bound calcium is not present in other family members. (B) Secondary structure of aligned dimeric EncFtnsH and monomeric ferritin highlighting the conserved four-helix bundle. EncFtnsH monomers are shown in green and blue and aligned PmFtn monomer in orange as in A. (C) Cartoon of secondary structure elements in EncFtn dimer and ferritin. In the dimer of EncFtn that forms the FOC, the C-terminus of the first monomer (green) and N-terminus of the second monomer (blue) correspond to the position of the long linker between α2 and α3 in ferritin PmFtn.
Figure 6—figure supplement 1

Comparison of quaternary structure of EncFtnsH and ferritin.
(A) Aligned FOC of EncFtnsH and Pseudo-nitzschia multiseries ferritin (PmFtn) (Pfaffen et al., 2013). The metal binding site residues from two EncFtnsH chains are shown in green and blue, while the PmFtn is shown in orange. Fe2+ in the FOC is shown as orange spheres and Ca2+ in EncFtnsH is shown as a grey sphere. The two-fold symmetry axis of the EncFtn FOC is shown with a grey arrow (B) Cross-section surface view of quaternary structure of EncFtnsH and PmFtn as aligned in (A) (dashed black box). The central channel of EncFtnsH is spatially equivalent to the outer surface of ferritin and its outer surface corresponds to the mineralization surface within ferritin.
Figure 7 with 2 supplements

Native mass spectrometry and ion mobility analysis of iron loading in EncFtnsH.
All spectra were acquired in 100 mM ammonium acetate, pH 8.0 with a protein concentration of 5 µM. (A) Native nanoelectrospray ionization (nESI) mass spectrometry of EncFtnsH at varying iron concentrations. A1, nESI spectrum of iron-free EncFtnsH displays a charge state distribution consistent with EncFtnsH monomer (blue circles, 13,194 Da). Addition of 100 µM (A2) and 300 µM (A3) Fe2+ results in the appearance of a second higher molecular weight charge state distribution consistent with a decameric assembly of EncFtnsH (green circles, 132.6 kDa). (B) Ion mobility (IM)-MS of the iron-bound holo-EncFtnsH decamer. Top, Peaks corresponding to the 22+ to 26+ charge states of a homo-decameric assembly of EncFtnsH are observed (132.6 kDa). Top Insert, Analysis of the 24+ charge state of the assembly at m/z 5528.2 Th. The theoretical average m/z of the 24+ charge state with no additional metals bound is marked by a red line (5498.7 Th); the observed m/z of the 24+ charge state indicates that the EncFtnsH assembly binds between 10 (green line, 5521.1 Th) and 15 Fe ions (blue line, 5532.4 Th) per decamer. Bottom, The arrival time distributions (ion mobility data) of all ions in the EncFtnsH charge state distribution displayed as a greyscale heat map (linear intensity scale). Bottom right, The arrival time distribution of the 24+ charge state (dashed blue box) has been extracted and plotted. The drift time for this ion is shown (ms), along with the calibrated collision cross section (CCS), Ω (nm2).
Figure 7—figure supplement 1
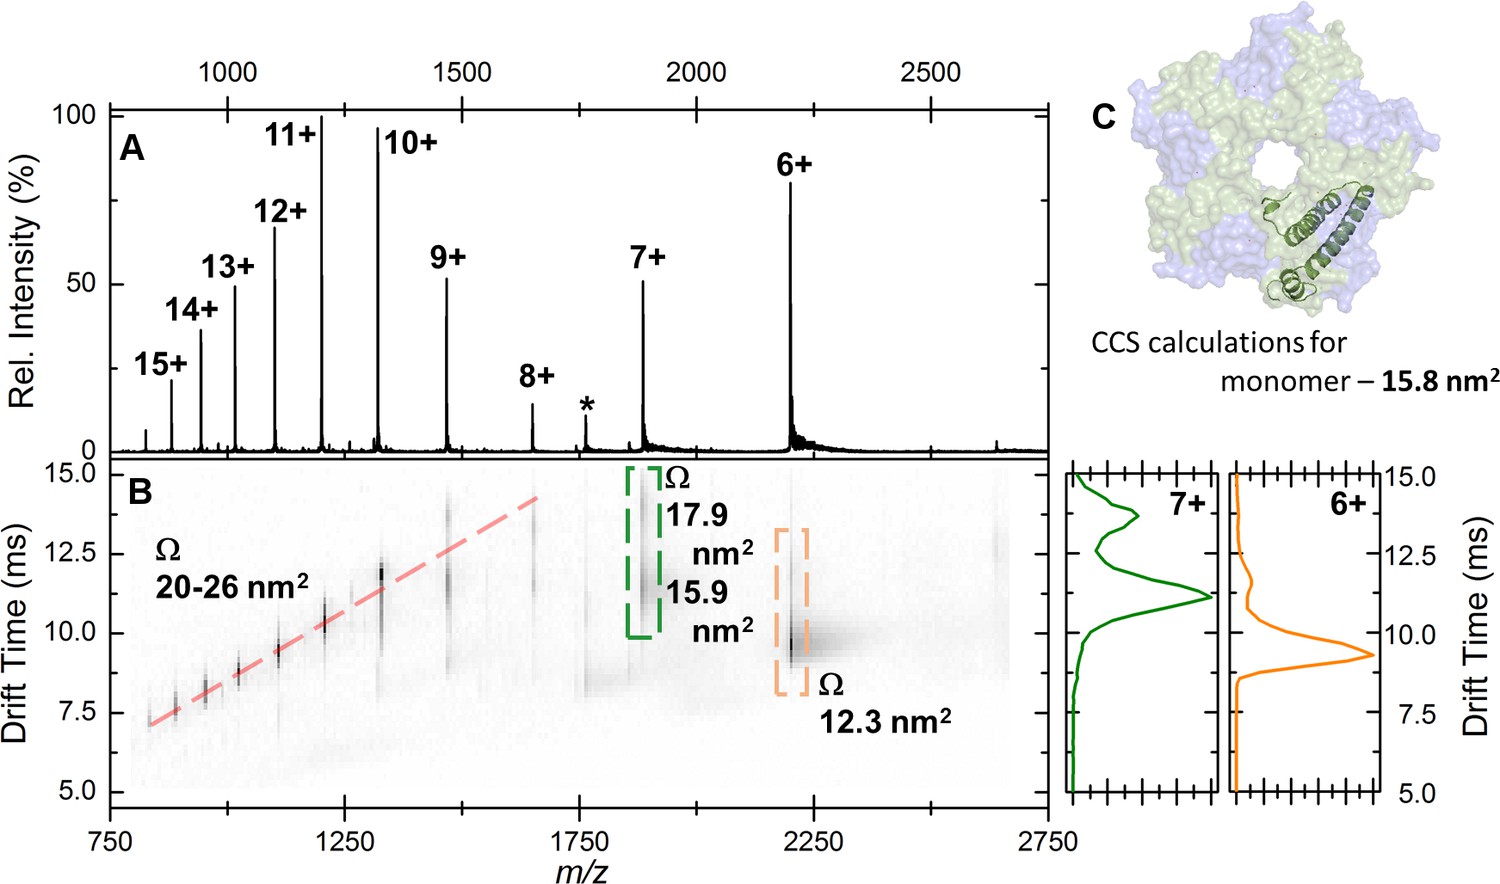
Native IM-MS analysis of the apo-EncFtnsH monomer.
(A) Mass spectrum of apo-EncFtnsH acquired from 100 mM ammonium acetate pH 8.0 under native MS conditions. The charge state distribution observed is bimodal, with peaks corresponding to the 6+ to 15+ charge states of apo-monomer EncFtnsH (neutral average mass 13,194.3 Da). (B) The arrival time distributions (ion mobility data) of all ions in the apo-EncFtnsH charge state distribution displayed as a greyscale heat map (linear intensity scale). (B) Right, the arrival time distribution of the 6+ (orange) and 7+ (green) charge state (dashed colored‐box) has been extracted and plotted; The arrival time distributions for these ion is shown (ms), along with the calibrated collision cross section, Ω (nm2). (C) The collision cross section of a single monomer unit from the crystal structure of the Fe-loaded EncFtnsH decamer was calculated to be 15.8 nm2 using IMPACT v. 0.9.1. The +8 to +15 protein charge states have observed CCS between 20–26 nm2, which is significantly higher than the calculated CCS for an EncFtnsH monomer taken from the decameric assembly crystal structure (15.8 nm2). The mobility of the +7 charge state displays broad drift-time distribution with maxima consistent with CCS of 15.9 and 17.9 nm2. Finally, the 6+ charge state of EncFtnsH has mobility consistent with a CCS of 12.3 nm2, indicating a more compact/collapsed structure. It is clear from this data that apo-EncFtnsH exists in several gas phase conformations. The range of charge states occupied by the protein (6+ to 15+) and the range of CCS in which the protein is observed (12.3 nm2 – 26 nm2) are both large. In addition, many of the charge states observed have higher charge than the theoretical maximal charge on spherical globular protein, as determined by the De La Mora relationship (ZR = 0.0778m; for the EncFtnsH monomer ZR = 8.9) Fernandez (Fernandez de la Mora, 2000). As described by Beveridge et al., all these factors are indicative of a disordered protein (Beveridge et al., 2014).
Figure 7—figure supplement 2
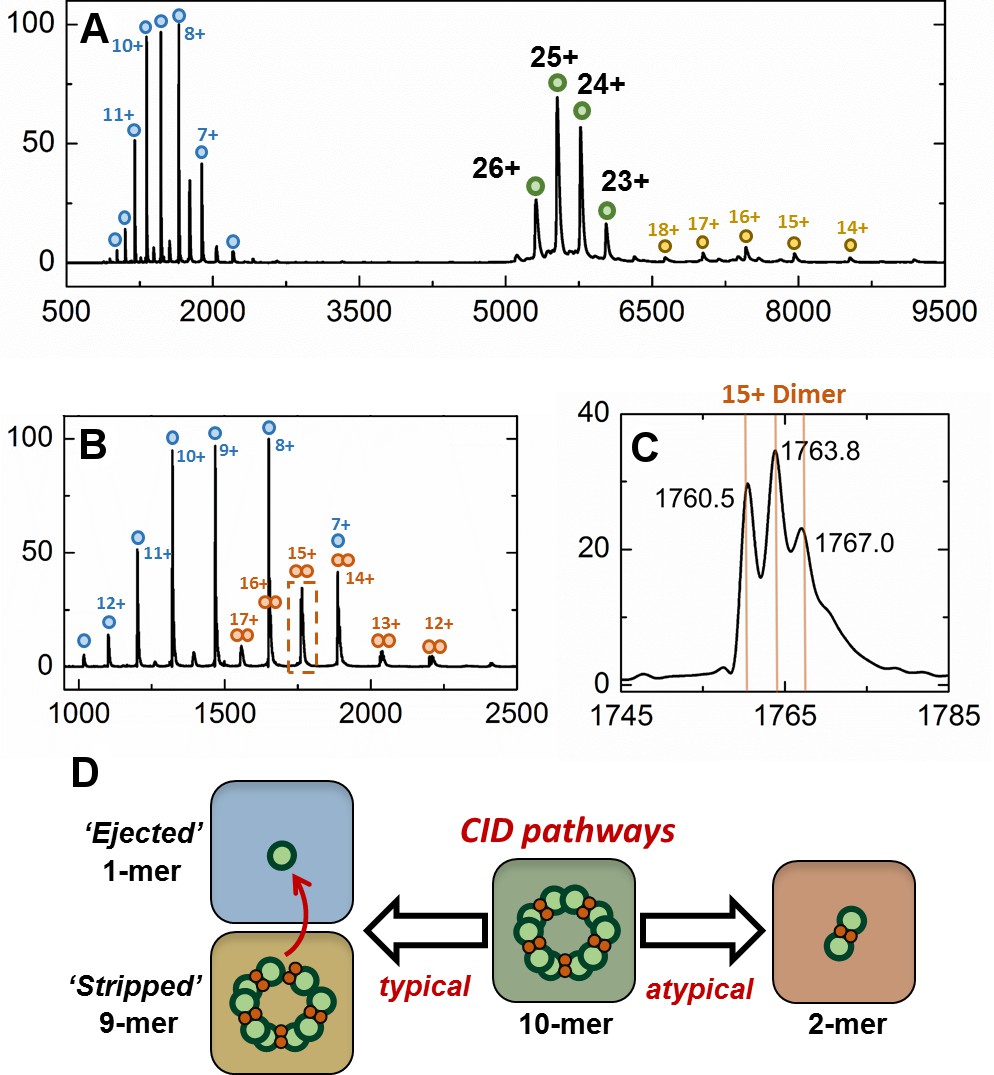
Gas-phase disassembly of the holo-EncFtnsH decameric assembly.
The entire charge state distribution of the Fe-loaded holo- EncFtnsH assembly (green circles) was subject to collisional-induced dissociation (CID) by increasing the source cone voltage to 200 V and the trap voltage to 50 V. The resulting CID mass spectrum (A) revealed that dissociation of the holo- EncFtnsH decamer primarily occurred via ejection of a highly charged monomer (blue circles), leaving the ‘stripped’ complex (a 9mer; 118.7 kDa; yellow circles). The mass of the ejected-monomer is consistent with apo- EncFtnsH (13.2 kDa), suggesting unfolding of the monomer (and loss of Fe) occurs during ejection from the complex. This observation of asymmetric charge partitioning of the sub-complexes with respect to the mass of the complex is consistent with the 'typical' pathway of dissociation of protein assemblies by CID, as described by Hall et al. (2013). In addition, a third, lower abundance, charge state distribution is observed which overlaps the EncFtn ejected monomer charge state distribution; this region of the spectrum is highlighted in (B). This distribution is consistent with an ejected EncFtnsH dimer (orange circles). Interestingly, closer analysis of the individual charge state of this dimeric CID product shows that this sub-complex exists in three forms – displaying mass consistent with an EncFtnsH dimer binding 0, 1, and 2 Fe ions. This is highlighted in (C), where the 15+ charge state of the EncFtnsH dimer is shown; 3 peaks are observed with m/z 1760.5, 1763.8, and 1767.0 Th – the lowest peak corresponds to neutral masses of 26392.5 Da [predicted EncFtnsH dimer, (C572H884N172O185S2)2; 26388.6 Da]. The two further peaks have a delta-mass of ~+50 Da, consistent with Fe binding. We interpret these observations as partial ‘atypical’ CID fragmentation of the decameric complex – i.e. fragmentation of the initial complex with retention of subunit and ligand interactions. A schematic summary of these results is displayed in (D). We postulate the high stability of this iron-bound dimer sub-complex is due to the metal coordination at the dimer interface, increasing the strength of the dimer interface. Taken together, these observations support our findings that the topology of the decameric EncFtnsH assembly is arranged as a pentamer of dimers, with two Fe ions at each dimer interface.
Figure 8 with 1 supplement

Spectroscopic evidence for the ferroxidase activity and comparison of iron loading capacity of apoferritin, EncFtnsH, encapsulin, and EncFtn-Enc.
(A) Apoferritin (10 μM monomer concentration) and EncFtnsH decamer fractions (20 μM monomer concentration, 10 μM FOC concentration) were incubated with 20 and 100 μM iron (2 and 10 times molar equivalent Fe2+ per FOC) and progress curves of the oxidation of Fe2+ to Fe3+ at 315 nm were recorded in a spectrophotometer. The background oxidation of iron at 20 and 100 μM in enzyme-free controls are shown for reference. (B) Encapsulin and EncFtn-Enc complexes at 10 μM asymmetric unit concentration were incubated with Fe2+ at 20 and 100 μM and progress curves for iron oxidation at A315 were measured in a UV/visible spectrophotometer. Enzyme free controls for background oxidation of Fe2+ are shown for reference. (C) Histogram of the iron loading capacity per biological assembly of EncFtnsH, encapsulin, EncFtn-Enc and apoferritin. The results shown are for three technical replicates and represent the optimal iron loading by the complexes after three hours when incubated with Fe2+.
Figure 8—figure supplement 1
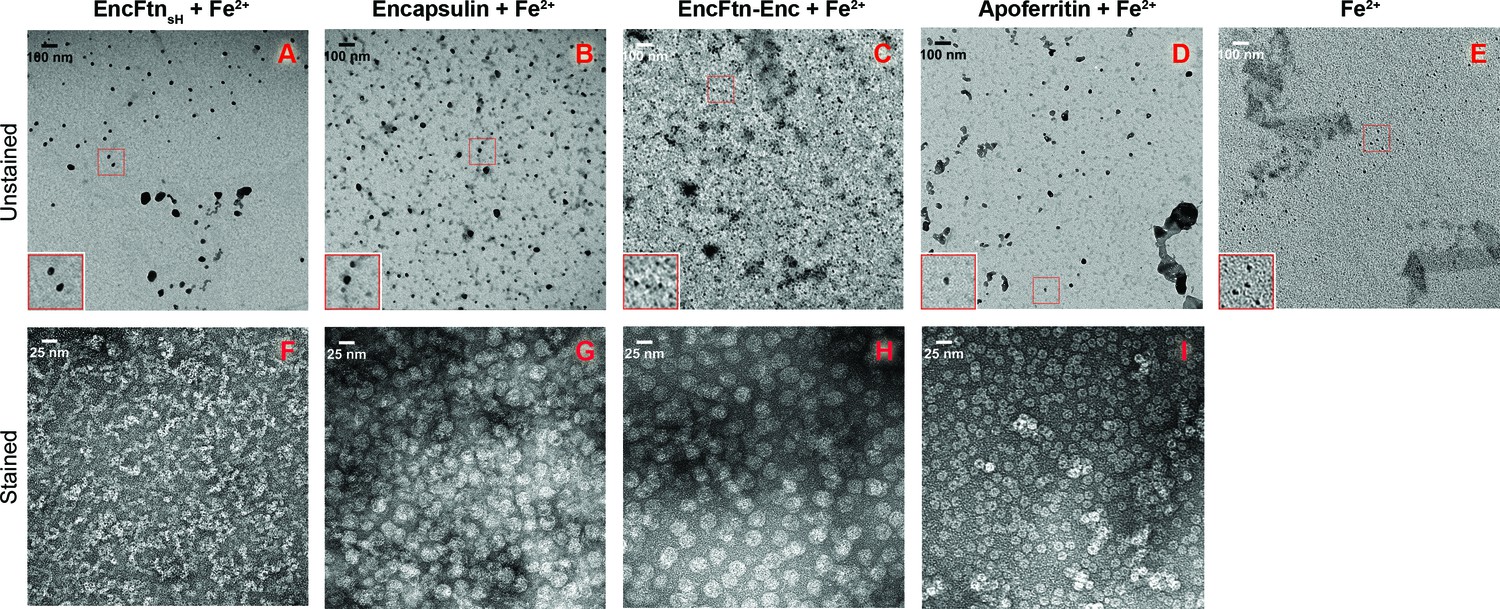
TEM visualization of iron-loaded bacterial nanocompartments and ferritin.
Decameric EncFtnsH, encapsulin, EncFtn-Enc and apoferritin, at 8.5 µM, were mixed with 147 µM, 1 mM, 1 mM and 215 µM acidic Fe(NH4)2(SO4)2, respectively. Protein mixtures were incubated at room temperature for 1 hr prior to TEM analysis with or without uranyl acetate stain. (A–D) Unstained EncFtnsH, encapsulin, EncFtn-Enc, apoferritin loaded with Fe2+, respectively, with 35,000 x magnification and scale bars indicate 100 nm. (E) Protein-free sample as a control. (F–I) Stained EncFtnsH, encapsulin, EncFtn-Enc, apoferritin loaded with Fe2+, respectively, with 140,000 x magnification and scale bars indicate 25 nm.
Figure 9
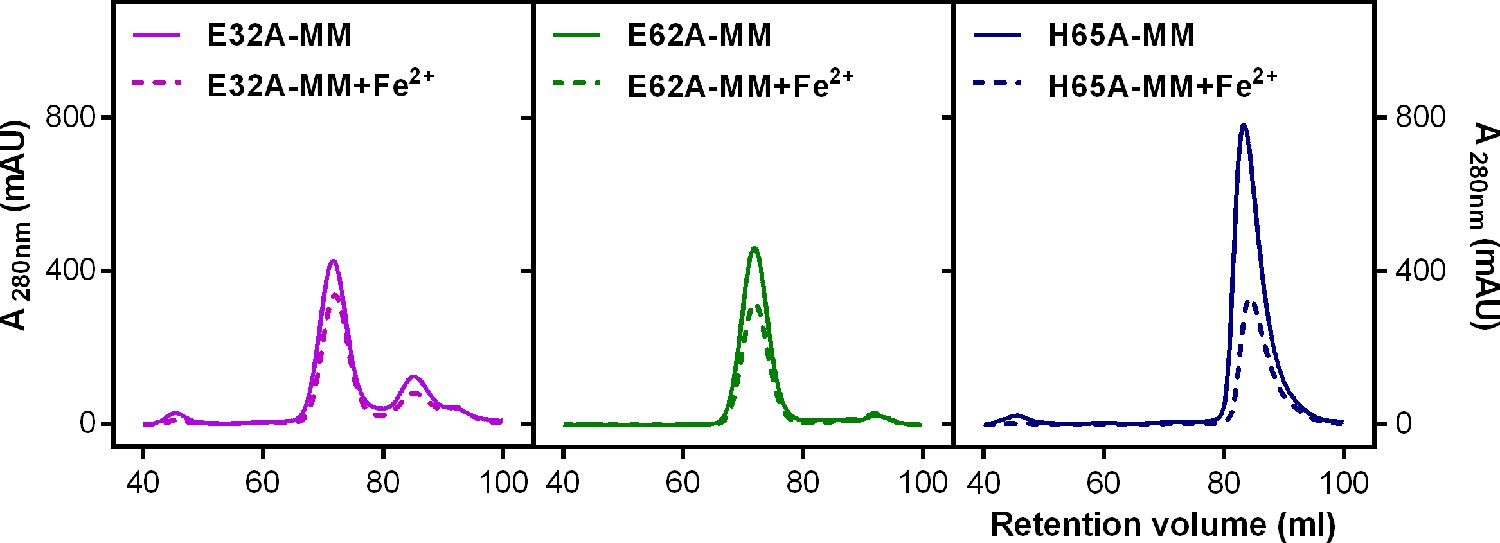
Purification of recombinant R. rubrum EncFtnsH FOC mutants.
Single mutants E32A, E62A, and H65A of EncFtnsH produced from E. coli BL21(DE3) cells grown in MM and MM supplemented with iron were subjected to Superdex 200 size-exclusion chromatography. (A) Gel-filtration chromatogram of the E32A mutant form of EncFtnsH resulted in an elution profile with a majority of the protein eluting as the decameric form of the protein and a small proportion of monomer. (B) Gel-filtration chromatograhy of the E62A mutant form of EncFtnsH resulted in an elution profile with a single major decameric peak. (C) Gel-filtration chromatography of the H65A mutant form of EncFtnsH resulted in a single peak corresponding to the protein monomer.
Figure 10
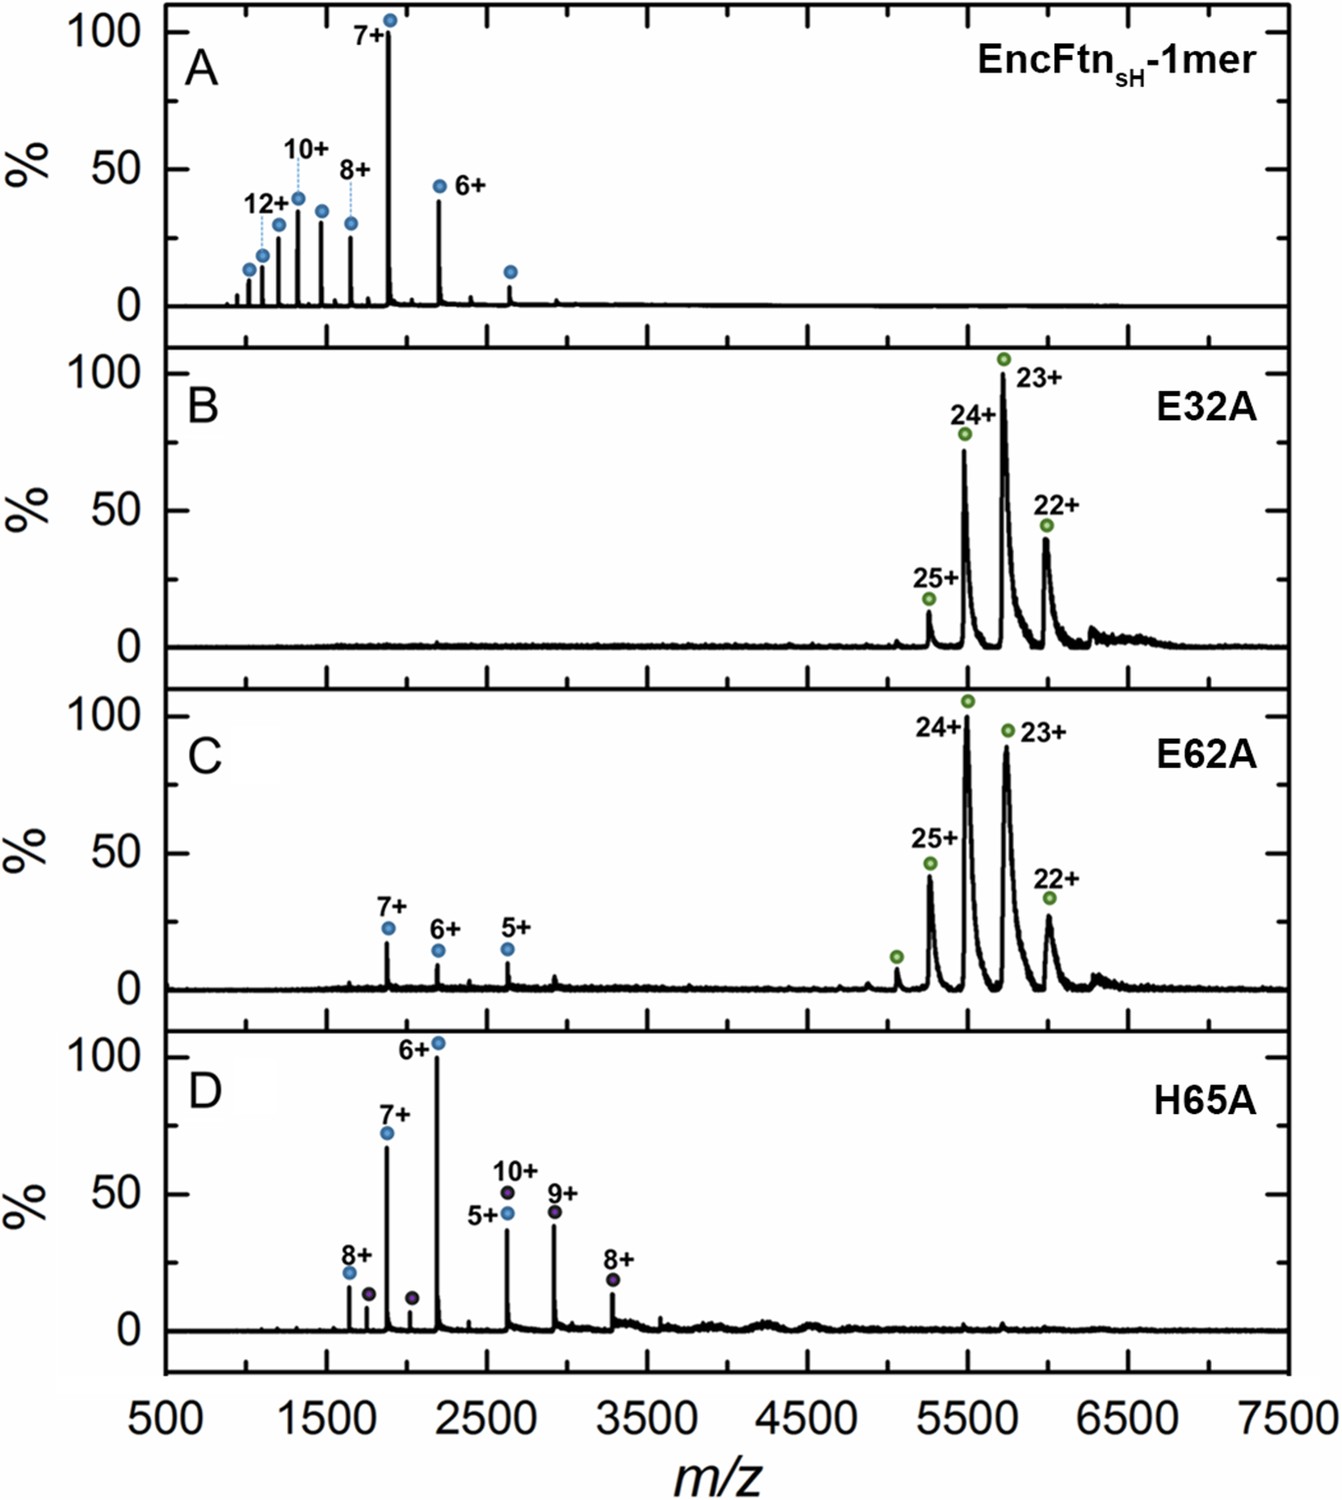
Native mass spectrometry of EncFtnsH mutants.
All spectra were acquired in 100 mM ammonium acetate, pH 8.0 with a protein concentration of 5 µM. (A) Wild-type EncFtnsH in the absence of iron displays a charge state distribution consistent with a monomer (see also Figure 8). (B) E32A EncFtnsH displays a charge states consistent with a decamer (green circles); a minor species, consistent with the monomer of E32A mutant is also observed (blue circles). (C) E62A EncFtnsH displays charge states consistent with a decamer (green circles). (D) H65A EncFtnsH displays charge states consistent with both monomer (blue circles) and dimer (purple circles).
Figure 11 with 3 supplements
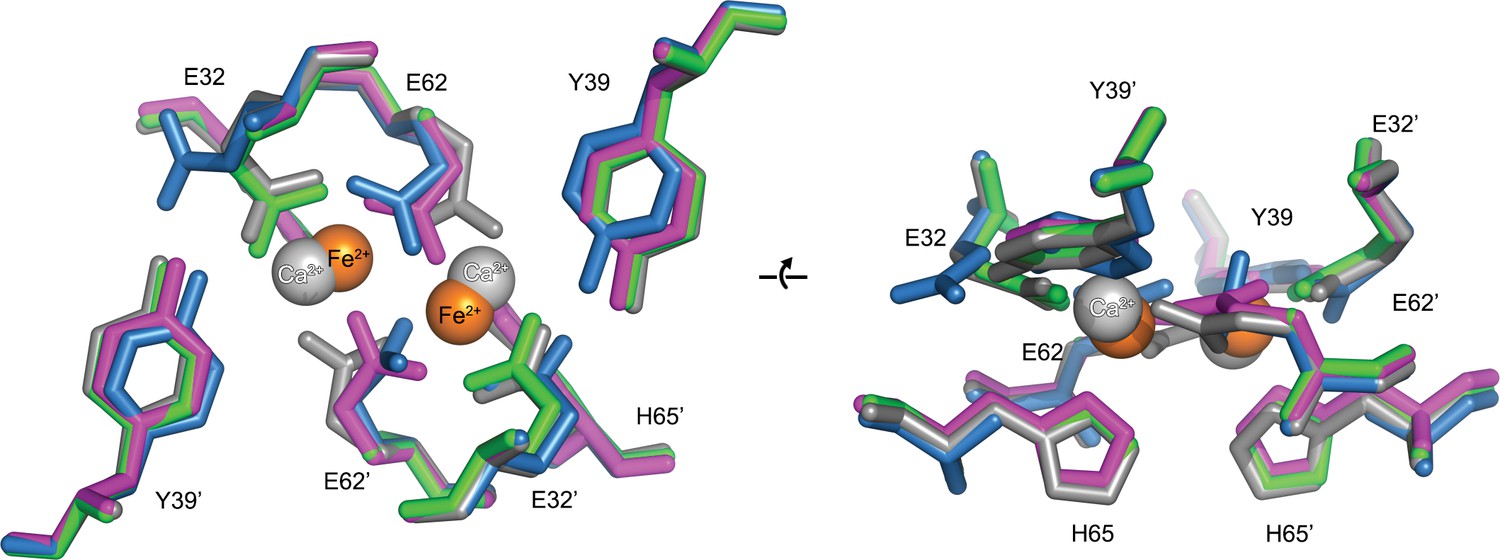
Comparison of the EncFtnsH FOC mutants vs wild type.
The structures of the three EncFtnsH mutants were all determined by X-ray crystallography. The E32A, E62A and H65A mutants were crystallized in identical conditions to the wild type. EncFtnsH structure and were essentially isomorphous in terms of their unit cell dimensions. The FOC residues of the mutants and native EncFtnsH structures are shown as sticks with coordinated Fe2+ as orange and Ca2+ as grey spheres and are colored as follows: wild type, grey; E32A, pink; E62A, green; H65A, blue. Of the mutants, only H65A has any coordinated metal ions, which appear to be calcium ions from the crystallization condition. The overall organization of FOC residues is retained in the mutants, with almost no backbone movements. Significant differences center around Tyr39, which moves to coordinate the bound calcium ions in the H65A mutant; and Glu32, which moves away from the metal ions in this structure.
Figure 11—figure supplement 1
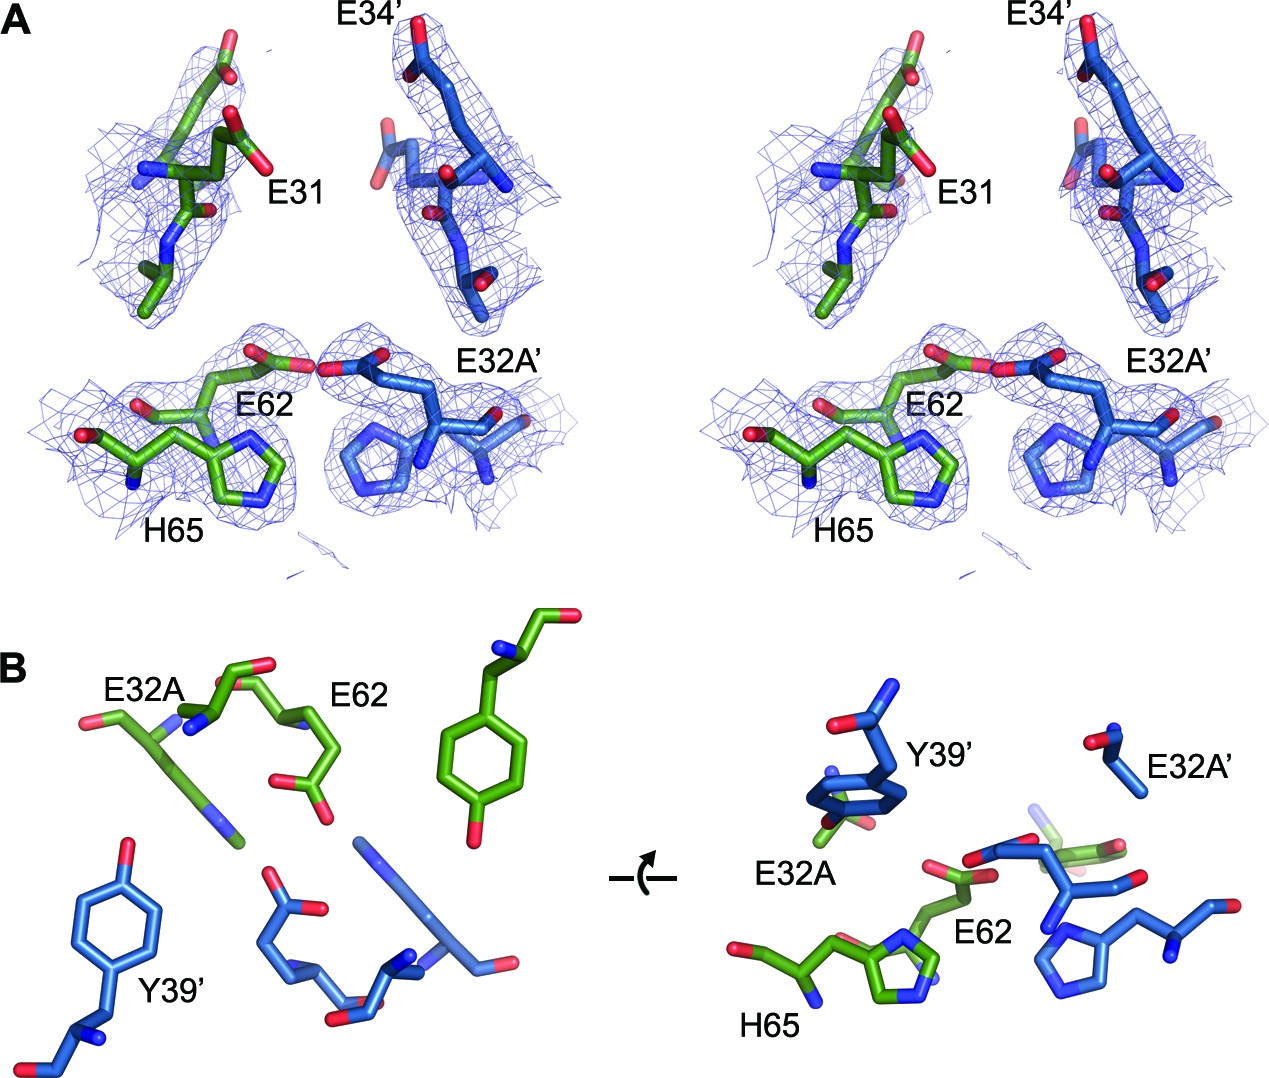
FOC dimer interface of EncFtnsH-E32A mutant.
(A) Wall-eyed stereo view of the metal-binding dimerization interface of EncFtnsH-E32A. Protein residues are shown as sticks with blue and green carbons for the different subunits. The 2mFo-DFc electron density map is shown as a blue mesh contoured at 1.5 σ. (B) Views of the FOC of the EncFtnsH-E32Amutant. Protein atoms shown as in (A).
Figure 11—figure supplement 2
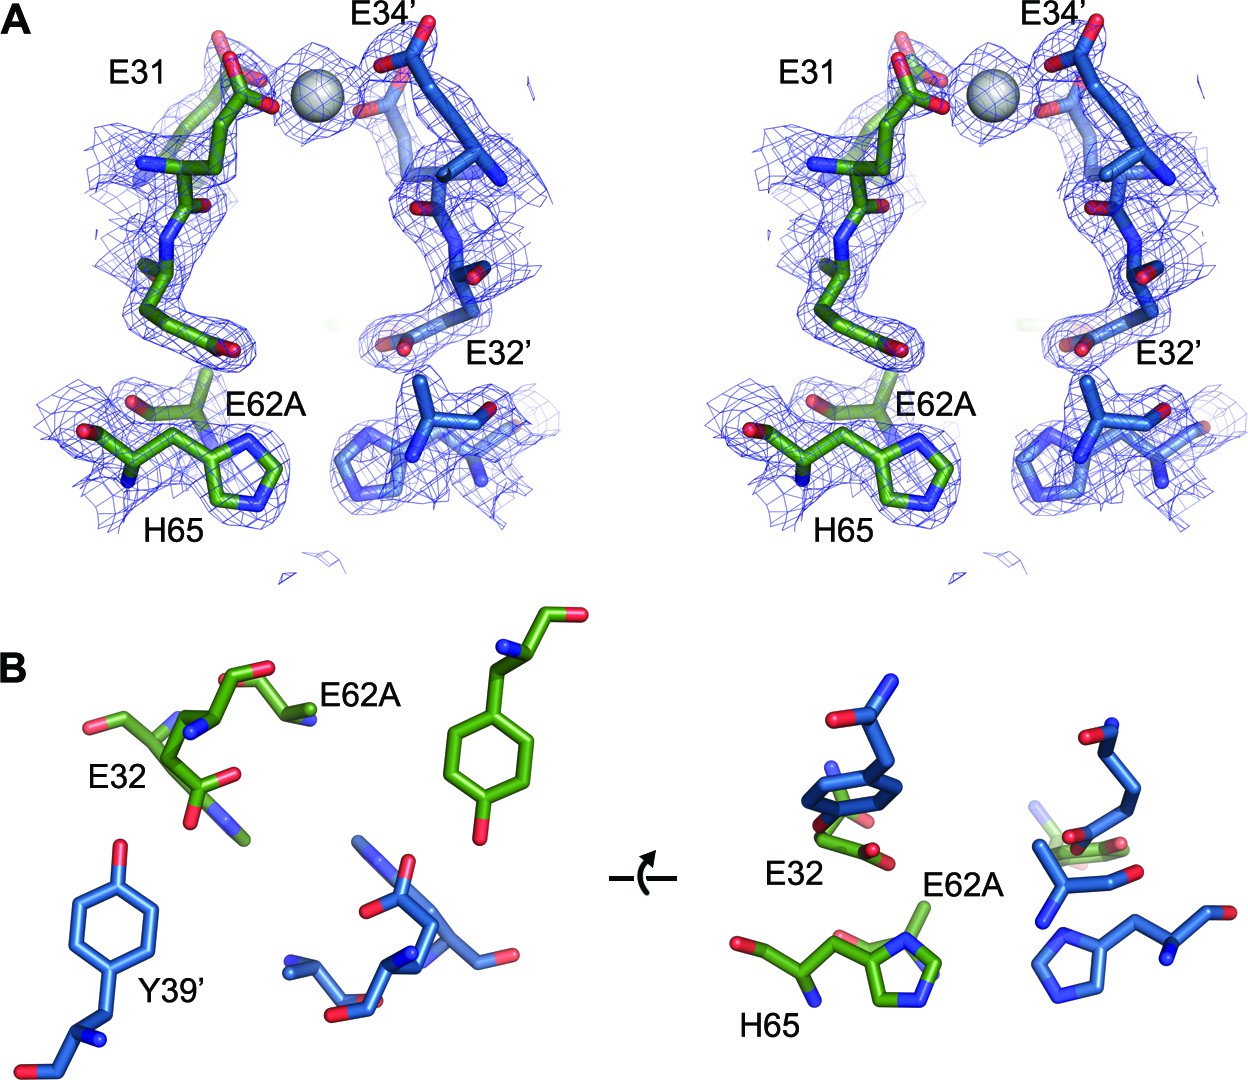
FOC dimer interface of EncFtnsH-E62A mutant.
(A) Wall-eyed stereo view of the metal-binding dimerization interface of EncFtnsH-E62A. Protein residues are shown as sticks with blue and green carbons for the different subunits. The 2mFo-DFc electron density map is shown as a blue mesh contoured at 1.5 σ. The single coordinated calcium ion is shown as a grey sphere. (B) Views of the FOC of the EncFtnsH-E62A mutant. Protein atoms shown as in (A).
Figure 11—figure supplement 3
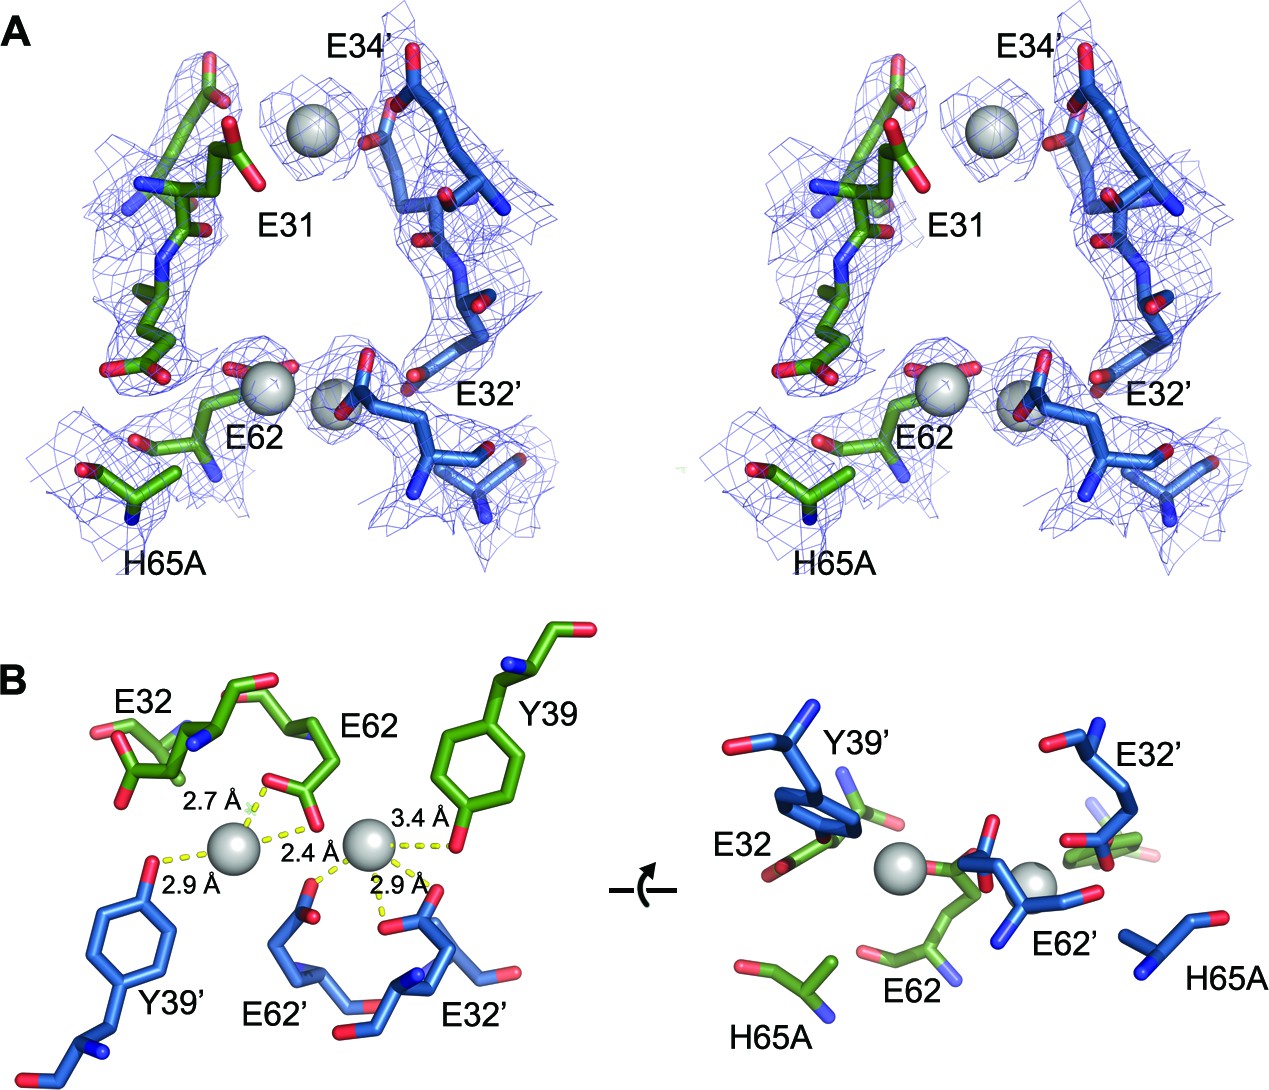
FOC dimer interface of EncFtnsH-H65A mutant.
(A) Wall-eyed stereo view of the metal-binding dimerization interface of EncFtnsH-H65A. Protein residues are shown as sticks with blue and green carbons for the different subunits. The 2mFo-DFc electron density map is shown as a blue mesh contoured at 1.5 σ. The coordinated calcium ions are shown as a grey spheres with coordination distances in the FOC highlighted with yellow dashed lines. (B) Views of the FOC of the EncFtnsH-H65A mutant. Protein atoms and metal ions shown as in (A).
Figure 12 with 1 supplement
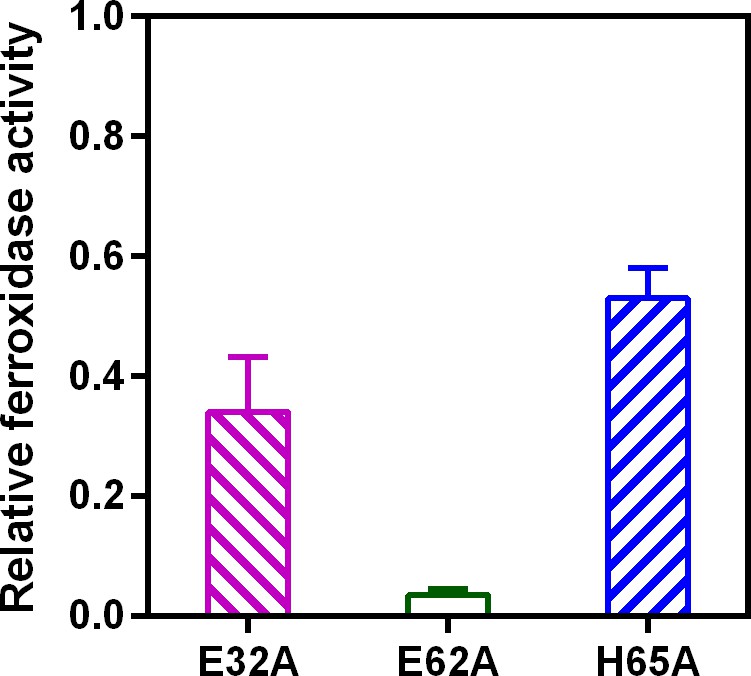
Relative ferroxidase activity of EncFtnsH mutants.
EncFtnsH, and the mutant forms E32A, E62A and H65A, each at 20 µM, were mixed with 100 µM acidic Fe(NH4)2(SO4)2. Ferroxidase activity of the mutant forms is determined by measuring the absorbance at 315 nm for 1800 s at 25 °C as an indication of Fe3+ formation. The relative ferroxidase activity of mutants is plotted as a proportion of the activity of the wild-type protein using the endpoint measurement of A315. Three technical repeats were performed and the plotted error bars represent the calculated standard deviations. The FOC mutants showed reduced ferroxidase activity to varied extents, among which E62A significantly abrogated the ferroxidase activity.
Figure 12—figure supplement 1
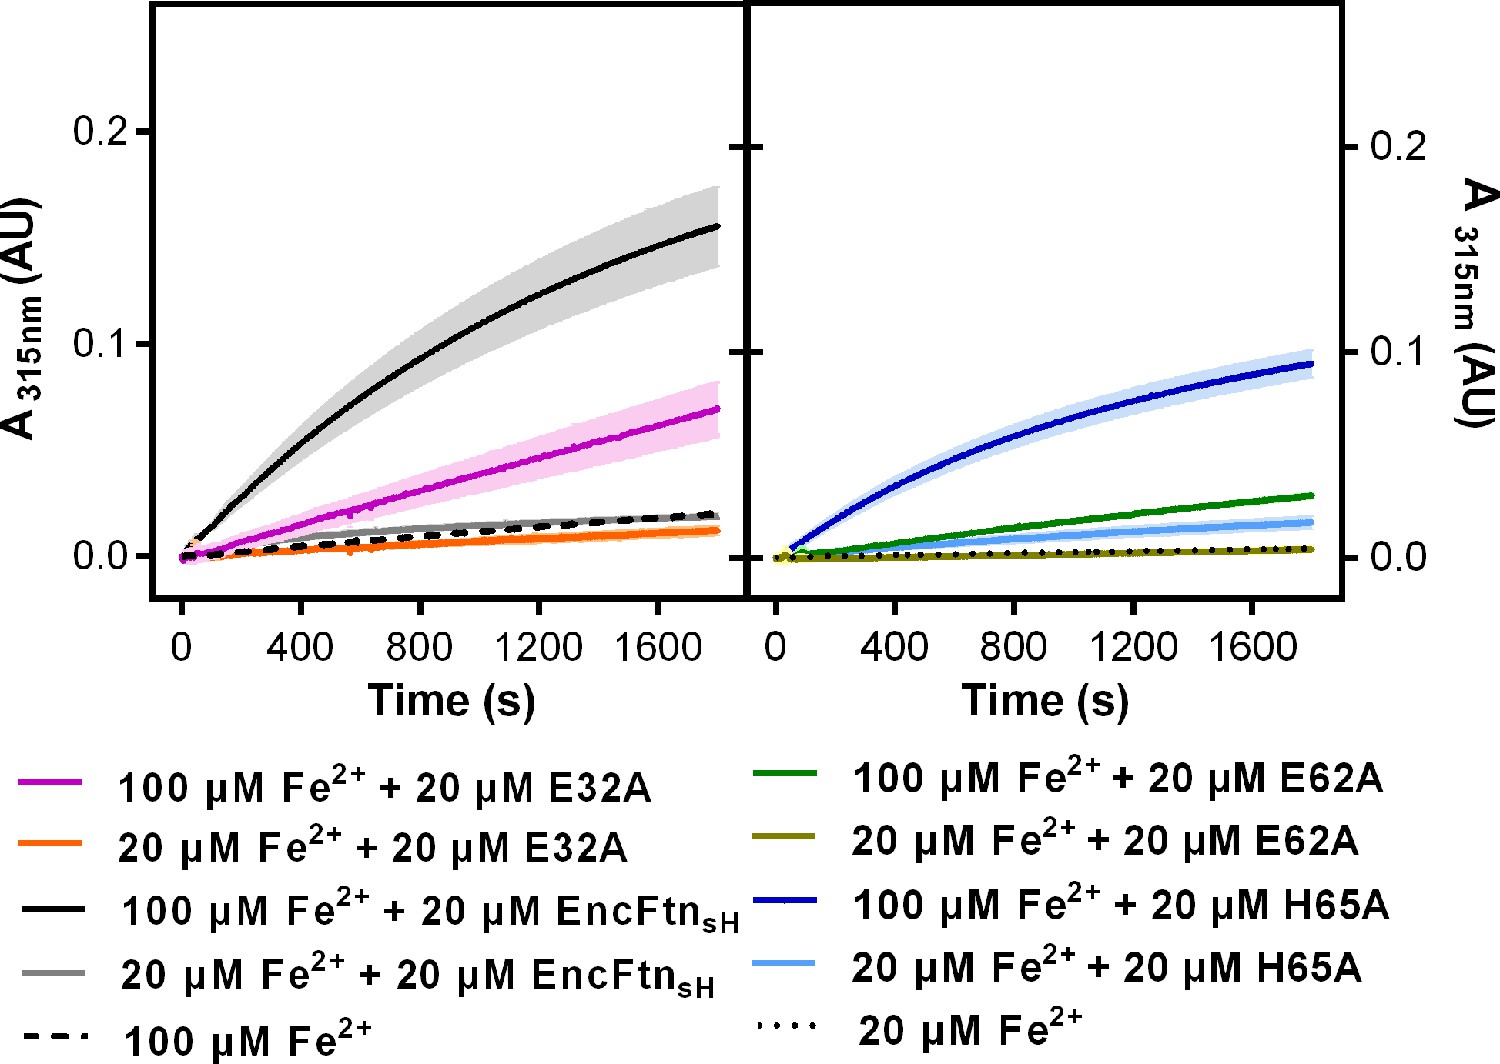
Progress curves recording ferroxidase activity of EncFtnsH mutants. 20 µM wild-type EncFtnsH, E32A, E62A and H65A mutants were mixed with 20 µM or 100 µM acidic Fe(NH4)2(SO4)2, respectively.
Absorbance at 315 nm was recorded for 1800 s at 25°C as an indication of Fe3+ formation. Protein free samples (dashed and dotted lines) were measured for Fe2+ background oxidation as controls. Assays were performed with three technical repeats. Error bars were showed in shadows behind each curves.
Figure 13
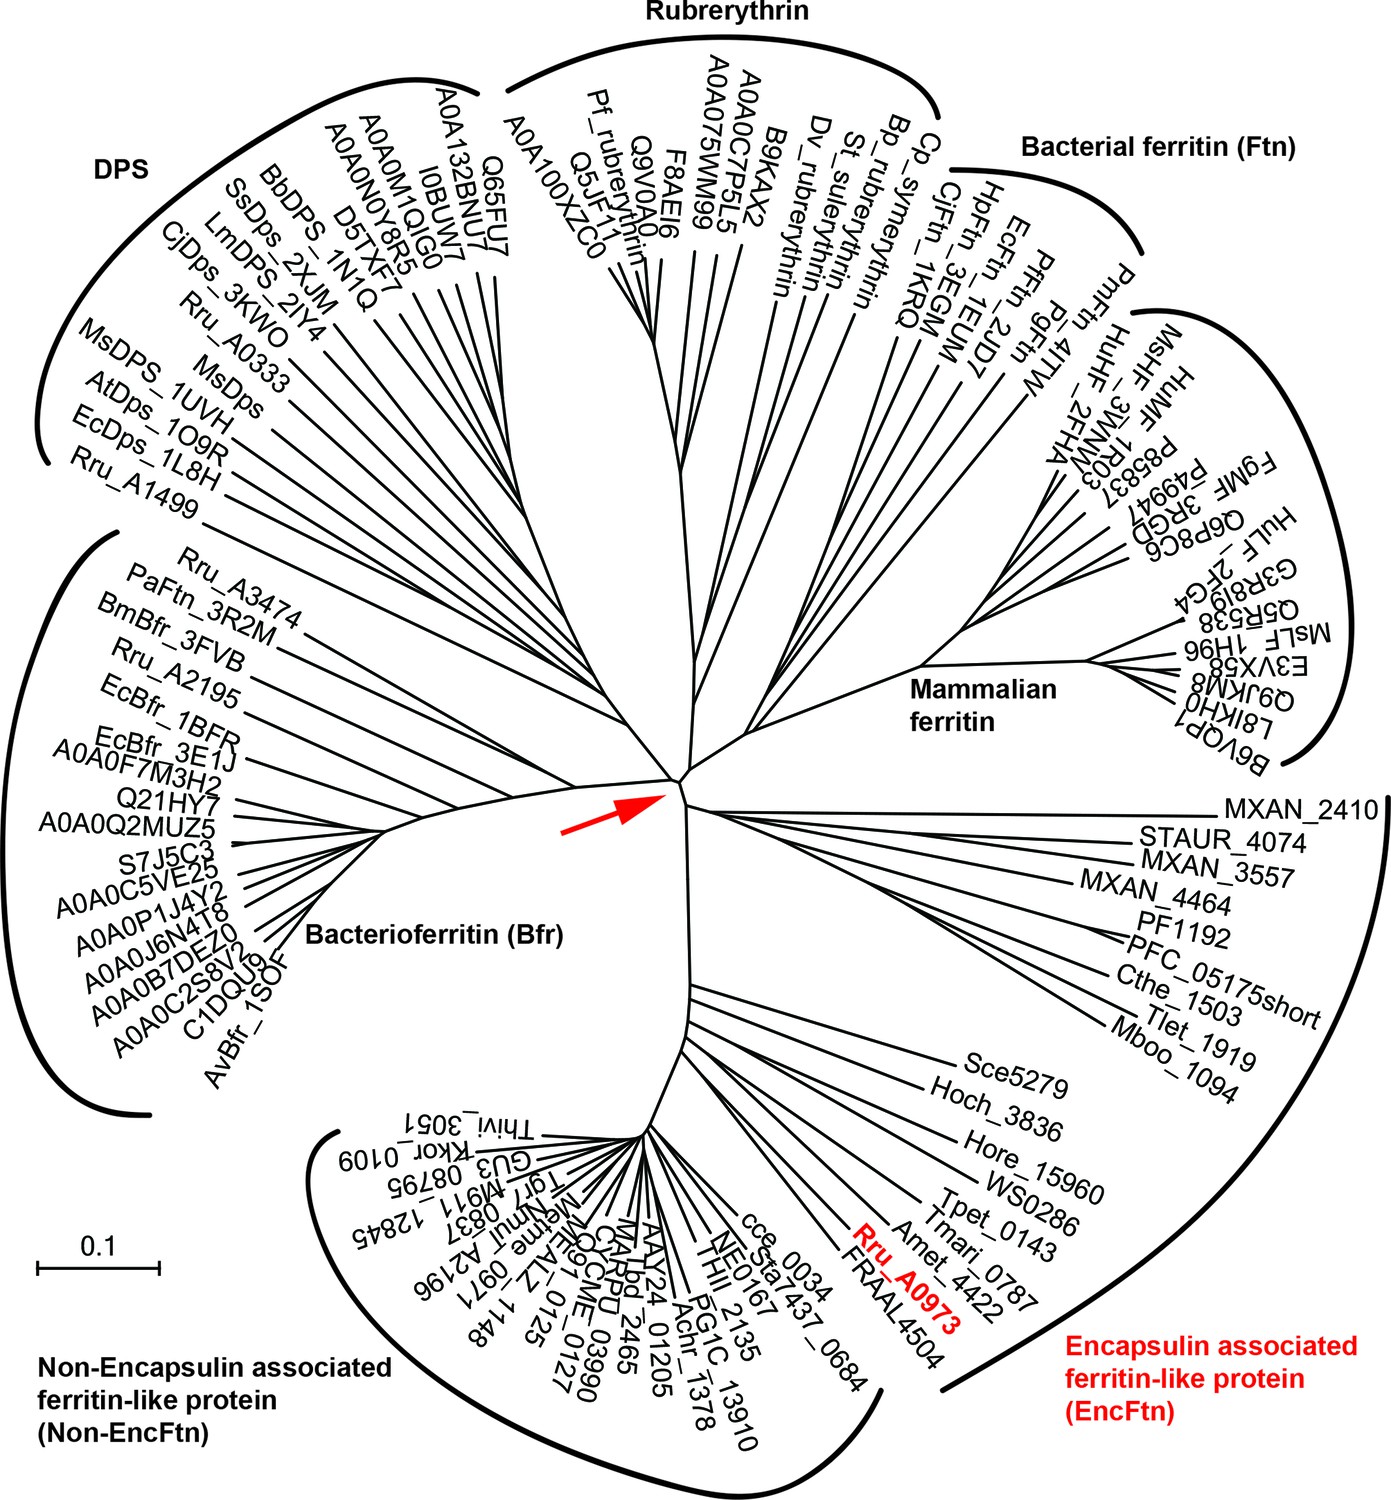
Phylogenetic tree of ferritin family proteins.
The tree was built using the Neighbor-Joining method (Saitou and Nei, 1987) based on step-wise amino acid sequence alignment of the four-helical bundle portions of ferritin family proteins (Supplementary file 1). The tree is drawn to scale, with branch lengths in the same units as those of the evolutionary distances used to infer the phylogenetic tree; the likely root of the tree is indicated by a red arrow. The evolutionary distances were computed using the p-distance method (Nei and Kumar, 2000) and are in the units of the number of amino acid differences per site. The rate variation among sites was modeled with a gamma distribution (shape parameter = 2.5). The analysis involved 104 amino acid sequences. All ambiguous positions were removed for each sequence pair. There were a total of 262 positions in the final dataset. Evolutionary analyses were conducted in MEGA7 (McCoy et al., 2007)
Figure 14
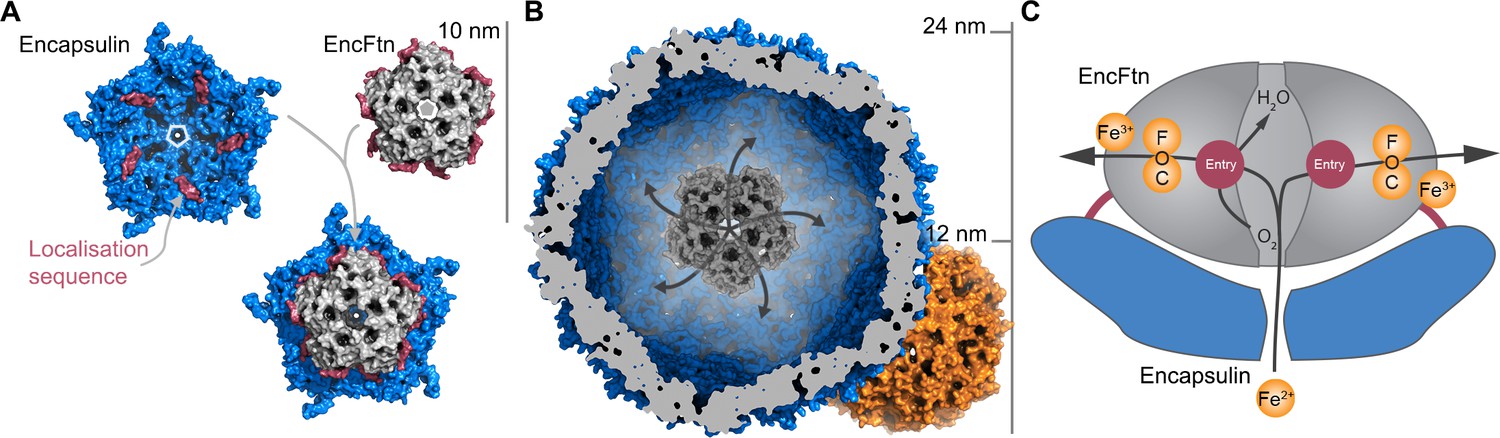
Model of iron oxidation in encapsulin nanocompartments.
(A) Model of EncFtnsH docking to the encapsulin shell. A single pentamer of the icosahedral T. maritima encapsulin structure (PDBID: 3DKT) (Sutter et al., 2008) is shown as a blue surface with the encapsulin localization sequence of EncFtn shown as a purple surface. The C-terminal regions of the EncFtn subunits correspond to the position of the localization sequences seen in 3DKT. Alignment of EncFtnsH with 3DKT positions the central channel directly above the pore in the 3DKT pentamer axis (shown as a grey pentagon). (B) Surface view of EncFtn within the encapsulin nanocompartment (grey and blue respectively). The lumen of the encapsulin nanocompartment is considerably larger than the interior of ferritin (shown in orange behind the encapsulin for reference) and thus allows the storage of significantly more iron. The proposed pathway for iron movement through the encapsulin shell and EncFtn FOC is shown with arrows. (C) Model ofiron oxidation within an encapsulin nanocompartment. As EncFtn is unable to mineralize iron on its surface directly, Fe2+ must pass through the encapsulin shell to access the first metal binding site within the central channel of EncFtnsH (entry site) prior to oxidation within the FOC and release as Fe3+ to the outer surface of the protein where it can be mineralized within the lumen of the encapsulin cage.
Author Response Image 1
Tables
Table 1
Determination of the Fe/EncFtnsH protein ratio by ICP-MS. EncFtnsH was purified as a SeMet derivative from E. coli B834(DE3) cells grown in SeMet medium with 1 mM Fe(NH4)2(SO4)2. Fractions from SEC were collected, acidified and analysed by ICP-MS. EncFtnsH concentration was calculated based on the presence of two SeMet per mature monomer. Samples where the element was undetectable are labelled with n.d. These data were collected from EncFtnsH fractions from a single gel-filtration run.
| Peak | EncFtnsH retention volume (ml) | Element concentration (µM) | Derived EncFtnsHconcentration (µM) | Derived Fe/ EncFtnsH monomer | |||
|---|---|---|---|---|---|---|---|
| Ca | Fe | Zn | Se | ||||
| Decamer | 66.5 | n.d. | 6.7 | n.d. | 24.6 | 12.3 | 0.5 |
| 68.3 | n.d. | 28.4 | n.d | 124.5 | 62.3 | 0.5 | |
| 70.1 | 2.9 | 93.7 | 2.4 | 301.7 | 150.9 | 0.6 | |
| 71.9 | 6.9 | 120.6 | 3.7 | 379.8 | 189.9 | 0.6 | |
| 73.7 | 1.9 | 64.4 | 0.8 | 240.6 | 120.3 | 0.5 | |
| 75.5 | 0.9 | 21.1 | n.d. | 101.7 | 50.8 | 0.4 | |
| 77.3 | n.d. | 6.2 | n.d. | 42.6 | 21.3 | 0.3 | |
| 79.1 | 0.1 | 2.4 | n.d. | 26.5 | 13.3 | 0.2 | |
| 80.9 | 1.0 | 1.5 | n.d. | 22.3 | 11.2 | 0.1 | |
| 82.7 | n.d. | 0.2 | n.d. | 29.2 | 14.6 | n.d | |
| Monomer | 84.5 | n.d. | 0.1 | n.d. | 34.9 | 17.5 | n.d |
| 86.3 | n.d. | n.d | n.d. | 28.9 | 14.4 | n.d | |
| 88.1 | n.d. | n.d. | n.d. | 17.4 | 8.7 | n.d. | |
| 89.9 | n.d. | n.d. | n.d. | 5.5 | 2.8 | n.d. | |
| 91.7 | n.d. | n.d. | n.d. | 0.1 | 0.07 | 0.2 | |
Table 2
Estimates of EncFtnsH molecular weight from SEC-MALLS analysis. EncFtnsH was purified from E. coli BL21(DE3) grown in minimal medium (MM) by nickel affinity chromatography and size-exclusion chromatography. Fractions from two peaks (decamer and monomer) were pooled separately (Figure 1C) and analysed by SEC-MALLS using a Superdex 200 10/300 GL column (GE Healthcare) and Viscotek SEC-MALLS instruments (Malvern Instruments) (Figure 2C). The decamer and monomer peaks were both symmetric and monodisperse, allowing the estimation of the molecular weight of the species in these fractions (Folta-Stogniew, 2006). The molecular weights are quoted to the nearest kDa due to the resolution limit of the instrument. The proteins analyzed by SEC-MALLS came from single protein preparation.
| Molecular Weight (kDa) | Decamer peak | Monomer peak |
|---|---|---|
| Theoretical | 133 | 13 |
| EncFtnsH-decamer fractions | 132 | 15 |
| EncFtnsH-monomer fractions | 126 | 13 |
Table 3
Gel-filtration peak area ratios for EncFtnsH decamer and monomer on addition of different metal ions. EncFtnsH was produced in E. coli BL21(DE3) cultured in MM and MM with 1 mM Fe(NH4)2(SO4)2 (MM+Fe2+) and purified by gel-filtration chromatography using an Superdex 200 16/60 column (GE Healthcare). Monomer fractions of EncFtnsH purified from MM were pooled and run in subsequent analytical gel-filtration runs over the course of three days. Samples of EncFtnsH monomer were incubated with one molar equivalent of metal ion salts at room temperature for two hours before analysis by analytical gel filtration chromatography (AGF) using a Superdex 200 10/300 GL column. The area for resulting protein peaks were calculated using the Unicorn software (GE Healthcare); peak ratios were calculated to quantify the propensity of EncFtnsH to multimerize in the presence of the different metal ions. The change in the ratios of monomer to decamer over the three days of experiments may be a consequence of experimental variability, or the propensity of this protein to equilibrate towards decamer over time. The increased decamer: monomer ratio seen in the presence of Fe2+, Co2+, and Zn2+ indicates that these metal ions facilitate multimerization of the EncFtnsH protein, while the other metal ions tested do not appear to induce multimerization. The analytical gel filtration experiment was repeated twice using two independent preparations of protein, of which values calculated from one sample are presented here.
| Method | Sample | Monomer area | Decamer area | Decamer/Monomer |
|---|---|---|---|---|
| Gel filtration Superdex 200 chromatography | EncFtnsH-MM | 64.3 | 583.6 | 0.1 |
| EncFtnsH-MM+Fe2+ | 1938.4 | 426.4 | 4.5 | |
| Analytical Gel filtration Day1 | EncFtnsH-decamer fractions | 20.2 | 1.8 | 11.2 |
| EncFtnsH-monomer fractions | 2.9 | 21.9 | 0.1 | |
| Fe(NH4)2(SO4)2/EncFtnsH-monomer | 11.0 | 13.0 | 0.8 | |
| FeSO4-HCl/EncFtnsH-monomer | 11.3 | 11.4 | 1.0 | |
| Analytical Gel filtration Day2 | EncFtnsH-monomer fractions | 8.3 | 22.8 | 0.4 |
| CoCl2/EncFtnsH-monomer | 17.7 | 14.5 | 1.2 | |
| MnCl2/EncFtnsH-monomer | 3.1 | 30.5 | 0.1 | |
| ZnSO4/EncFtnsH-monomer | 20.4 | 9.0 | 2.3 | |
| FeCl3/EncFtnsH-monomer | 3.9 | 28.6 | 0.1 | |
| Analytical Gel filtration Day3 | EncFtnsH-monomer fractions | 6.3 | 23.4 | 0.3 |
| MgSO4/EncFtnsH-monomer | 5.8 | 30.2 | 0.2 | |
| Ca acetate/EncFtnsH-monomer | 5.6 | 25.2 | 0.2 |
Table 4
Data collection and refinement statistics. Statistics for the highest-resolution shell are shown in parentheses. Friedel mates were averaged when calculating reflection numbers and statistics.
| WT | E32A | E62A | H65A | |
|---|---|---|---|---|
| Data collection | ||||
| Wavelength (Å) | 1.74 | 1.73 | 1.73 | 1.74 |
| Resolution range (Å) | 49.63 - 2.06 (2.10 - 2.06) | 48.84 - 2.59 (2.683 - 2.59) | 48.87 - 2.21 (2.29 - 2.21) | 48.86 - 2.97 (3.08 - 2.97) |
| Space group | P 1 21 1 | P 1 21 1 | P 1 21 1 | P 1 21 1 |
| Unit cell (Å) a b c β (°) | 98.18 120.53 140.30 95.36 | 97.78 120.28 140.53 95.41 | 98.09 120.23 140.36 95.50 | 98.03 120.29 140.43 95.39 |
| Total reflections | 1,264,922 (41,360) | 405,488 (36,186) | 1,069,345 (95,716) | 323,853 (32,120) |
| Unique reflections | 197,873 (8,766) | 100,067 (9,735) | 162,379 (15,817) | 66,658 (6,553) |
| Multiplicity | 6.4 (4.7) | 4.1 (3.7) | 6.6 (6.1) | 4.9 (4.9) |
| Anomalous multiplicity | 3.2 (2.6) | N/A | N/A | N/A |
| Completeness (%) | 99.2 (88.6) | 99.0 (97.0) | 100 (97.0) | 100 (99.0) |
| Anomalous completeness (%) | 96.7 (77.2) | N/A | N/A | N/A |
| Mean I/sigma(I) | 10.6 (1.60) | 8.46 (1.79) | 13.74 (1.80) | 8.09 (1.74) |
| Wilson B-factor | 26.98 | 40.10 | 33.97 | 52.20 |
| Rmerge | 0.123 (0.790) | 0.171 (0.792) | 0.0979 (1.009) | 0.177 (0.863) |
| Rmeas | 0.147 (0.973) | 0.196 (0.923) | 0.1064 (1.107) | 0.199 (0.966) |
| CC1/2 | 0.995 (0.469) | 0.985 (0.557) | 0.998 (0.642) | 0.989 (0.627) |
| CC* | 0.999 (0.846) | 0.996 (0.846) | 0.999 (0.884) | 0.997 (0.878) |
| Image DOI | 10.7488/ds/1342 | 10.7488/ds/1419 | 10.7488/ds/1420 | 10.7488/ds/1421 |
| Refinement | ||||
| Rwork | 0.171 (0.318) | 0.183 (0.288) | 0.165 (0.299) | 0.186 (0.273) |
| Rfree | 0.206 (0.345) | 0.225 (0351) | 0.216 (0.364) | 0.237 (0.325) |
| Number of non-hydrogen atoms | 23,222 | 22,366 | 22,691 | 22,145 |
| macromolecules | 22,276 | 22,019 | 21,965 | 22,066 |
| ligands | 138 | 8 | 24 | 74 |
| water | 808 | 339 | 702 | 5 |
| Protein residues | 2,703 | 2,686 | 2,675 | 2,700 |
| RMS(bonds) (Å) | 0.012 | 0.005 | 0.011 | 0.002 |
| RMS(angles) (°) | 1.26 | 0.58 | 1.02 | 0.40 |
| Ramachandran favored (%) | 100 | 99 | 100 | 99 |
| Ramachandran allowed (%) | 0 | 1 | 0 | 1 |
| Ramachandran outliers (%) | 0 | 0 | 0 | 0 |
| Clash score | 1.42 | 1.42 | 1.79 | 0.97 |
| Average B-factor (Å2) | 33.90 | 42.31 | 41.34 | 47.68 |
| macromolecules | 33.80 | 42.35 | 41.31 | 47.60 |
| ligands | 40.40 | 72.80 | 65.55 | 72.34 |
| solvent | 36.20 | 38.95 | 41.46 | 33.85 |
| PDB ID | 5DA5 | 5L89 | 5L8B | 5L8G |
Table 5
Iron loading capacity of EncFtn, encapsulin and ferritin. Protein samples (at 8.5 µM) including decameric EncFtnsH, encapsulin, EncFtn-Enc and apoferritin were mixed with Fe(NH4)2(SO4) (in 0.1% (v/v) HCl) of different concentrations in 50 mM Tris-HCl (pH 8.0), 150 mM NaCl buffer at room temperature for 3 hrs in the air. Protein-Fe mixtures were centrifuged at 13,000 x g to remove precipitated material and desalted prior to the Fe and protein content analysis by ferrozine assay and BCA microplate assay, respectively. Fe to protein ratio was calculated to indicate the Fe binding capacity of the protein. Protein stability was compromised at high iron concentrations; therefore, the highest iron loading with the least protein precipitation was used to derive the maximum iron loading capacity per biological assembly (underlined and highlighted in bold). The biological unit assemblies are a decamer for EncFtnsH, a 60mer for encapsulin, a 60mer of encapsulin loaded with 12 copies of decameric EncFtn in the complex, and 24mer for horse spleen apoferritin. Errors are quoted as the standard deviation of three technical repeats in both the ferrozine and BCA microplate assays. The proteins used in Fe loading experiment came from a single preparation.
| Protein sample | Fe(NH4)2(SO4)2 loading (µM) | Fe detected by ferrozine assay (µM) | Protein detected by BCA microplate assay (µM) | Fe / monomeric protein | Maximum Fe loading per biological assembly unit |
|---|---|---|---|---|---|
| 8.46 µM EncFtnsH-10mer | 0 | 4.73 ± 2.32 | 5.26 ± 0.64 | 0.90 ± 0.44 | |
| 39.9 | 9.93 ± 1.20 | 5.36 ± 0.69 | 1.85 ± 0.22 | ||
| 84 | 17.99 ± 2.01 | 4.96 ± 0.04 | 3.63 ± 0.41 | ||
| 147 | 21.09 ± 1.94 | 4.44 ± 0.21 | 4.75 ± 0.44 | 48 ± 4 | |
| 224 | 28.68 ± 0.30 | 3.73 ± 0.53 | 7.68 ± 0.08 | ||
| 301 | 11.27 ± 1.10 | 2.50 ± 0.05 | 4.51 ± 0.44 | ||
| 8.50 µM Encapsulin | 0 | -1.02 ± 0.54 | 8.63 ± 0.17 | -0.12 ± 0.06 | |
| 224 | 62.24 ± 2.49 | 10.01 ± 0.58 | 6.22 ± 0.35 | ||
| 301 | 67.94 ± 3.15 | 8.69 ± 0.42 | 7.81 ± 0.36 | ||
| 450 | 107.96 ± 8.88 | 8.50 ± 0.69 | 12.71 ± 1.05 | ||
| 700 | 97.51 ± 3.19 | 7.26 ± 0.20 | 13.44 ± 0.44 | ||
| 1000 | 308.63 ± 2.06 | 8.42 ± 0.34 | 36.66 ± 0.24 | 2199 ± 15 | |
| 1500 | 57.09 ± 0.90 | 1.44 ± 0.21 | 39.77 ± 0.62 | ||
| 2000 | 9.2 ± 1.16 | 0.21 ± 0.14 | 44.73 ± 5.63 | ||
| 8.70 µM EncFtn-Enc | 0 | 3.31 ± 1.57 | 6.85 ± 0.07 | 0.48 ± 0.23 | |
| 224 | 116.27 ± 3.74 | 7.63 ± 0.12 | 15.25 ± 0.49 | ||
| 301 | 132.86 ± 4.03 | 6.66 ± 0.31 | 19.96 ± 0.61 | ||
| 450 | 220.57 ± 27.33 | 6.12 ± 1.07 | 36.06 ± 4.47 | ||
| 700 | 344.03 ± 40.38 | 6.94 ± 0.17 | 49.58 ± 5.82 | ||
| 1000 | 496.00 ± 38.48 | 7.19 ± 0.08 | 68.94 ± 5.35 | 4137 ± 321 | |
| 1500 | 569.98 ± 73.63 | 5.73 ± 0.03 | 99.44 ± 12.84 | ||
| 2000 | 584.30 ± 28.33 | 4.88 ± 0.22 | 119.62 ± 5.80 | ||
| 8.50 µM Apoferritin | 0 | 3.95 ± 2.26 | 9.37 ± 0.24 | 0.42 ± 0.25 | |
| 42.5 | 10.27 ± 1.12 | 8.27 ± 0.30 | 1.24 ± 0.18 | ||
| 212.5 | 44.48 ± 2.76 | 7.85 ± 0.77 | 5.67 ± 0.83 | ||
| 637.5 | 160.93 ± 4.27 | 6.76 ± 0.81 | 23.79 ± 3.12 | 571 ± 75 | |
| 1275 | 114.92 ± 3.17 | 3.84 ± 0.30 | 29.91 ± 2.95 | ||
| 1700 | 91.40 ± 3.37 | 3.14 ± 0.35 | 29.13 ± 3.86 |
Additional files
-
Supplementary file 1
Multiple sequence alignment of ferritin-like proteins.
The amino acid sequences of ferritin family proteins were aligned progressively using EMBL-EBI web services (Sutter et al., 2008; Akita et al., 2007) , Clustal Omega (McHugh et al., 2014) T-Coffee (Contreras et al., 2014) and MAFFT (Helgstrand et al., 2003). Protein names were adapted from either UniprotKB (Sutter et al., 2008), KEGG (Roberts et al., 2011) database or common name with PDB entry code (He and Marles-Wright, 2015). Sequences were sorted in an order corresponding to the clades in phylogenetic tree (Figure 13). The alignment was edited by Espript 3.0 web server (Aberg et al., 1993). The R. rubrum EncFtn (Rru_A0973) sequence ishighlighted in yellow. The ferroxidase centre (FOC) of Pseudo-nitzschia multiseries ferritin (PmFtn_4ITW) (highlighting in blue) consists of FeA site (E16, E49, E52) and FeB site (E49, E95, E131, Q128) which are labelled with solid red triangles (Grant et al., 1998). Another iron binding site in PmFtn_4ITW (the gateway site or FeC site [Bradley et al., 2014]) consists of E48, E45 and E131 which are marked with solid blue circles (Grant et al., 1998). The FOC of R. rubrum EncFtn is labelled with empty red triangles as E32, E62, H65 and Y39; and the iron entry site is marked with empty blue circles including E31 and E34. The putative iron exit site is marked with empty blue squares including H57, E61 and E64. The C-terminal localization sequences common to the encapsulin associated ferritins are highlighted within the red rectangle.
- https://doi.org/10.7554/eLife.18972.035
-
Supplementary file 2
Primers used in this study.
Primers used to generate the original constructs used in this study are listed 5’ to 3’, from left to right. Introduced restriction sites are shown underlined; regions complimentary to genomic DNA shown in bold.
- https://doi.org/10.7554/eLife.18972.036
Download links
A two-part list of links to download the article, or parts of the article, in various formats.
Downloads (link to download the article as PDF)
Open citations (links to open the citations from this article in various online reference manager services)
Cite this article (links to download the citations from this article in formats compatible with various reference manager tools)
Structural characterization of encapsulated ferritin provides insight into iron storage in bacterial nanocompartments
eLife 5:e18972.
https://doi.org/10.7554/eLife.18972


