Ongoing resolution of duplicate gene functions shapes the diversification of a metabolic network
- University of Wisconsin-Madison, United States
- University of Wisconsin-Madison, Madison, United States
- Morgridge Institute for Research, United States
Figures
Figure 1
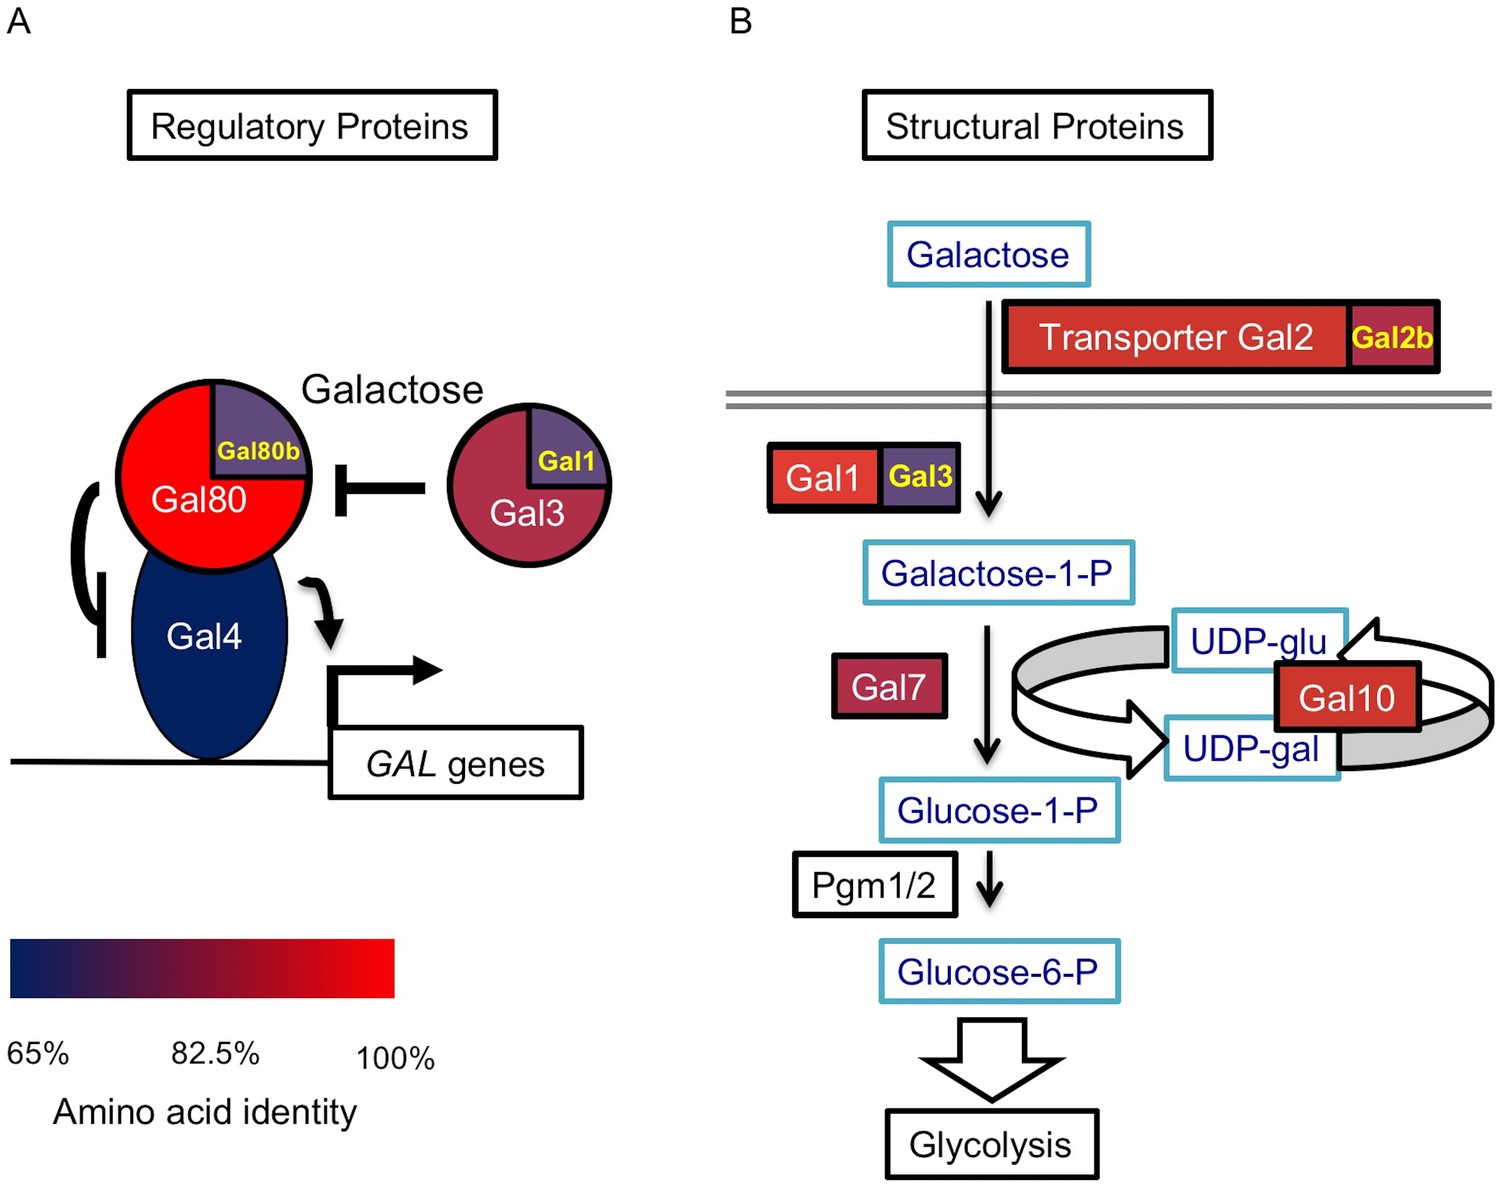
The S. uvarum GAL network.
(A) The GAL regulatory network. (B) The GAL or Leloir metabolic pathway. The colors show the amino acid identity of each component compared to their S. cerevisiae homologs (full data in Figure 1—source data 1). Proteins with two homologs in S. uvarum are split into two parts: Gal1/Gal3 and Gal80/Gal80b (also known as Sbay_12.142 [Scannell et al., 2011] or 670.20 [Caudy et al., 2013]) are two pairs of paralogs from a WGD event, while Gal2/Gal2b (also known as Sbay_10.165 [Scannell et al., 2011] or 672.62 [Caudy et al., 2013]) are paralogs from a recent tandem duplication event (Hittinger et al., 2004).
-
Figure 1—source data 1
Amino acid identity and GAL gene composition between S. uvarum and S. cerevisiae GAL network.
Quantitative data underlying Figure 1.
- https://doi.org/10.7554/eLife.19027.004
Figure 2 with 1 supplement
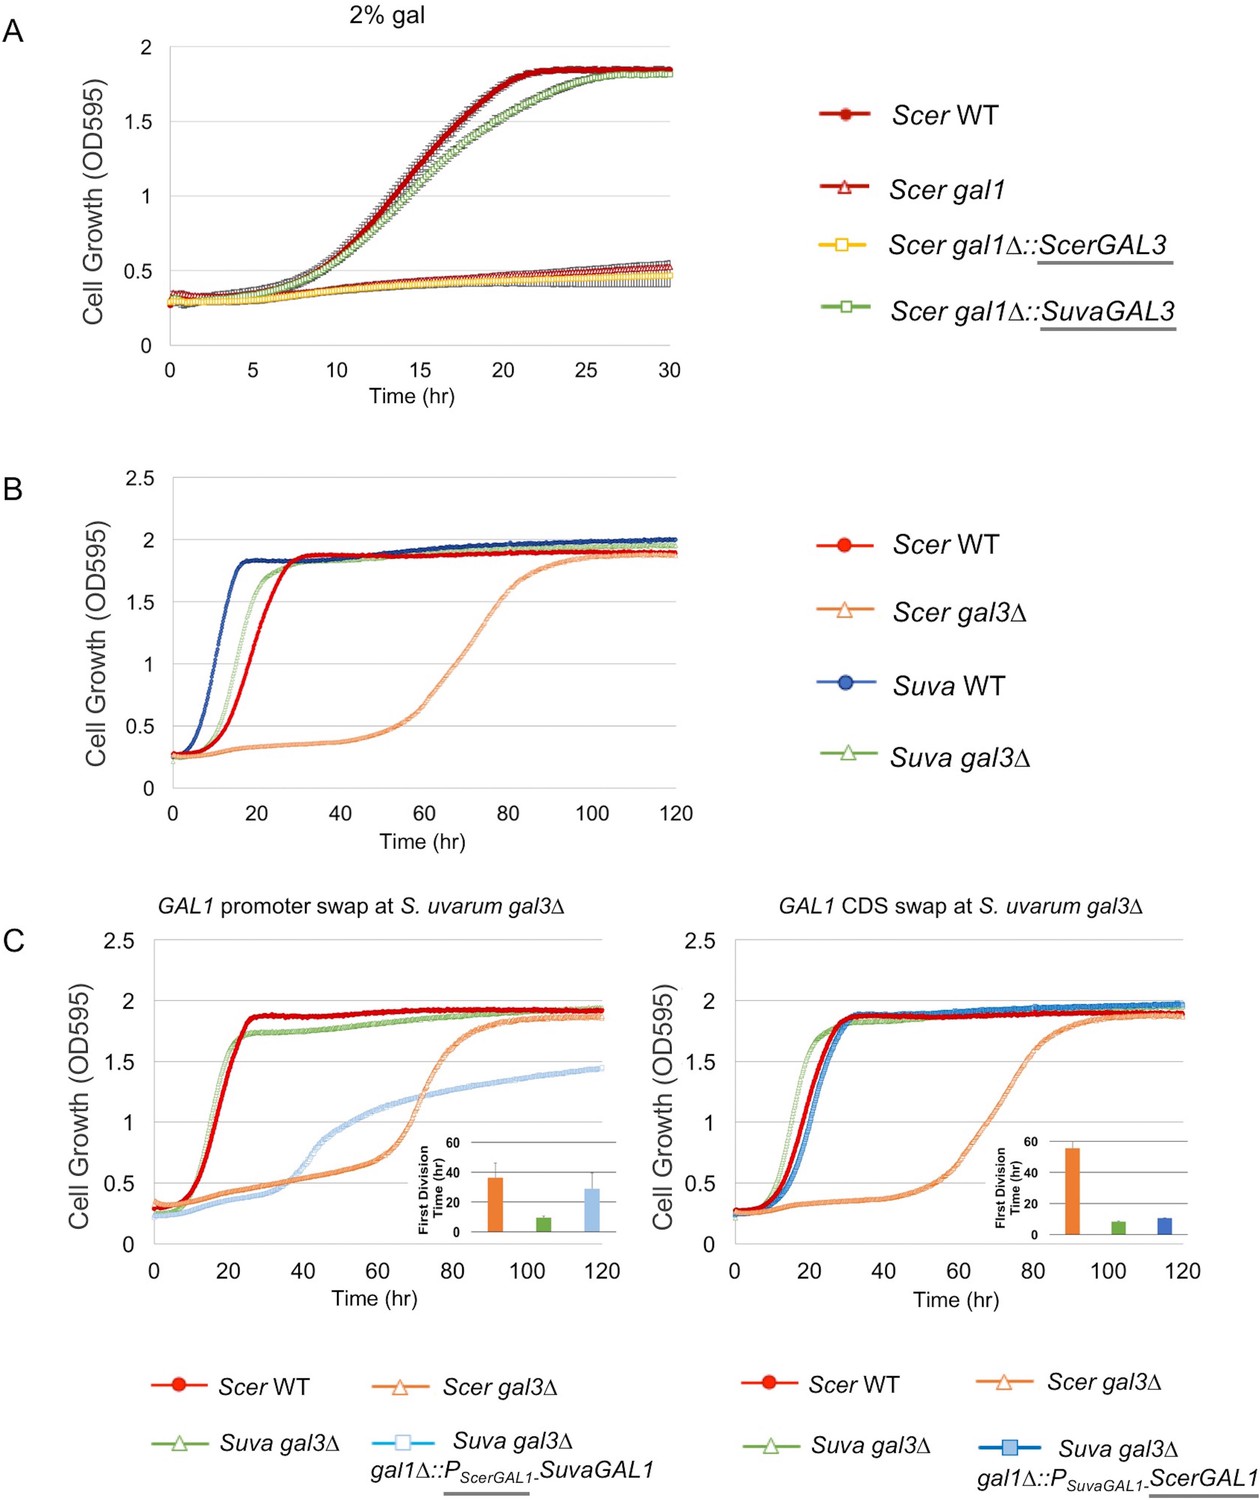
SuvaGAL1 and SuvaGAL3 are not as subfunctionalized as ScerGAL1 and ScerGAL3.
(A) S. uvarum GAL3 likely encodes a functional galactokinase. The error bars represent standard deviations of three biological replicates. A Wilcoxon rank sum test comparing the average times to first doubling between S. cerevisiae gal1 and S. cerevisiae gal1∆::SuvaGAL3 was significantly different (p=5.2e-3, n = 6). Note that driving ScerGAL3 from the ScerGAL1 promoter was insufficient to support growth with galactose as the sole carbon source, but SuvaGAL3 was sufficient. (B) Unlike S. cerevisiae gal3∆, S. uvarum gal3∆ does not show Long-Term Adaption (LTA). Strains were cultured in SC + 2% galactose. Wilcoxon rank sum tests comparing the average times to first doubling between S. uvarum gal3∆ and S. uvarum wild-type strains were significantly different (p=4.5e-5, n = 12). These experiments have been repeated independently at least twice with three biological replicates, but growth curves display only one representative replicate because LTA emergence is stochastic. (C) LTA was recapitulated in S. uvarum gal3∆ by replacing its GAL1 promoter with the S. cerevisiae GAL1 promoter (left panel) or, to a much lesser extent, by replacing the coding sequence (right panel). The insets show the times to the first doubling for the strains for their respective panels. The bar colors in the inset are the same as the growth curves. To highlight strain comparisons that test discrete hypotheses, three genotypes are repeated in Figure 2B and in both panels of Figure 2C: S. uvarum gal3∆, S. cerevisiae wild-type, and S. cerevisiae gal3∆. Strains were cultured in SC + 2% galactose. Wilcoxon rank sum tests comparing the average times to first doubling between strains were as follows: (1) p=4.6e-4 and n = 9 for S. uvarum gal3∆ versus S. uvarum gal3∆ gal1∆::PSuvaGAL1-ScerGAL1, (2) p=4.2e-5 and n = 12 for S. uvarum gal3∆ versus S. uvarum gal3∆ gal1∆::PScerGAL1-SuvaGAL1, and (3) p=0.21 and n = 12 for S. uvarum gal3∆ gal1∆::PScerGAL1-SuvaGAL1 versus S. cerevisiae gal3.
Figure 2—figure supplement 1

S. uvarum and S. cerevisiae have qualitatively similar gal1 null phenotypes.
‘+’ indicates growth after 7 days, while ‘−’ indicates no growth after 7 days when compared to the negative control (minimal media without a carbon source) (Materials and methods). Note that driving SuvaGAL3 from the ScerGAL1 promoter was sufficient to support growth with galactose as the sole carbon source (Figure 2A).
Figure 3 with 1 supplement
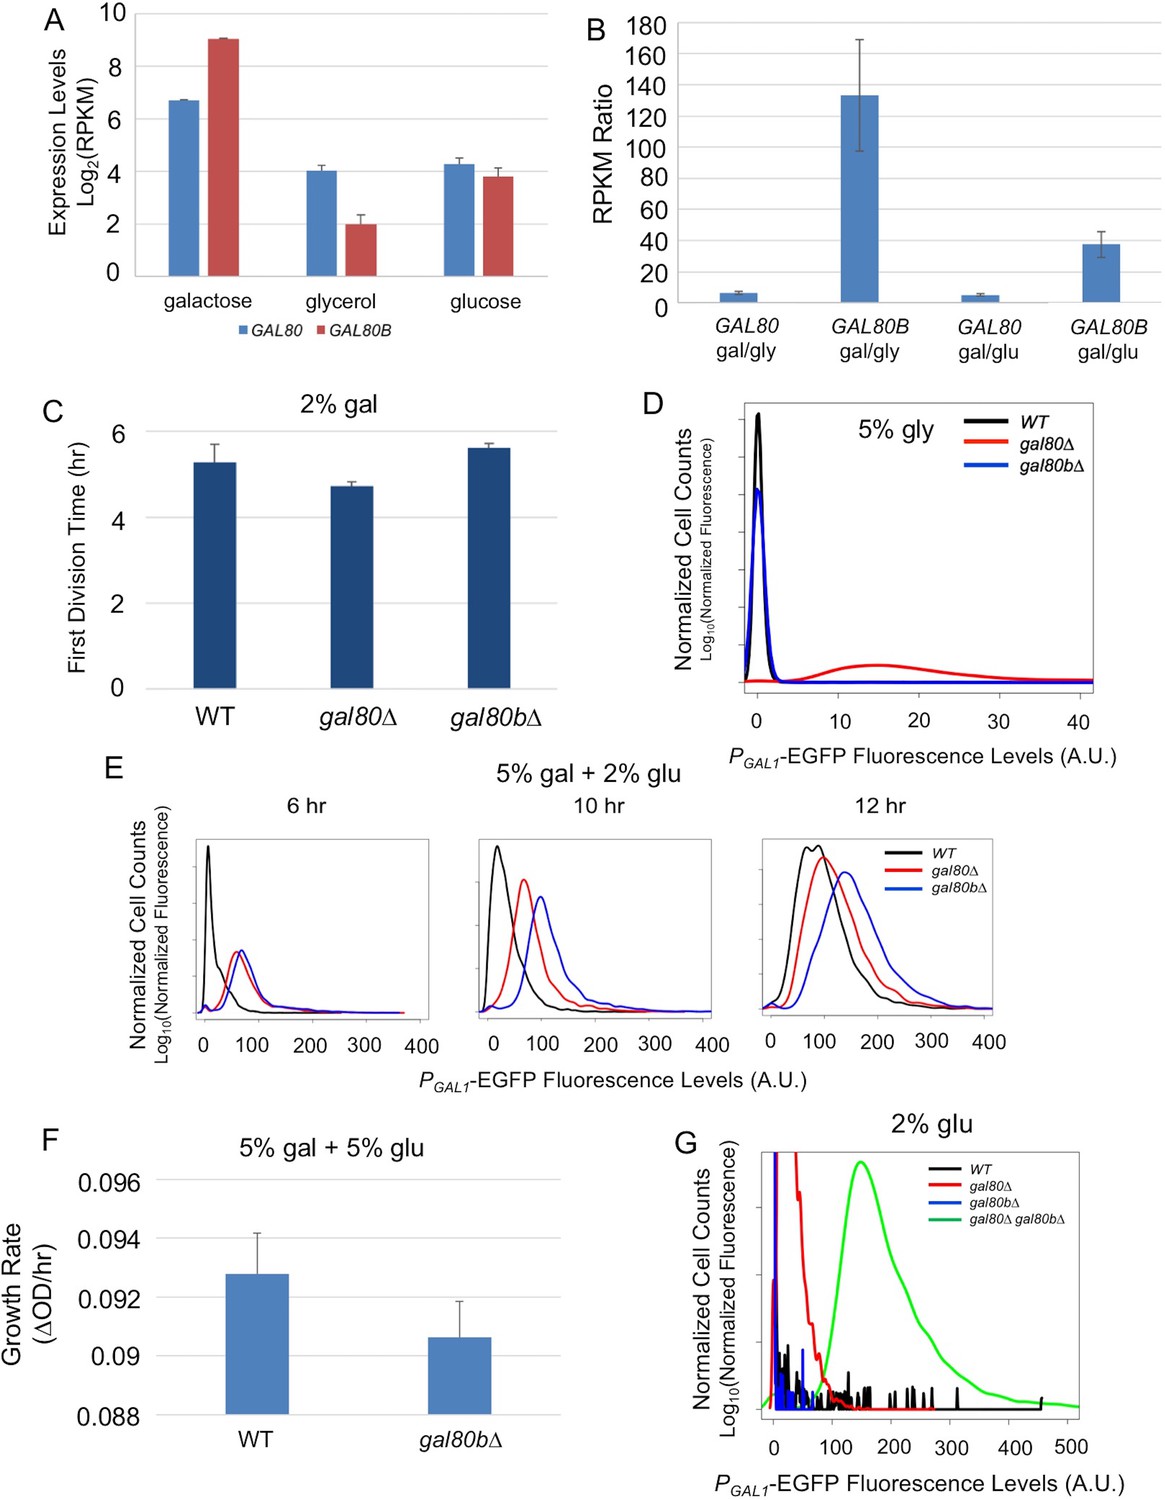
SuvaGAL80 and SuvaGAL80B encode co-repressors with partially overlapping functions.
(A) Expression divergence between SuvaGAL80 and SuvaGAL80B. The bar graph on the left shows the mRNA levels (in log2 of Reads Per Kilobase of transcript per Million mapped reads or RPKM) of SuvaGAL80 and SuvaGAL80B in SC + 2% galactose, SC + 5% glycerol, and SC + 2% glucose. Error bars represent the standard deviations of three biological replicates. (B) Divergent galactose induction between SuvaGAL80 and SuvaGAL80B. The bar graph shows the ratio of mRNA levels between galactose (gal) and glycerol (gly), or between galactose and glucose (glu) from the data in Panel A. (C) Removing SuvaGAL80 conferred rapid initial growth in galactose. The bar graph shows the average time to first doubling of three biological replicates of each genotype in SC + 2% galactose from a representative experiment. S. uvarum gal80∆ grew significantly faster than wild-type (p=1.8e-3, n = 14, Wilcoxon rank sum test), but S. uvarum gal80b∆ did not (p=0.61, n = 14, Wilcoxon rank sum test). (D) Removing SuvaGAL80 resulted in constitutive GAL1 expression. The histogram shows the fluorescence levels of an EGFP reporter when driven by the S. uvarum GAL1 promoter in SC + 5% glycerol as determined by flow cytometry. (E) Removing SuvaGAL80B led to the elevated GAL1 expression in a mixture of glucose and galactose. Flow cytometry was conducted on strains cultured in SC + 5% galactose +2% glucose. (F) Removing SuvaGAL80B caused a fitness defect in a mixture of glucose and galactose. The specific growth rate of S. uvarum gal80b∆ was significantly lower than wild-type (p=2.7e-4, n = 18, Wilcoxon rank sum test). (G) SuvaGAL80 and SuvaGAL80B were both able to partially compensate for the loss of the other in repressing conditions, but the double-knockout resulted in constitutive expression. The histogram reports flow cytometry data from strains cultured in SC + 2% glucose for 9 hr.
Figure 3—figure supplement 1
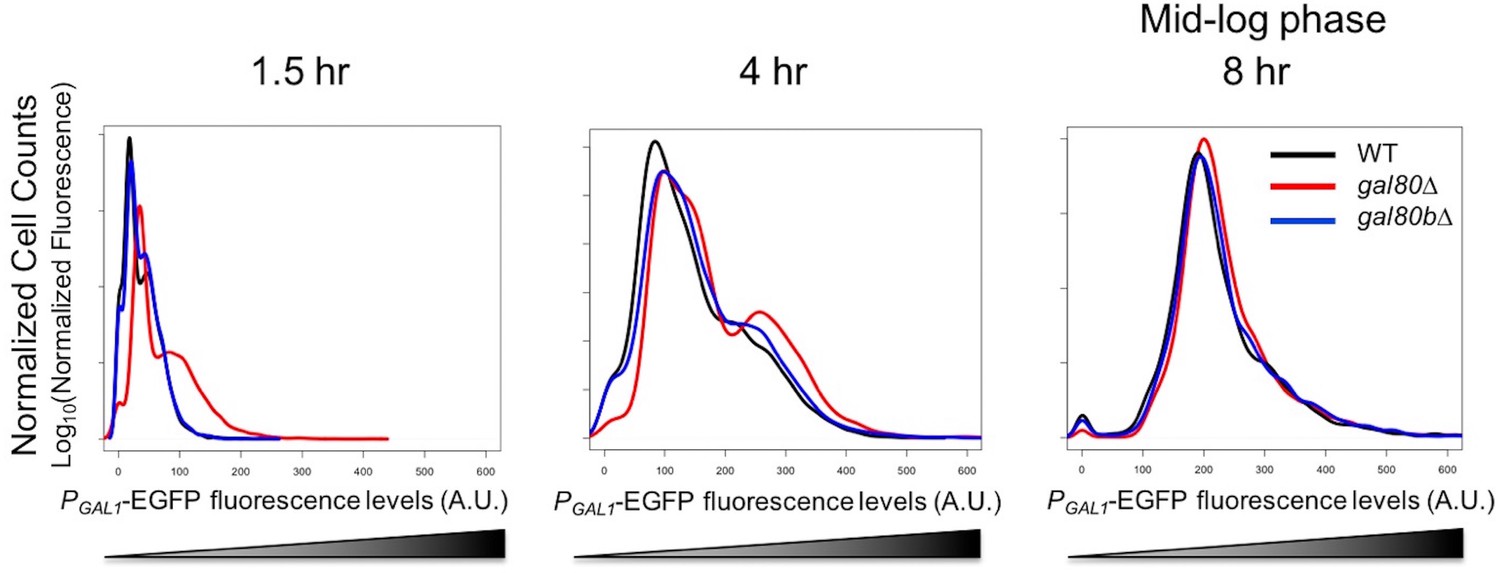
In SC + 2% galactose, S. uvarum gal80∆ and gal80b∆ had GAL1 expression levels similar to the wild-type at mid-log phase.
Flow cytometry histogram of PGAL1-EGFP fluorescence.
Figure 4 with 6 supplements
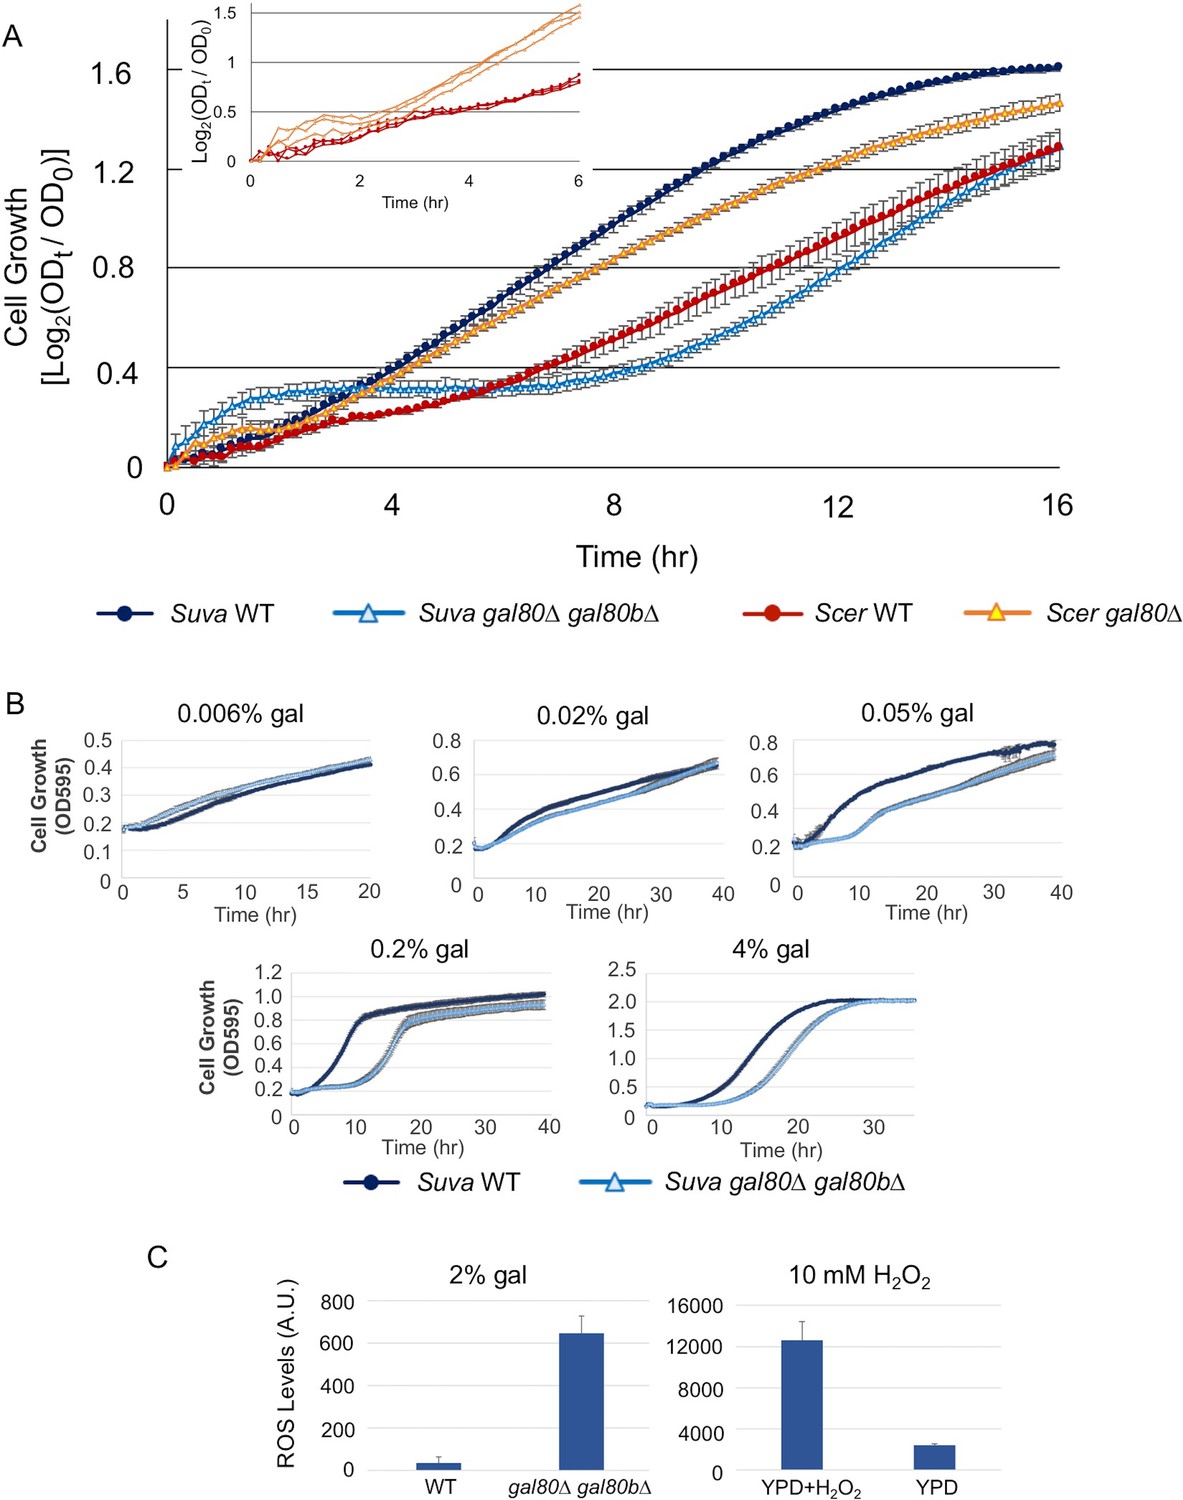
The galactose-dependent temporary growth arrest phenotype of S.uvarum gal80∆ gal80b∆.
(A) The Temporary Growth Arrest (TGA) phenotype in SC + 2% galactose. The averages of the log2 of the ratios between absorbances at each time point (ODt) and initial absorbances (OD0) for three biological replicates are shown. The error bars represent standard deviations. The inset shows the first six hours for three biological replicates each of S. cerevisiae wild-type and gal80∆ (in the background of S. cerevisiae RM11-1a, a vineyard strain). (B) The degree of the TGA phenotype was concentration dependent. A representative experiment with three biological replicates is shown; the experiment has been repeated three times. (C) Excessive reactive oxygen species (ROS) were accumulated in S. uvarum gal80∆ gal80b∆ during the TGA phase. ROS levels are reported as relative fluorescence and were measured 6.5 hr after inoculation into SC + 2% galactose (p=8.6e-6, n = 11, Wilcoxon rank sum test). The bar graph on the right shows a positive control using S. uvarum wild-type in YPD and YPD + 10 mM H2O2.
Figure 4—figure supplement 1
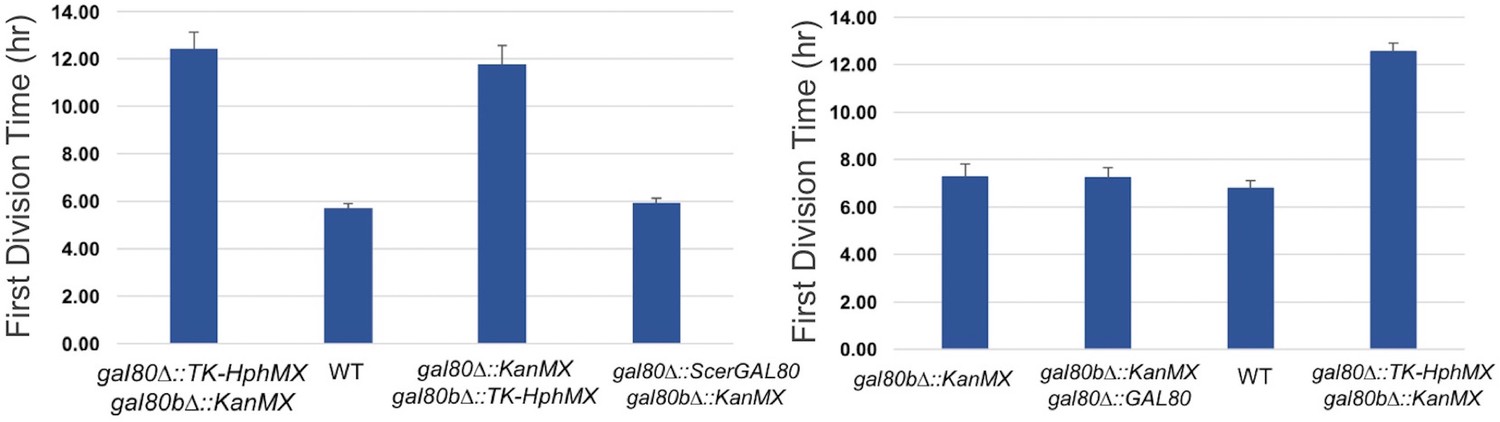
The TGA phenotype of S. uvarum gal80∆ gal80b∆ can be rescued by S. cerevisiae GAL80 or by re-introducing SuvaGAL80.
The bar graphs show the average times to first doubling time of three biological replicates. Strains were cultured in SC + 2% galactose.
Figure 4—figure supplement 2
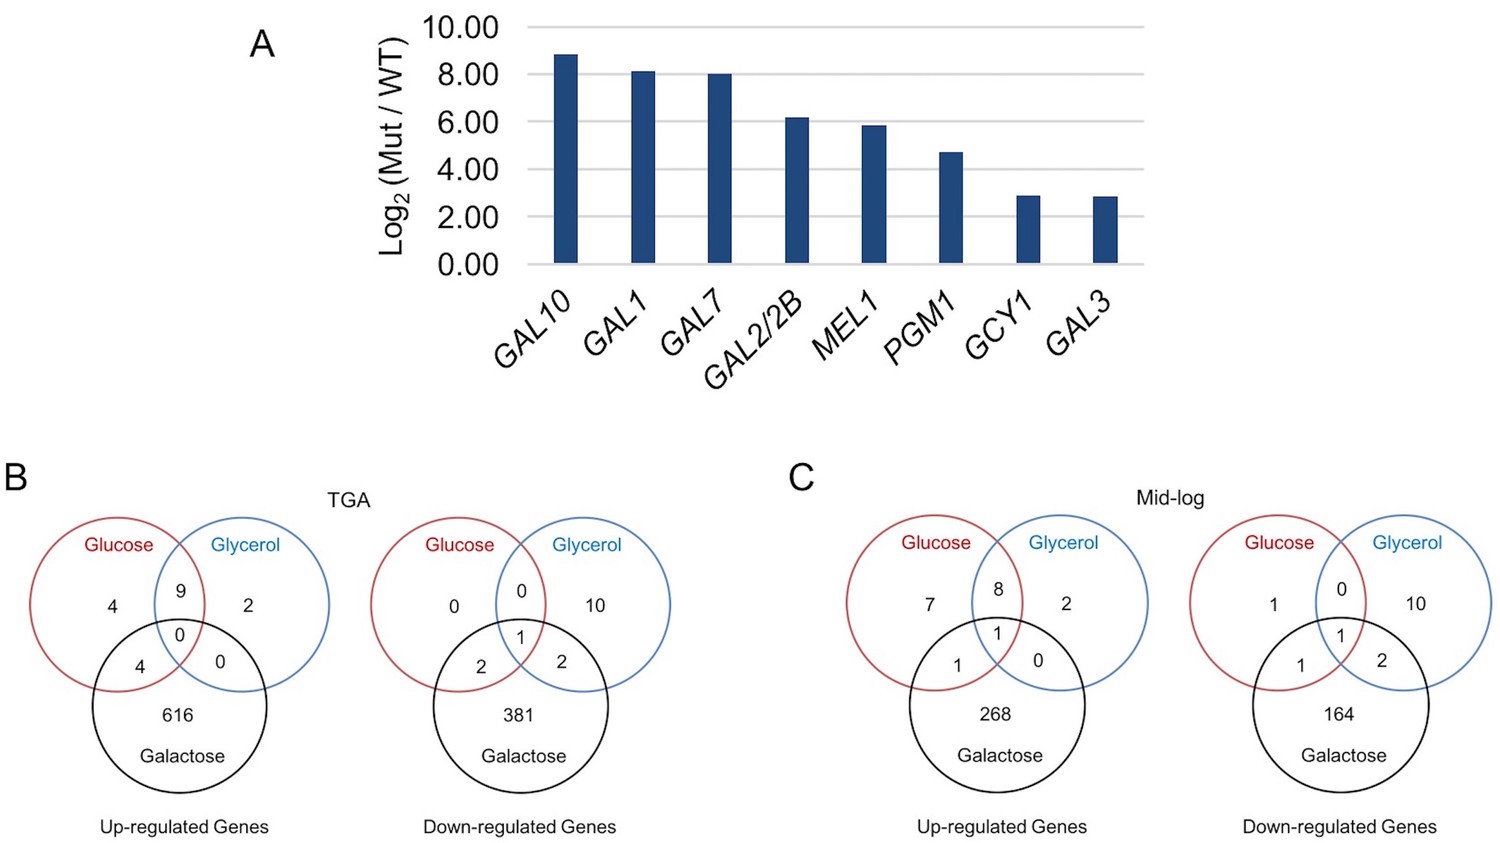
Galactose-specific global differential expression of S. uvarum gal80∆ gal80b∆.
(A) S. uvarum GAL network comprises similar targets as the S. cerevisiae GAL network. The bar graph shows the log2 of the RPKM ratio between S. uvarum gal80∆ gal80b∆ and wild-type in SC + 5% glycerol. Note that GAL80 and GAL80B are not in the list because they were knocked out in the double mutant, but both genes contain putative Gal4 binding sites in their promoters. GAL3 was considered differentially expressed by edgeR (p-value = 2.95e-8 in the condition of glycerol at 11.2-fold and p=2.83e-8 in glucose at 7.3-fold, both at FDR < 1.4e-5), although it was not by EBSeq (posterior probability of being equally expressed was 0.13 in glycerol and 0.28 in glucose). The two other experimentally verified S. cerevisiae Gal4 target genes (MTH1 and PCL10) were not considered up-regulated by either edgeR (p=0.5 at 0.9-fold for MTH1 and p=0.8 at 1-fold for PCL10 in glycerol, p=0.1 at 1.5-fold for MTH1 and p=0.1 at 1.5-fold for PCL10 in glucose, all at FDR = 1) or EBSeq (posterior probabilities of being equally expressed for MTH1 and PCL10 were 0.7 and 0.8 in glycerol, respectively, and 1.0 and 1.0 in glucose, respectively), despite having conserved putative Gal4 binding sites in their upstream sequences in S. uvarum. The three genes described as down-regulated in S. uvarum gal80b∆ strains by Caudy et al.(Caudy et al., 2013) were not differentially expressed in S. uvarum gal80∆ gal80b∆ strains in our growth conditions. (B-C) Venn diagrams of differential expression of S. uvarum gal80∆ gal80b∆ harvested at (B) the TGA phase, and (C) mid-log phase in SC + 2% glucose, +5% glycerol, or +2% galactose. Note that most gene expression changes were galactose-specific, suggesting that they were caused by metabolic defects, rather than direct regulation by Gal4. Note that, relative to wild-type, there were still hundreds of differentially expressed genes at the mid-log phase, but most (78%, 783 of 1006) genes that were differentially expressed during the TGA phase had returned to normal expression.
Figure 4—figure supplement 3
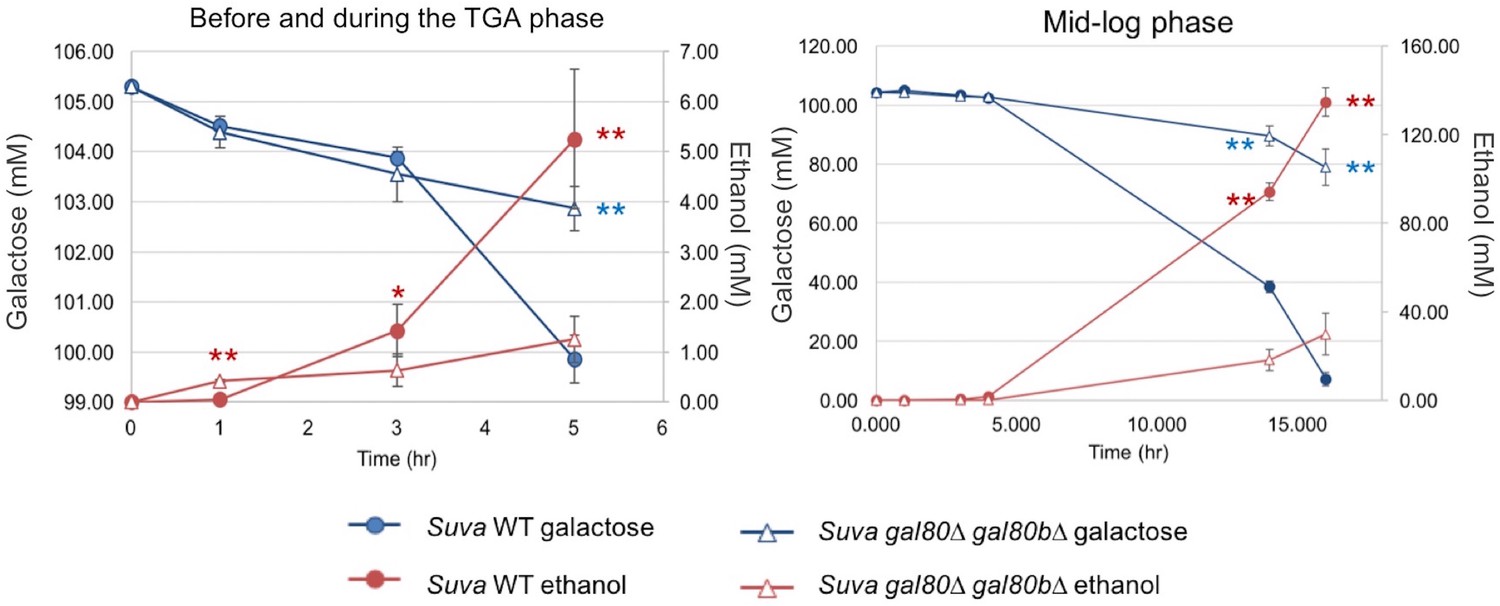
High performance liquid chromatography measurements of key metabolites in SC + 2% galactose in S. uvarum gal80∆ gal80b∆ and wild-type during the TGA phase and after the growth resumed.
Statistically significant data points are marked by asterisks (*p<0.05, **p<0.01, one-tailed Student’s t-test). Red corresponds to ethanol, and blue corresponds to galactose; ethanol was produced by galactose catabolism, but ethanol production provided a more sensitive readout than galactose consumption in early-stage cultures. Note that S. uvarum gal80∆ gal80b∆ produced significantly more ethanol by the 1 hr time point (before the TGA phase), but the S. uvarum wild-type strain produced significantly more ethanol at the 3 hr and later TGA time points.
Figure 4—figure supplement 4
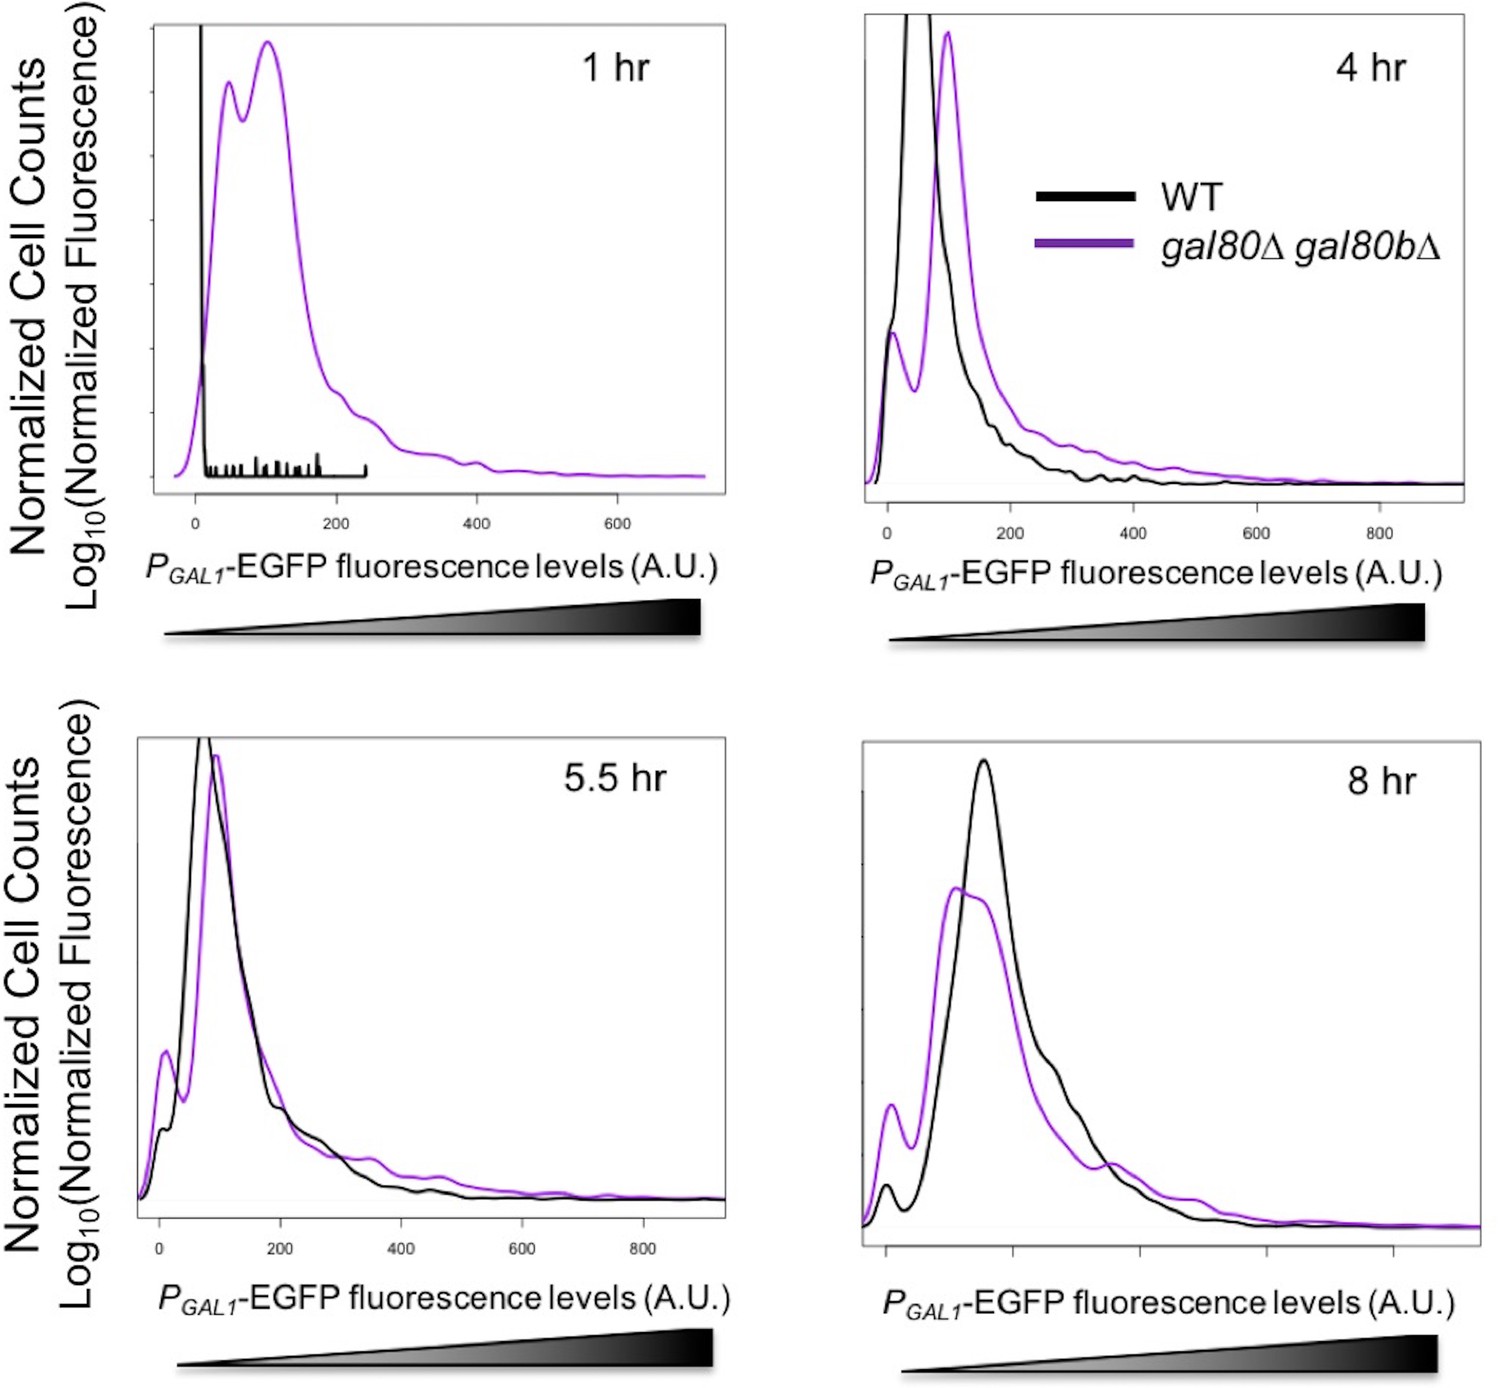
GAL1 expression was higher at the early stages of growth in SC + 2% galactose in the S. uvarum gal80∆ gal80b∆ background but gradually decreased.
Fluorescence levels were obtained by flow cytometry, normalized to forward scatter, and plotted as histograms. 4 hr was during the TGA phase, whereas 8 hr was approaching the end of the TGA phase.
Figure 4—figure supplement 5
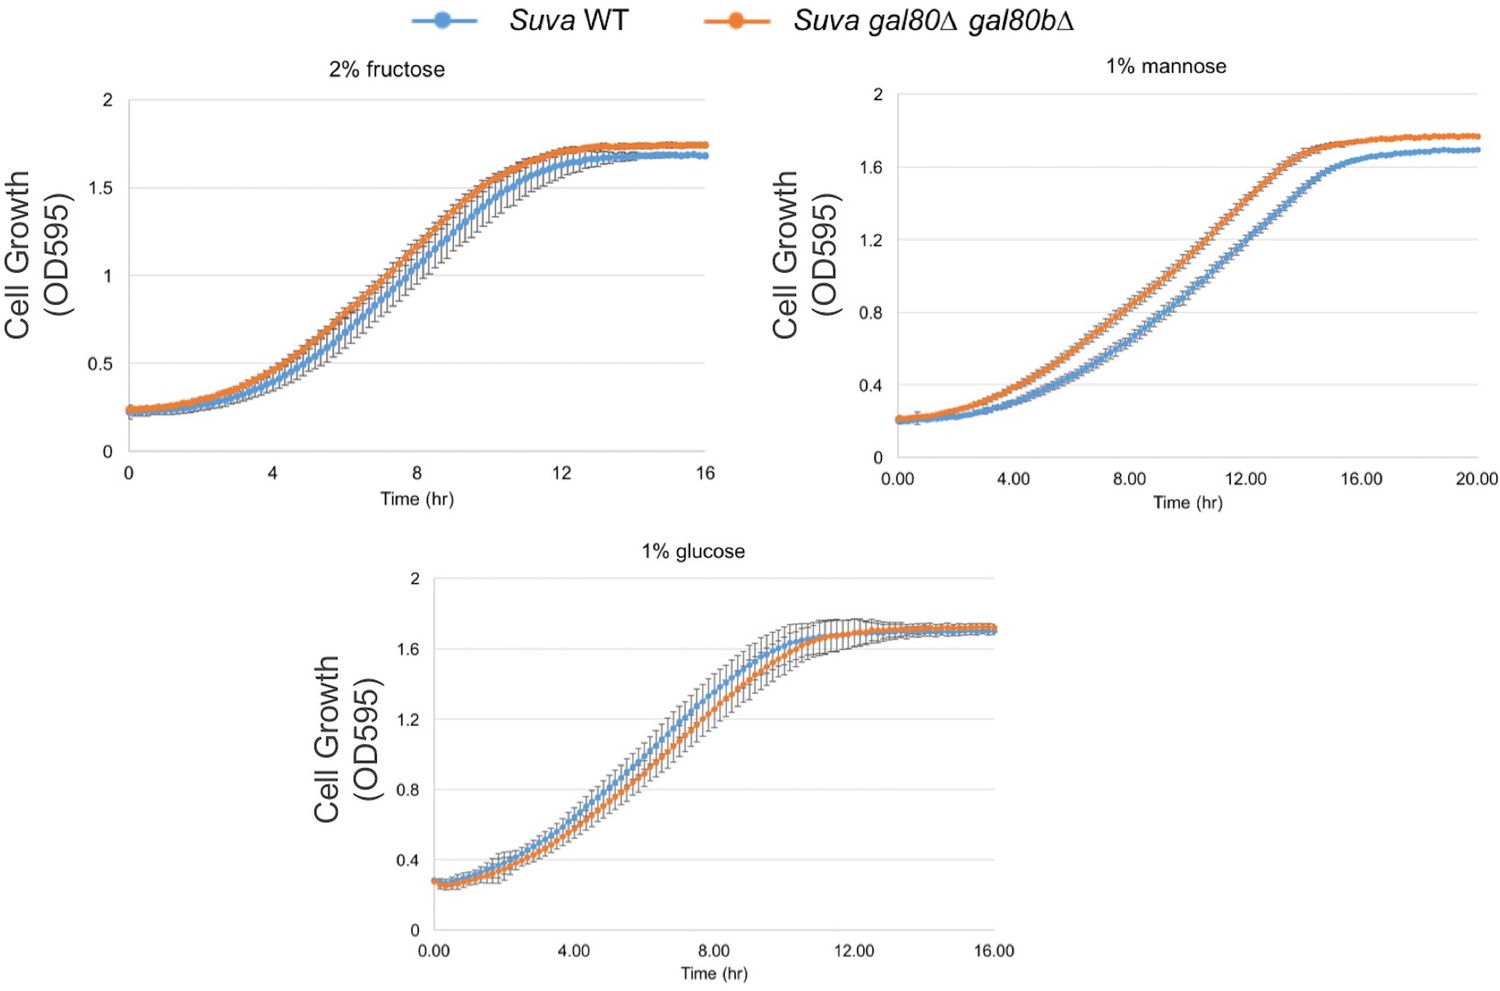
Fructose, mannose, or glucose alone did not lead to a TGA phenotype or other growth defects.
All experiments were performed in SC media with the carbon sources indicated.
Figure 4—figure supplement 6
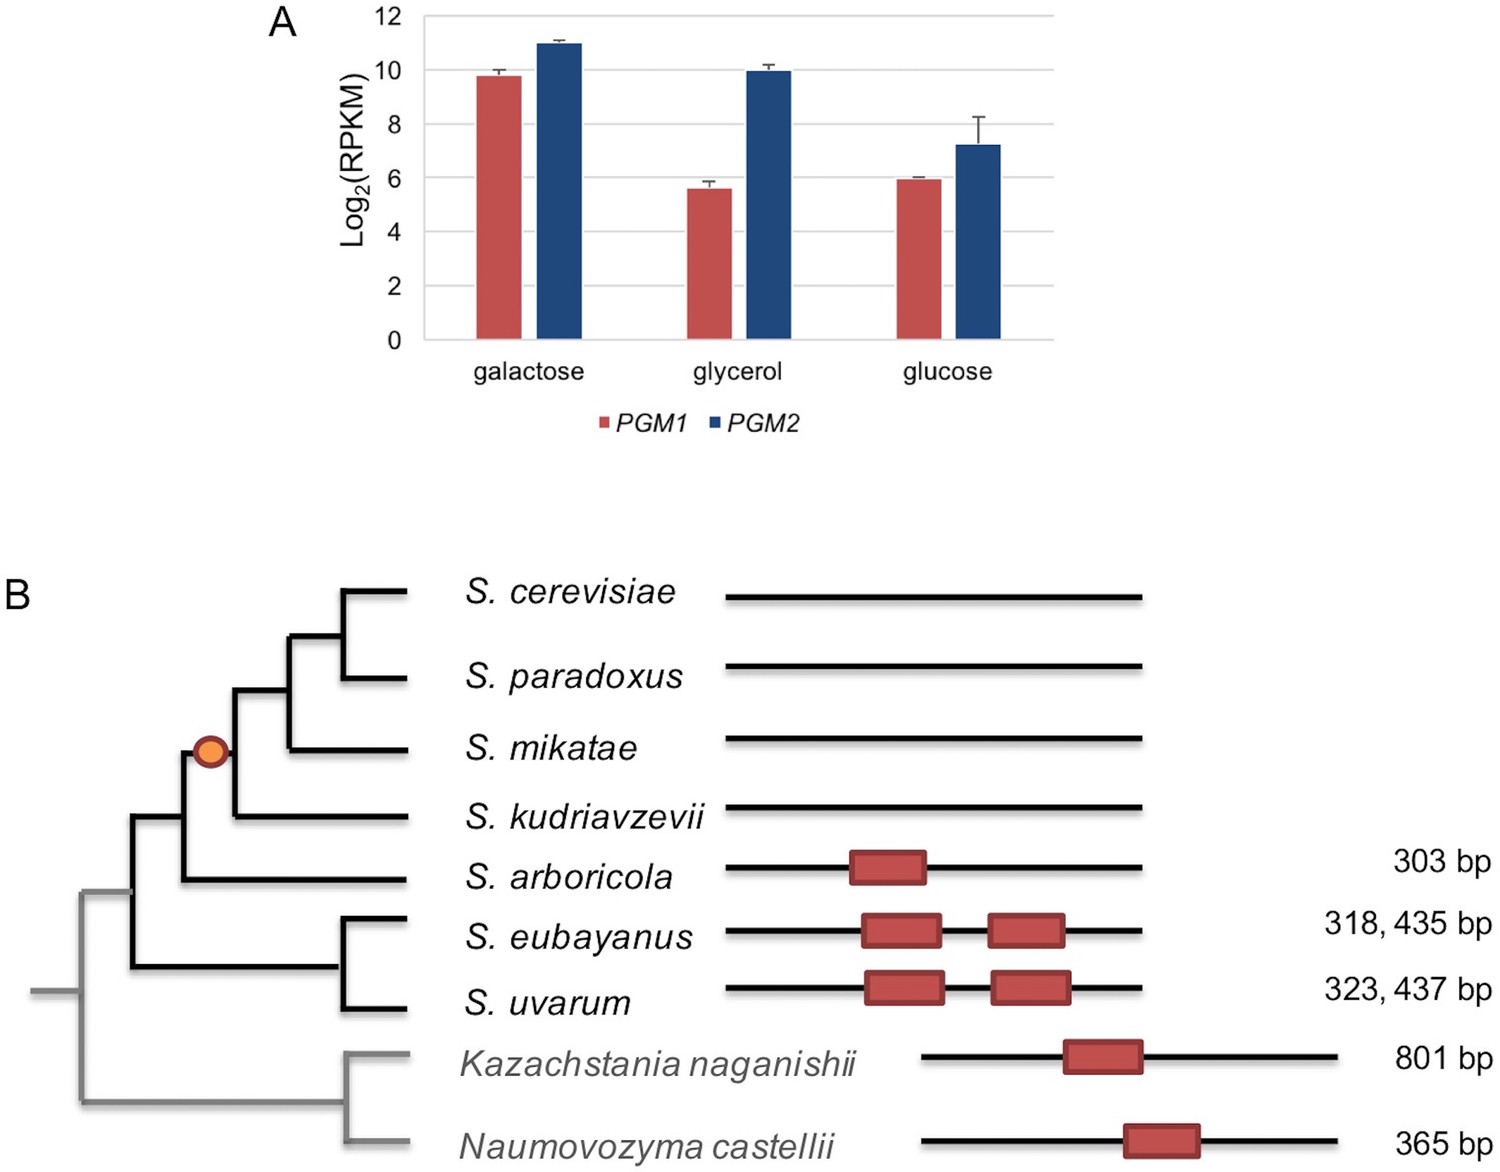
The regulation of PGM1 by galactose was inferred as the ancestral state.
(A) mRNA levels of S. uvarum PGM1 and PGM2 during mid-log phase in SC + 2% galactose, SC + 5% glycerol, and SC + 2% glucose. Note that PGM2, which encodes the major isoform of phosphoglucomutase, has long been known to be transcriptionally induced by ~three–four fold in galactose, but it lacks a Gal4 binding site and does not appear to be a direct target in S. cerevisiae (Oh and Hopper, 1990; Rubio-Texeira, 2005). These features are broadly shared with S. uvarum PGM2, which is transcriptionally induced two-fold by galactose relative to glycerol but is not transcriptionally up-regulated in the gal80∆ gal80b∆ mutant; nor does it have a consensus Gal4 site. (B) Conservation of putative Gal4 binding sites upstream of PGM1 in S. uvarum, S. eubayanus, S. arboricola, and two outgroup species. The orange dot indicates the inferred loss of direct regulation of PGM1 by Gal4 based on the presence or absence of putative Gal4 binding sites (CGGN11CCG). The distances upstream from the start codon are shown at the right. The putative sites are shown as red boxes at the relative position of the upstream sequences of PGM1. Note that, in Kazachstania nagansihii, the upstream intergenic region of PGM1 ortholog is 1958 bp, an unusually long intergenic region for yeasts, and contains a divergent promoter that also drives expression of the PMU1 ortholog.
Figure 5 with 1 supplement
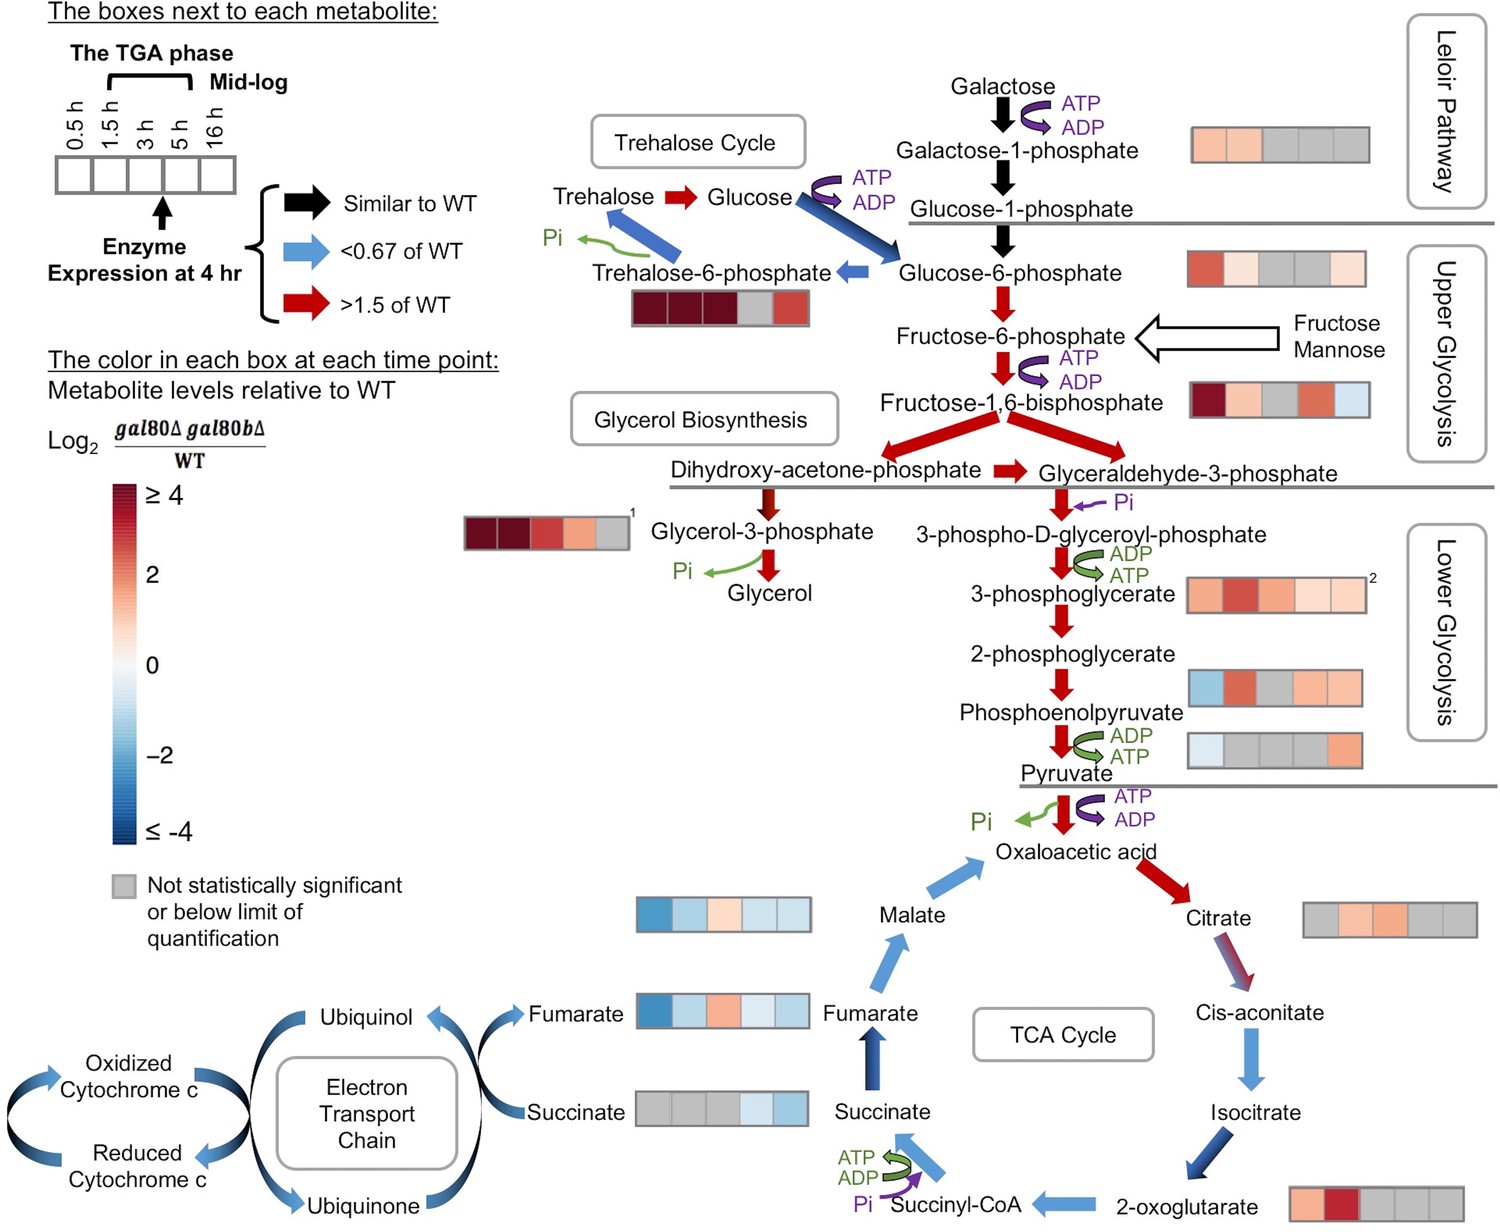
Overly rapid galactose catabolism leads to metabolic overload and bottlenecks.
The graph shows the metabolite levels and transcript expression for the Leloir pathway, glycolysis, trehalose cycle, glycerol biosynthesis, TCA cycle, and electron transport chain. Purple steps cost ATP or inorganic phosphate (Pi), while green steps generate ATP or Pi. Strains were cultured in SC + 2% galactose. The arrows are color-coded to represent the RNA-Seq gene expression differences of S. uvarum gal80∆ gal80b∆ relative to wild-type at 4 hr (red, up in the mutant; blue, down in the mutant; black, similar to wild-type; mixed colors (e.g. black and blue) indicate that the expression of genes involved in this step differs). The boxes next to each metabolite represent the log2 of the metabolite concentration differences relative to wild-type over time (0.5, 1.5, 3, 5, and 16 hr, respectively). The statistical significance for metabolite levels was assessed using Student’s t-tests (n = 3, p<0.05 with gray reported as not significant). The 1.5 hr to 5 hr time points correspond to the TGA phase, whereas the 16 hr time point corresponds to mid-log phase after recovery from the TGA phase. 1, the sum of the metabolite concentrations of glycerol-3-phosphate and glycerol-2-phosphate, the latter of which is not known to be a major metabolite in Saccharomyces; 2, the sum of the metabolite levels of 3-phosphoglycerate and 2-phosphoglycerate.
-
Figure 5—source data 1
Differential gene expression between S. uvarum gal80∆ gal80b∆ and wild-type during the TGA phase and at mid-log phase.
- https://doi.org/10.7554/eLife.19027.017
-
Figure 5—source data 2
Mass spectrometry metabolomic results comparing S. uvarum gal80∆ gal80b∆ to wild-type during the TGA phase and mid-log phase.
- https://doi.org/10.7554/eLife.19027.018
Figure 5—figure supplement 1
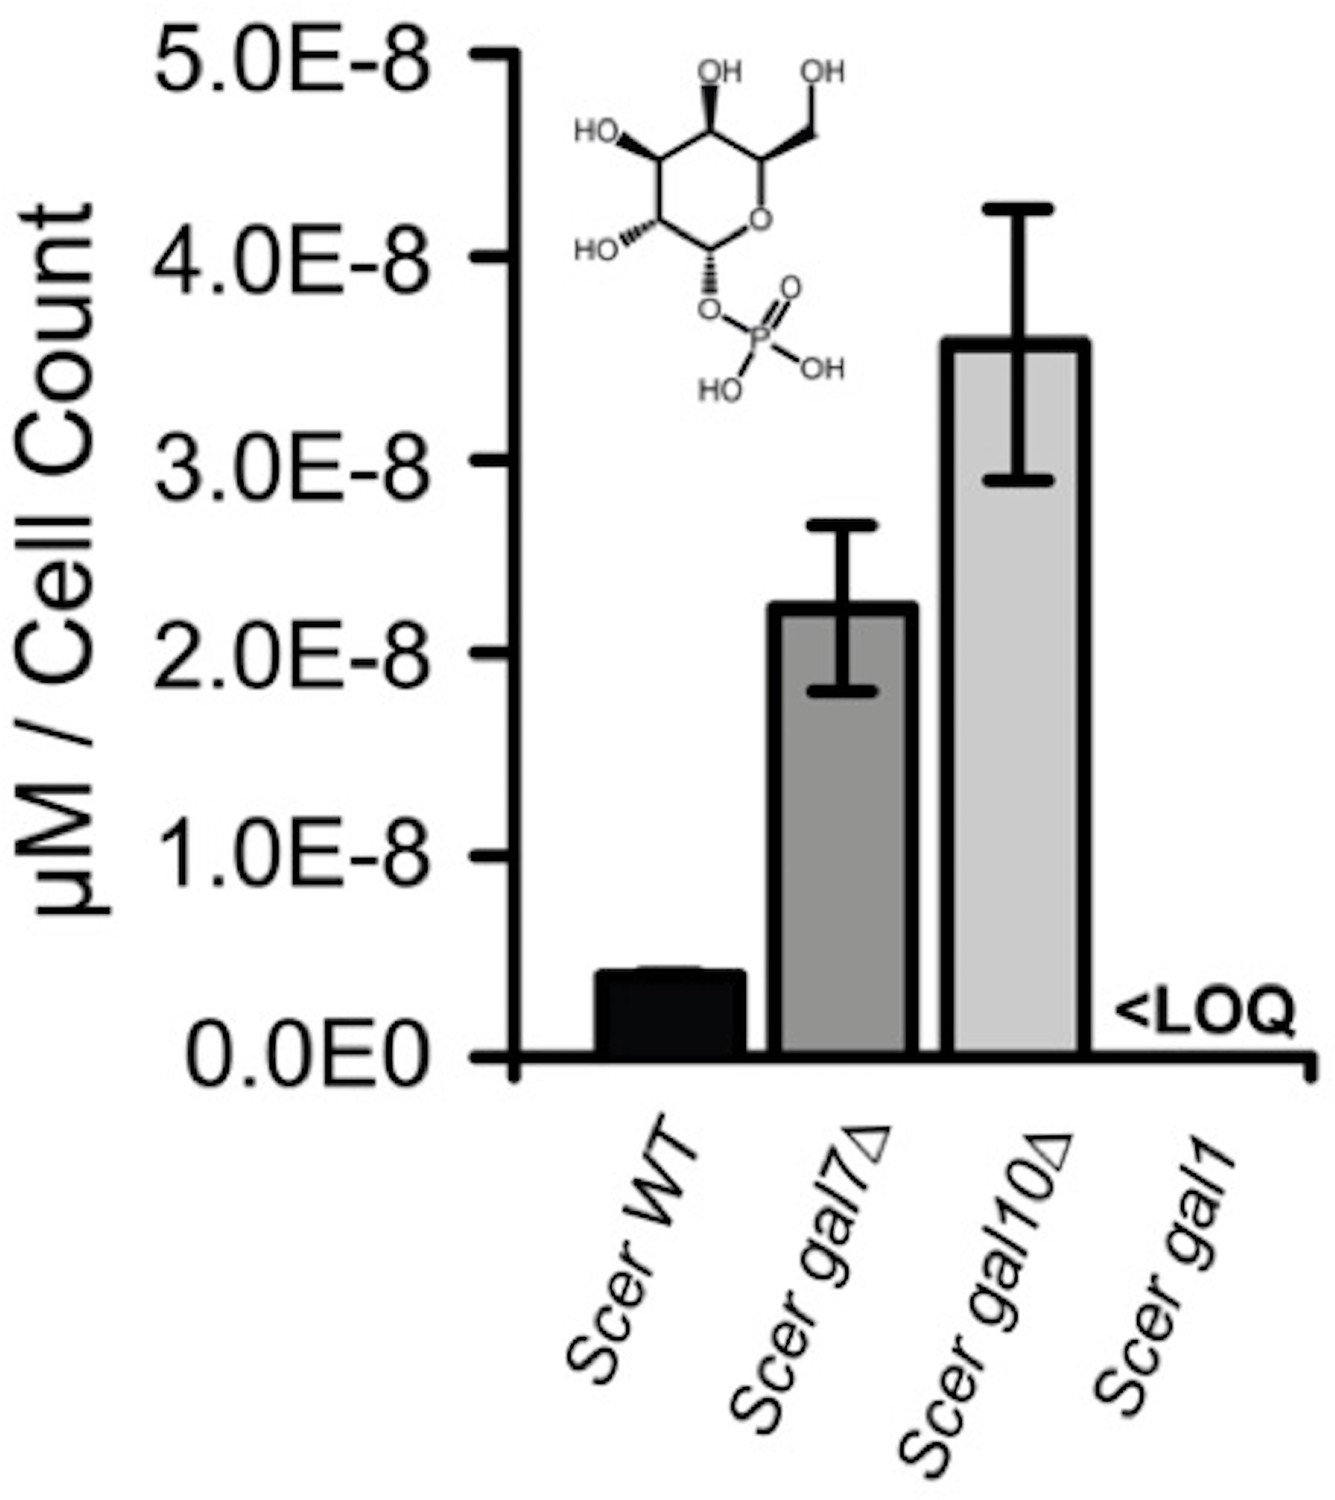
Galactose-1-phosphate accumulation of S. cerevisiae gal7∆ and gal10∆.
Galactose-1-phosphate levels were quantified by mass spectrometry. Samples were harvested after 4.5 hr of growth in 2% galactose. ‘LOQ’ stands for “Limit of Quantification”.
Figure 6
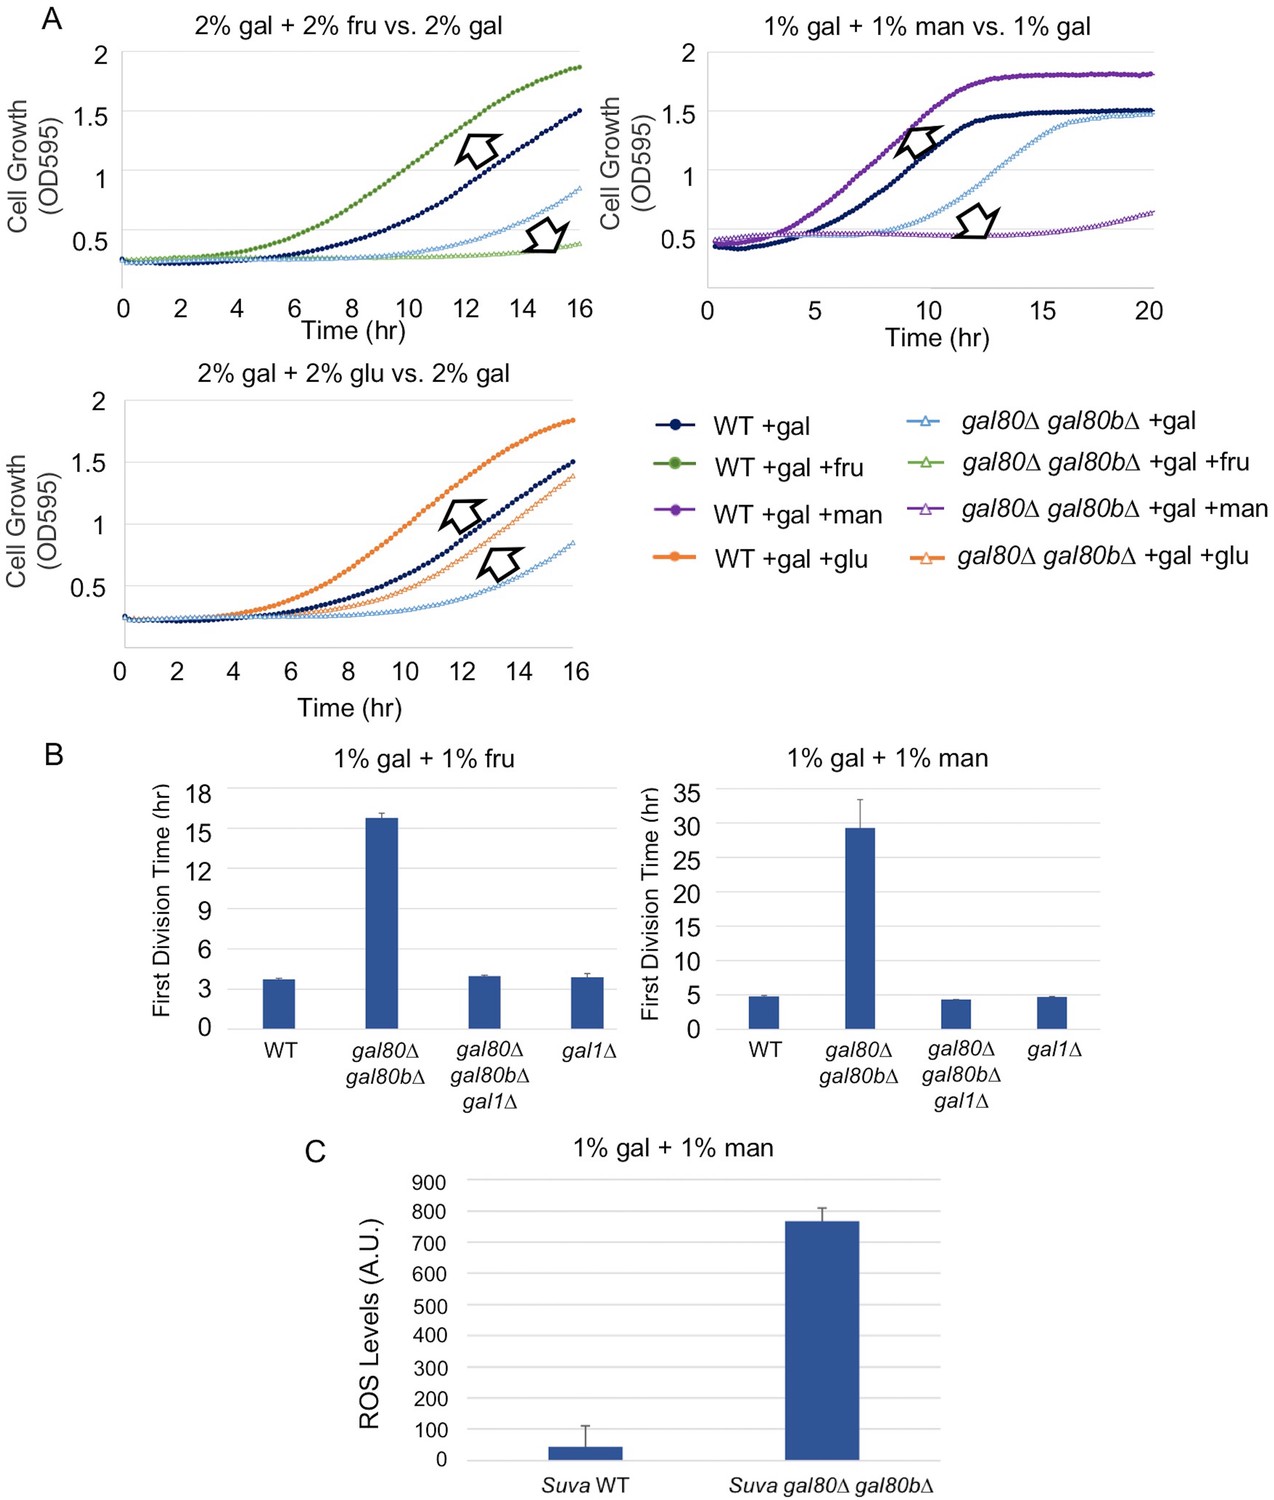
The addition of sugars downstream of the trehalose cycle exacerbated metabolic overload.
(A) Fructose and mannose exacerbated the TGA phenotype in the S. uvarum gal80∆ gal80b∆ background, whereas glucose partially rescued the TGA phenotype. (B) The S. uvarum TGA phenotype in galactose and fructose or mannose can be rescued by the deletion of GAL1. The average times to first doubling are shown for three biological replicates. The error bars represent standard deviations. S. uvarum gal80∆ gal80b∆ gal1∆ was significantly different than S. uvarum gal80∆ gal80b∆ in both SC + 1% galactose +1% fructose (p=4.8e-3, n = 6, Wilcoxon rank sum test) and SC + 1% galactose + 1% mannose (p=2.9e-3, n = 6, Wilcoxon rank sum test). S. uvarum gal80∆ gal80b∆ gal1∆ was not significantly different from S. uvarum gal1∆ in SC + 1% galactose +1% fructose (p=0.43, n = 6, Wilcoxon rank sum test) but was marginally different from S. uvarum gal1∆ in SC + 1% galactose +1% mannose (p=0.03, n = 6, Wilcoxon rank sum test). (C) Elevated accumulation of ROS in S. uvarum gal80∆ gal80b∆ in SC + 1% galactose +1% mannose. S. uvarum gal80∆ gal80b∆ had significantly higher ROS levels than the wild-type (p=8.6e-6, n = 11, Wilcoxon rank sum test). ROS levels are reported as relative fluorescence levels.
Figure 7
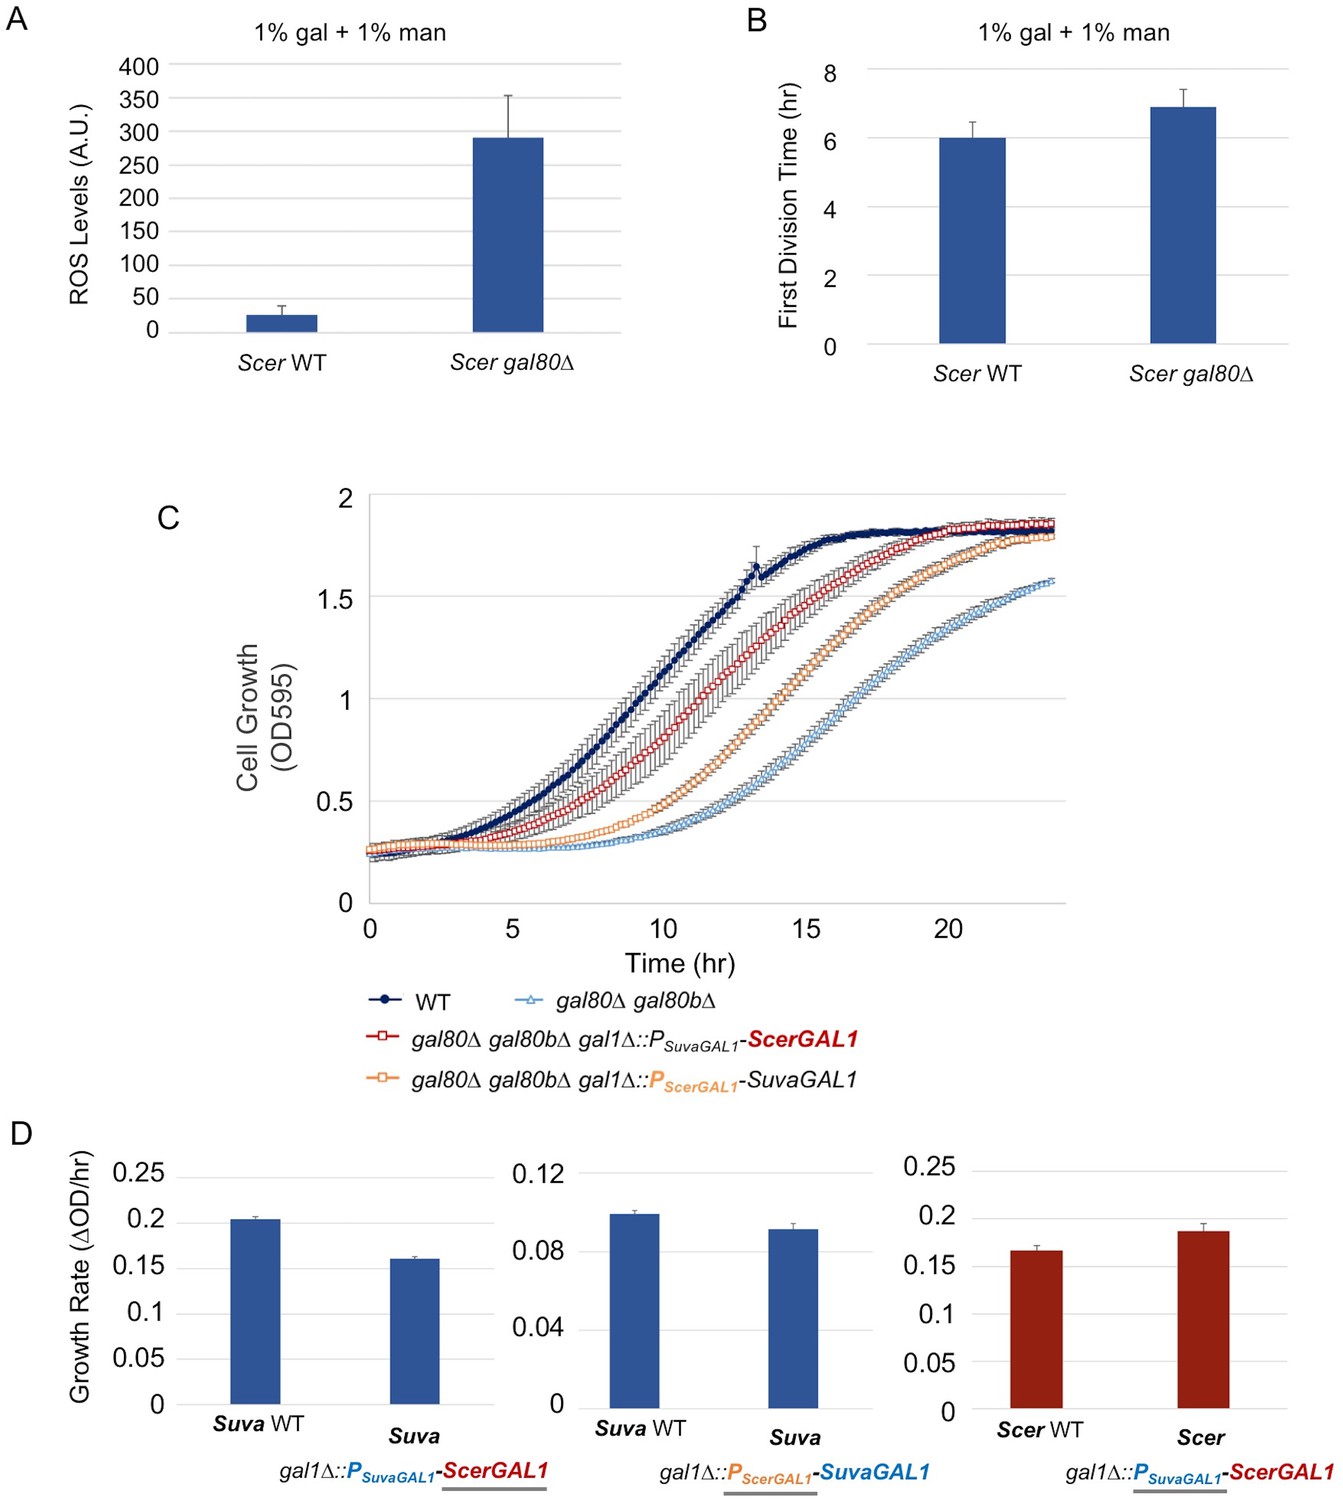
The less active S. cerevisiae GAL1 gene is partially responsible for a subtle temporary growth arrest.
(A) Elevated accumulation of ROS in S. cerevisiae gal80∆ in SC + 1% galactose +1% mannose. S. cerevisiae gal80∆ had significantly higher ROS than wild-type (p=2.3e-6, n = 12, Wilcoxon rank sum test). ROS levels are reported as relative fluorescence levels. (B) S. cerevisiae gal80∆ grew more slowly when galactose was mixed with mannose. The average of three biological replicates from a representative experiment is shown, and the error bars represent standard deviations (p=0.028, n = 6, Wilcoxon rank sum test). (C) Both the ScerGAL1 coding sequence and promoter are able to partially rescue the TGA phenotype. The error bars show the standard deviation of three biological replicates. (D) Both the ScerGAL1 coding sequence and promoter reduced the growth rate of an otherwise wild-type strain of S. uvarum in SC + 2% galactose, while the reciprocal swap of the GAL1 promoter in S. cerevisiae increased its growth rate. Wilcoxon rank sum tests comparing the specific growth rates of each subpanel were all significant: (1) p=2.3e-6 and n = 12 for S. uvarum gal1∆::PSuvaGAL1-ScerGAL1 versus S. uvarum wild-type, (2) p=2.5e-4 and n = 9 for S. uvarum gal1∆::PScerGAL1-SuvaGAL1 versus S. uvarum wild-type, and (3) p=8.8e-3 and n = 9 for S. cerevisiae gal1∆::PSuvaGAL1-ScerGAL1 versus S. cerevisiae wild-type.
Figure 8
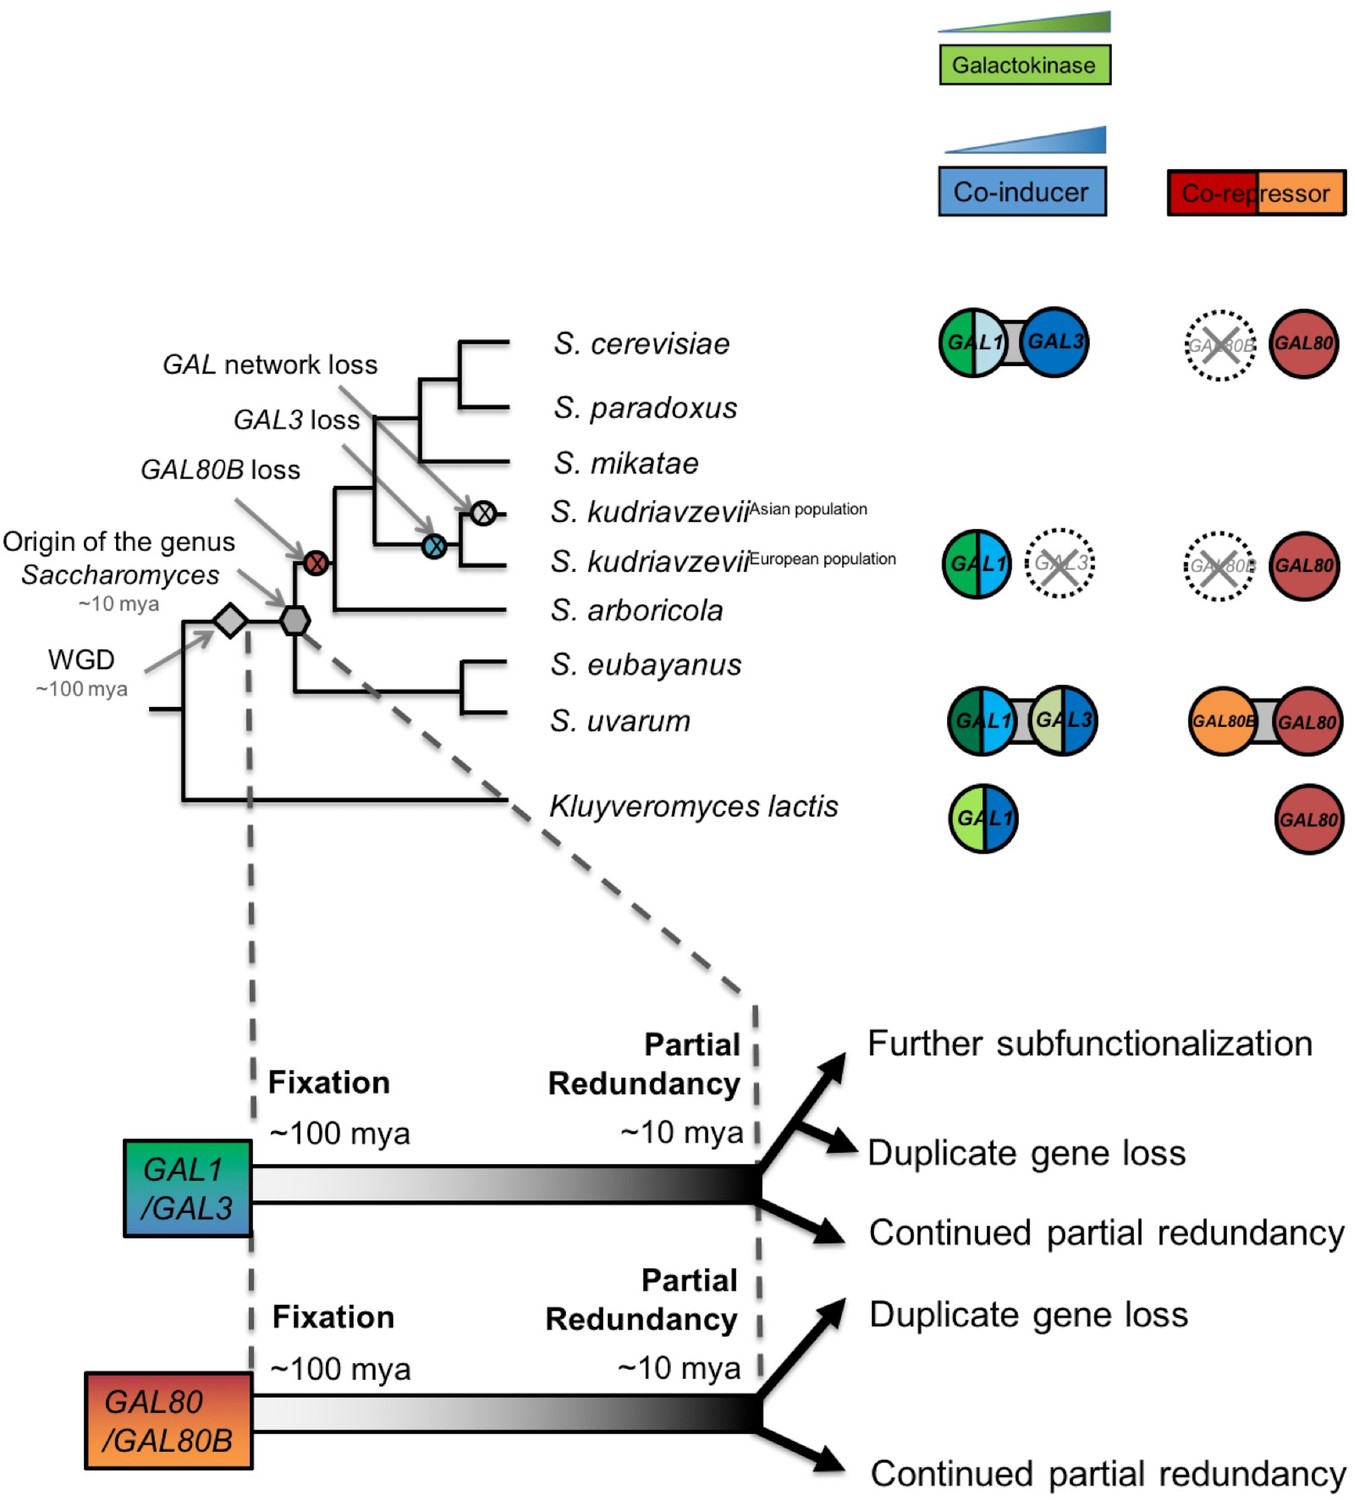
Ongoing diversification of the functions of the GAL1-GAL3 and GAL80-GAL80B duplicate gene pairs in Saccharomyces.
Important evolutionary events are shown on the cladogram. WGD, the whole genome duplication that created the two pairs of paralogs. The inferred duplicate divergence fates are shown at the bottom of the tree. The inferred timeline is depicted by the dashed line. Roughly ~100 million years ago, these two pairs of duplicate genes were fixed in the ancestral genome following a WGD event. Considerable partial redundancy was maintained in the lineage leading to the origin of the genus Saccharomyces. In the last ~10 million years, the fates of the duplicate genes have functionally diverged along different evolutionary trajectories. The bifunctionality of the GAL1/GAL3 genes is represented by green for the enzymatic function and blue for the co-induction function. The color shading represents approximate functionality for experimentally characterized genes: a darker color indicates a stronger function, whereas a lighter color indicates a weaker function. The dashed circle with a cross indicates the loss of the indicated gene. Note that the S. kudriavzevii Asian population lost its entire GAL network, while the European population retained most of its GAL network but lost GAL80B and GAL3. The additional co-repressor in S. uvarum may minimize the risk of metabolic overload due to an otherwise highly active GAL network.
Additional files
-
Supplementary file 1
Gene Ontology Term enrichment results of mis-regulated processes in Suva gal80∆ gal80b∆ during the TGA phase and mid-log phase.
- https://doi.org/10.7554/eLife.19027.023
-
Supplementary file 2
List of strains used in this study.
- https://doi.org/10.7554/eLife.19027.024
Download links
A two-part list of links to download the article, or parts of the article, in various formats.
Downloads (link to download the article as PDF)
Open citations (links to open the citations from this article in various online reference manager services)
Cite this article (links to download the citations from this article in formats compatible with various reference manager tools)
Ongoing resolution of duplicate gene functions shapes the diversification of a metabolic network
eLife 5:e19027.
https://doi.org/10.7554/eLife.19027


