Physical basis of large microtubule aster growth
- Harvard Medical School, United States
- Marine Biological Laboratory, United Sates
- Boston University, United States
Figures
Figure 1
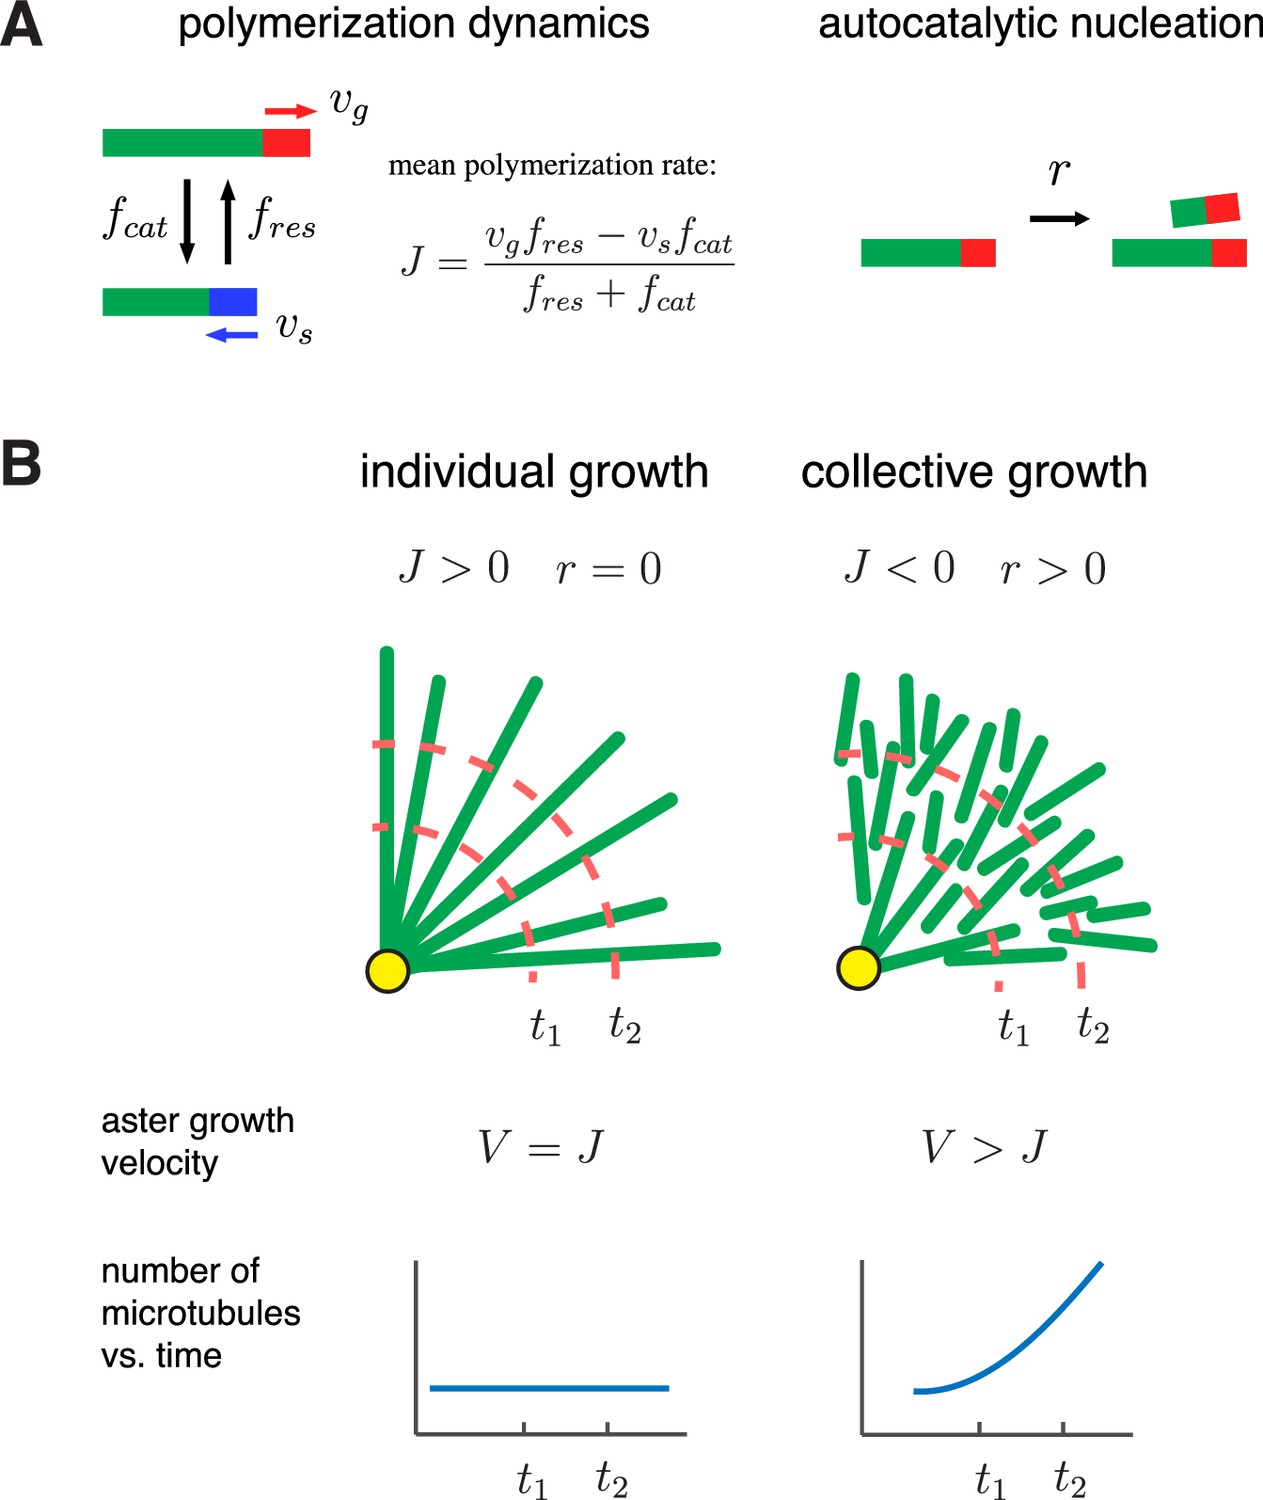
A biophysical model for the collective growth of microtubule asters.
(A) We propose that asters grow via two microscopic processes: polymerization and nucleation. Individual microtubules follow the standard dynamic instability with a growing state with polymerization rate and a shrinking state with depolymerization rate . Transitions between the states occur at rates and , which model catastrophe and rescue events, respectively. New microtubules are added at a rate via a nucleation at pre-existing plus ends in the growing state. (B) Individual vs. collective growth of asters. In the standard model of ‘individual growth’, asters increase their radius at rate only via a net polymerization from the centrosome (yellow). Thus, this model predicts that the rate of aster growth equals the mean polymerization rate , the number of microtubules is constant, and their density decreases away from the centrosomes. In the collective growth model, the microtubule density is constant and the number of microtubules increases. Autocatalytic nucleation makes asters grow faster than the net polymerization rate and can sustain growth even when individual microtubules are unstable .
Figure 2
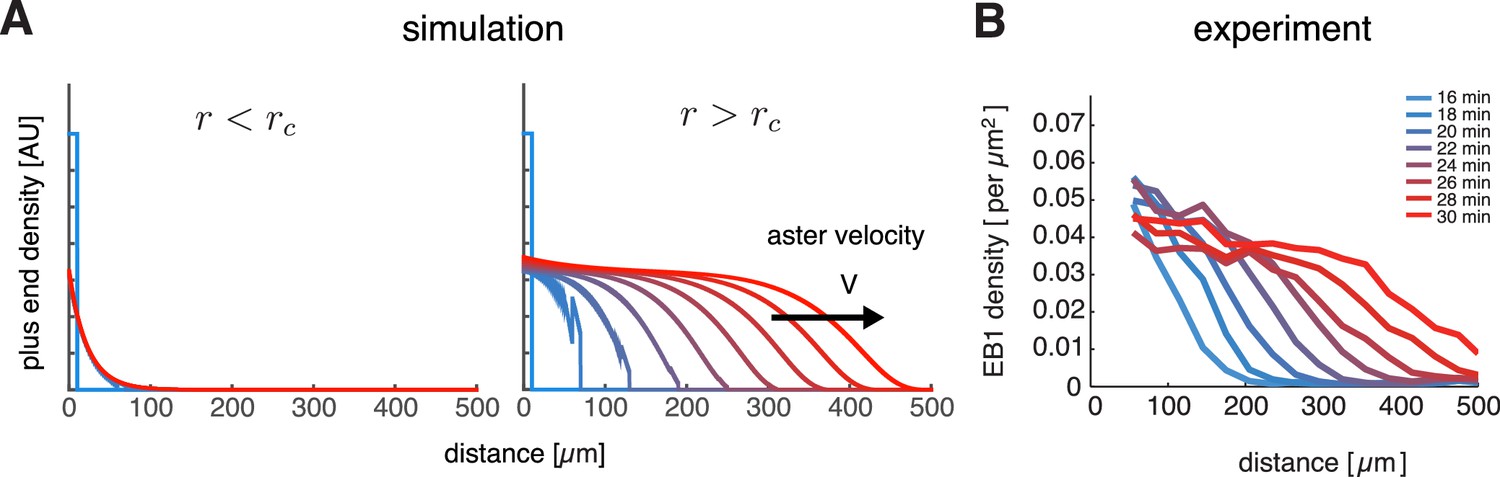
Our model captures key features of large aster growth.
(A) Time evolution of growing plus end density predicted by our model, which we solved via numerical simulations in 1D geometry. In the stationary regime, the microtubule population remained near the centrosome , , , , and (left). In contrast, outward expansion of the microtubule population was observed when the nucleation rate was increased to , above the critical nucleation rate (right). For both simulations, microtubules are in the bounded regime . (B) Experimental measurements confirm that asters expand at a constant rate with time-invariant profiles of the plus end density, as predicted by our model. The plus end densities were estimated as EB1 comet density during aster growth as previously described (Ishihara et al., 2014a).
© 2014 Proceedings of the National Academy of Sciences of the United States of America. All Rights Reserved. Panel B reprinted with permission from Figure 4C from (Ishihara et al., 2014a), Proceedings of the National Academy of Sciences of the United States of America. Not covered by the terms of the Creative Commons Attribution 4.0 International license.
Figure 3 with 2 supplements
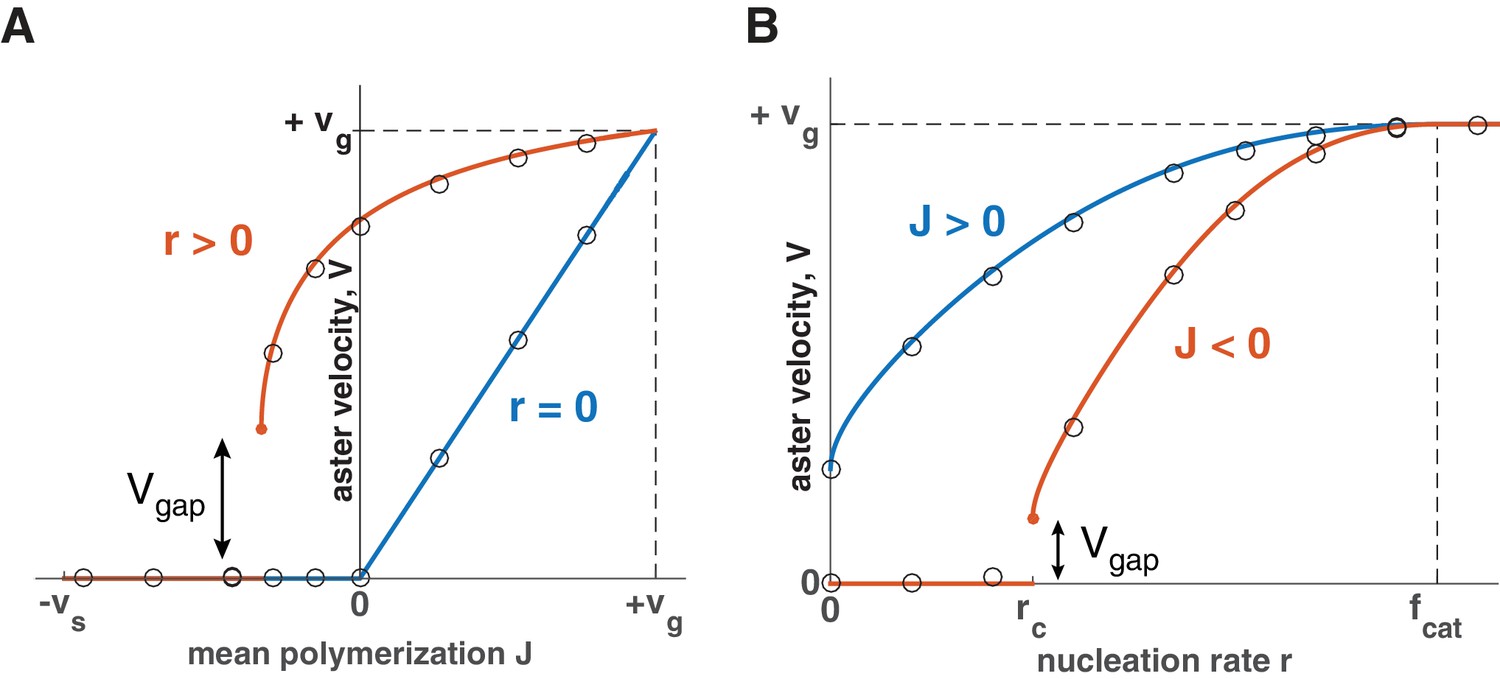
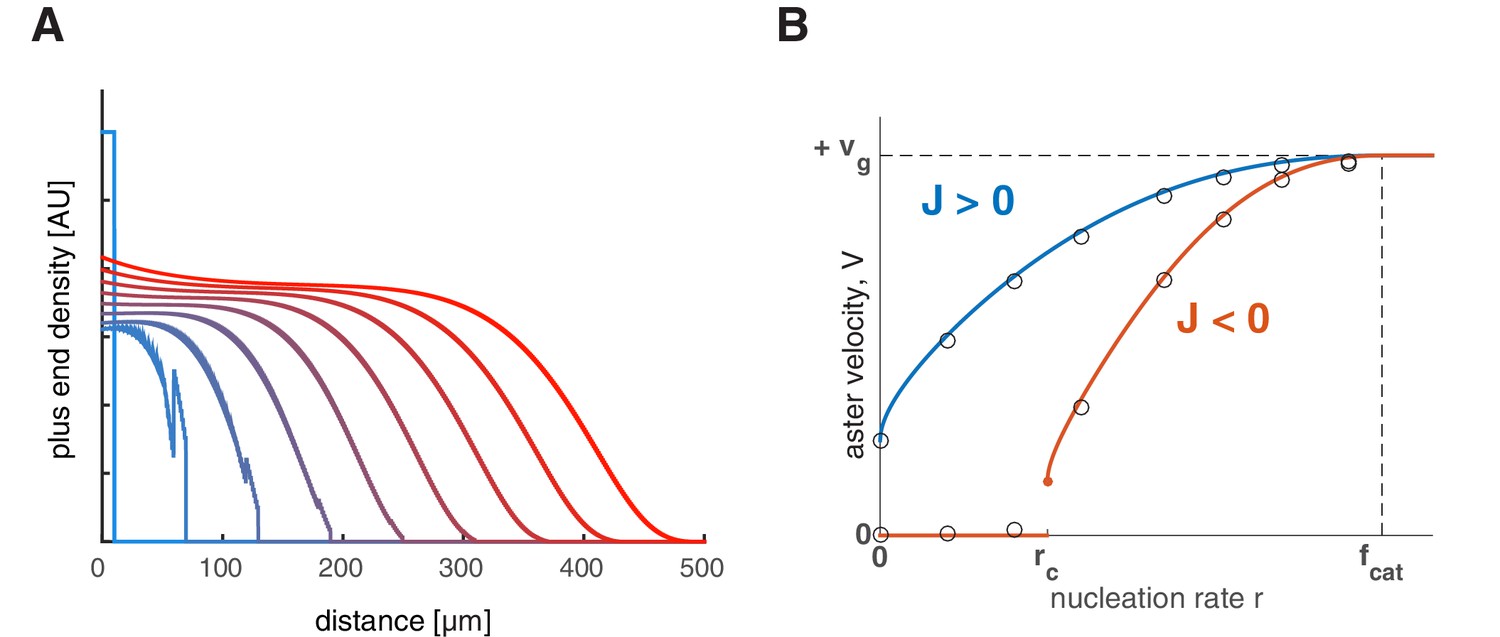
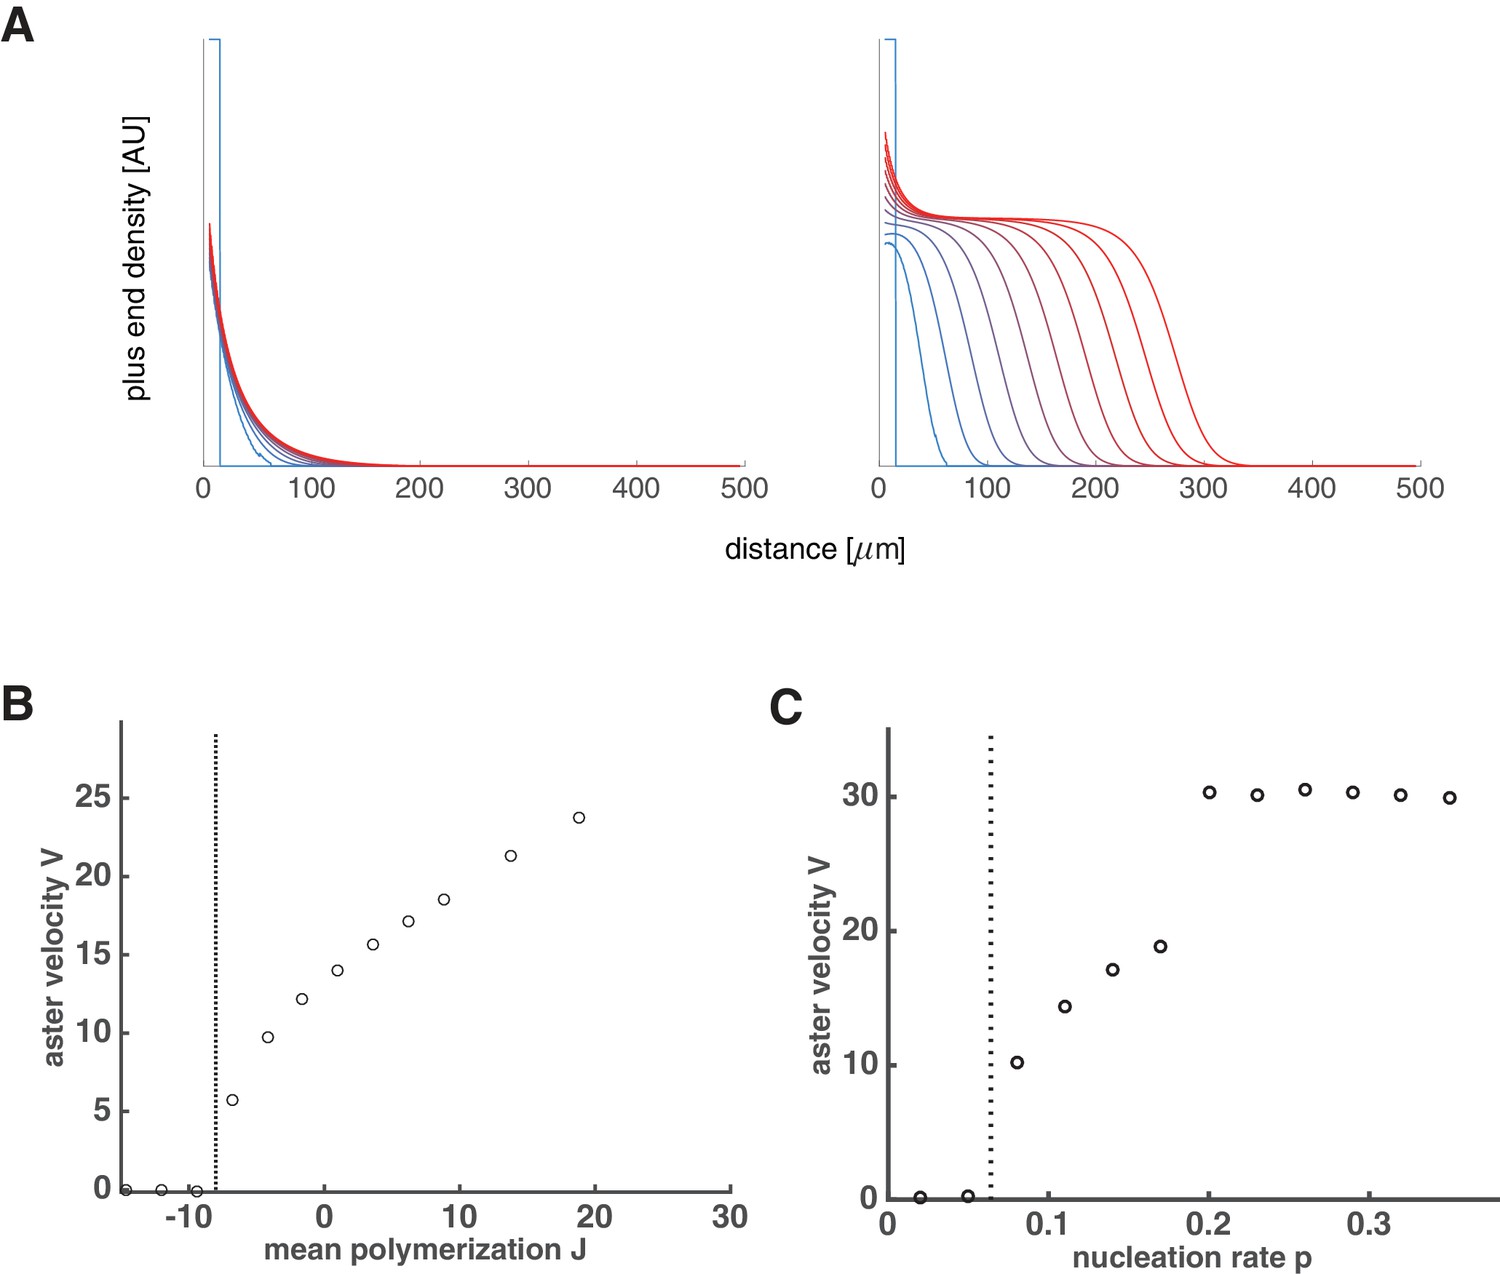
Explosive transition from stationary to growing asters and other theoretical predictions.
Analytical solution (lines) and numerical simulations (dots) predict that asters either remain stationary or expand at a constant velocity, which increases with the net polymerization rate (A) and nucleation rate (B). The transition to a growing state is accompanied by a finite jump in the expansion velocity labeled as . (A) The behavior in the standard model () is shown in blue and our model () in red. Note that aster growth commences at in the presence of nucleation and occurs at a minimal velocity . Although spatial growth can occur for both and the properties of the resulting asters could be very different (see SI). Here, . (B) If , critical nucleation is required to commence aster growth. Blue line corresponds to and red line to . See Materials and methods and SI for the details of the analytical solution and numerical simulations.
Figure 3—figure supplement 1
Feedback regulation of catastrophe rate leads to the same explosive transition.
(A) Time evolution of growing plus end density similar to the simulations in 1D planar geometry as in Figure 2. This example represents a scenario where the nucleation rate is above the critical nucleation rate () resulting in aster growth. (B) Analytical solution (lines) and numerical simulations (dots) predict aster velocity as a function of nucleation rate similar to Figure 3A. Blue line corresponds to and red line to .
Figure 3—figure supplement 2
Aster growth by polymer-stimulated nucleation leads to the same explosive transition.
(A) Time evolution of growing plus end density similar to Figure 2A. Below the critical nucleation rate, asters are stationary (left, ). Above the critical nucleation rate, asters grow in radius (right, ) even when microtubules are unstable (). Here, the critical polymer nucleation rate as predicted by Equation (A59). (B) Numerical simulations predict aster velocity as a function of ( was varied while keeping ). (C) Numerical simulations predict aster velocity as a function of polymer-stimulated nucleation rate ( was varied while keeping ). Dashed vertical lines indicate the predicted critical transitions from Equation (A59).
Figure 4 with 3 supplements

Titration of MCAK-Q710 slows then arrests aster growth through a discontinuous transition.
(A) Addition of MCAK-Q710 results in smaller interphase asters assembled by Aurora A beads in Xenopus egg extract. Images were obtained 20 min post initiation with the plus end marker EB1-mApple. Dotted lines indicate the approximate outline of asters. (B) Aster velocity decreases with MCAK-Q710 concentration and then abruptly vanishes as predicted by the model. Note a clear gap in the values of the observed velocities and bimodality near the transition, which support the existence of . Quantification methods are described in methods and Figure 4—figure supplement 1.
Figure 4—figure supplement 1

Aurora A kinase bead asters at different MCAK-Q710 concentrations.
(A) Measuring aster growth velocities from time-lapse images of asters visualized with the plus end marker EB1-mApple. A linear region is chosen in the radial outward direction (left). The raw fluorescent intensity profiles (center) are subjected to a low pass filter (right), and the half-max position was manually selected to define the radius of the aster at different time points. Blue to red lines indicate profiles at two minute intervals. (B) At the critical concentration of 320 nM MCAK-Q710, some asters assembled from Aurora A beads showed slow growth (top) while others contained few microtubules which gradually decreased over time (bottom). The latter was scored as zero growth velocity. The reaction was started at time zero by the addition of calcium and beads to the extract. Scale bars 100 μm. (C) Aster growth velocities measured at increasing MCAK-Q710 concentrations. Biological replicate of the same experiment as in Figure 4B.
Figure 4—figure supplement 2

Pellicle asters at different MCAK-Q710 concentrations.
(A) Asters assembled by Tetrahymena pellicles as the nucleating center showed aster growth which was slowed down by MCAK-Q710 (top). At higher MCAK-Q710 concentrations, stationary asters that did not change its radius for over 60 min (bottom). (B) EB1-mApple fluorescence intensity profile of the stationary aster in panel A for time intervals 70–84 min post calcium addition. Such asters were scored as zero velocity. (C) Pellicle aster growth velocities at different MCAK-Q710 concentrations.
Figure 4—figure supplement 3

Plus end polymerization rate and catastrophe rate do not significantly change with MCAK-Q710 titration.
Measurements were made by imaging and tracking EB1 comets in growing interphase asters assembled by Aurora A beads (see Materials and methods). (A) Distribution of plus end polymerization rates at different MCAK-Q710 concentrations. (B) Distribution of EB1 comet lifetimes at different MCAK-Q710 concentrations. Inset shows the same data plotted on a semilog scale. (C) Summary of measurements from EB1 tracking analysis. The table shows the number of movies (or asters) and total number of tracks analyzed for each condition. Errors indicate standard error. The catastrophe rate was derived from a linear fit to the semilog plots of the lifetime distributions in the intervals 5–60 s. Its mean and standard error were calculated by bootstrapping.
Figure 5
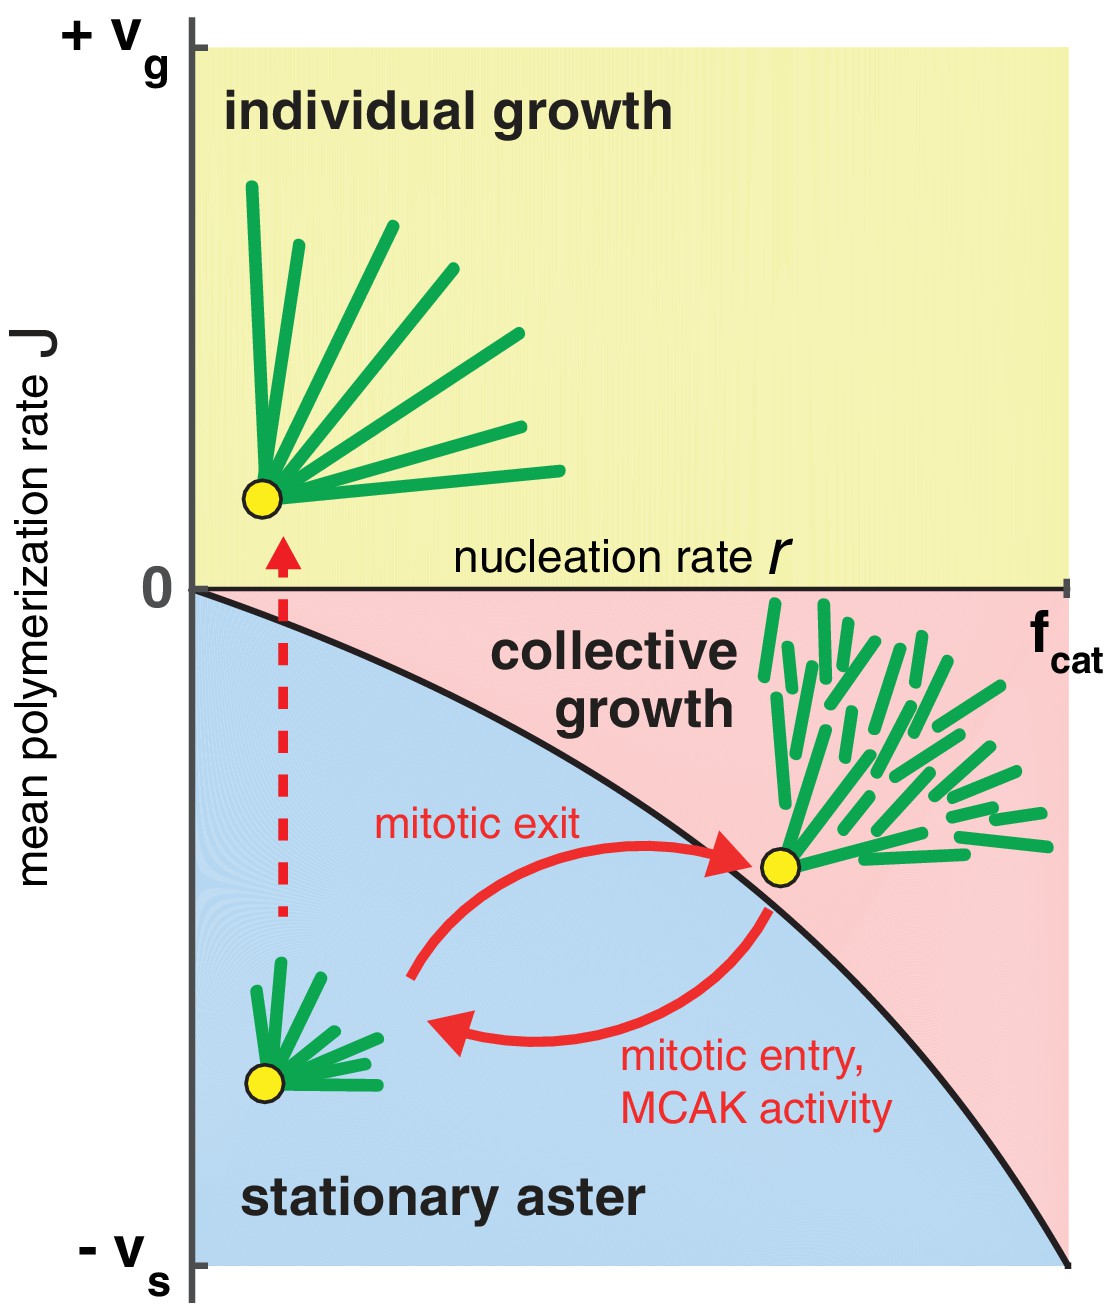
Phase diagram for aster growth.
Aster morphology is determined by the balance of polymerization dynamics and autocatalytic nucleation. Small, stationary asters (), as observed during mitosis, occur at low nucleation and net depolymerization of individual microtubules (). Net polymerization () without nucleation () produces asters that expand at rate with dilution of microtubule density at the periphery and are thus inconsistent with experimental observations. The addition of nucleation to the individual growth regime changes these dynamics only marginally (yellow region); see SI. Alternatively, the transition from stationary to growing asters can be achieved by increasing the nucleation rate, , while keeping negative. Above the critical nucleation rate starts the regime of collective growth ( as in Equation (4), which is valid for ) that produces asters composed of relatively short microtubules (red region). The transition from stationary aster to collective growth may be achieved by crossing the curve at any location, but always involves an explosive jump in aster velocity, . The reverse transition recapitulates the results of our experimental perturbation of MCAK activity (Figure 4) and mitotic entry (solid arrows). We propose this unified biophysical picture as an explanation for the cell cycle dependent changes of aster morphology in vivo.
Tables
Table 1
Model parameters used to describe large aster growth reconstituted in interphase Xenopus egg extract.
| Quantity | Symbol | Value | Comment |
|---|---|---|---|
| Polymerization rate | 30 μm/min | Measured from growing plus ends and EB1 comets | |
| Depolymerization rate | 42 μm/min | Measured from shrinking plus ends (Ishihara et al., 2014a) | |
| Catastrophe rate | 3.3 min−1 | Measured from EB1 comet lifetimes (see Materials and methods) | |
| Rescue rate | 2.00.3 min−1 | Estimated from Equations (4) and (6) | |
| Autocatalytic nucleation rate | 2.10.2 min−1 | Estimated from Equations (4) and (6) | |
| Carrying capacity of growing ends | 0.4 μm−2 | Estimated from comparing to predicted (see SI) | |
| Mean microtubule length | 16 2 μm | Estimated from from dynamics parameters (see SI) | |
| Aster velocity | 22.32.6 μm/min | Measured from rate of aster radius increase | |
| Gap velocity | 12.81.7 μm/min | Measured from aster growth at 320 nM MCAK-Q710 | |
| Bulk growing plus end density | 0.0530.030 μm−2 | Measured from EB1 comet density (Ishihara et al., 2014a) |
Appendix 4—table 1
Gap velocities defined by different critical parameters.
| Critical parameter | |
|---|---|
Appendix 8—table 1
Estimated parameter values for different scenarios on how MCAK-Q710 arrested aster growth. Different expressions for shown in Appendix 4—table 1 were used. In all cases, the values of , , , , and were the same as in Table 1.
| Estimated parameter | Units | |||
|---|---|---|---|---|
| min−1 | 2.00.3 | 3.00.7 | 3.00.7 | |
| min−1 | 2.10.2 | 1.90.2 | 1.80.2 | |
| μm−1 | 0.0530.030 | 0.120.09 | 0.150.10 | |
| μm | 162 | 3234 | 3944 |
Download links
A two-part list of links to download the article, or parts of the article, in various formats.
Downloads (link to download the article as PDF)
Open citations (links to open the citations from this article in various online reference manager services)
Cite this article (links to download the citations from this article in formats compatible with various reference manager tools)
Physical basis of large microtubule aster growth
eLife 5:e19145.
https://doi.org/10.7554/eLife.19145


