Dissociated sequential activity and stimulus encoding in the dorsomedial striatum during spatial working memory
- Princeton University, United States
Figures
Figure 1 with 1 supplement
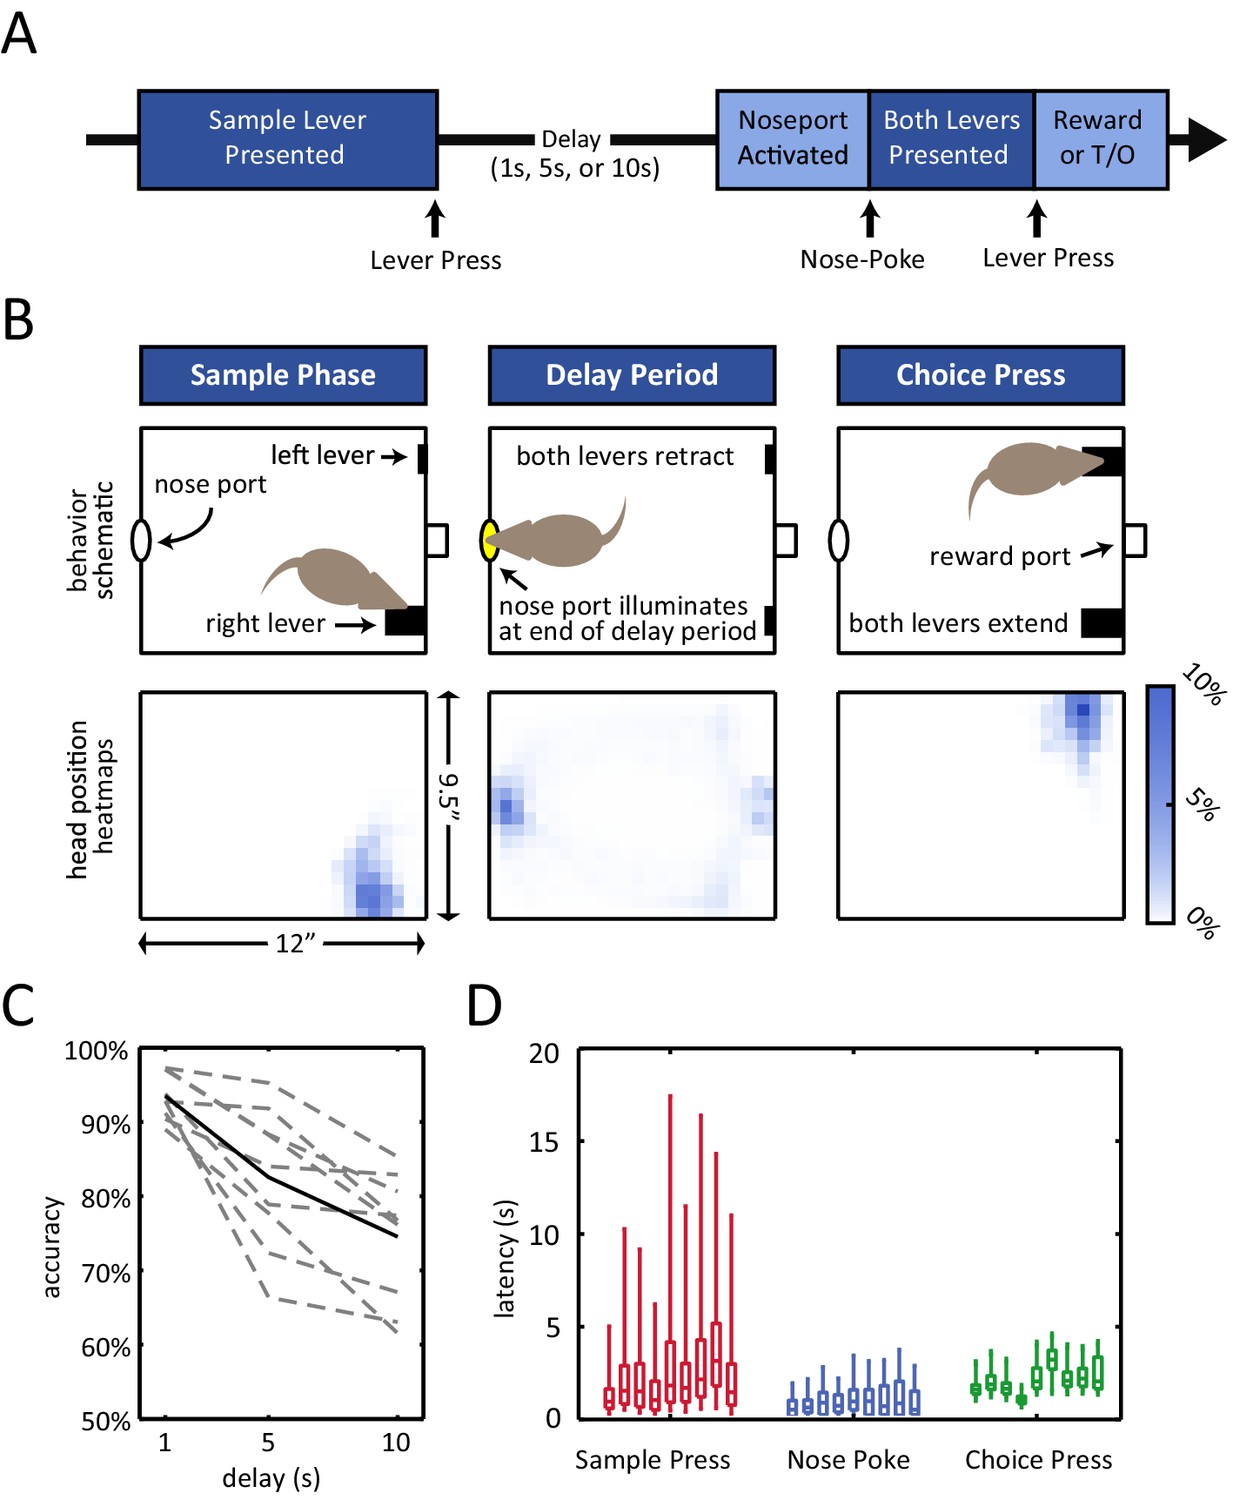
Delayed non-match to position (DNMP) task.
(A) Schematic illustration of the task structure. A trial starts with the presentation of the sample lever at one of two locations ('sample press'). By pressing the sample lever, the rat initiates the delay period (1 s, 5 s, or 10 s duration). At the end of the delay period, the nose port on the back wall of the chamber is activated, and by entering the port (i.e. nose-poking), both levers are presented. By pressing the lever that does not correspond to the sample lever at the beginning of the trial (i.e. choice press), the rat receives a reward; pressing the other lever results in a timeout (T/O). (B) Top: Schematic illustration of the chamber and the rat’s position at the time of the sample lever press (left), the delay period (middle), and the choice lever press (right). Bottom: Occupancy-map of the rats’ head position for right-sample trials at the time of the sample lever press (time window from 250 ms before to 250 ms after lever press), delay period (center, time window is the entire delay period for 10 s delay period trials only), and choice lever press (right, time window from 250 ms before to 250 ms after lever press). Occupancy-maps were generated by averaging the occupancy-maps of the 9 rats used in the electrophysiology experiments. Individual occupancy-maps were calculated by binning the head positions over the respective time windows into 0.5”× 0.5” tiles (covering the 9.5”×12” chamber). (C) Accuracy is delay dependent, decreasing as the duration of the delay period increases (p<10–4). Solid black line represents mean accuracy, and dotted grey lines represent the accuracy for each individual rat. Accuracy was calculated from the final recording session. (D) Response latency for each individual rat for sample press (time from sample presentation to sample press), nose-poke (time from nose port activation to nose-poke), and choice press (time from choice presentation to choice press). Center of each boxplot represents the median, edges correspond to 25th and 75th percentile, and whiskers correspond to fifth and 95th percentile.
Figure 1—figure supplement 1
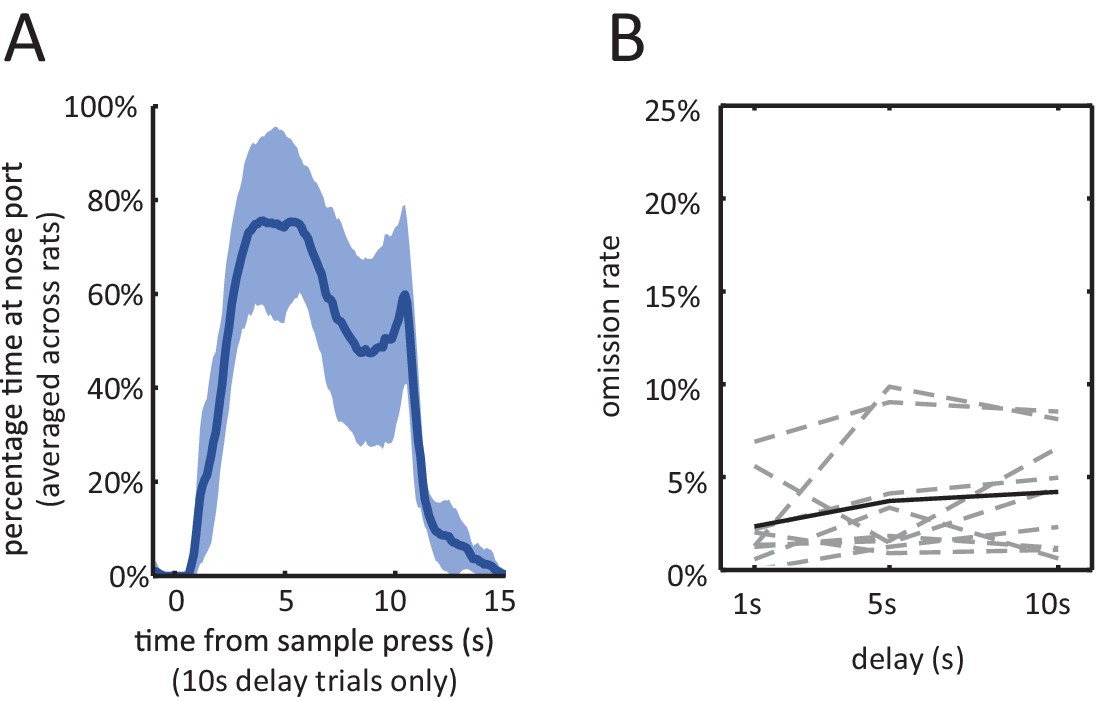
Behavior during the delayed non-match to sample task.
(A) Average percentage of time spent waiting at nose port from the delay period onset, averaged across the 9 rats of the electrophysiology experiment. The shading is ± 1 SEM. (B) Omission Rates (defined as percentage of trials in which the rat failed to respond to either the sample lever, nose port, or choice lever, within the allowed time-limit) are less than 10% across all delay periods. Dashed lines are for individual rats and solid line is the average across all rats. Figure 2—figure supplement 1: Various behavioral measures were not significantly affected across rats with the infusion of muscimol. number of trials: total number of trials completed (correct trials and error trials) within the session (n = 7, Wilcoxon signed rank test, p=0.22). sample omission rate: percentage of all trials where the rat omitted the sample lever press (n = 7, Wilcoxon signed rank test, p=0.38). trial abort rate: percentage of trials where the rat omitted the nose-poke or the choice lever press (n = 7, Wilcoxon signed rank test, p=0.11). sample bias: defined as the absolute value of the difference between left sample omission rate and right sample omission rate (n = 7, Wilcoxon signed rank test, p=1.00). choice bias: defined as the absolute value of the difference between accuracy on left sample trials and accuracy on right sample trials (n = 7, Wilcoxon signed rank test, p=0.16).
Figure 2 with 1 supplement

Inactivation of dorsomedial striatum (DMS) impairs accuracy during the DNMP task.
(A) Red circles with blue fillings represent location of injection cannula tips as revealed by post-mortem histological analysis. (B) Muscimol infusion in DMS impairs accuracy when compared to infusion of saline (p<0.001; effect of muscimol repeated measures ANOVA, no significant interaction effect between delay length and infusion day). Error bars are ± 1 SEM across 7 rats. (C) Accuracy was significantly impaired for the 5 s and 10 s delay trials (*p<0.05; Wilcoxon signed rank test) but not for 1 s delay trials (p=0.38; Wilcoxon signed rank test, n=7 rats). (D) No signficant effect of DMS inactivation on median response latency for sample press (top, p=0.58), nose-poke (middle, p=0.28), and choice press (bottom, p=0.92; Wilcoxon signed rank test, n=7 rats).
Figure 2—figure supplement 1
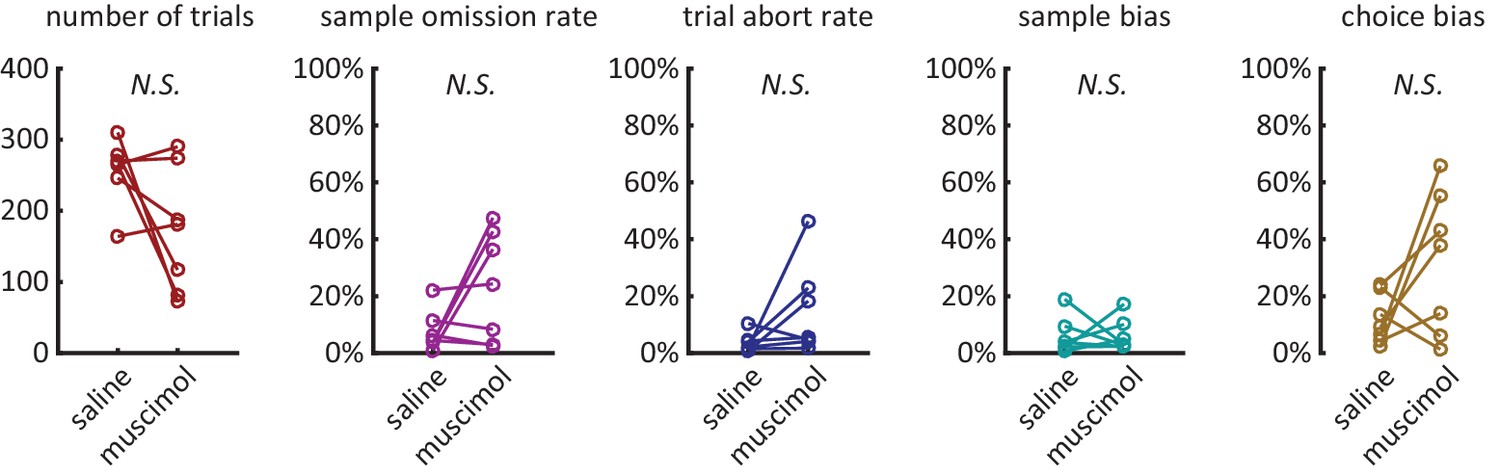
Additional behavioral measures were not signficantly effected by muscimol treatment.
https://doi.org/10.7554/eLife.19507.005
Figure 3
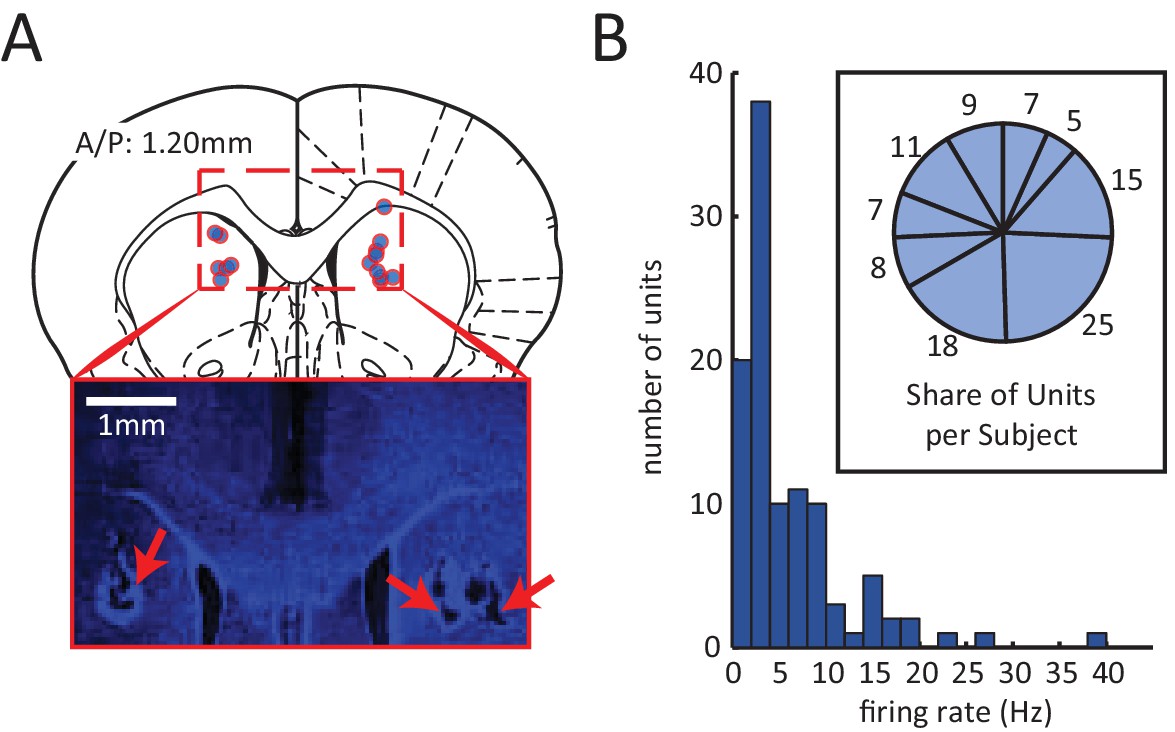
Electrophysiological recording of neural activity in the dorsomedial striatum (DMS).
(A) Red circles with blue fillings correspond to location of DMS electrode array tips in 9 rats. Electrodes array rows were oriented in the A/P direction to span a length of 1.6 mm, centered at A/P: 1.2 mm. Inset: Example image of electrode lesions in DMS (blue DAPI stain; 1 mm scale bar). (B) Histogram of mean firing rate of 105 isolated units. Inset: number of units isolated from each rat.
Figure 4 with 2 supplements
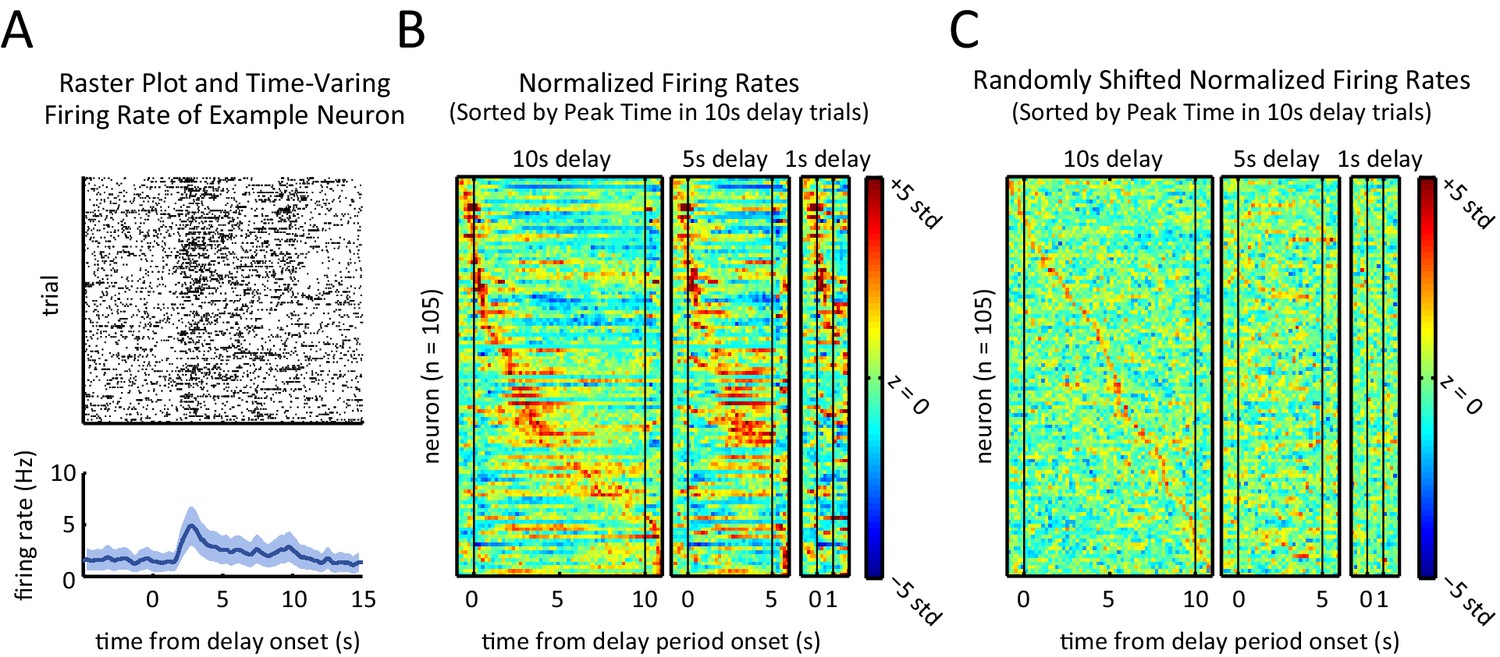
Sequential, transient peaks in the firing rate span the delay period.
(A) Raster plot (top) and firing rate (bottom) for an example neuron (aligned to the onset of the delay period). Shaded area represents ± 1 SEM. (B) Heat-maps represent the z-scored firing rates for all units for the 10 s, 5 s, and 1 s delays, aligned to the onset of the delay period. Each row is a single unit. Rows in all three plots were sorted by the peak firing rate time in the 10 s delay trials (left-most plot). (C) Same as A, but spike times were randomly shifted relative to behavioral timestamps.
Figure 4—figure supplement 1
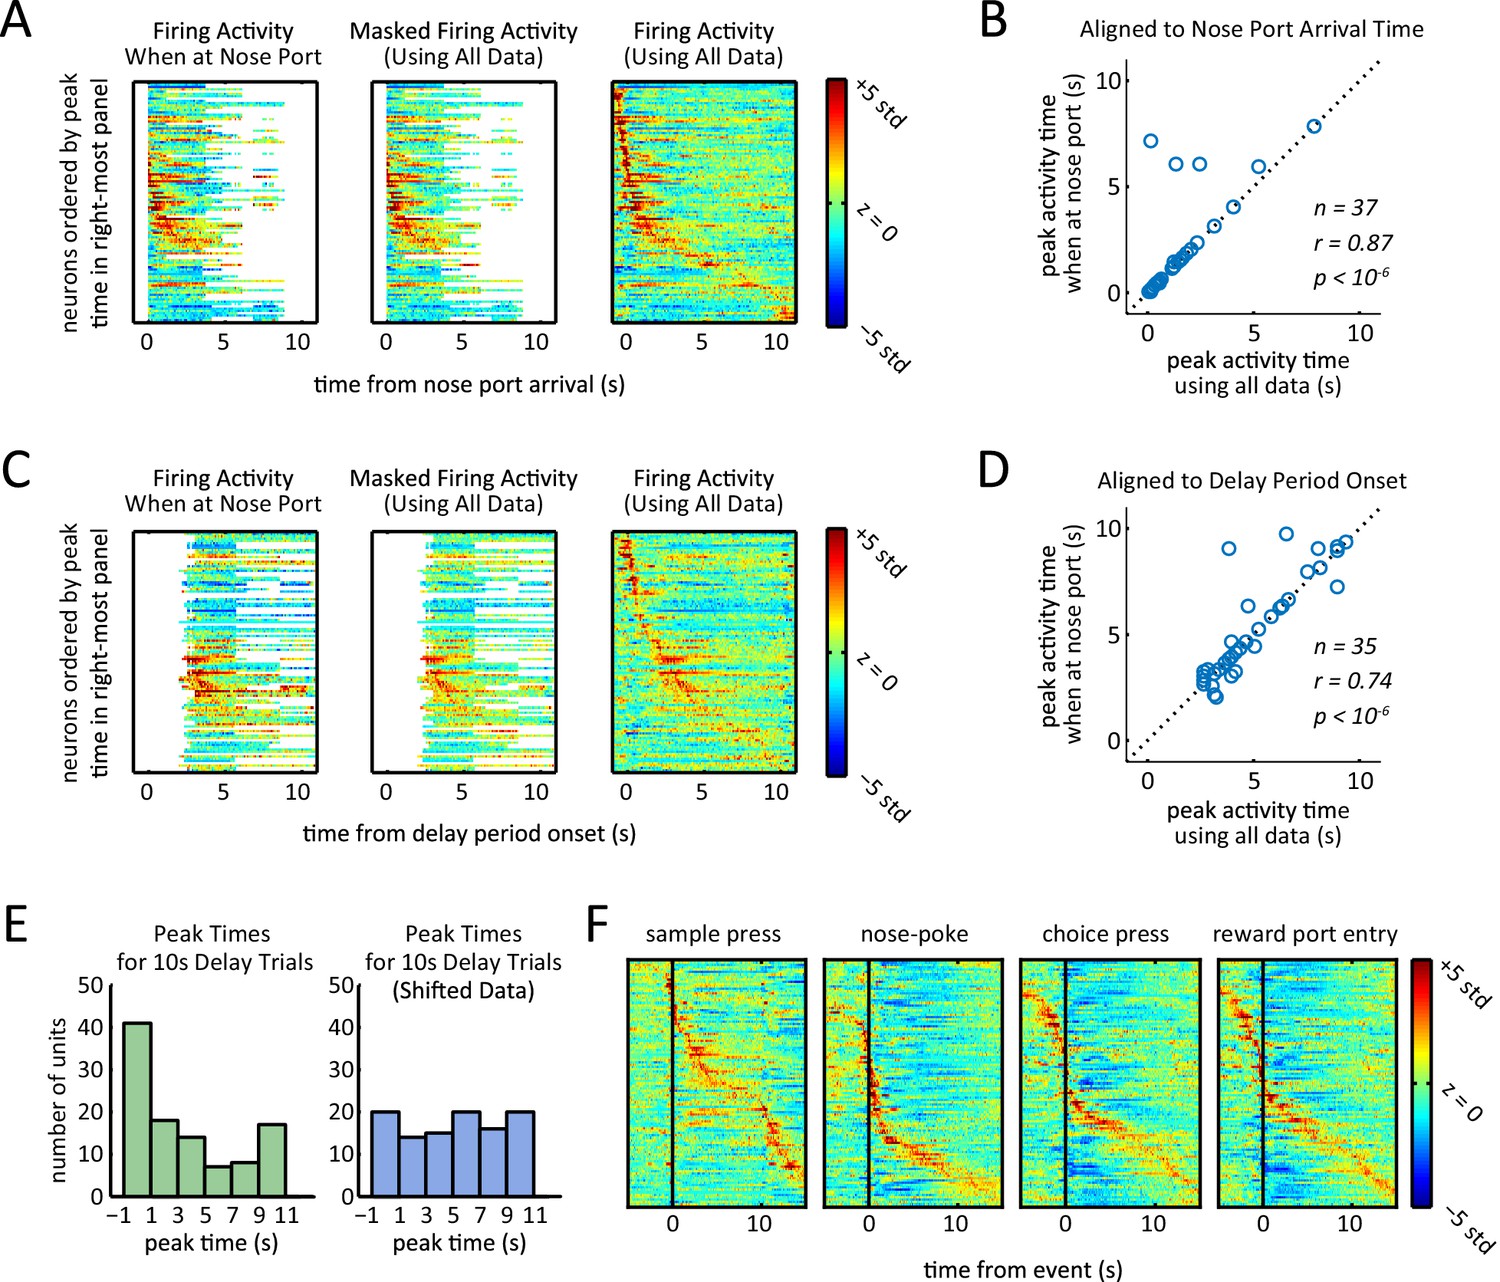
Presence of sequential activity when controlling for position, and when aligning to event markers other than delay period onset.
(A) Z-scored firing rates when aligned to first nose port arrival. Each row corresponds to one neuron. Left-most plot was generated by only using data from times that the rat was at the nose port. White area corresponds to when the rat was not at the nose port for a sufficient amount of time to estimate firing rates (fewer than 25 left trials and 25 right trials). Middle plot was generated using data from all times regardless of the rat position, but time bins were masked to match masking of left plot. Right-most plot was generated using all data without any masking. Rows are ordered based on the time of their peak firing rate in right-most plot. (B) Peak activity time when rat was in the nose port (left plot of panel A) was significantly correlated with peak activity time calculated using all data (middle plot of panel A) (r = 0.87, p<10–6 Pearson correlation test). Neurons that had their peak activity fall in the masked time bins (white area in middle heat-map of panel A) were excluded (n = 37). (C) Same as panel A, but aligned to delay period onset (sample lever press). (D) Same as panel B, but aligned to delay period onset (sample lever press). Peak activity time when rat was in the nose port (left plot of panel B) was significantly correlated with peak activity time calculated using all data (middle plot of panel B) (r = 0.74, p<10–6 Pearson correlation test). Neurons that had their peak activity fall in the masked time bins (white area in middle heat-map of panel A) were excluded (n = 35). (E) Histogram of peak times for 10 s-delay trials for non-shifted data (Figure 3B) and randomly shifted data (Figure 3C). Comparison of histograms reveals the peaks were biased towards the beginning of the delay period (p<0.02; Wilcoxon rank sum test). (F) Normalized firing rates of all neurons triggered to different events of the task. Rows in each plot are sorted by time of peak firing rate. Notice that aligning to sample press time is the same as aligning to delay period onset for all delay period lengths.
Figure 4—figure supplement 2
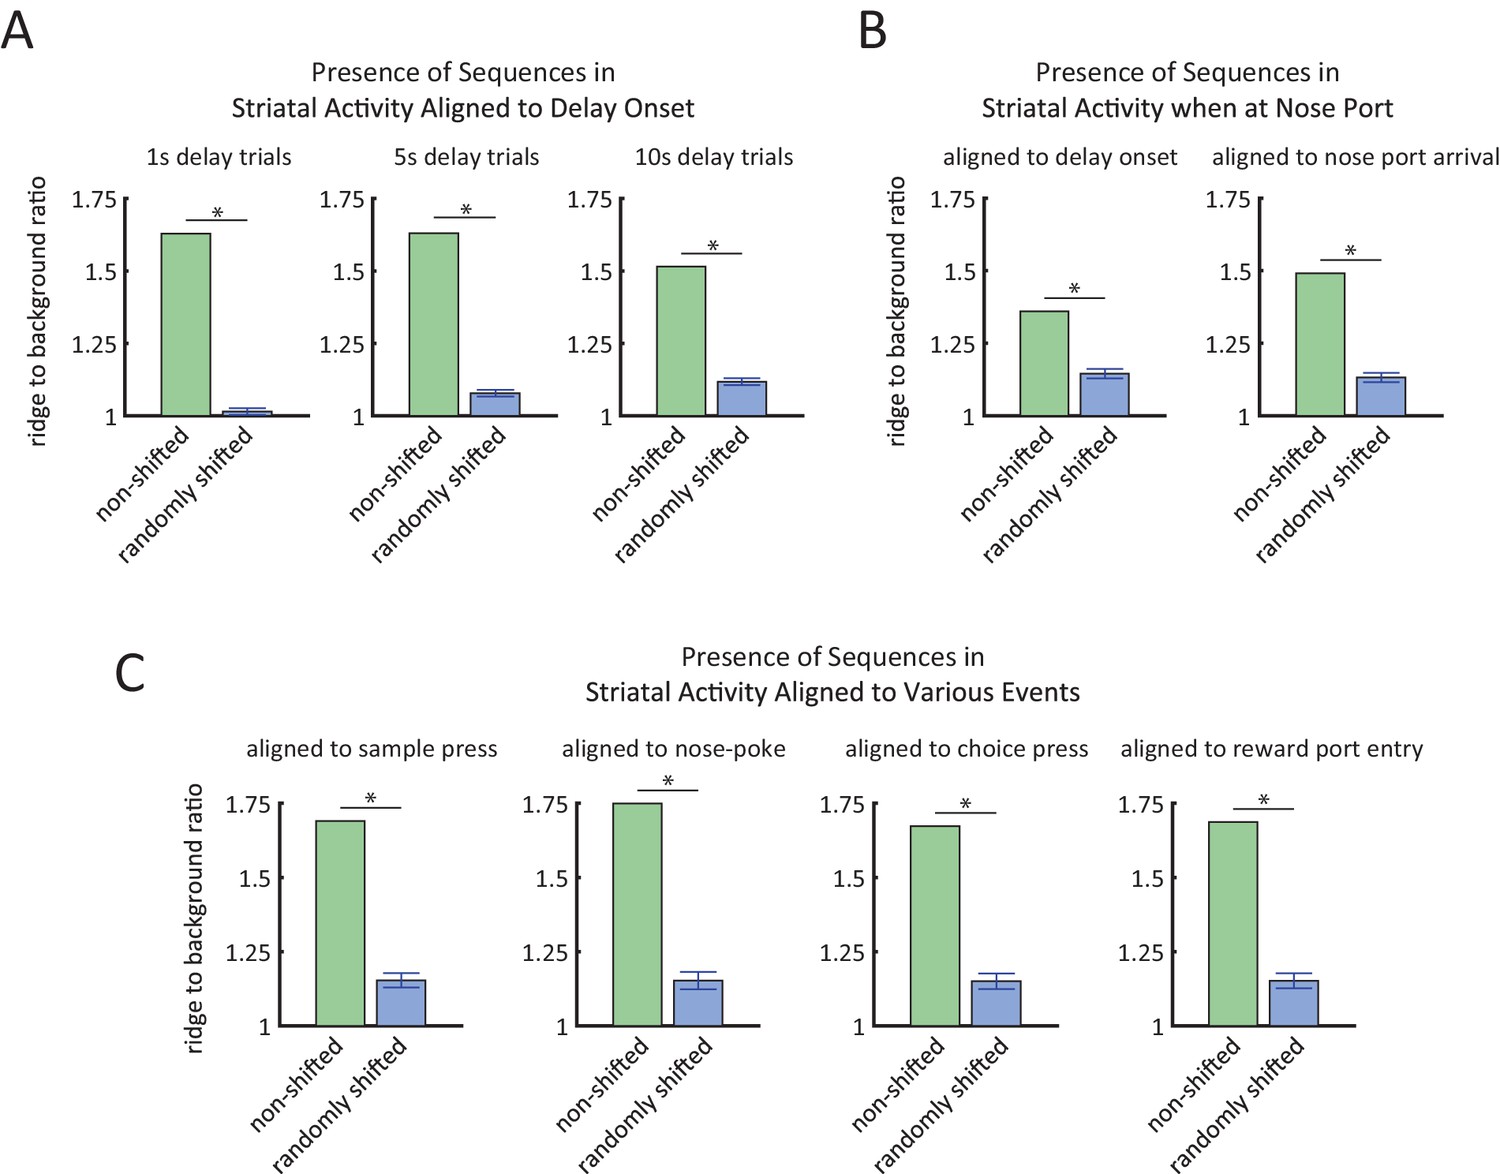
Ridge-to-background analysis to quantify the presence of firing rate sequences.
(A) Ridge-to-background ratios of delay period activity during 1 s delay trials (left), 5 s delay trials (middle), and 10 s delay trials (right). Green bars represent ridge-to-background ratios from the real data and correspond to the three heat-maps in Figure 4B. Blue bars represent the mean ridge-to-background ratio obtained by circularly shifting the spike times by random values 1000 times. For all three delay periods, ridge-to-background ratio was significantly larger than that expected by chance (*p<0.001; one tailed test using the ratios from the randomly shifted data as the null distribution). (B) Ridge-to-background ratios of delay period activity for the time that the rat is at the nose port for 10 s delay trials only, aligned to delay onset (left) and aligned to time when the rat first arrives at nose port (right). Green bars represent ridge-to-background ratios and correspond to the left-most heat-maps in Figure 4—figure supplement 2A. Blue bars represent the mean ridge-to-background ratio obtained by circularly shifting the spike times by random values 1000 times. For both cases, ridge-to-background ratio was significantly larger than that expected by chance (* p<0.001; one tailed test using the ratios from the randomly shifted data as the null distribution). (C) Ridge-to-background ratios of activity aligned to sample lever press, nose-poke, choice lever press, and reward port entry. Green bars represent the ridge-to-background ratios and correspond to the four heat-maps in Figure 4—figure supplement 2F. Blue bars represent the mean ridge-to-background ratio obtained by circularly shifting the spike times by random values 1000 times. For all four cases ridge-to-background ratio was significantly larger than that expected by chance (*p<0.001; one tailed test using the ratios from the randomly shifted data as the null distribution). Ridge-to-background analysis was calculated on a time window spanning 5 s before event to 15 s after event. In all panels, error bars are ± 1 standard deviation.
Figure 5
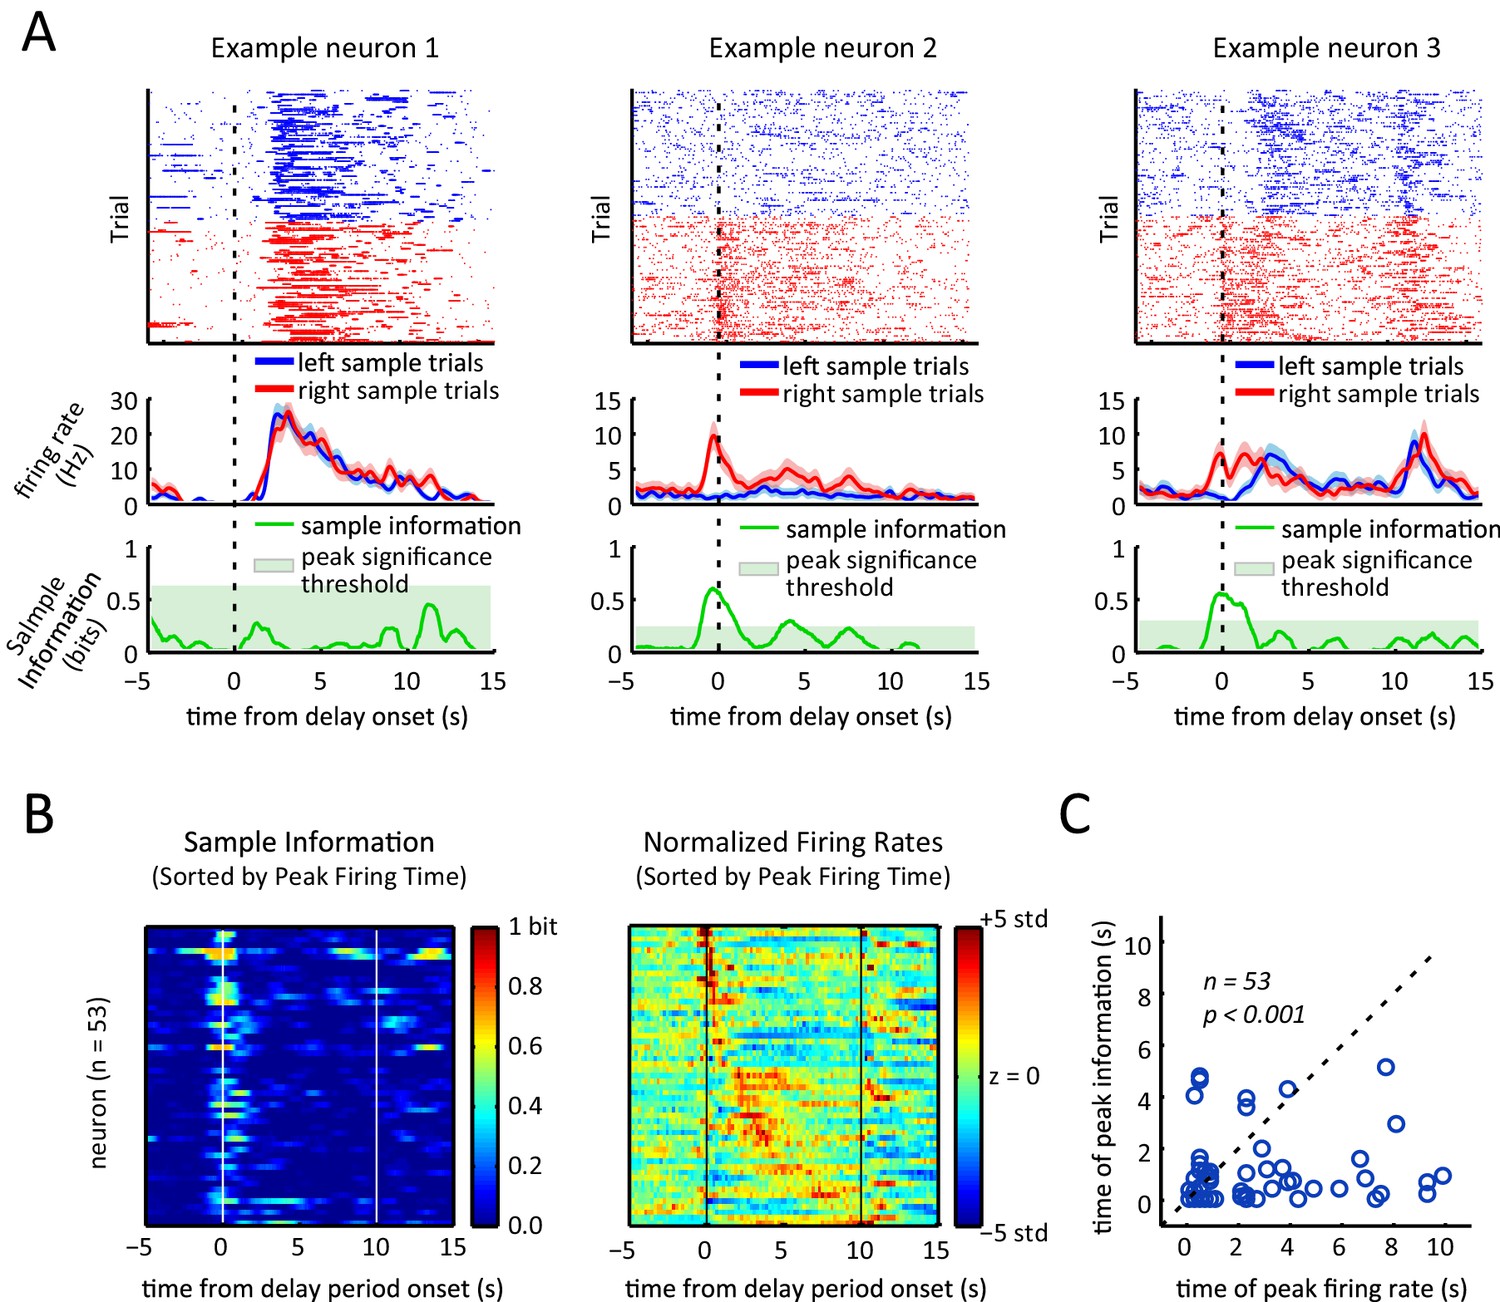
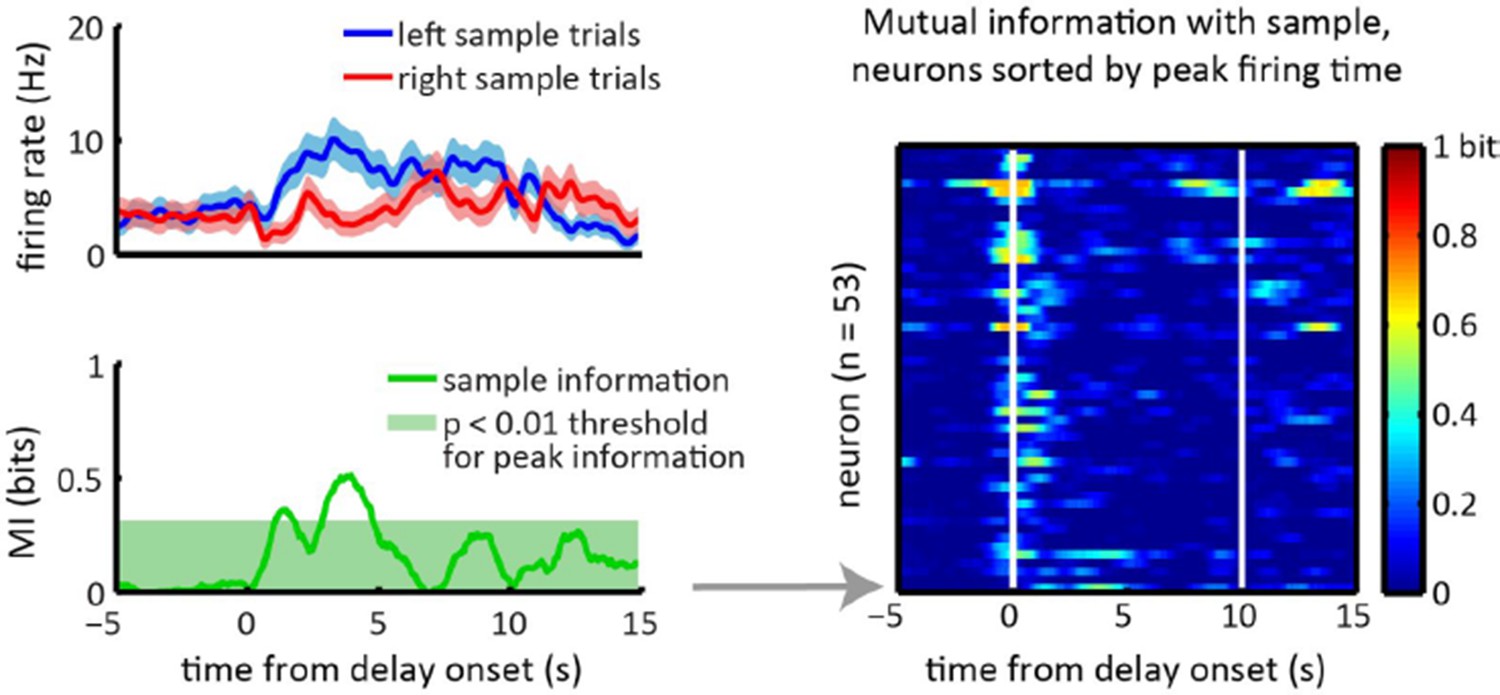
Sample lever information peaks are clustered towards the beginning of the delay period and are not correlated with firing rate peak times.
(A) Each column represents data from an example neuron, with neural activity aligned to the onset of the delay period, and activity color-coded in red for right sample trials and left for blue sample trials. Top: raster plot, with each dot representing a spike. Middle: firing rates for left and right sample trials. Shaded area represents ± 1 SEM. Bottom: Information about sample as a function of time. Shaded area represents the 99th percentile of the maximum information expected by chance across the entire time interval, calculated by shuffling the sample labels for the trials. (B) Left: Heat-map of sample information as a function of time for the 53 neurons that had significant information peaks within the 10 s delay period (p<0.01; one-tailed test using shuffled data for null distribution of peak information within the 10 s delay period). Right: Heat-map showing z-scored firing rates of the same neurons depicted in the left plot. Neurons in both the left and right panels are sorted by the peak firing rate in the delay period, such that a neuron on the left plot appears in the same row in the right plot. (C) Time of peak sample information plotted against the time of peak firing rate for 53 sample encoding neurons (where 0 corresponds to the onset of the delay period). The data reveals sample information peaks times occur earlier than firing rate peak times (p<0.001; Wilcoxon signed rank test), and a lack of correlation between the time of peak firing rate and time of peak sample information (r=0.06, p=0.69; Pearson correlation test). All panels are calculated using 10 s-delay correct trials only.
Figure 6 with 1 supplement
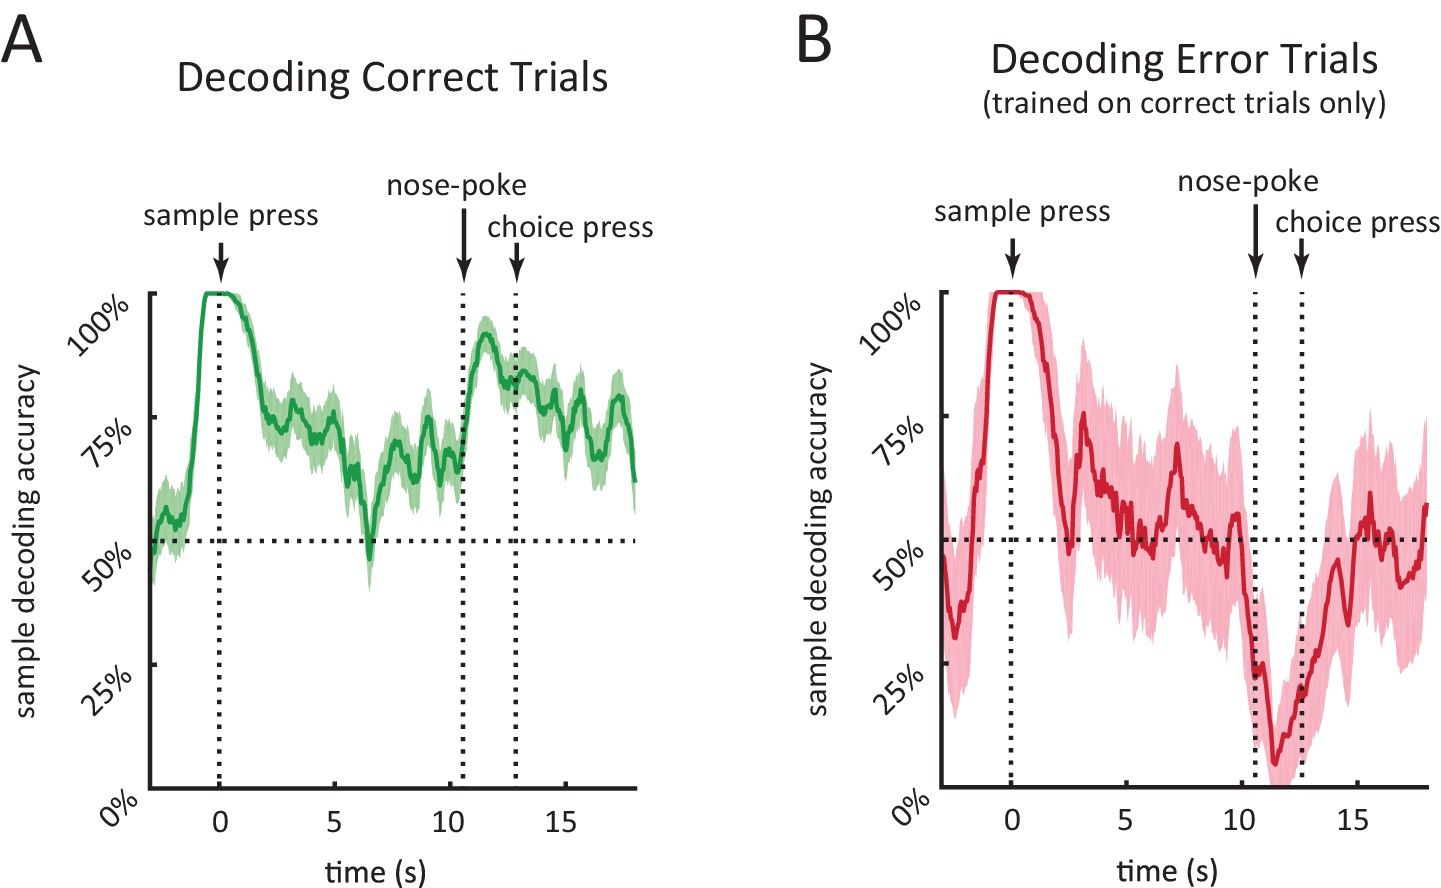
Performance of population decoder for sample lever identity.
(A) Accuracy of decoding sample lever from population spiking data within a 0.5 s-wide sliding window in 10 s-delay correct trials. Decoder was trained on 10 s-delay correct trials and evaluated using leave-one-out cross validation. (B) Same as A but decoding 10 s-delay error trials. Decoder was trained on all 10 s-delay correct trials. In both panels, the dotted lines marked with'nose-poke' marks the median time of nose-poke, and the dotted line marked as 'choice press' marks the median time of choice press. Shaded area represents ± 1 SEM.
Figure 6—figure supplement 1
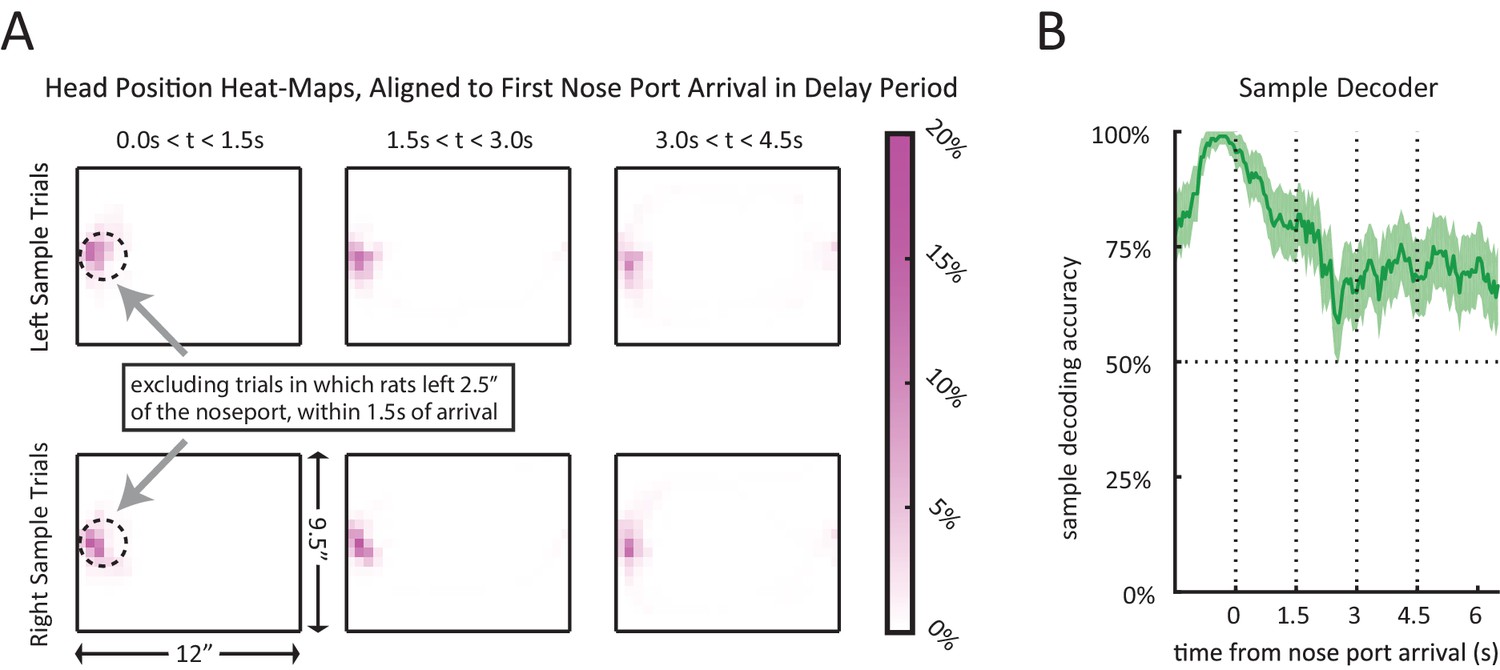
Encoding of sample lever when controling for head position.
(A) Average occupancy-maps for head position, aligned to initial nose port arrival time, showing occupancy during consecutive 1.5 s long time windows (left to right). Top plots show occupancy-maps for left trials, and bottom plots show occupancy-maps for right trials. Occupancy-maps were generated by averaging the occupancy-maps of the 9 rats. Individual occupancy-maps were calculated by binning the head positions over the respective time windows into 0.5”×0.5” tiles (covering the 9.5”×12” chamber). (B) Sample decoding accuracy when aligned to nose port arrival. Only 10 s-delay correct trials were included. Trials which the rat left the nose port within 1.5 s of arrival were excluded from the analysis.
Figure 7

Context-dependent neural encoding of the lever press.
(A) Left plots show similarity of head position during left lever press for sample lever press (top) and choice lever press (bottom). Right plots are same as left plots except for right lever press. Average head position occupancy-maps from 250 ms before to 250 ms after the lever press. Occupancy-maps were generated by averaging individual occupancy-maps of all 9 rats (0.5”×0.5” tiles covering the 9.5”×12” chamber). (B) Firing rates of an example neuron during sample lever press and choice lever press. This neuron displays an obvious difference in its encoding of lever side between the sample and choice presses. (C) Neurons differentiate between sample and choice presses in the amount of information conveyed about the lever identity. Each neuron’s information about lever side was calculated by taking the mutual information between lever identity and spiking patterns within a 500 ms time window centered at the lever press (to match time window used in panel A). Orange circles represent sample lever information plotted against choice lever information. Green circles are obtained by recalculating the information after shuffling sample and choice labels for lever presses. Insets are histograms of choice information minus sample information for non-shuffled data (orange) and shuffled data (green). Neurons showed significantly greater difference between sample and choice information than expected by chance (p<10–6; two sample F-test for equality of variance for (sample information – choice information) in shuffled versus non-shuffled data).
Author response image 1
Download links
A two-part list of links to download the article, or parts of the article, in various formats.
Downloads (link to download the article as PDF)
Open citations (links to open the citations from this article in various online reference manager services)
Cite this article (links to download the citations from this article in formats compatible with various reference manager tools)
Dissociated sequential activity and stimulus encoding in the dorsomedial striatum during spatial working memory
eLife 5:e19507.
https://doi.org/10.7554/eLife.19507


