Germinal center B cell development has distinctly regulated stages completed by disengagement from T cell help
- Yale University School of Medicine, United States
- Yale School of Medicine, United States
- Western University, Canada
- Third Military Medical University, China
- Nanjing Normal University, China
- Okayama University, Japan
Figures
Figure 1 with 3 supplements
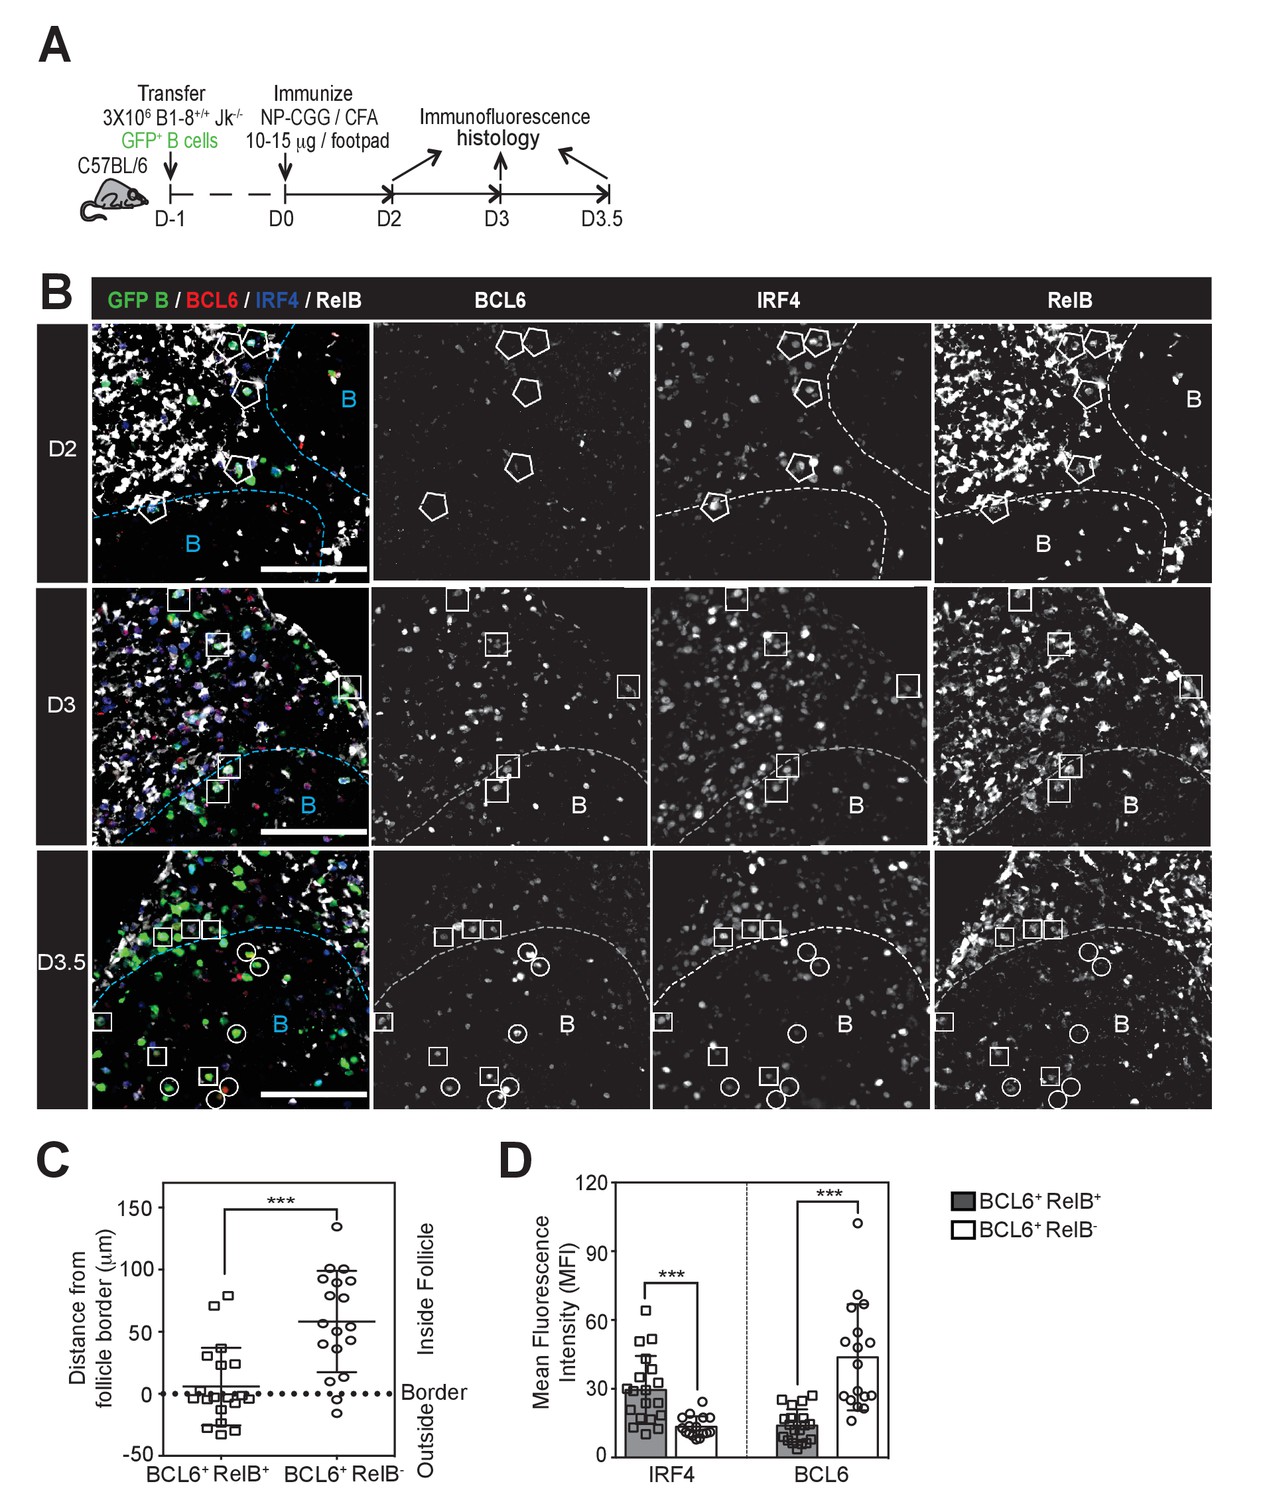
GC precursors co-express counter-regulatory factors BCL6, RelB and IRF4.
(A) Diagram of the experimental protocol. The GFP+ NP-specific B cells were transferred into non-responding C57BL recipients, which were subsequently immunized by footpad with NP-CGG in CFA. Popliteal draining LNs were harvested and processed by day 2, 3 or 3.5 post-immunization for immunofluorescence histology. Sections were stained for BCL6, RelB and IRF4 as well as GFP to identify Ag-specific B cells. (B) Representative overlaid images (GFP+ B: green, BCL6: red, IRF4: blue, RelB: grey) and single channel grey images for each time point are shown.B cell follicle borders were drawn based on RelB staining. Polygons indicate GFP+ cells negative of BCL6 but positive of IRF4 and RelB; rectangles for GFP+ cells positive of BCL6, IRF4 and RelB; circles for GFP+ B cells positive of BCL6 but negative of IRF4 and RelB. Scale bars represent 100 µm. (C–D) The day 3.5 images acquired from three individual LNs were further analyzed by Imaris for distance replacement from follicle borders (C) and the Mean Fluorescence Intensity (MFI) of interested cells (D). Each square (n = 21) or circle (n = 16) represents the individual cell analyzed, ***p<0.001 (unpaired t-test).
Figure 1—figure supplement 1
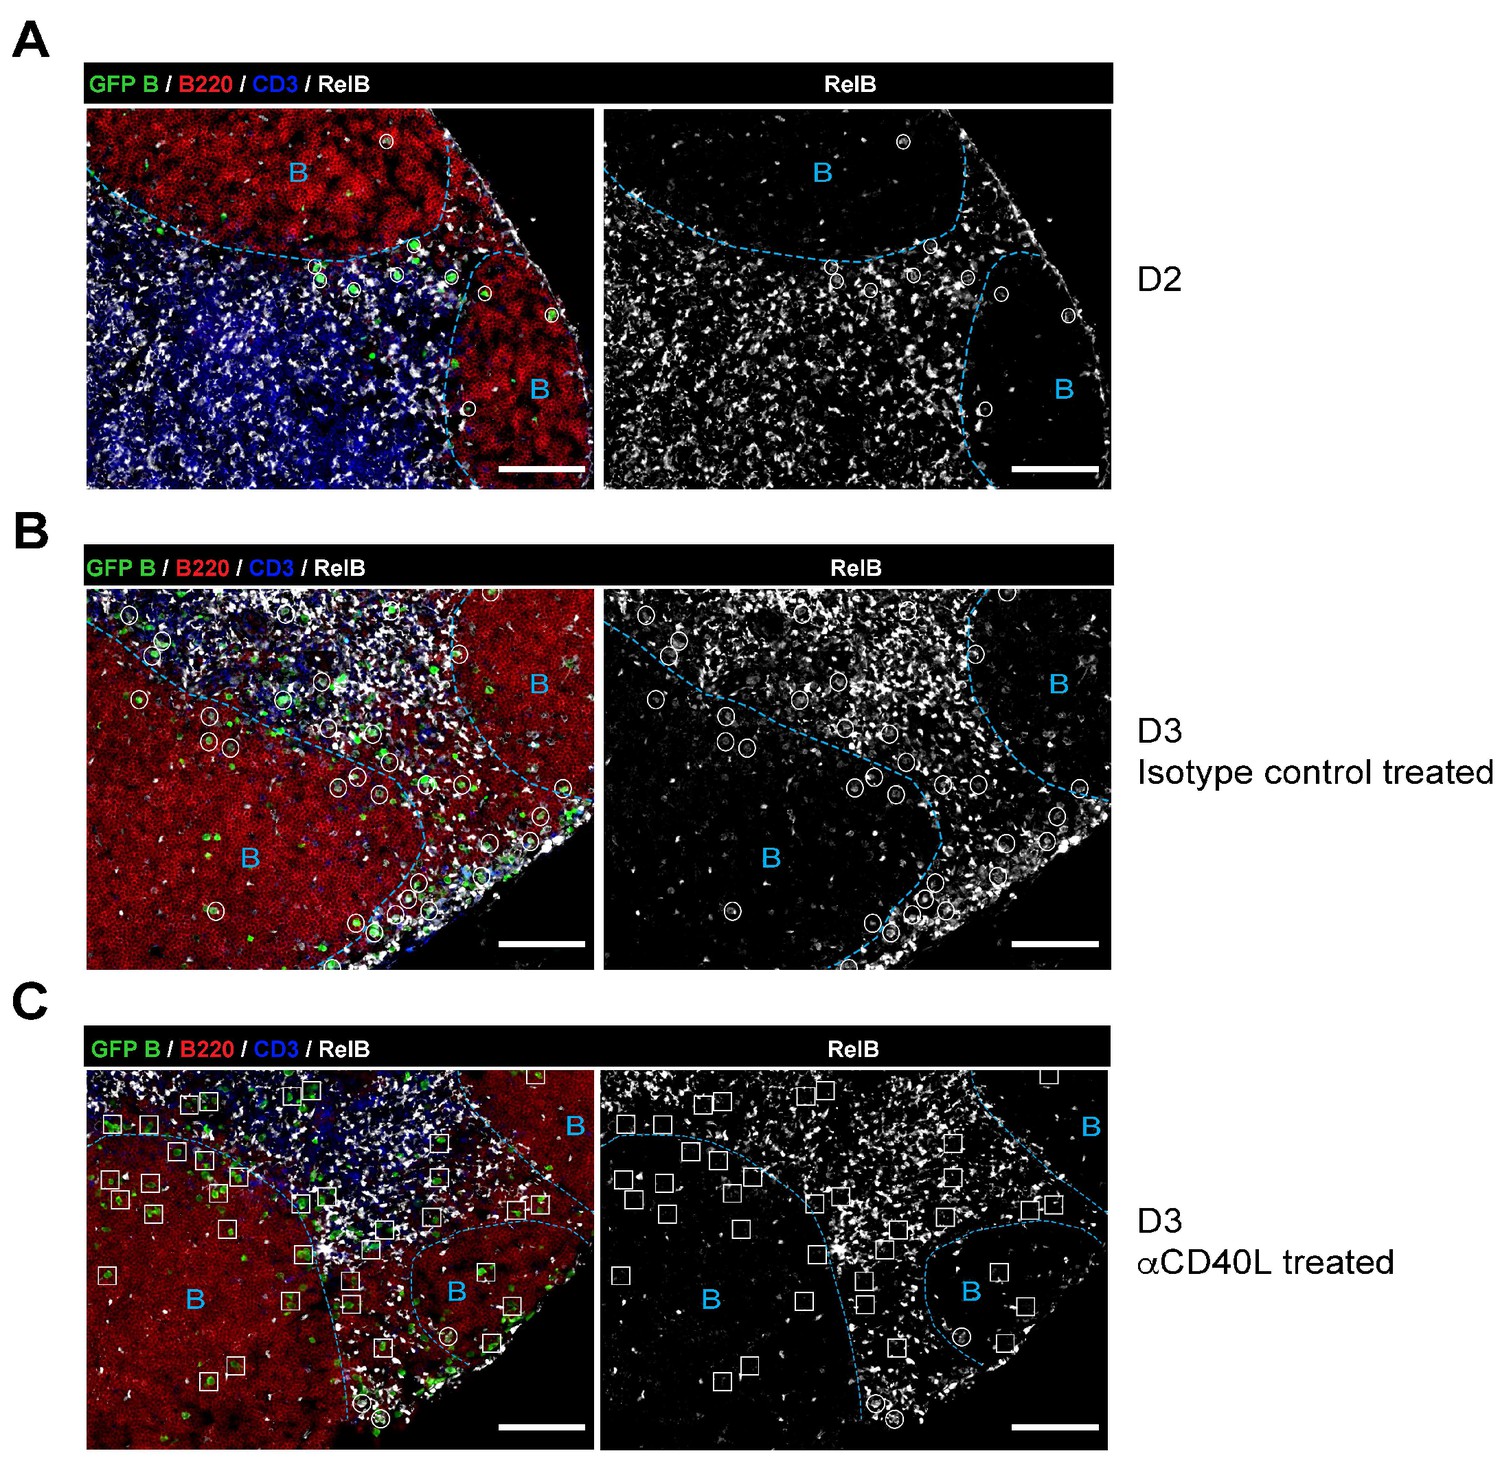
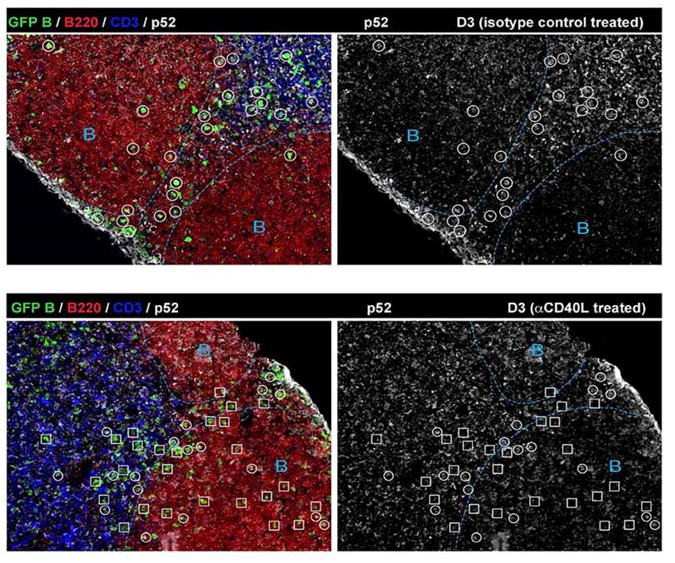
RelB is selectively expressed in Ag-specific responding B cells in a CD40-dependent manner during early immune responses.
GFP+ NP-specific B cells were transferred into WT C57BL recipients, followed by footpad immunization of NP-CGG in CFA. Shown are representative immunofluorescence histology of LN sections (n = 3 mice per group) stained for RelB, B220, CD3 and GFP. B cell follicle outlines are based on B220 and RelB staining. (A) IF histology of LNs obtained 2 days after NP-CGG immunization. (B–C) Some mice recieved either 30 μg hamster Ig isotype control or blocking anti-CD40L injected locally 1 day p.i. Shown is IF histology of LNs obtained two days after treatment (d3 after immunization). Scale bars represent 100 µM.
Figure 1—figure supplement 2
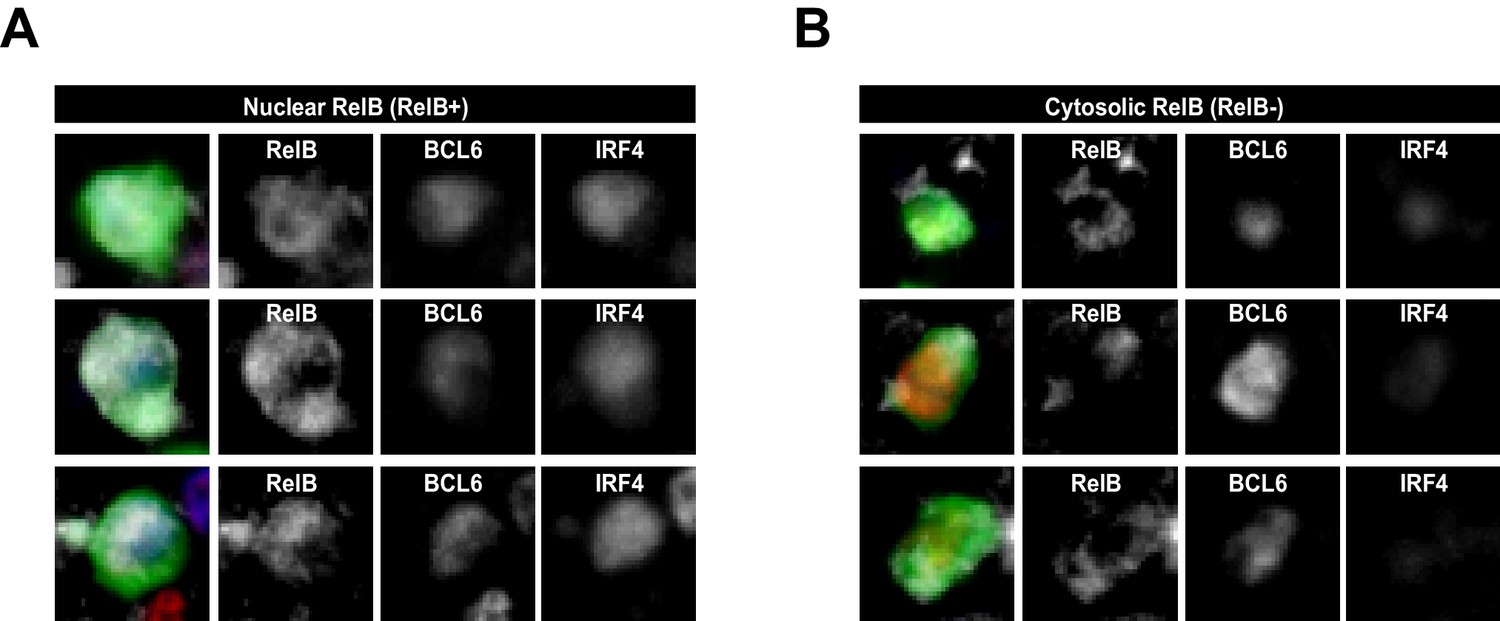
RelB+ cells are identified as having nuclear but not cytosolic distribution of RelB.
RelB+ cells identified and summarized in Figure 1 (B) (C) and (D) show intracellular staining of RelB, which co-localizes mostly with nuclear BCL6 and IRF4. (A) Representaive intracellular RelB expression in magnified GFP+ Ag-specific B cells. (B) GFP+ cells identified as RelB- evidenced a predominantly cytosolic RelB distribution that lacked colocalization with nuclear BCL6 and IRF4.
Figure 1—figure supplement 3
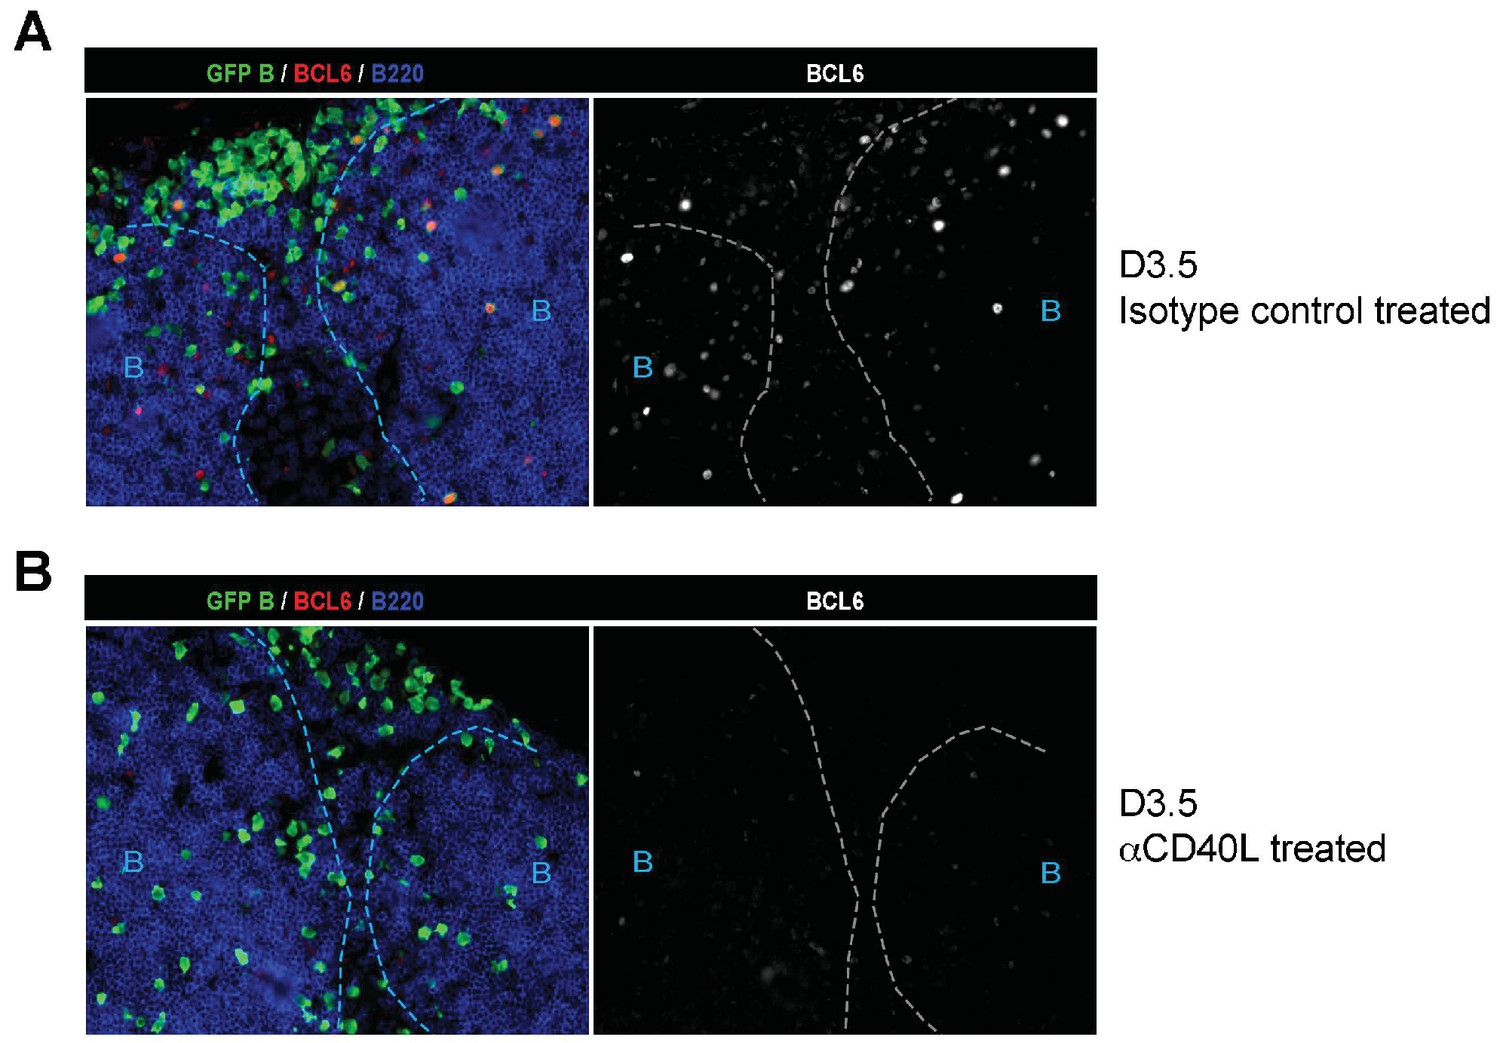
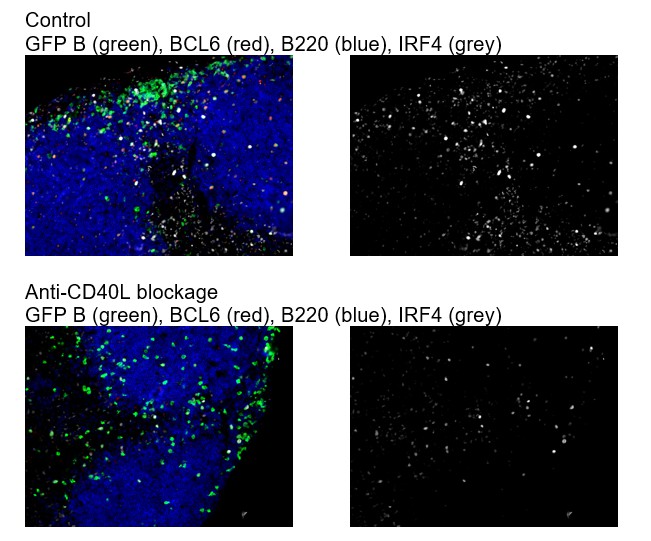
Absence of BCL6 staining in Ag-specific B cells of mice treated with anti-CD40L.
GFP+ NP-specific B cells were transferred into WT C57BL recipients, followed by footpad immunization of NP-CGG in CFA. Mice recieved either 30 μg hamster Ig isotype control or blocking anti-CD40L injected locally 1 day p.i. (A) and (B) Shown are representative immunofluorescence histology of LN sections (n = 3 mice per group) stained for GFP, BCL6 and B220. B cell follicle outlines are based on B220 staining.
Figure 2
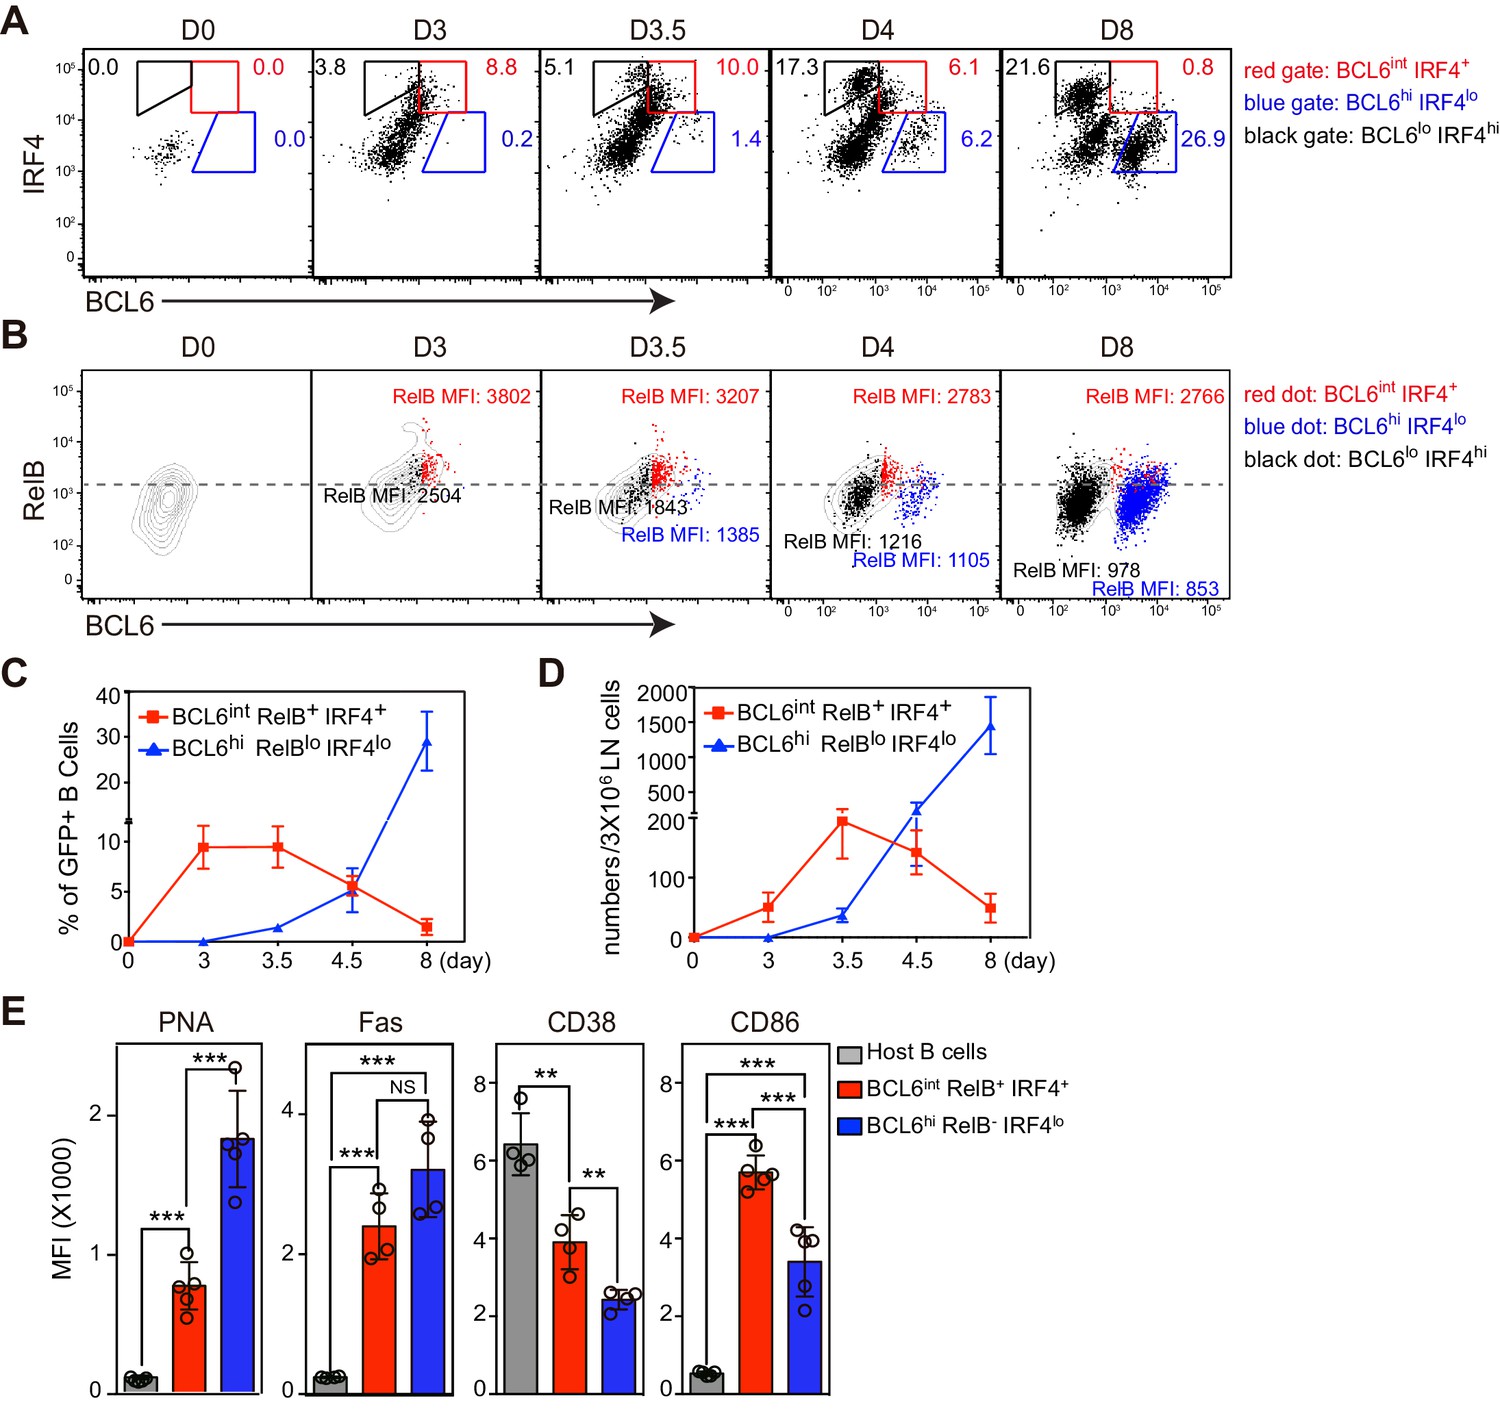
BCL6int RelB+ IRF4+ Ag-specific B cells emerge early during immune responses and have partial GC phenotypes.
(A–E) Flow cytometric analysis of draining LN Ag-specific B cells. GFP+ NP-specific B cells were transferred into C57BL/6 recipients, which were subsequently immunized by footpad with NP-CGG in CFA. Popliteal draining LNs were harvested and stained 0, 3, 3.5, 4.5 and 8 days p.i. Data are representative of three independent experiments. (A) Expression of BCL6 and IRF4 in transferred NP-specific B cells from each time point. BCL6int IRF4+, BCL6hi IRF4lo and BCL6lo IRF4hi cells were gated as indicated. (B) Representative contour plots of RelB and BCL6 expression. Gated BCL6int IRF4+ (red dots), BCL6hi IRF4lo (blue dots) and BCL6lo IRF4hi (black dots) cells were backgated and overlaid onto total NP-specific B cell contours. The MFI of RelB in each population was indicated with representative color. (C–D) Shown are average percentage ± SEM of BCL6int RelB+ IRF4+ cells and BCL6hi RelB- IRF4lo cells among transferred B cells (C) and their average numbers ± SEM per 3 × 10⁶ LN cells (D) (n = 4 at each time point from one experiment). (E) Bar graphs show the average MFI ±SEM of PNA, Fas, CD38, CD86 and CD23 in indicated cell subsets 3.5 days after NP-CGG immunization. NS no significant difference, **p<0.01, ***p<0.001 are compared as indicated (one-way ANOVA).
Figure 3

Multiple activated B cell subsets have elevated Fas and PNA-binding levels, including BCL6int IRF4+ cells.
GFP+ NP-specific B cells were transferred into C57BL/6 recipients, followed by f.p. immunization of NP-CGG in CFA. Popliteal draining LNs were stained for flow cytometric analysis. (A–B) Representative histograms of Fas experssion and PNA-binding by transfered B cells (total or indicated subsets) and control populations (host non-responding B cells) in draining LNs.
Figure 4 with 2 supplements
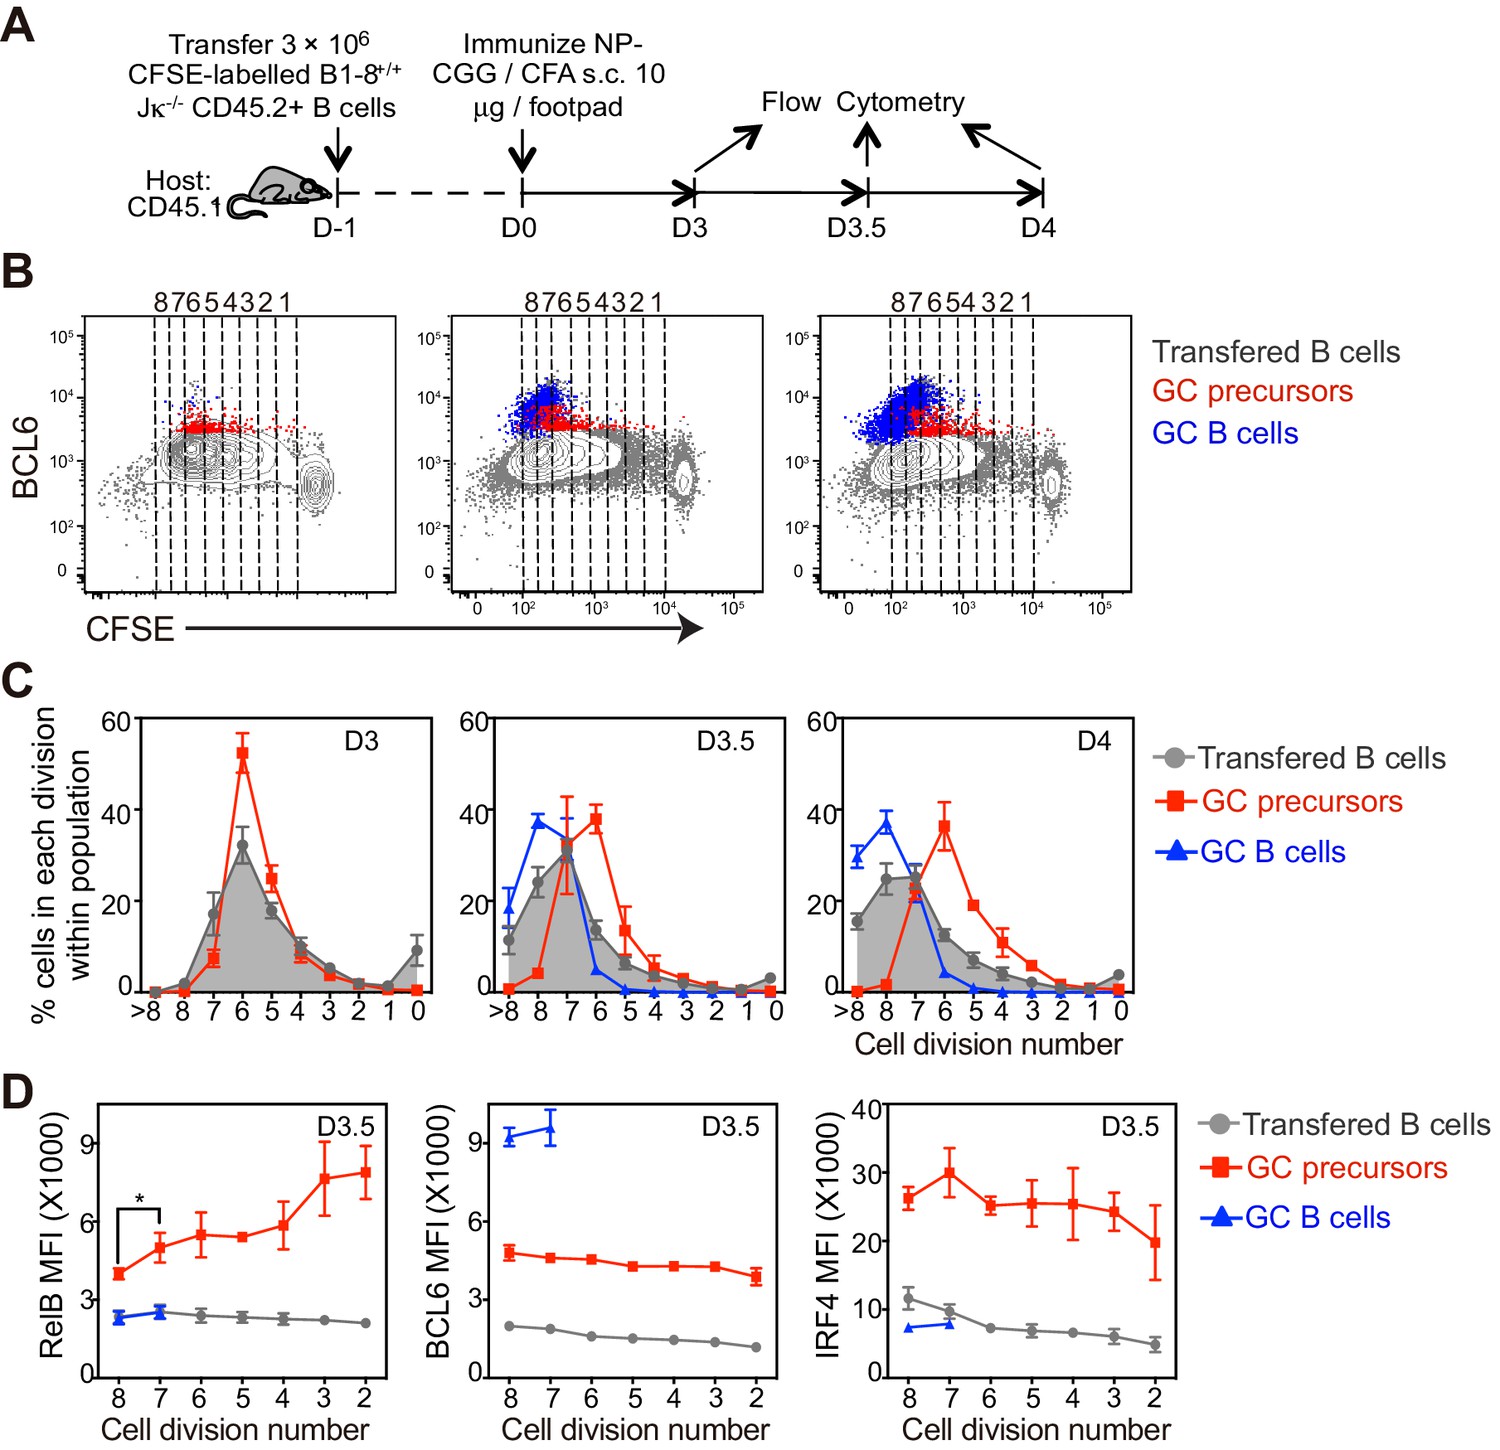
The coordinated transition of GC precursor to BCL6hi GC B cells is associated with cell division.
(A) Diagram of the experimental protocol. CFSE-labeled NP-specific B cells were transferred into CD45.1+ congenic recipients, followed by f.p. immunization with NP-CGG in CFA. Popliteal draining LNs were harvested and stained for flow cytometry analysis 3, 3.5 and 4 days p.i. (B) Representative dot plots of three independent experiments show BCL6 expression relative to CFSE dilution in total transferred B cells (grey dots), GC precursors (red dots) and GC B cells (blue dots). Cell divisions (lines and numbers) up to 8 were assigned based on CFSE serial dilutions of total transferred B cells. (C) Graphed average percentage ± SEM of cells at each number of division within population (n = 4 from per experiment). (D) By day 3.5 p.i., indicated cell subsets were further analyzed for the average MFI ±SEM of BCL6, RelB and IRF4, plotted as a function of cell division. *p<0.05 (repeated measures ANOVA).
Figure 4—figure supplement 1
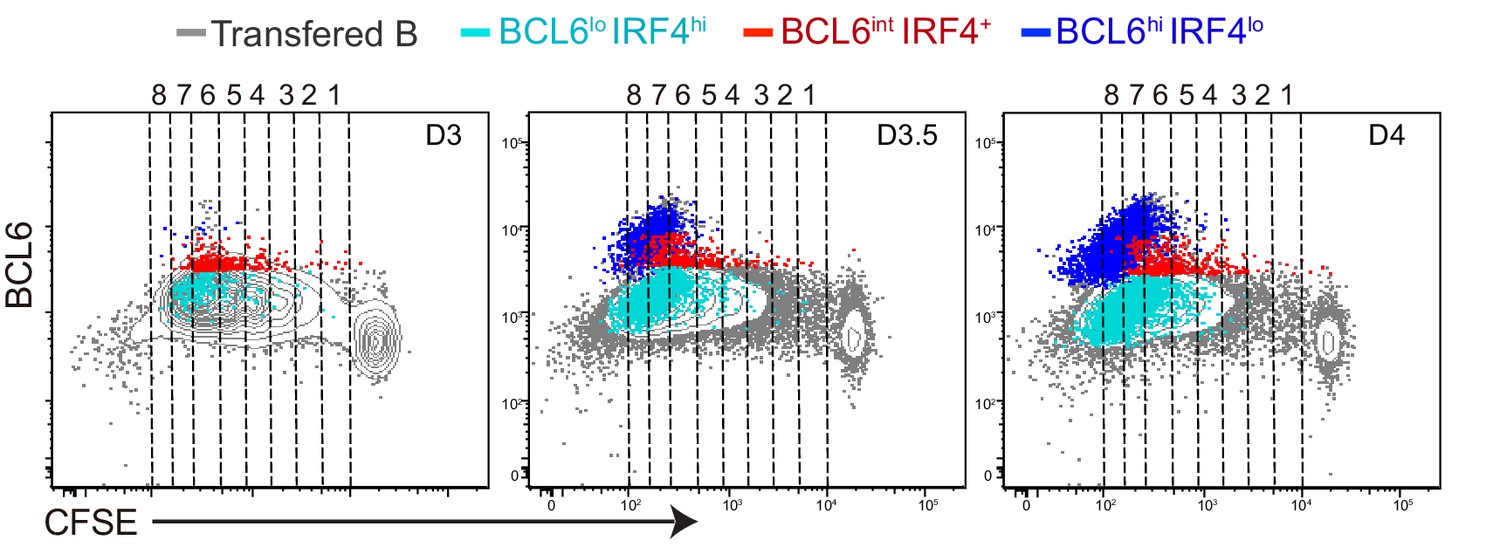
BCL6lo IRF4hi antigen-specific B cell emerge and expand through cell divisions with kinetics that differ from GC precursors or GC B cells.
Shown are representative plots of BCL6 expression relative to CFSE dilution. BCL6lo IRF4+ cells (light blue dots), GC precursors (red dots) and GC B cells (blue dots) are overlaid onto total transferred B cells (grey contour).
Figure 4—figure supplement 2
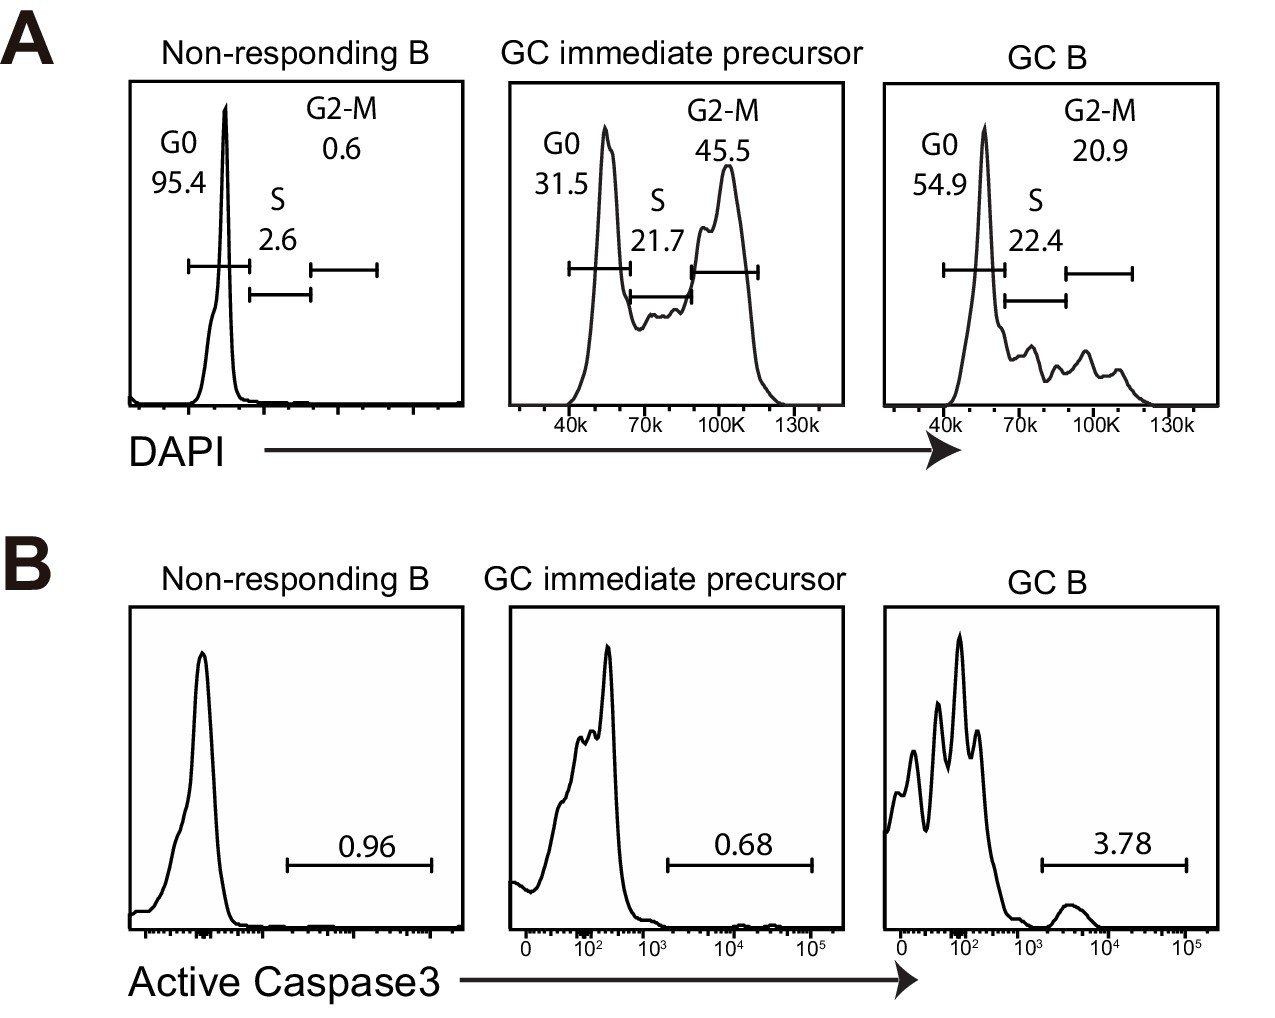
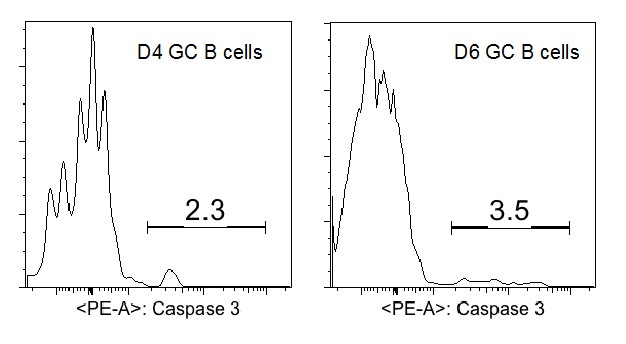
GC precursors are in active cell cycle and not apoptotic.
(A–B) Flow cytometric analysis for cell cycle and apoptosis. NP-specific B cells were transferred into C57BL/6 recipients, followed by f.p. immunization of NP-CGG in CFA. 3.5 days p.i, popliteal draining LNs were stained for DNA content by DAPI, or actived caspase 3 to identify apoptotic cells. (A) Cell-cycle phases defined by DNA content of indicated cells gated on live Ag-specific B cell. (B) Shown are representative histograms of actived caspase 3 levels in the indicated cell populations of Ag-specific B cells.
Figure 5
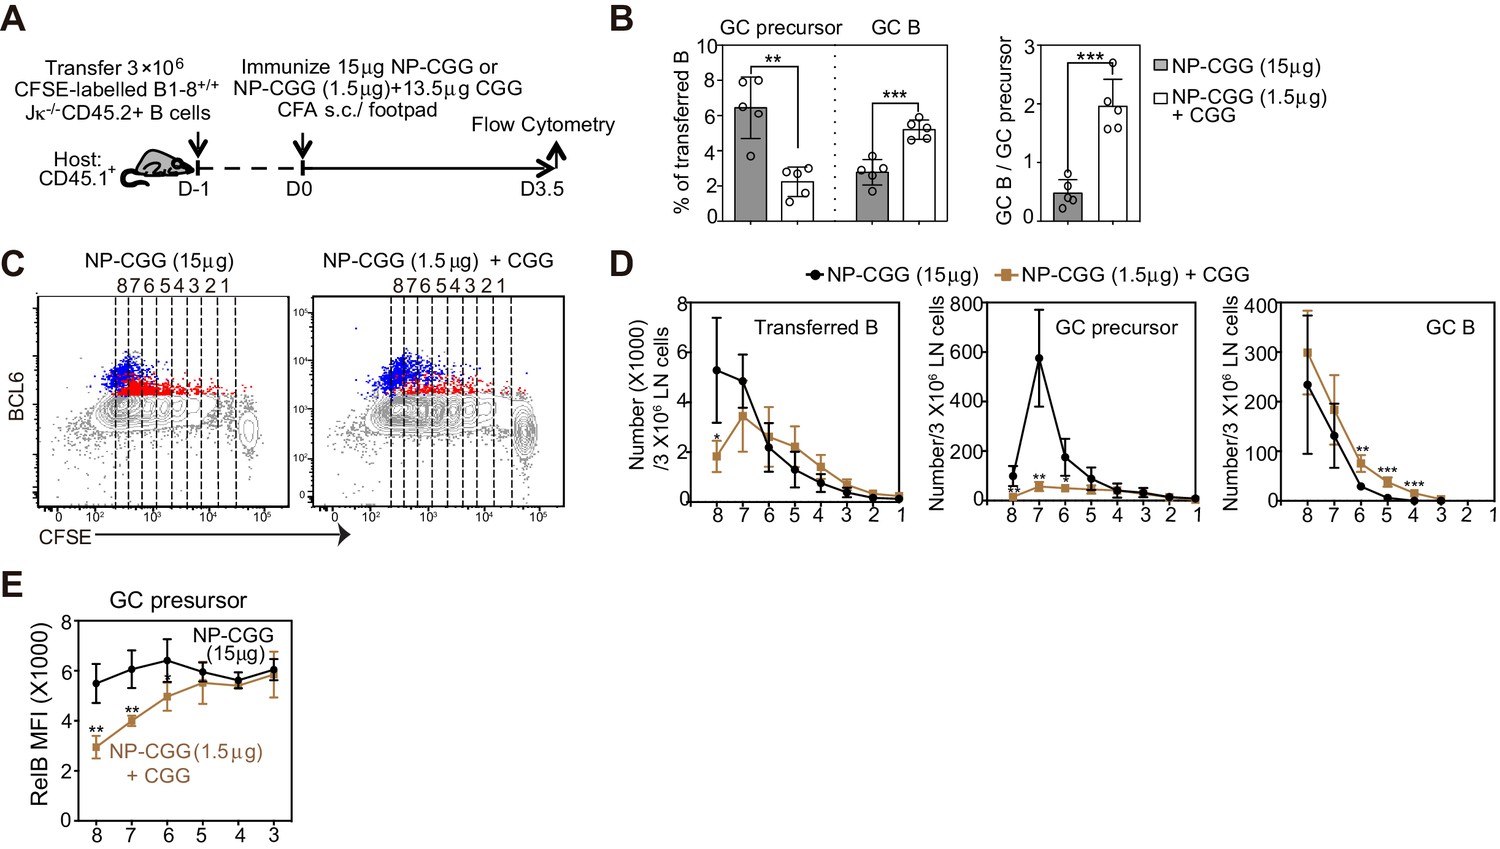
A smaller immunogen dose promotes the transition of precursors to GC B cells.
(A) Diagram of the experimental protocol. CFSE-labeled NP-specific B cells were transferred into CD45.1+ congenic recipients, followed by f.p. immunization of NP-CGG of various doses (either 1.5 μg NP-CGG +13.5 μg CGG or 15 μg NP-CGG) in CFA. Popliteal draining LNs were harvested and stained for flow cytometric analysis 3.5 days p.i.. (B) Percentage of GC precursors or GC B cells among transferred B cells (left panel), and the ratio of GC B cells to GC precursors (right panel). (C) Representative dot plots of BCL6 expression of transferred B (grey), GC precursors (red) and GC B cells (blue) relative to CFSE dilution. Cell divisions (lines and numbers) up to eight were assigned based on CFSE serial dilutions of transferred B cells. (D) Number of CD45.2+ B cells, GC precursors or GC B cells at each division per 3 × 10⁶ LN cells. (E) Average MFI ±SEM of RelB in GC precursors at each division. Data are representative of 2 independent experiments with n = 5 in each group. *p<0.05, **p<0.01, ***p<0.001 (unpaired t-test (a) or multiple t-test (d,e)) compared as indicated or between different dosage groups at respective cell division number.
Figure 6
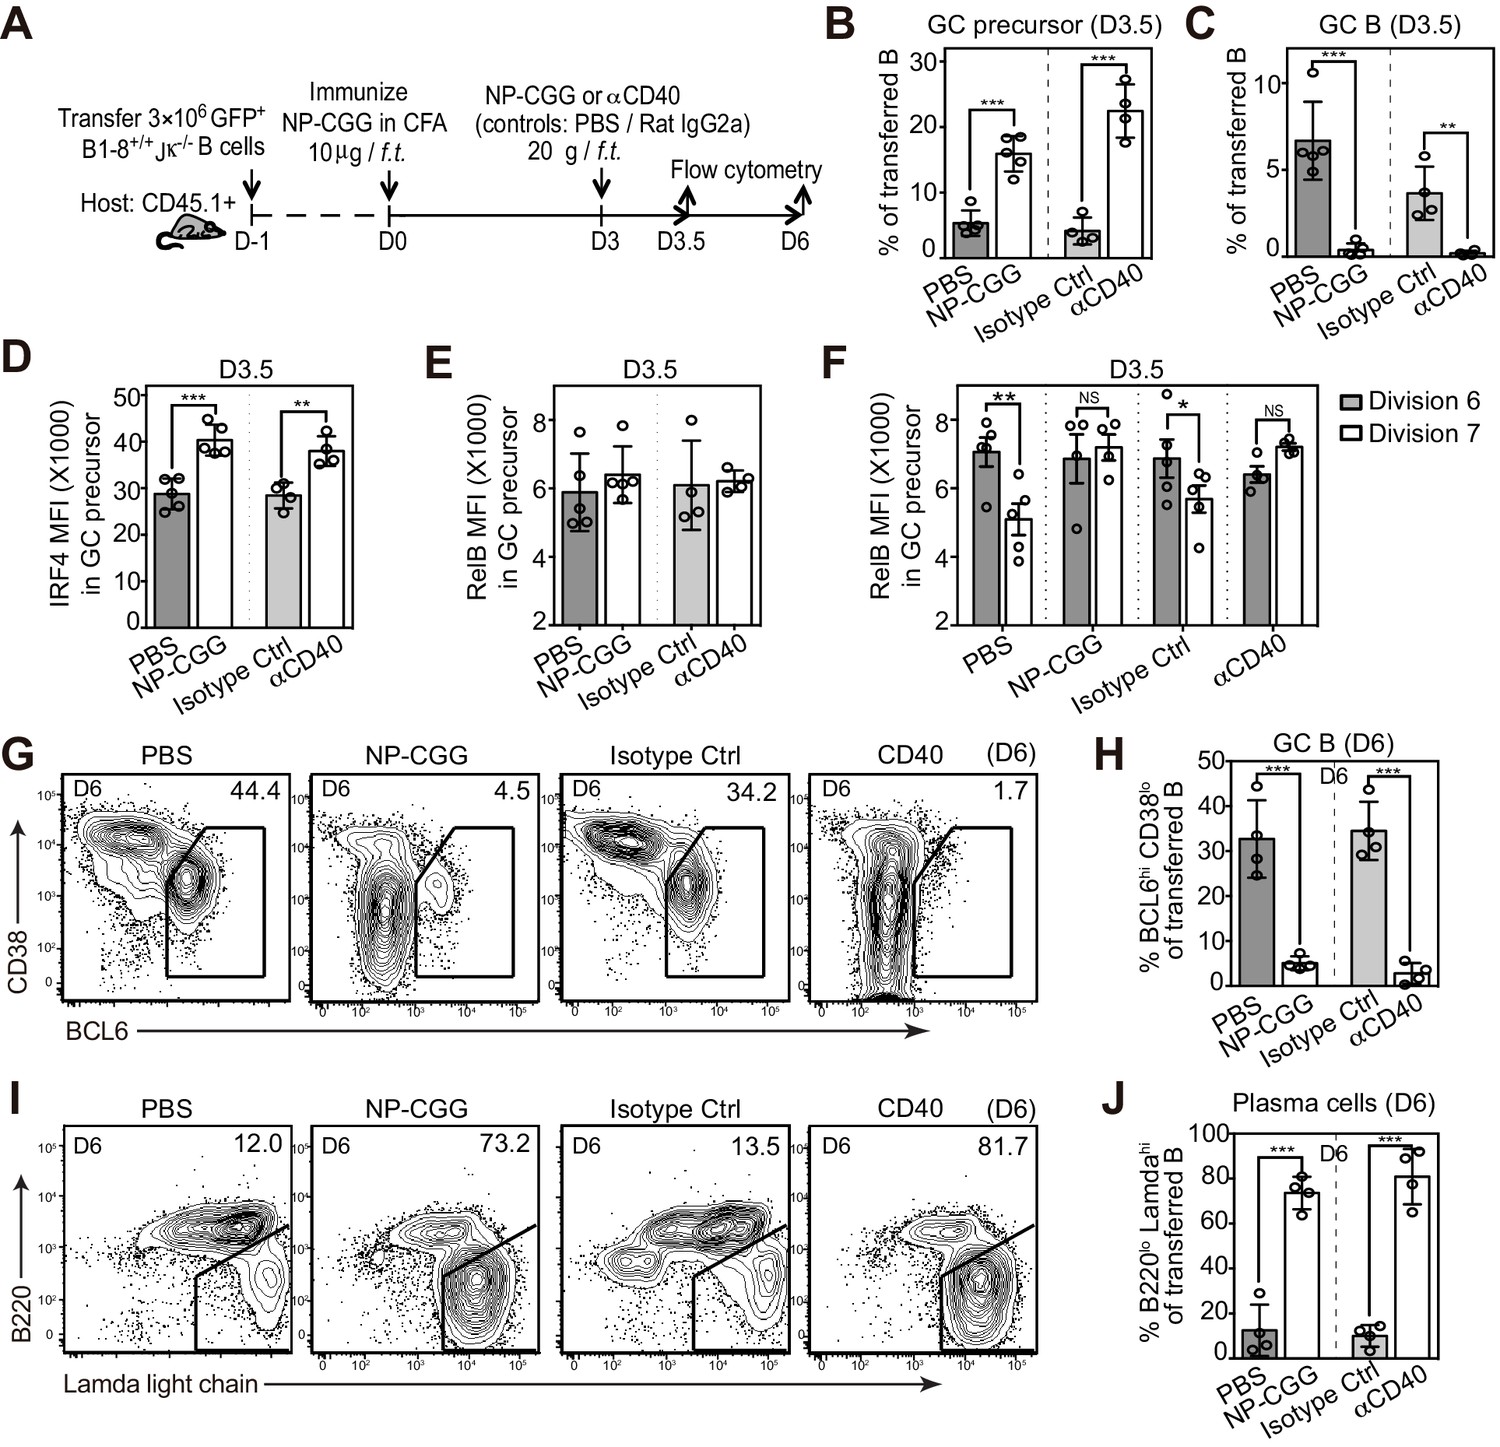
Potentiating T cell help at the initiation stage discourages the transition of GC precursors to GC B cells, and diverts their fate towards plasma cells.
(A) Diagram of the experimental protocol. 3 days after the initial immunization, recipient mice received an additional injection of either soluble NP-CGG, agonistic anti-CD40 (clone: FGK), PBS or isotype control (Ctrl). Draining LN cells were harvested and stained for flow cytometric analysis by 3.5 and 6 days p.i. (B–F) Percent GC precursors and GC B cells among transferred B cells 3.5 days p.i. (B and C); The average MFI ±SEM of IRF4 and RelB in GC precursors (D and E); and the average MFI of RelB expression in GC precursors at division 6 and 7 defined by CFSE serial dilutions of the transferred B cells (F). (G–J) Representative contour plots and bar graph showing the expression of BCL6 and CD38 (G) and percentage of GC B cells (BCL6hi CD38lo) among transferred B cells 6 days p.i. (H); the expression of Ig Lamda light chain and B220 (I) and percentage of plasma cells (Lamdahi B220lo) (J). Data are representative of at least two independent experiments with n = 4–5 in each group. NS no significant, *p<0.05, **p<0.01, ***p<0.001 (unpaired t-test (b,c,d,e,h.j) or paired t-test (f)).
Figure 7 with 1 supplement

Disruption of T/B interaction differentially impacts GC precursors and GC B cells.
(A–F) Diagram of the experimental protocol (A). By day 3 post-immunization, 20 μg αCD4 or αCD40L was further injected locally to delete CD4 T cells or block CD40 ligation on B cells. Popliteal draining LNs were harvested and stained for flow cytometry analysis by day 3.5 post-immunization. Two independent experiments were carried with n = 4–5 mice in each group. (B–C) Bar graphs showing the percent GC precursors (B) and GC B cells (C) in transferred B cells. (D) The rate of transition is indicated by the ratio of GC precursors over GC B cells. (E) Representative plots showing apoptosis (active caspase 3+) in gated GC precursors after CD40L blockage; 2 hr Staurosporine-treated murine splenocytes were used as positive control to verify active caspase 3 staining. (F) Bar graph showing no significant difference in the induction of Active Caspase 3 within GC precursors upon acute blockage of CD40L. (G–H) NP-specific GFP+ B cells and OVA-specific RFP+ T cells were transferred into C57BL/6 recipients, followed by immunization of NP-OVA in CFA. 3 days and 6 hr later, popliteal draining LNs were harvested and stained for histology. (G) Sections were stained for BCL6 and RelB as well as GFP and RFP to identify Ag-specific B and T cells. BCL6+ RelB+ (square) or BCL6+ RelB- (circle) GFP+ B cells were indentified, and those in the close contact with cognate T cells were indicated with yellow arrows. Scale bars represent 100 µm. (H) Total BCL6+ RelB+ (n = 86) and BCL6+ RelB- (n = 79) from sections of 5 different LNs were revealed and graphed for % in direct contact with cognate T cells. NS no significant difference, **p<0.01, ***p<0.001 (unpaired t-test).
Figure 7—figure supplement 1
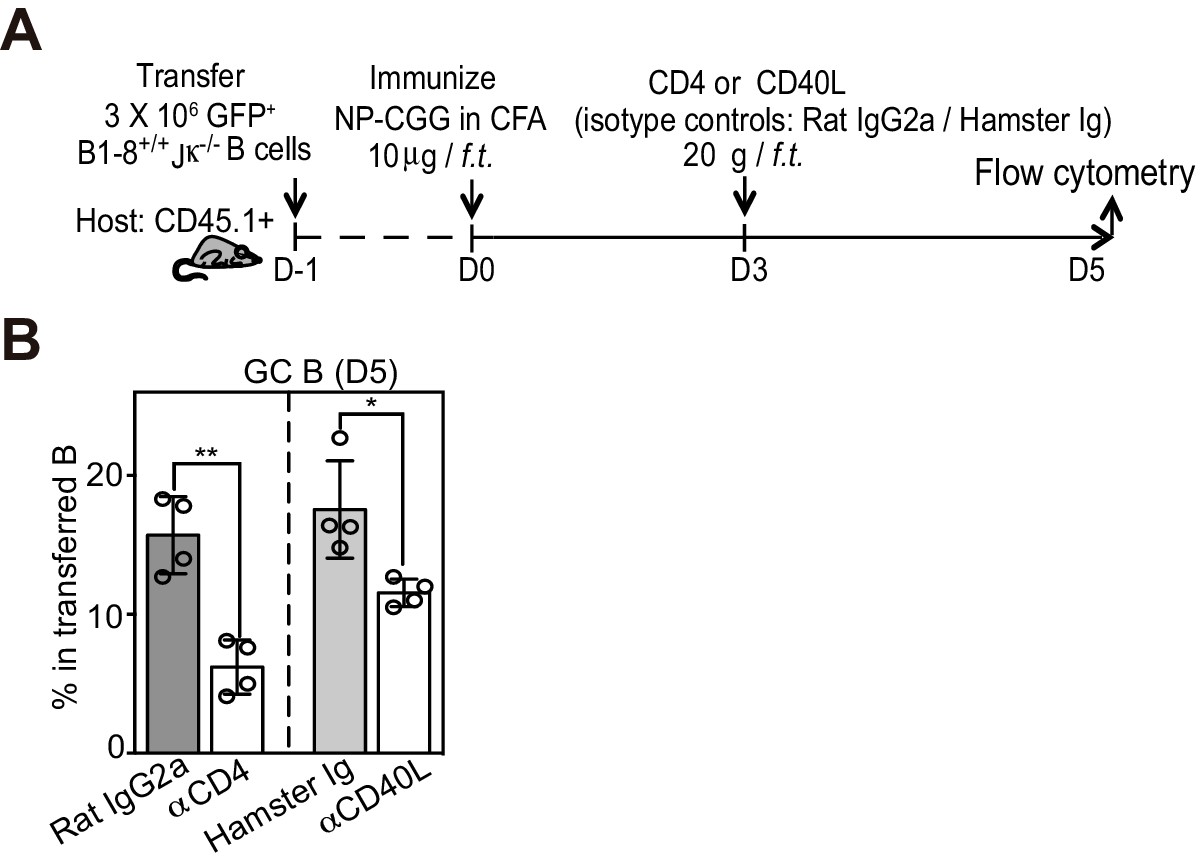
In contrast to the initial transition of pre-GC to BCL6hi GC B cells, T cell help is required for the furthered maintenance or expansion of GC B cells.
(A) Diagram of the experimental protocol. (B) Percent GC B cells among transferred B cells 2 days after depletionof CD4 T cells or blockade of CD40L. Two independent experiments were carried with n = 4 in each group. *p<0.05, **p<0.01 (upaired t-test).
Figure 8 with 2 supplements
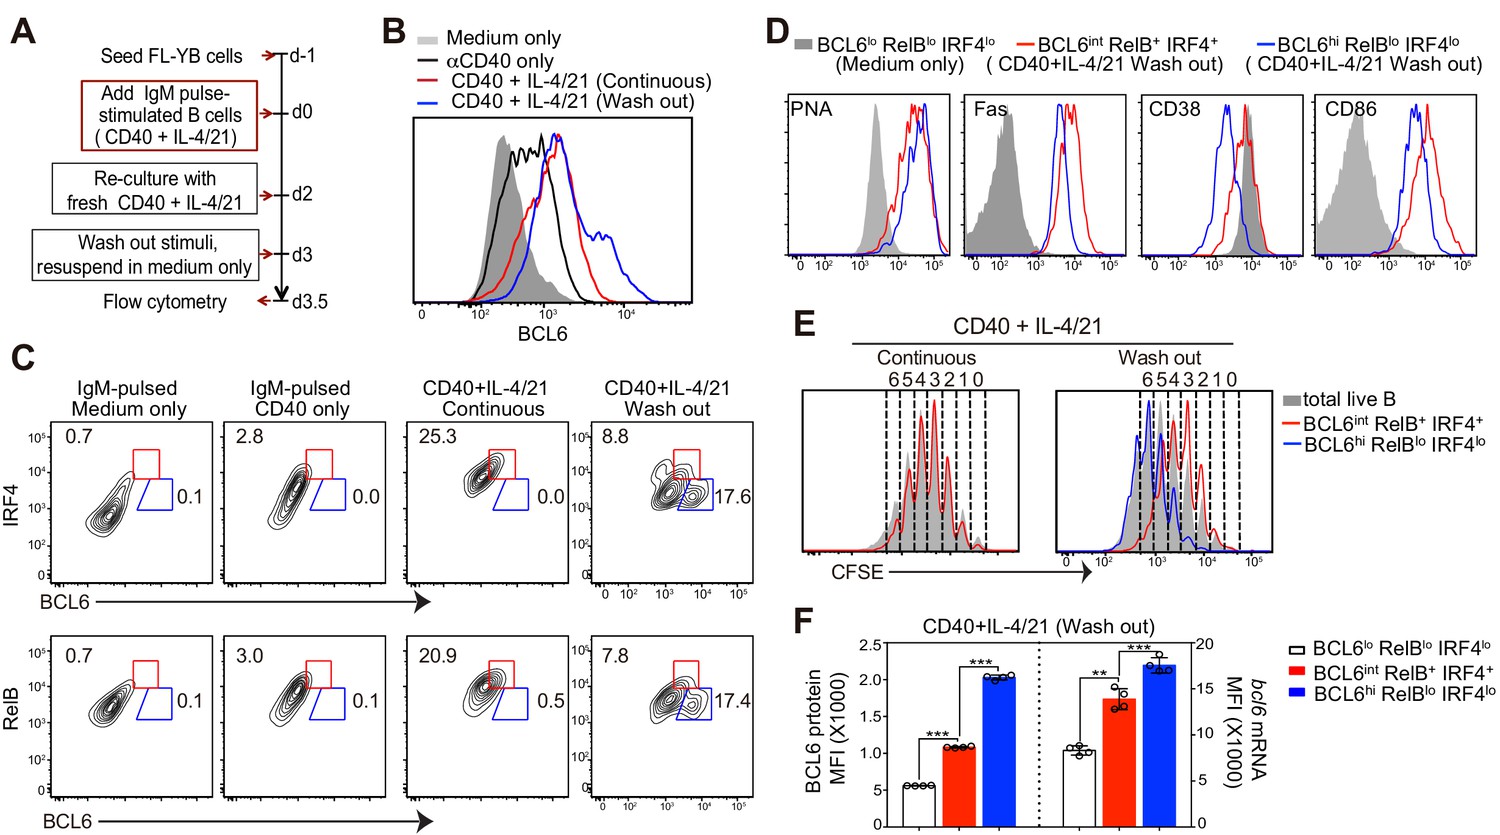
Deprivation of T-cell derived stimuli is required for the maturation of BCL6hi GC B cells in vitro.
(A) Schematic of the culture system using primary murine B cells. (B) Overlay of BCL6 expression in live B cells under different culture conditions as indicated. (C) Contour plots of BCL6 expression by live B cells relative to either RelB or IRF4 in different culture conditions. Red gates indicate BCL6int RelB+ / IRF4+, blue gates BCL6hi RelBlo / IRF4lo. (D) Histogram overlay of the expression of GC phenotypic markers. Cells were gated as indicated from wash-out cultures that had medium with anti-CD40 + IL-4/21 removed after 3 days of culture. The wash-out populations are compared to BCL6lo RelBlo IRF4lo cells from cultures with medium only (solid grey). (E) Histogram overlay of CFSE dilutions of BCL6int RelB+ / IRF4+ (red), BCL6hi RelBlo / IRF4lo (blue) and total live B cells (grey) gated from the indicated culture conditions. Cell division was manually gated based on CFSE dilution of total live B cells. (F) By using Primeflow assay to detect bcl6 mRNA thorugh flow cytometry, gated BCL6lo RelBlo IRF4lo, BCL6int RelB+ IRF4+, and BCL6hi RelBlo IRF4lo cells were further analyzed for the MFI of BCL6 protein and mRNA. **p<0.01, ***p<0.001 (paired t-test). Data shown above are representative of at least three independent experiments.
Figure 8—figure supplement 1
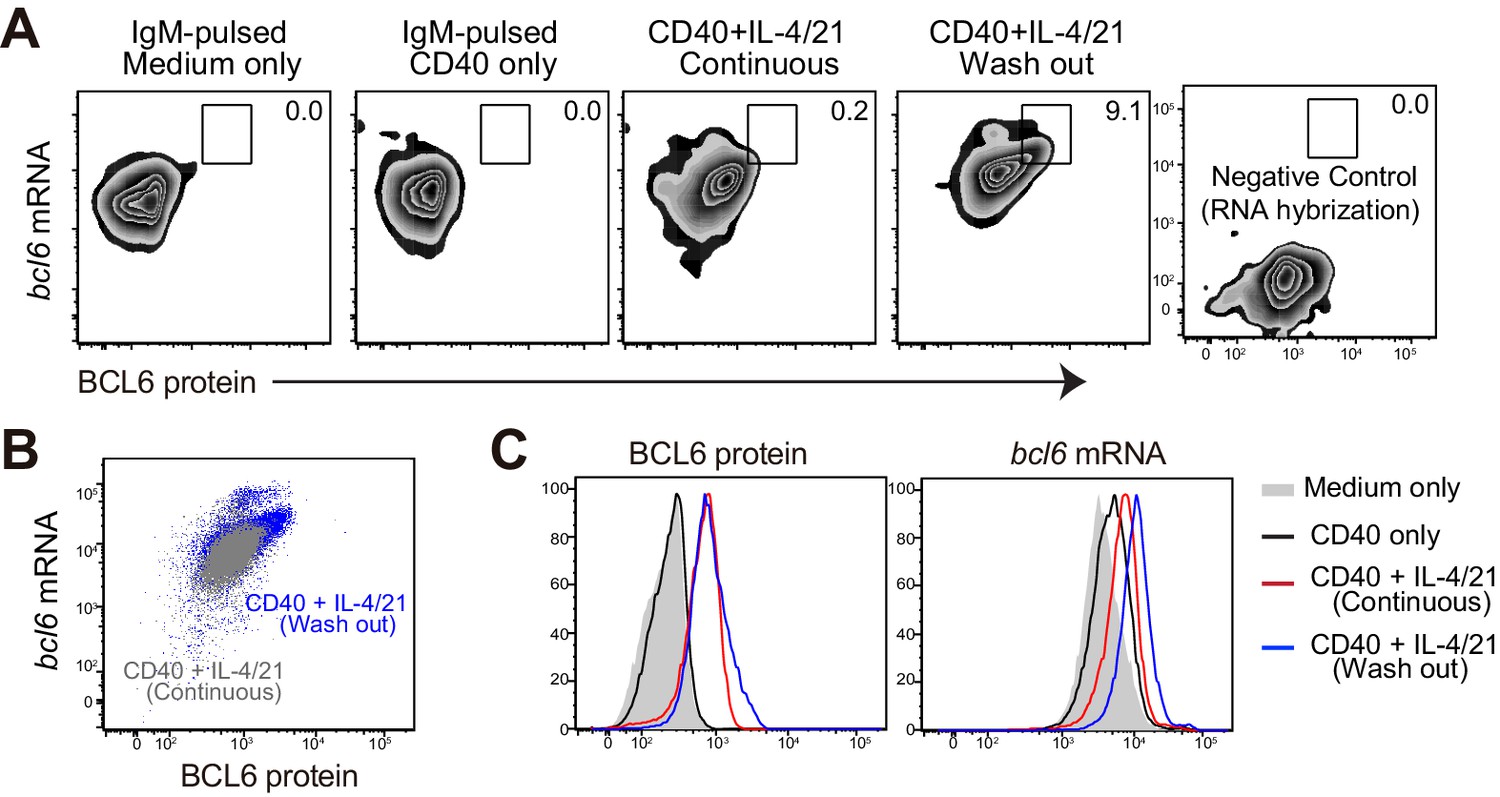
Flow cytometric analysis of BCL6 protein and bcl6 mRNA.
After fixation and intracellular staining with antibody, cultured cells were further hybridized with probes for murine bcl6 to allow for the detection of both BCL6 protein and bcl6 RNA at the single cell level. (A) Representative plots showing the expression of BCL6 protein versus bcl6 mRNA in B cells of indicated cultures. Washout cells without the addition of RNA probes were used as negative controls. (B) Plot of cells continously cultured in aCD40+IL4/21 is overlaid that of cells cultured under washout conditions. (C) Histogram of BCL6 protein and bcl6 mRNA in B cells of different cultures. Experiments were repeated twice with 3–4 replicates of each culture condition.
Figure 8—figure supplement 2
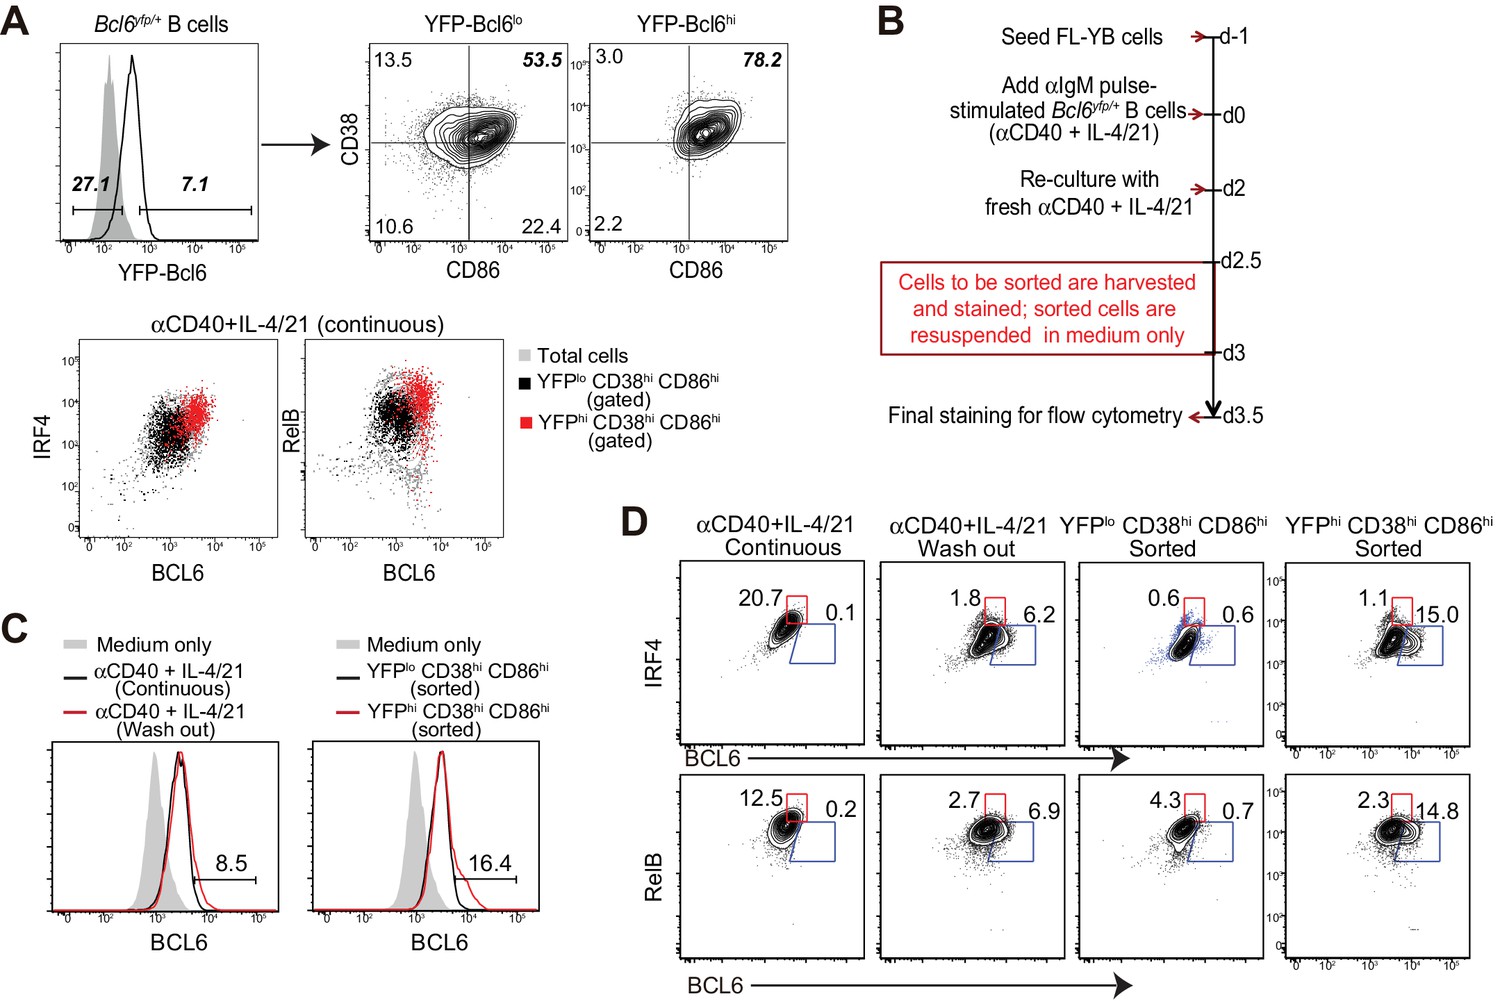
BCL6int precursors, not BCL6lo cells, give rise to BCL6hi GC B cells in vitro.
(A) Bcl6yfp/+ B cells were used for in vitro cell cultures. YFP-Bcl6 hi and lo cells in live B cells from day 3 culture with a continuous exposure of aCD40+IL-4/21 were gated based on control cultures with aCD40 only. Either YFP-Bcl6 hi or lo cells were further analyzed for the expression of CD38 and CD86. YFPlo CD38hi CD86hi cells were primarily BCL6lo RelBlo IRF4lo, whereas the majority of YFPhi CD38hi CD86hi cells were BCL6int RelB+ IRF4+ (GC precursors). (B) Schematic of the culture system using Bcl6yfp/+ B cells for cell sorting and re-culture. (C) Histogram overlay of the expression of BCL6 protein of BCL6hi cells of sorted and recultured populations, in comparison to culture conditions without the interruption of sorting. aIgM-pulsed B cells cultured with medium only were used as BCL6 negative control (solid grey histogram). (D) Contour plots of BCL6 expression by B cells relative to either IRF4 or RelB. Sorted and recultured populations are compared to culture conditions without the interruption of sorting. Gates indicate BCL6hi IRF4lo or BCL6hi RelBlo. Data shown above are representative of three independent experiments.
Author response image 1
Author response image 2
Author response image 3
Download links
A two-part list of links to download the article, or parts of the article, in various formats.
Downloads (link to download the article as PDF)
Open citations (links to open the citations from this article in various online reference manager services)
Cite this article (links to download the citations from this article in formats compatible with various reference manager tools)
Germinal center B cell development has distinctly regulated stages completed by disengagement from T cell help
eLife 6:e19552.
https://doi.org/10.7554/eLife.19552


