The evolutionary origin of bilaterian smooth and striated myocytes
- European Molecular Biology Laboratory, Germany
Figures
Figure 1
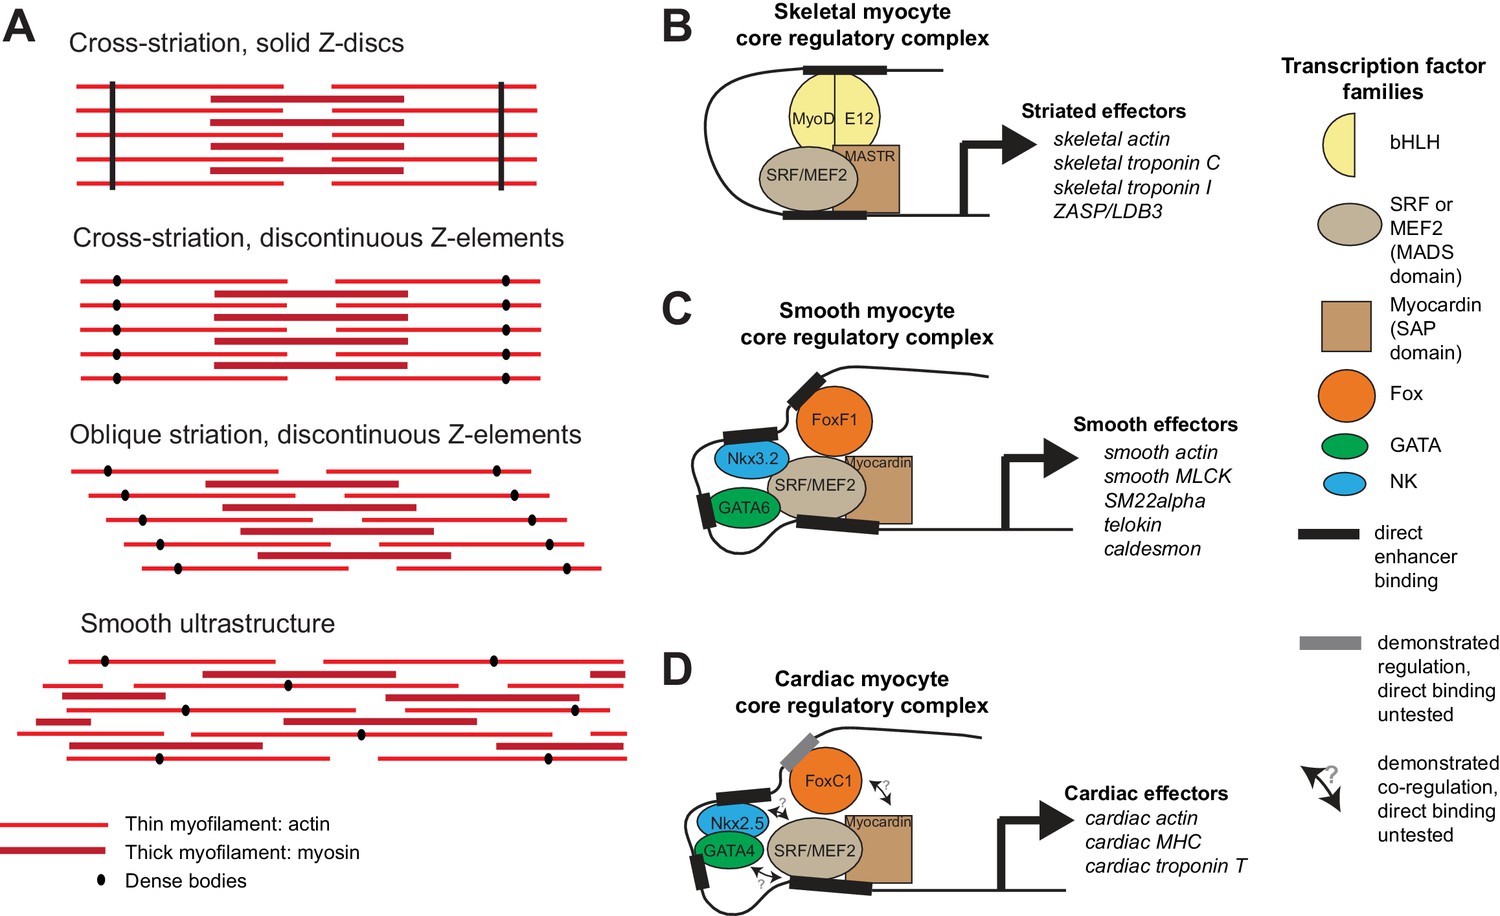
Ultrastructure and core regulatory complexes of myocyte types.
(A) Schematic smooth and striated ultrastructures. Electron-dense granules called ‘dense bodies’ separate adjacent myofibrils. Dense bodies are scattered in smooth muscles, but aligned in striated muscles to form Z lines. (B–D) Core regulatory complexes (CoRCs) of transcription factors for the differentiation of different types of myocytes in vertebrates. Complexes composition from (Creemers et al., 2006; Meadows et al., 2008; Molkentin et al., 1995) for skeletal myocytes, (Hoggatt et al., 2013; Nishida et al., 2002; Phiel et al., 2001) for smooth myocytes and (Durocher et al., 1997; Lee et al., 1998) for cardiomyocytes. Target genes from (Blais et al., 2005) for skeletal myocytes, (Nishida et al., 2002) from smooth myocytes and (Schlesinger et al., 2011) for cardiomyocytes.
Figure 2 with 2 supplements
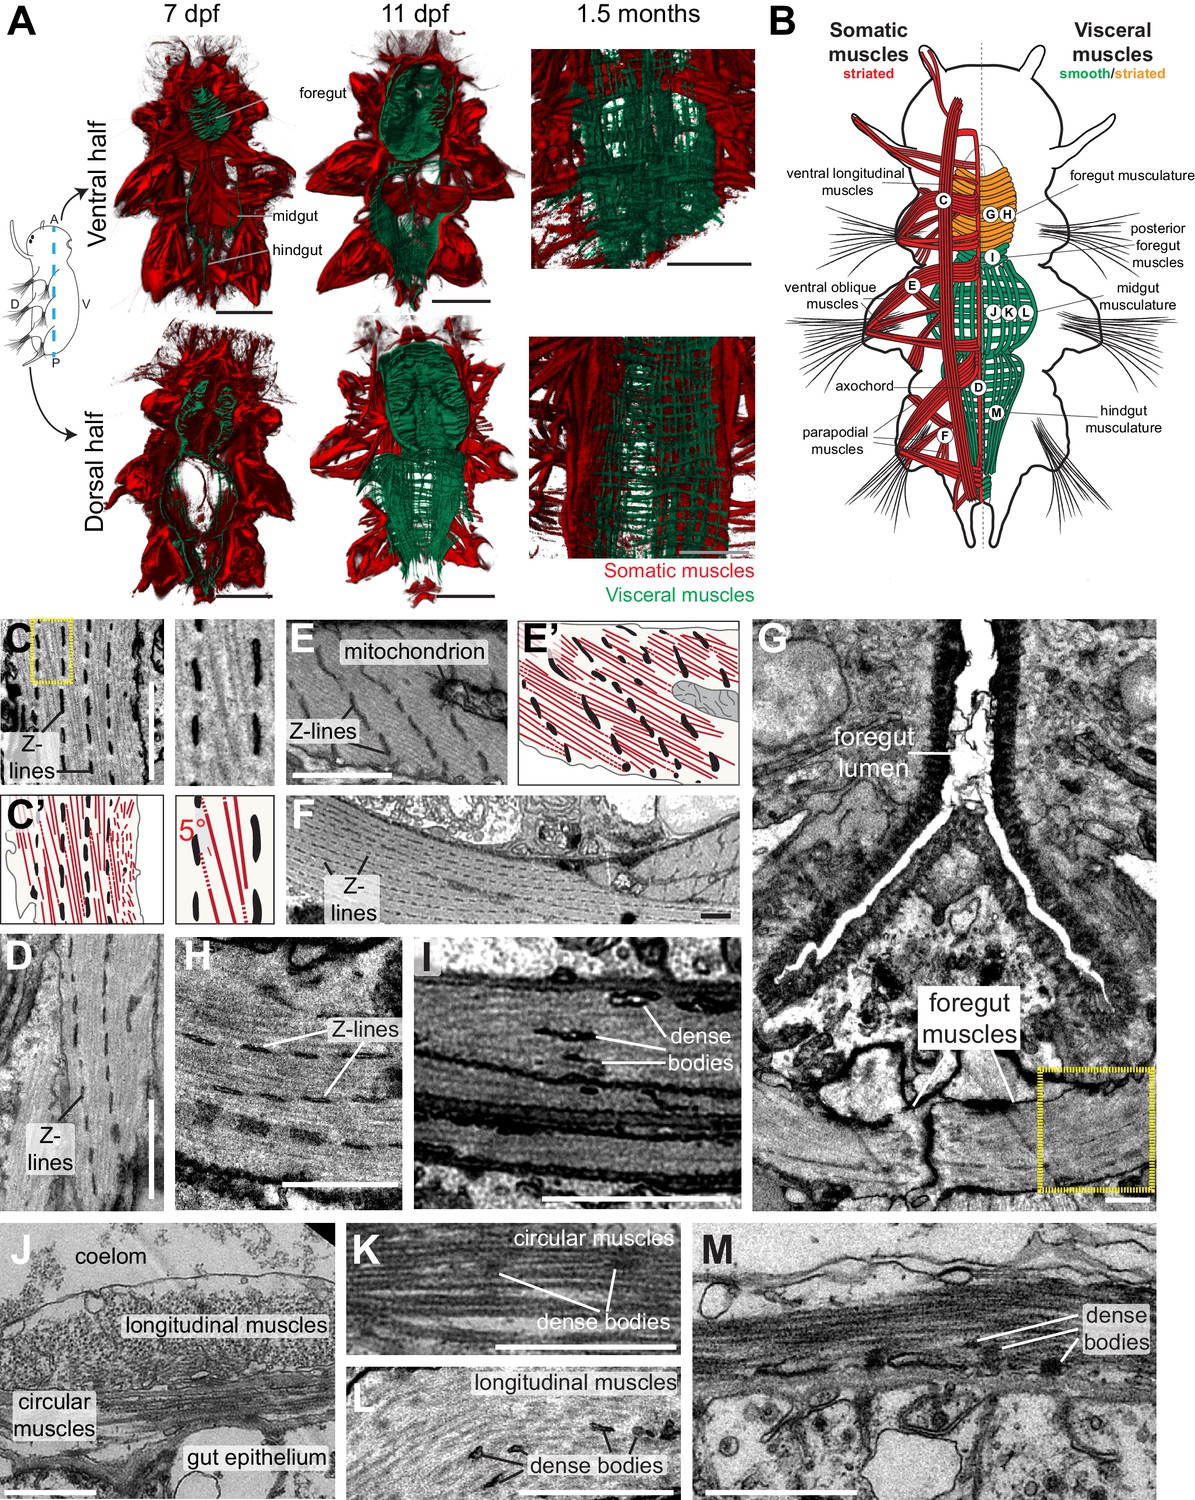
Development and ultrastructure of visceral and somatic musculature in Platynereis larvae and juveniles.
(A) Development of visceral musculature. All panels are 3D renderings of rhodamine-phalloidin staining imaged by confocal microscopy. Visceral muscles have been manually colored green and somatic muscle red. Scale bar: 50 μm. (B) Schematic of the musculature of a late nectochaete (six dpf) larva. Body outline modified from (Fischer et al., 2010). Ventral view, anterior is up. (C–M) Electron micrographs of the main muscle groups depicted in B. Each muscle group is shown sectioned parallel to its long axis, so in the plane of its myofilaments. Scale bar: 2 μm. (C’,E’) are schematic drawings of the cells shown in (C,E). The Z-lines are made of aligned dense bodies (in black), myofilaments are in red, cytoplasm is in yellow and plasma membrane in grey. Attachment points of myofilaments on the dense bodies are represented with dotted lines when they are outside of the plane of section in the electron micrograph. Zoom panel in C’ shows oblique striation with a 5° angle between myofilaments and Z-lines (compare to Figure 1A). (H) shows another cross-section in the stomodeum of the individual shown in G, in the region encased by the yellow box, and observed at a higher magnification. (J) shows the dorsal midgut in cross-section, dorsal side up.
Figure 2—figure supplement 1
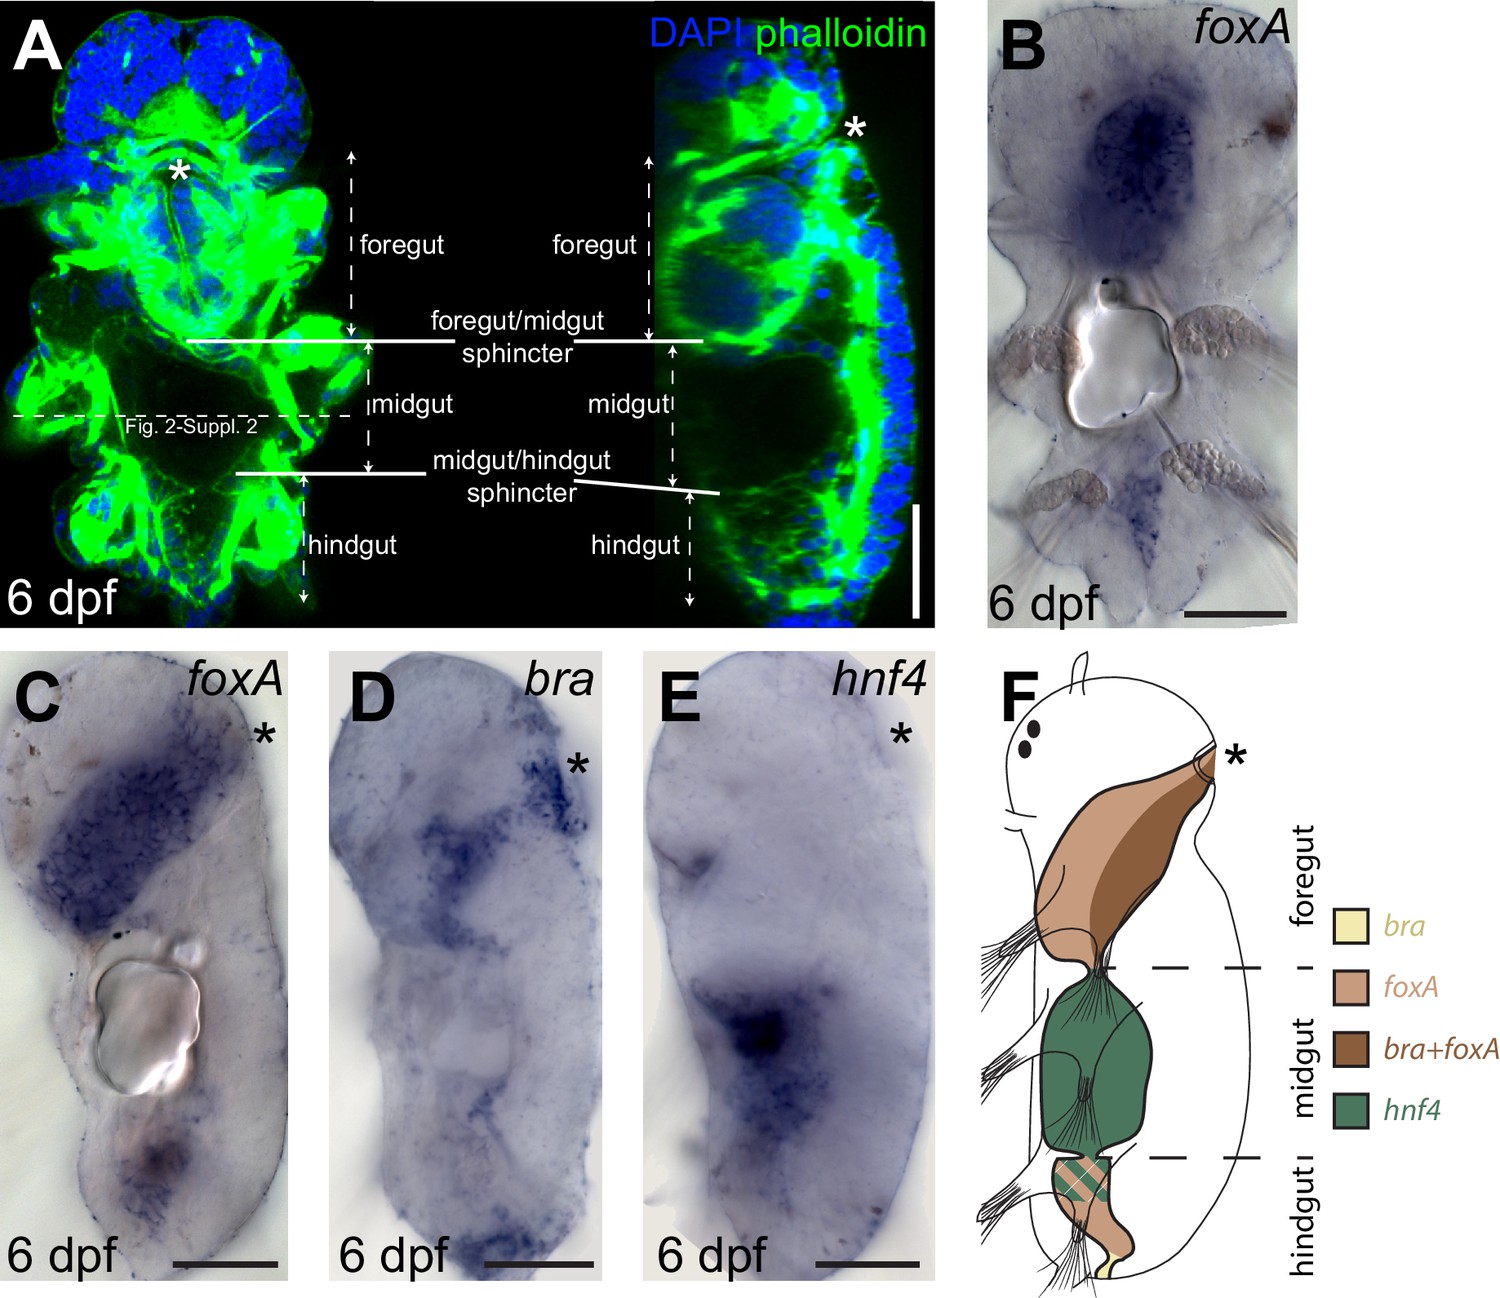
Gut patterning in Platynereis six dpf larvae.
(A) six dpf Platynereis larva stained with phalloidin and DAPI to show tripartite gut organization. Maximal Z-projection of a confocal stack, ventral view, anterior side up. The plane of the cross-sections of Figure 2—figure supplement 2 (in slightly older individuals of otherwise similar morphology) is indicated by the dotted line. (B–E) WMISH for gut markers. (B) Ventral view, anterior is up. (C–E) Left lateral views, anterior is up, ventral is right. (F) Schematic of gut patterning in Platynereis late nectochaete larvae. Asterisk is the mouth on all panels. Scale bar: 50 μm.
Figure 2—figure supplement 2

Formation of the visceral musculature observed in cross-section.
(A–C) Virtual cross-sections of confocal Z-stacks of Platynereis larvae stained with DAPI and phalloidin. Dorsal side up. (A’–C’) Schematic drawings of the same individuals. Note the progressive formation of internal circular fibres around the gut, followed by the formation of external longitudinal fibres. Due to the complex three-dimensional organization of the somatic musculature, different subsets of somatic bundles are observed at different cross-sectional levels within a segment (compare with Figure 2B). The orientation of somatic myofibres is represented based on information from 3D reconstructions (Figure 2B) and TEM (Figure 2C–M). Note the progressive appearance of endodermal nuclei, indicating stepwise cellularization of the midgut from the macromeres. The outline of the endodermal epithelium could be visualized by enhancing the intensity of the green (phalloidin) channel and was drawn from that information in panels (A’–C’). gm: gut muscles, im: intrinsic muscles, vlm: ventral longitudinal muscles, ppm: parapodial muscles, vom: ventral oblique muscles, ach: axochord, dlm: dorsal longitudinal muscles, ch: chaetal sac.
Figure 3 with 5 supplements
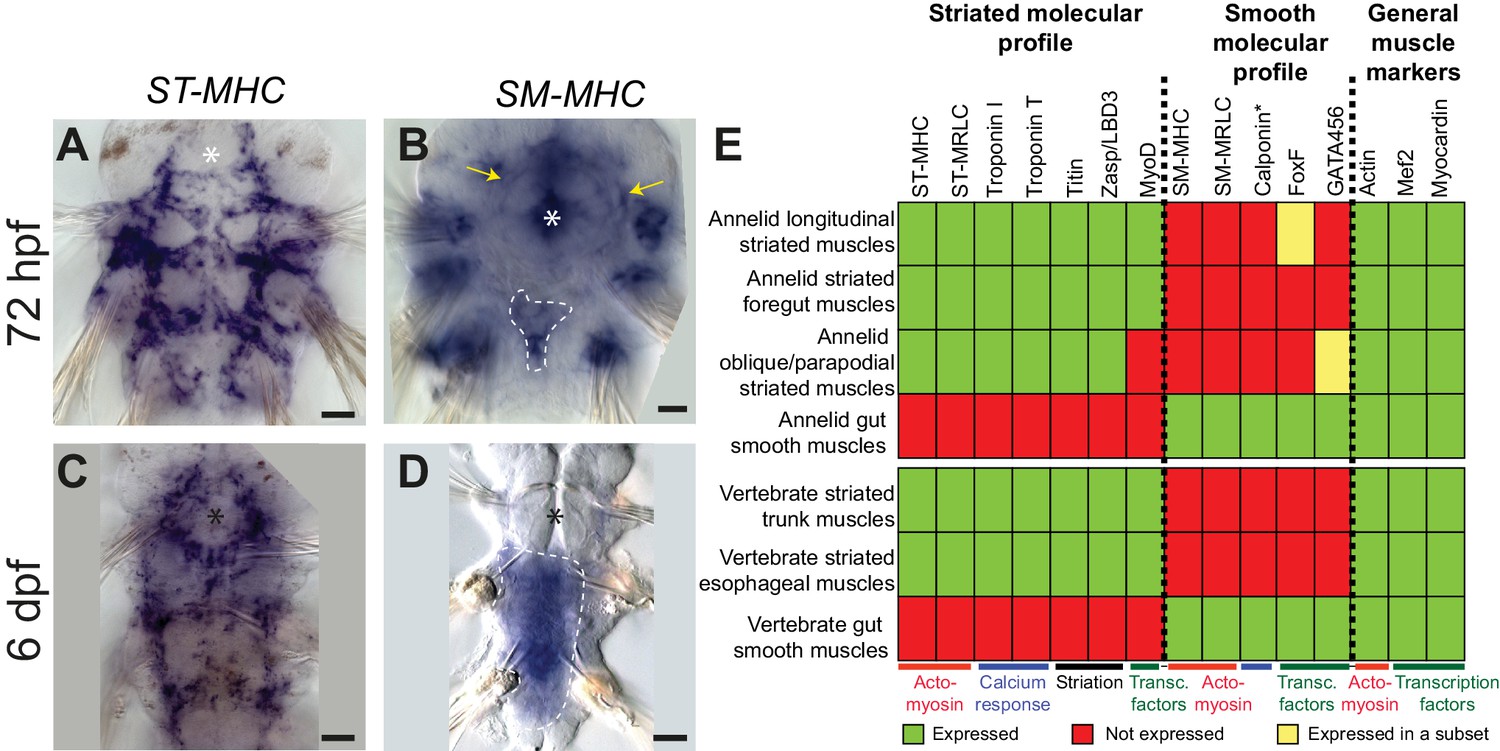
Expression of smooth and striated muscle markers in Platynereis larvae.
Animals have been stained by WMISH and observed in bright-field Nomarski microscopy. Ventral views, anterior side up. Scale bar: 25 μm. (A–D) Expression patterns of the striated marker ST-MHC and the smooth marker SM-MHC. These expression patterns are representative of the entire striated and smooth effector module (see Figure 3—figure supplement 1 and Figure 3—figure supplement 3). Note that SM-MHC (panel B) is expressed around the forming midgut and hindgut (dotted white line) as well as in the stomodeal sheath (white arrows) and in lateral cells in the parapodia. The identity of these cells is unknown, but preliminary observations suggest they will become part of the nephridial tubule/nephridiopore complex that opens at the base of the parapodia in annelids. Asterisk: stomodeum. (E) Table summarizing the expression patterns of smooth and striated markers in Platynereis and vertebrate muscles. (*) indicates that Platynereis and vertebrate Calponin are mutually most resembling by domain structure, but not one-to-one orthologs, as independent duplications in both lineages have given rise to more broadly expressed paralogs with a different domain structure (Figure 7—figure supplement 3).
Figure 3—figure supplement 1
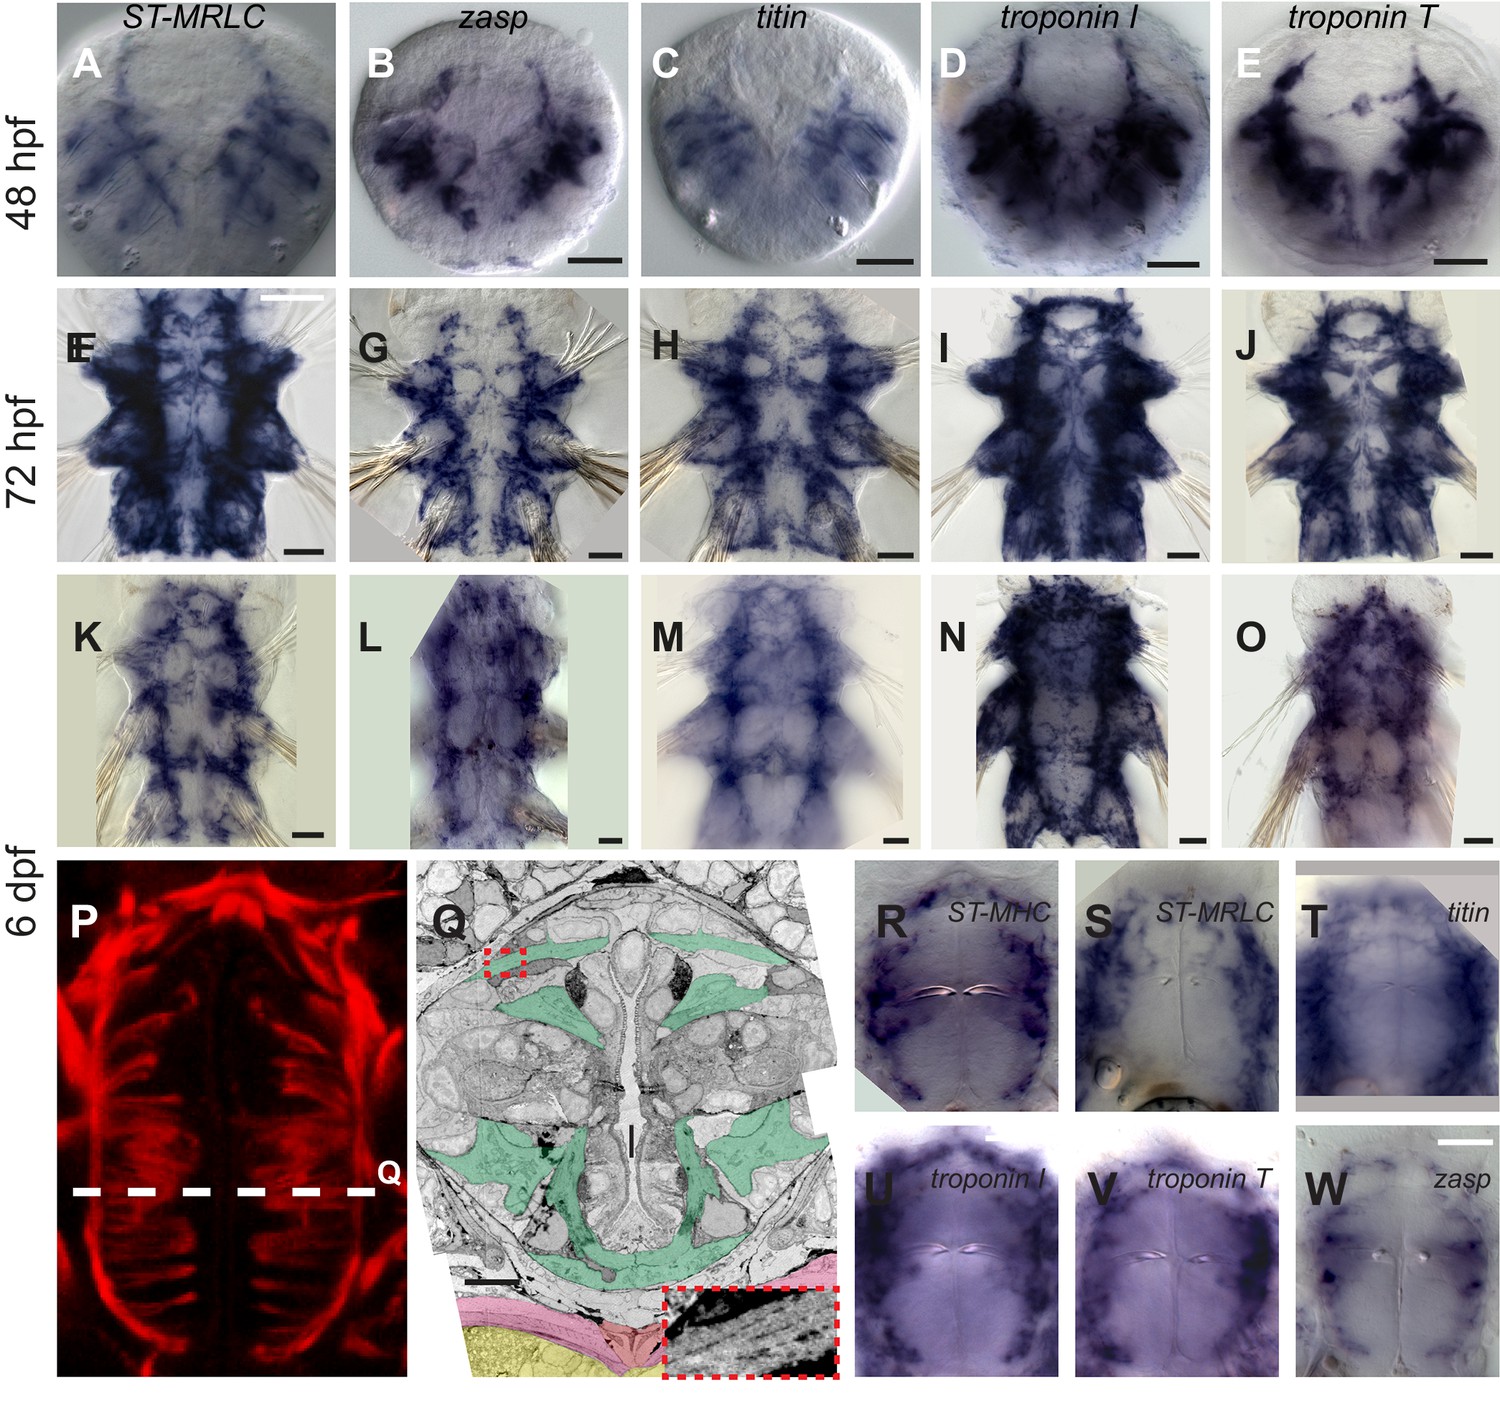
Expression of striated muscle markers in Platynereis larvae.
(A–O) Larvae stained by WMISH and observed in bright-field Nomarski microscopy. Ventral views, anterior side up. Scale bar is 20 μm for 48 hpf and 25 μm for the two other stages. (P) Foregut musculature visualized by rhodamine-phalloidin fluorescent staining. Z-projection of confocal planes. Ventral view, anterior side up. Scale bar: 20 μm. (Q) TEM micrograph of a cross-section of the foregut. Foregut muscles are colored green, axochord orange, ventral oblique muscles pink, ventral nerve cord yellow. Inset: zoom on the area in the red dashed box with enhanced contrast to visualize oblique striation. Scale bar: 10 μm. (R–W) WMISH for striated muscle markers expression in the foregut observed in Nomarski bright field microscopy, ventral views, anterior side up. Scale bar: 20 μm.
Figure 3—figure supplement 2

Expression of striated muscle markers in the six dpf Platynereis larva.
Animals have been stained by WMISH and observed by confocal microscopy (DAPI fluorescence and NBT/BCIP 633 nm reflection). All striated effector genes are expressed in all somatic muscles examined. The transcription factor myoD is detectable in the axochord and in ventral longitudinal muscles, but not in other muscles.
Figure 3—figure supplement 3

Expression of smooth muscle markers in Platynereis larvae.
(A–F) Animals are stained by WMISH and observed by Nomarski bright-field microscopy. Ventral views, anterior side up. Yellow arrows: expression in the foregut mesoderm. White dashed lines: outline of the midgut and hindgut (or their anlage at three dpf). Asterisk: stomodeum. (G) Schematic drawing of a six dpf larva (ventral view, anterior is up) representing gene expression in the forming tripartite gut (compare to Figure 2—figure supplement 1). (H–M) Molecular profile of the pulsatile dorsal vessel. All panels show 2-month-old juvenile worms. (H,I) Maximal Z-projections of confocal stacks. Dorsal view, anterior is up. (H) Dorsal musculature of a juvenile Platynereis dumerilii individual visualized by phalloidin-rhodamine (green) together with nuclear (DAPI, blue) and membrane (FM-464FX, red) stainings. The heart tube lies on the dorsal side, bordered by the somatic dorsal longitudinal muscles (dlm). (I) Expression of SM-MHC in the heart tube visualized by WMISH. (J) Virtual cross-section of the individual shown in A. Dorsal side up. Note the continuity of the muscular heart tube with gut musculature. dlm: dorsal longitudinal muscles. (K) Virtual cross-section of the individual shown in B, showing continuous expression of SM-MHC in the heart and the midgut smooth musculature. Note the similarity to the NK4/tinman expression pattern documented in (Saudemont et al., 2008). (L) Virtual cross-section on an individual stained by WMISH for ST-MHC expression. Note the lack of expression in the heart, while expression is detected in intrinsic muscles that cross the internal cavity. (M) Schematic cross-section of a juvenile worm (dorsal side up) showing the shape, connections and molecular profile of the main muscle groups. Scale bar: 30 μm in all panels.
Figure 3—figure supplement 4
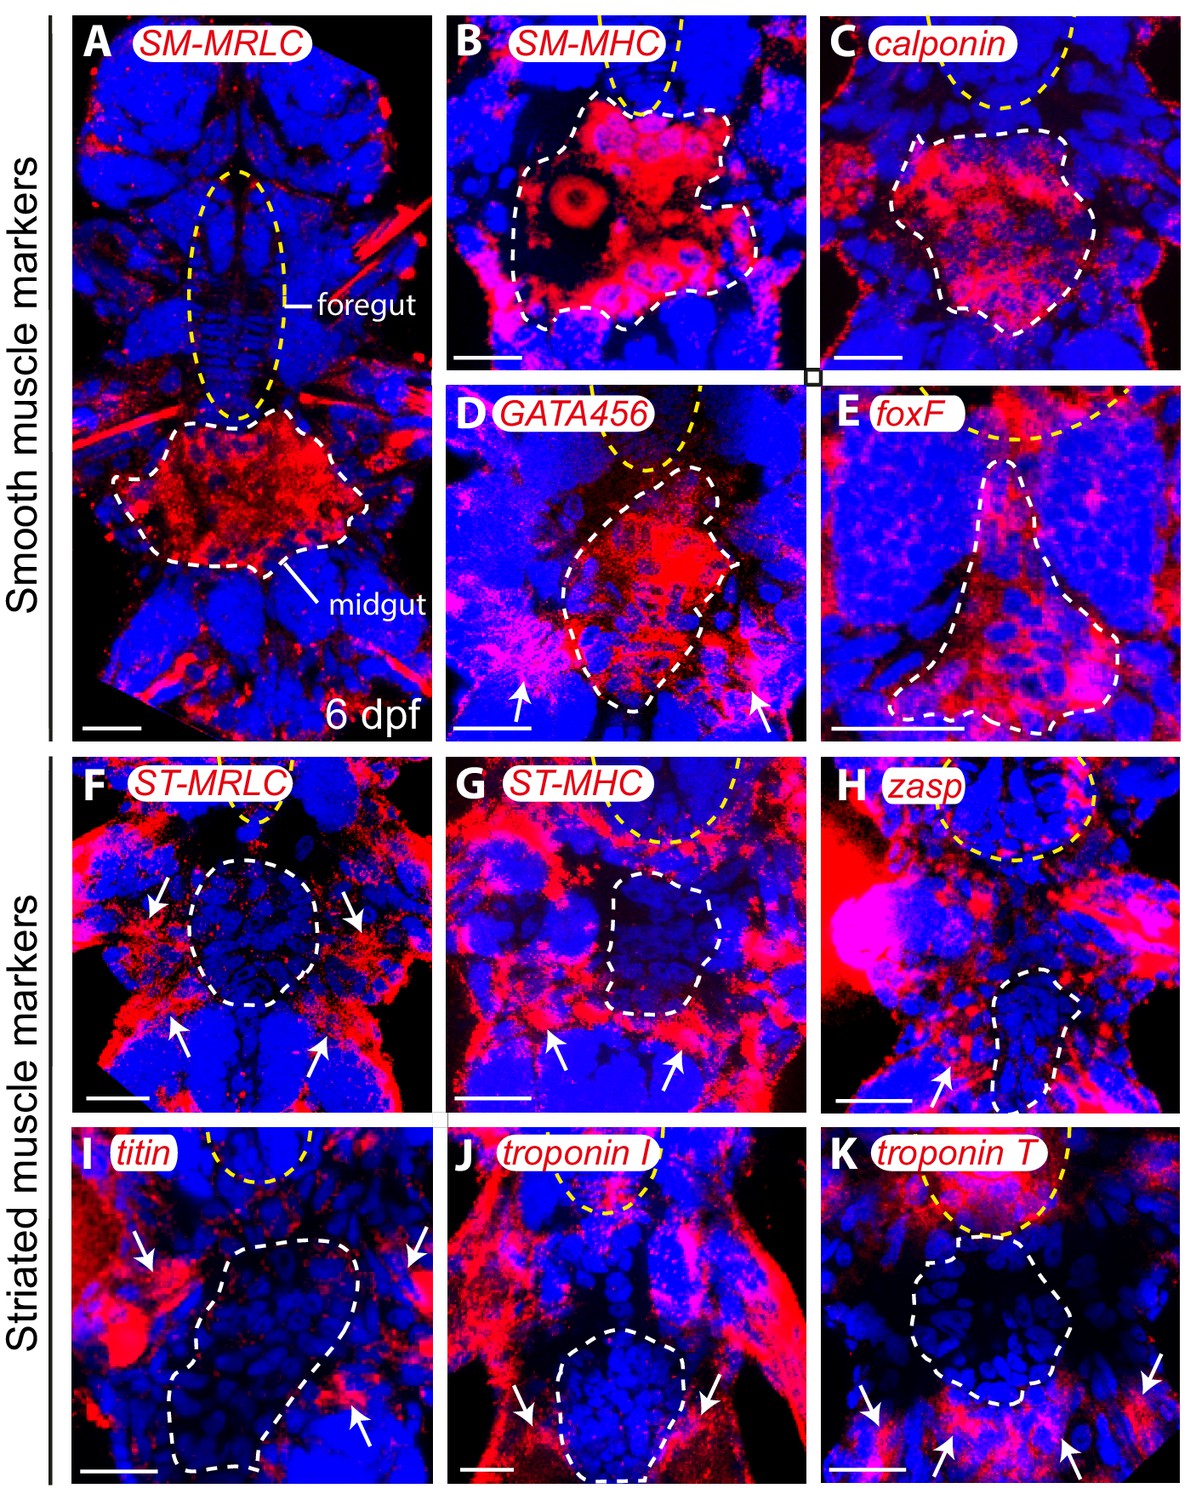
Molecular profile of midgut muscles in the six dpf larva.
All panels are Z-projections of confocal planes, ventral views, anterior side up. Blue: DAPI, red: NBT/BCIP precipitate. White dashed line: midgut/hindgut, yellow dashed ellipse: stomodeum. (A–E) Smooth markers expression. White arrows indicate somatic expression of GATA456 in the ventral oblique muscles. (F–K) Striated markers expression; none of them is detected in any gut cell. White arrows: somatic expression. Scale bar: 20 μm in all panels.
Figure 3—figure supplement 5
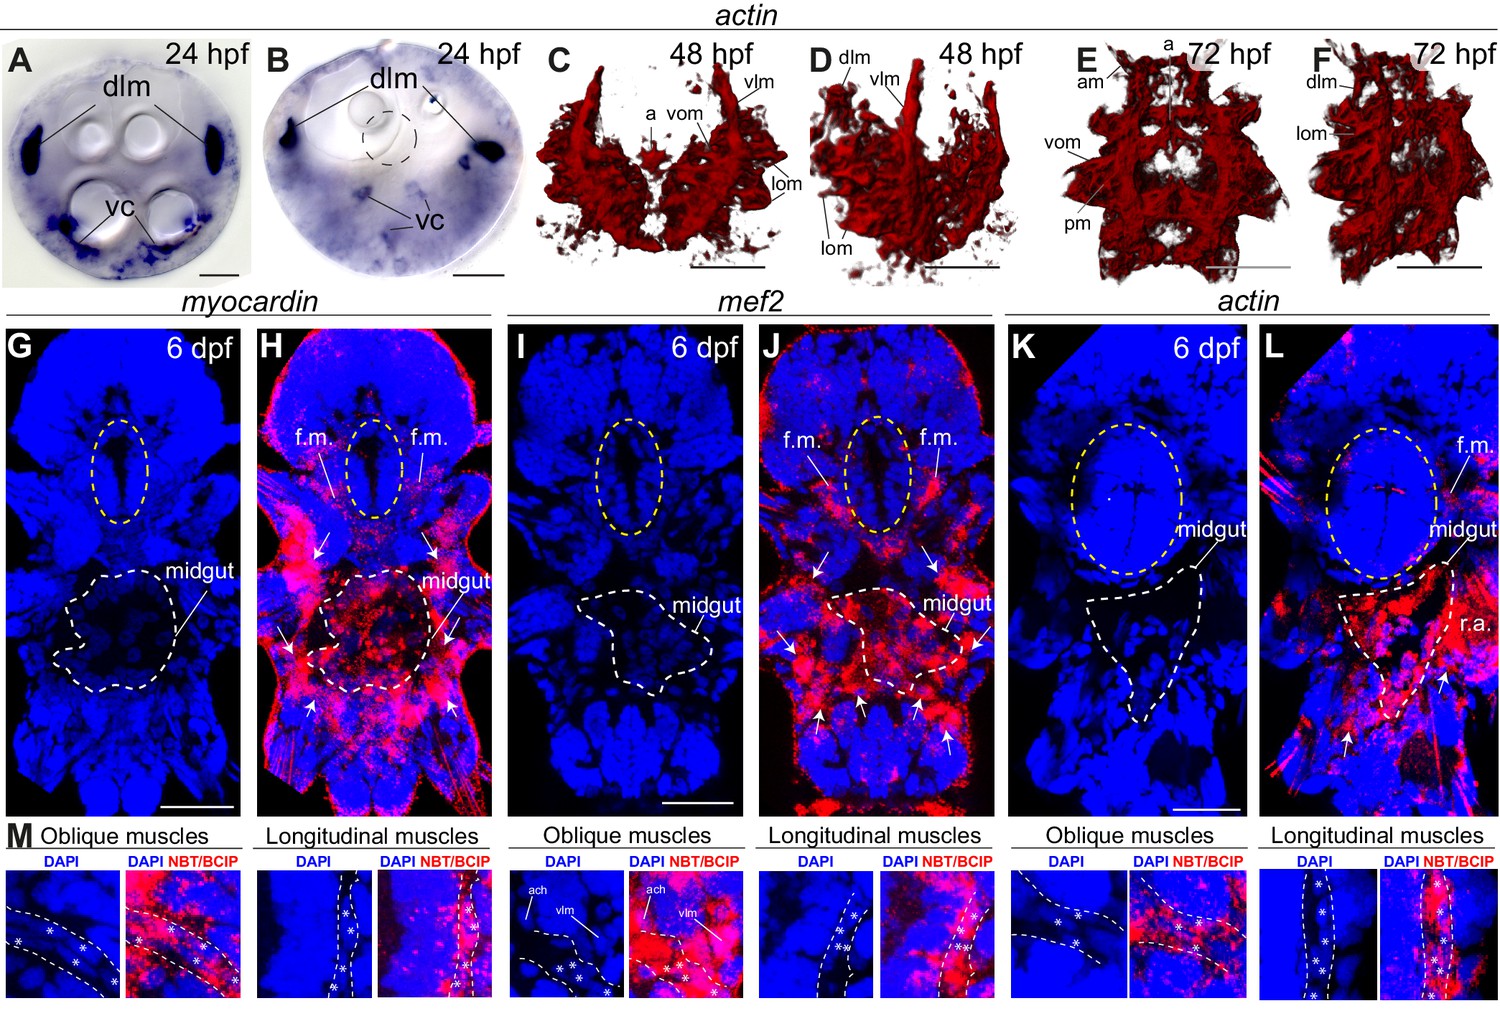
General muscle markers are expressed in both smooth and striated muscles.
All panels show gene expression visualized by WMISH. (A–F) actin expression. (A–B) bright-field micrographs in Nomarski optics. (A) is an apical view, (B) is a ventral view. Abbreviations: dlm, dorsal longitudinal muscles; vc, ventral mesodermal cells, likely representing future ventral musculature. (C–F) 3D rendering of confocal imaging of NBT/BCIP precipitate. (C,E) ventral views, anterior side up. (D,F) ventrolateral views, anterior side up. Abbreviations are as in Figure 2—figure supplement 2. (G–M) Z-projections of confocal stacks. Blue is DAPI, red is reflection signal of NBT/BCIP precipitate. (G–L) Ventral views, anterior side up. White dashed line: midgut, yellow ellipse: foregut. White arrows: somatic muscle expression. Abbreviations: f.m.: foregut muscles; r.a.: reflection artifact. (M) Expression in individual somatic muscles. Scale bar: 20 μm in all panels.
Figure 4
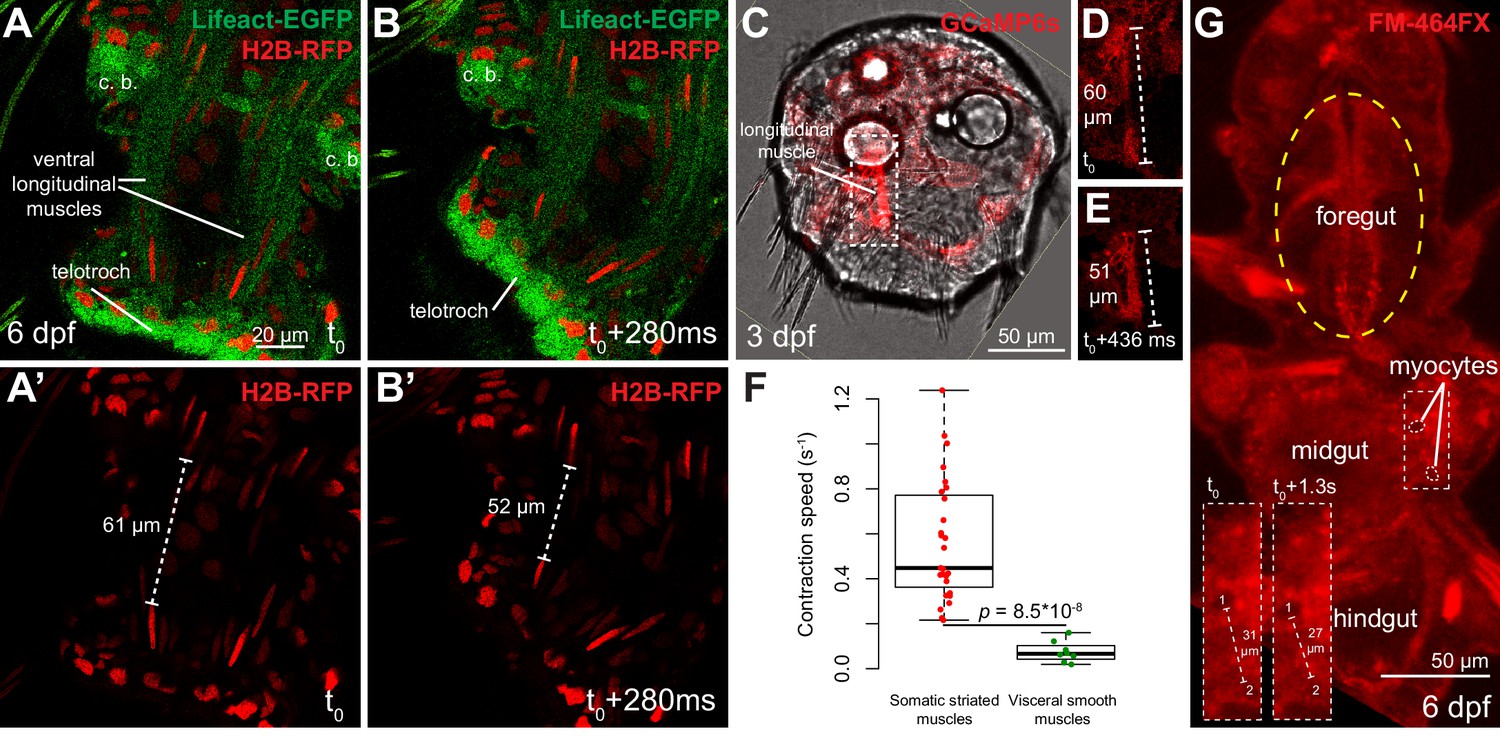
Contraction speed quantifications of smooth and striated muscles.
(A–B) Snapshots of a time lapse live confocal imaging of a late nectochaete larva expressing fluorescent markers. Ventral view of the two posterior-most segments, anterior is up. (C) Snapshots of a time-lapse live confocal imaging of a three dpf larva expressing GCaMP6s. Dorsal view, anterior is up. (D–E) Two consecutive snapshots on the left dorsal longitudinal muscle of the larva shown in C, showing muscle contraction. (F) Quantification of smooth and striated muscle contraction speeds (see Experimental procedures and Figure 4—source data 1), p-value by Mann-Whitney’s U test. Each point represents a biological replicate (see Materials and methods). (G) Snapshot of a time-lapse live confocal imaging of a late nectochaete larva. Ventral view, anterior is up. Optical longitudinal section at the midgut level.
-
Figure 4—source data 1
Contraction speed values measured for somatic and visceral muscles.
- https://doi.org/10.7554/eLife.19607.013
Figure 5
Platynereis gut peristalsis is independent of nervous inputs and dependent on gap junctions.
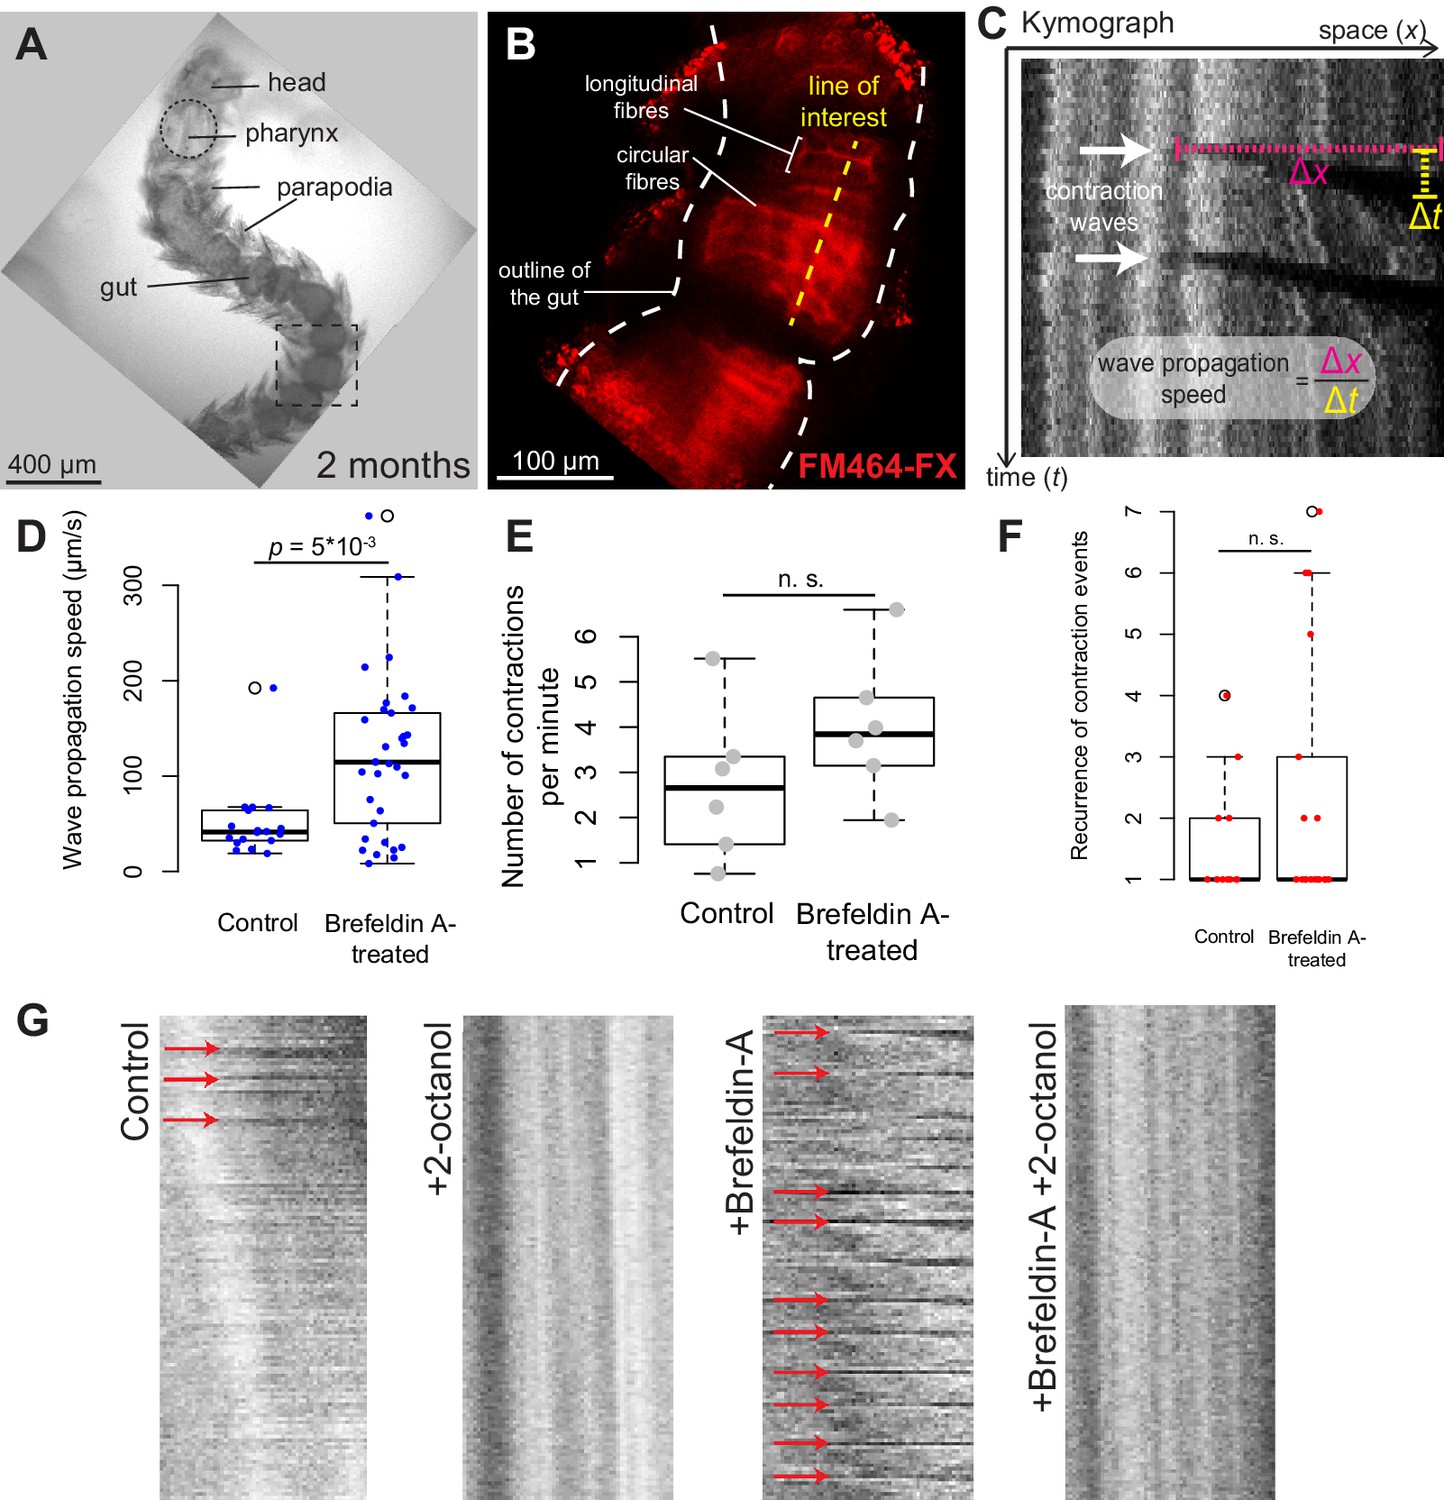
(A) Two-month-old juvenile mounted in 3% low-melting point (LMP) agarose for live imaging. (B) Snapshots of a confocal live time-lapse imaging of the animal shown in A. Gut is observed by detecting fluorescence of the vital membrane dye FM-464FX. (C) Kymograph of gut peristalsis along the line of interest in (B). Contraction waves appear as dark stripes. A series of consecutive contraction waves is called a contraction event: here, two contraction waves are visible, which make up one contraction event with a recurrence of 2. (D) Quantification of the propagation speed of peristaltic contraction waves in mock (DMSO)-treated individuals and Brefeldin-A-treated individuals (inhibiting neurotransmission). Speed is calculated from kymographs (see Materials and methods and Figure 5—source data 1), p-value by Mann-Whitney’s U test. Each point represents a contraction wave. Five biological replicates for each category (see Materials and methods). (E,F) Same as in E, but showing respectively the frequency of initiation and the recurrence of contraction events. Each point represents a biological replicate (see Materials and methods). (G) Representative kymographs of controls, animals treated with Brefeldin A (inhibiting neurotransmission), animals treated with 2-octanol (inhibiting gap junctions) and animals treated with both (N = 10 for each condition). 2-Octanol entirely abolishes peristaltic waves with or without Brefeldin A.
-
Figure 5—source data 1
Peristalsis waves quantifications in control and Brefeldin A-treated worms.
Control and treated animals are respectively numbered Ctrl1, Ctrl2, … etc. and BfdA1, BfdA2, … etc. Contraction events are named e1, e2, … etc. Numbers in columns B and E are the speed of individual contraction waves as defined in Figure 5C. Contraction events and the recurrence of contraction events are defined in the legend of Figure 5.
- https://doi.org/10.7554/eLife.19607.017
Figure 6
The enteric nerve net of Platynereis.
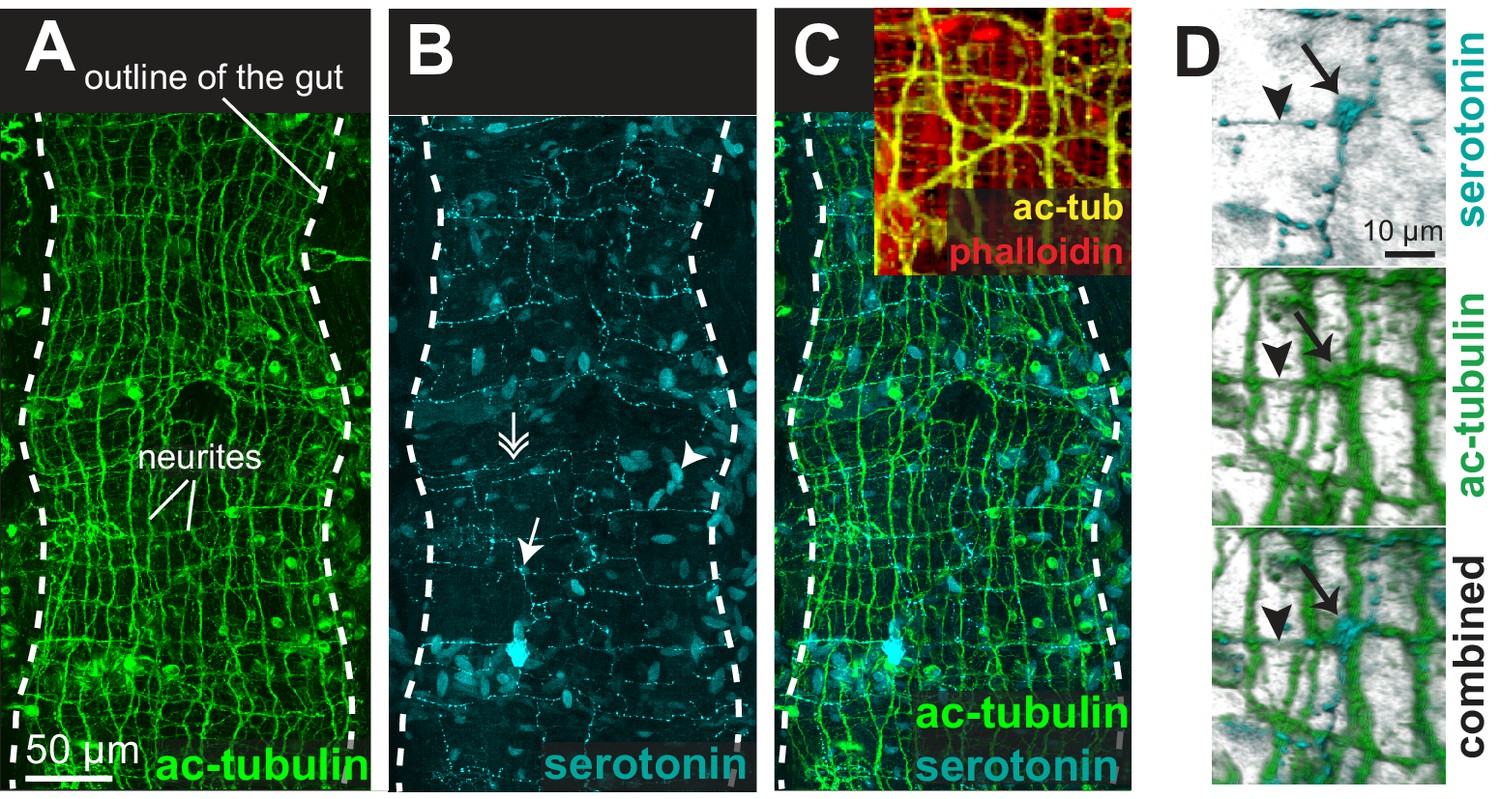
(A) Immunostaining for acetylated tubulin, visualizing neurites of the enteric nerve plexus. Z-projection of a confocal stack at the level of the midgut. Anterior side up. (B) Same individual as in A, immunostaining for serotonin (5-HT). Note serotonergic neurites (double arrow), serotonergic neuronal cell bodies (arrow, see D), and serotonergic cell bodies without neurites (arrowhead). (C) Same individual as in A showing both acetylated tubulin and 5-HT immunostainings. Snapshot in the top right corner: same individual, showing both neurites (acetylated tubulin, yellow) and visceral myofibres (rhodamine-phalloidin, red). The acetylated tubulin appears yellow due to fluorescence leaking in the rhodamine channel. (D) 3D rendering of the serotonergic neuron shown by arrow in B.
Figure 7 with 3 supplements
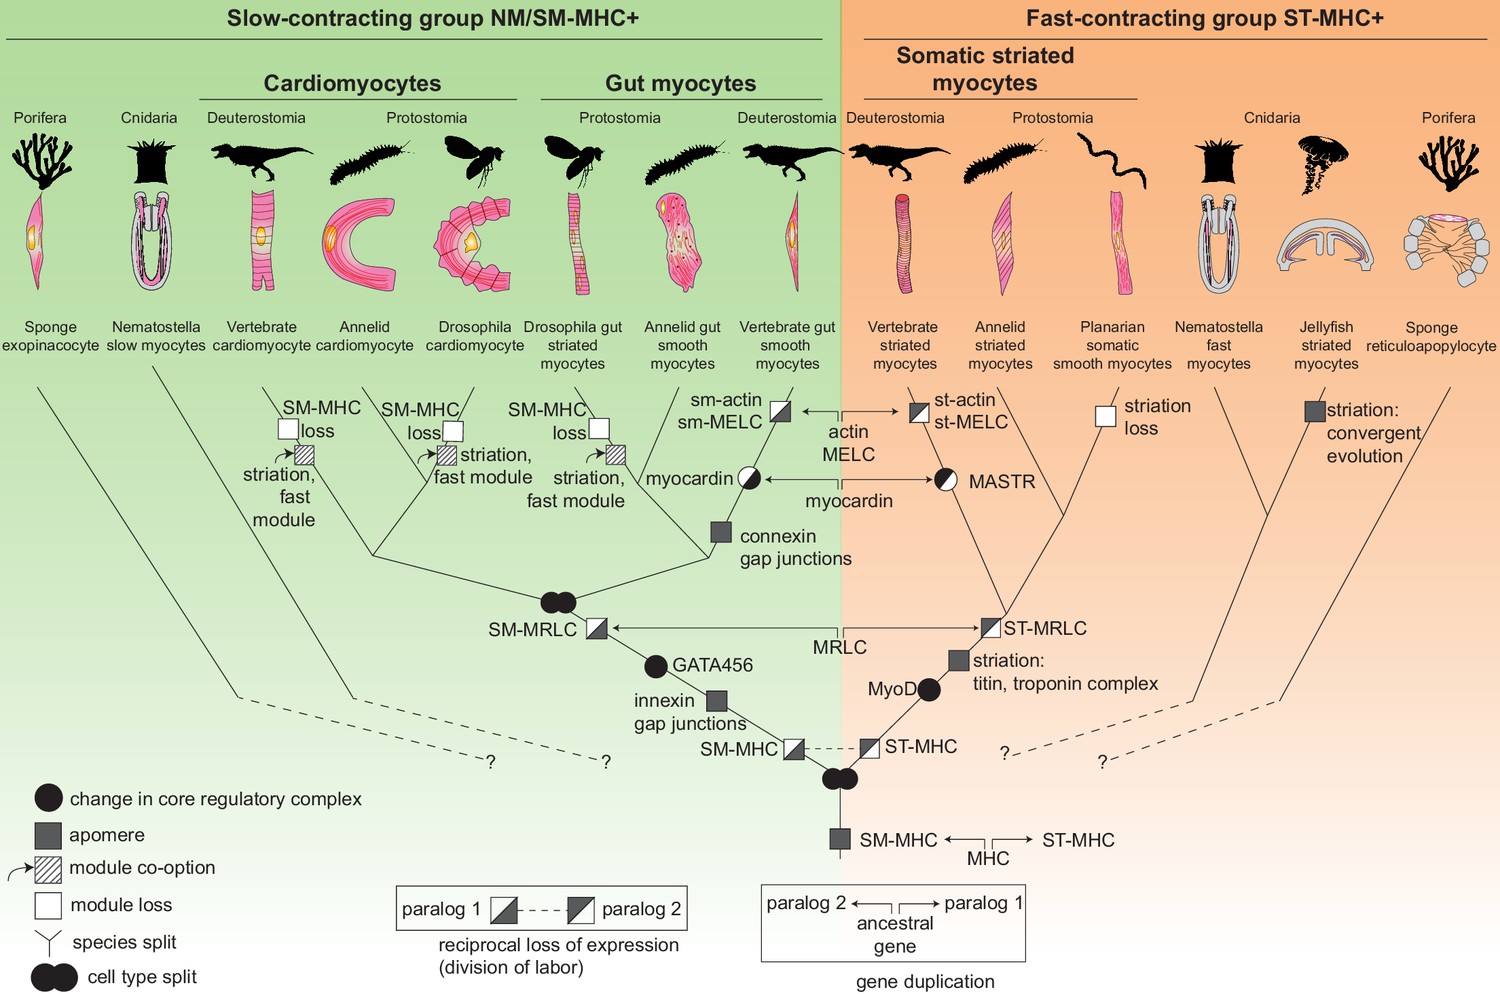
The evolutionary tree of animal contractile cell types.
Bilaterian smooth and striated muscles split before the last common protostome/deuterostome ancestor. Bilaterian myocytes are split into two monophyletic cell type clades: an ancestrally SM-MHC+ slow-contracting clade (green) and an ancestrally ST-MHC+ fast-contracting clade (orange). Hypothetical relationships of the bilaterian myocytes to the SM-MHC+ and ST-MHC+ contractile cells of non-bilaterians are indicated by dotted lines (Steinmetz et al., 2012). Apomere: derived set of effector genes common to a monophyletic group of cell types (Arendt et al., 2016). Note that ultrastructure only partially reflects evolutionary relationships, as striation can evolve convergently (as in medusozoans), be co-opted (as in insect gut myocytes or in vertebrate and insect cardiomyocytes), be blurred, or be lost (as in planarians). Conversion of smooth to striated myocytes took place by co-option of striation proteins (Titin, Zasp/LDB3) and of the fast contractile module (ST-MHC, ST-MRLC, Troponin complex) in insect cardiomyocytes and gut myocytes, as well as in vertebrate cardiomyocytes. Nodes can either represent cell type duplications (indicated by two partly overlapping circles) or speciation events, as typical for a cell type tree (Arendt, 2008; Serb and Oakley, 2005).
Figure 7—figure supplement 1
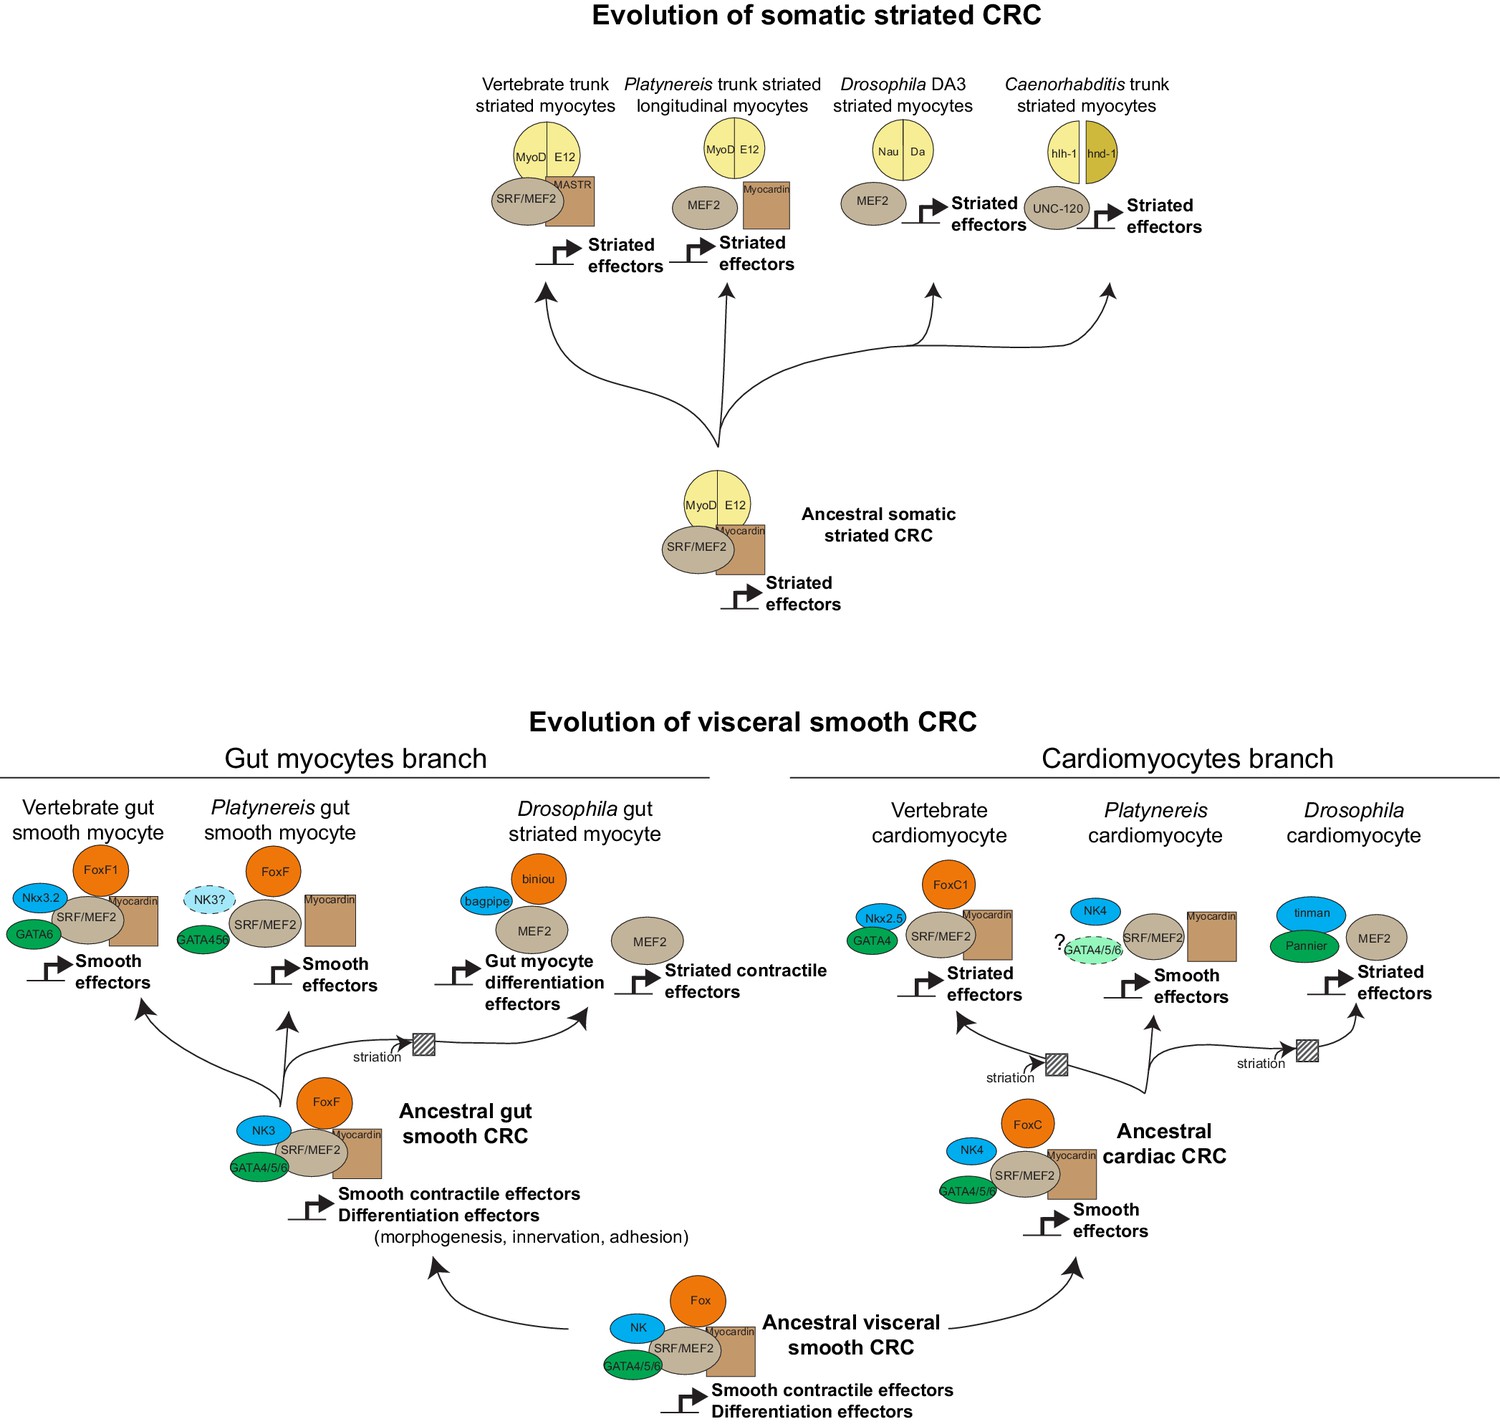
Evolution of myogenic Core Regulatory Complexes (CoRCs) in Bilateria.
Transcription factor families are depicted as in Figure 1. Direct contact indicates proven binding. Co-option of the fast/striated module happened on three occasions: in Drosophila gut myocytes, and in cardiomyocytes of both vertebrates and Drosophila. Note that in both cases, composition of the CoRC was maintained in spite of change in the effector module. In insect gut myocytes, replacement of the smooth by the striated module entailed a split of the CoRC, with the ancient smooth CoRC still controlling conserved differentiation genes (involved in adhesion, morphogenesis, axonal guidance, or formation of innexin gap junctions), while the striated contractile cassette is downstream Mef2 alone (Jakobsen et al., 2007). It is less clear whether a similar split of CoRC took place in striated cardiomyocytes. In the striated myocyte line, it is unclear whether MyoD was part of the ancestral CoRC of all striated myocytes (as in vertebrates) or just of a subset (as in Platynereis). In Drosophila, the myoD ortholog nautilus has been reported to be only necessary for the formation of a subset of somatic muscles – DA3 and DO4 (Balagopalan et al., 2001) – although other reports suggest that in nautilus null mutants, other somatic muscles might be lacking (with low penetrance) (Wei et al., 2007) or be present but underdeveloped (Enriquez et al., 2012).
Figure 7—figure supplement 2
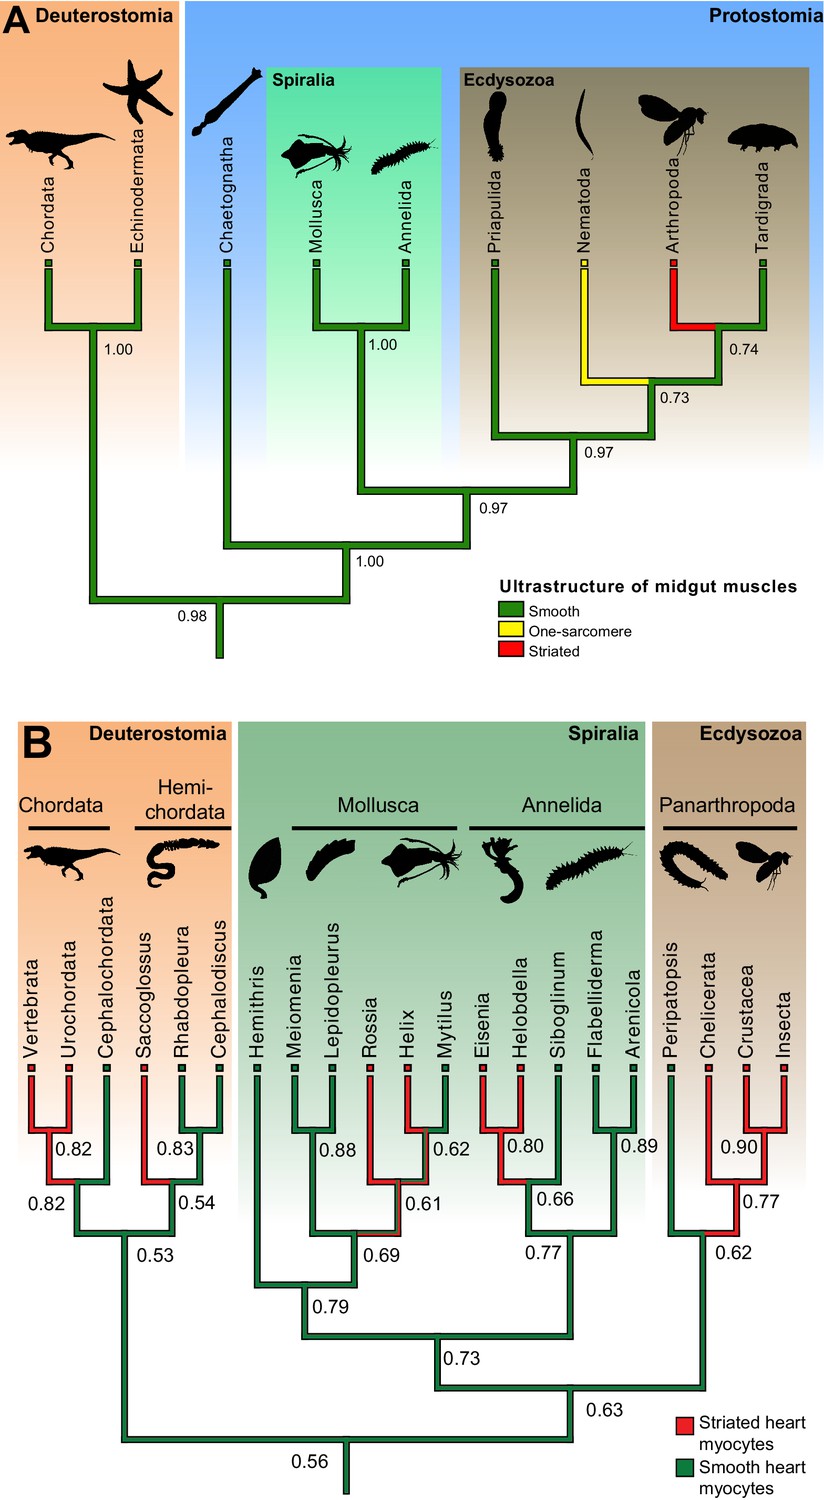
Ancestral state reconstructions of the ultrastructure of midgut/hindgut and heart myocytes.
(A) Distribution, and ancestral state reconstruction, of midgut smooth muscles in Bilateria. Ancestral states were inferred using Parsimony and Maximum Likelihood (ML) (posterior probabilities indicated on nodes). Character states from: Chordata (Marieb and Hoehn, 2015), Echinodermata (Feral and Massin, 1982), Chaetognatha (Duvert and Salat, 1995), Mollusca (Royuela et al., 2000), Annelida (Anderson and Ellis, 1967), Priapulida (Carnevali and Ferraguti, 1979), Nematoda (White, 1988), Arthropoda (Goldstein and Burdette, 1971) and Tardigrada (Shaw, 1974). (B) Distribution, and ancestral state reconstruction, of cardiomyocyte ultrastructure in Bilateria. Ancestral states were inferred using Parsimony and ML (posterior probabilities indicated on nodes). Note that, due to the widespread presence of striated cardiomyocytes in bilaterians, the support value for an ancestral smooth ultrastructure in the ML method remain modest (0.56). This hypothesis receives independent support from the comparison of Cs (Figure 1B, Figure 7—figure supplement 1) and developmental data (see Discussion). Character states follow the review by Martynova (Martynova, 1995, 2004) and additional references for Siboglinum (Jensen and Myklebust, 1975), chordates (Hirakow, 1985), Peripatopsis (Nylund et al., 1988), arthropods (Tjønneland et al., 1987), Meiomenia (Reynolds et al., 1993) and Lepidopleurus (Økland, 1980). In Peripatopsis and Lepidopleurus, some degree of alignment of dense bodies was detected (without being considered regular enough to constitute striation), suggesting these might represent intermediate configurations.
Figure 7—figure supplement 3
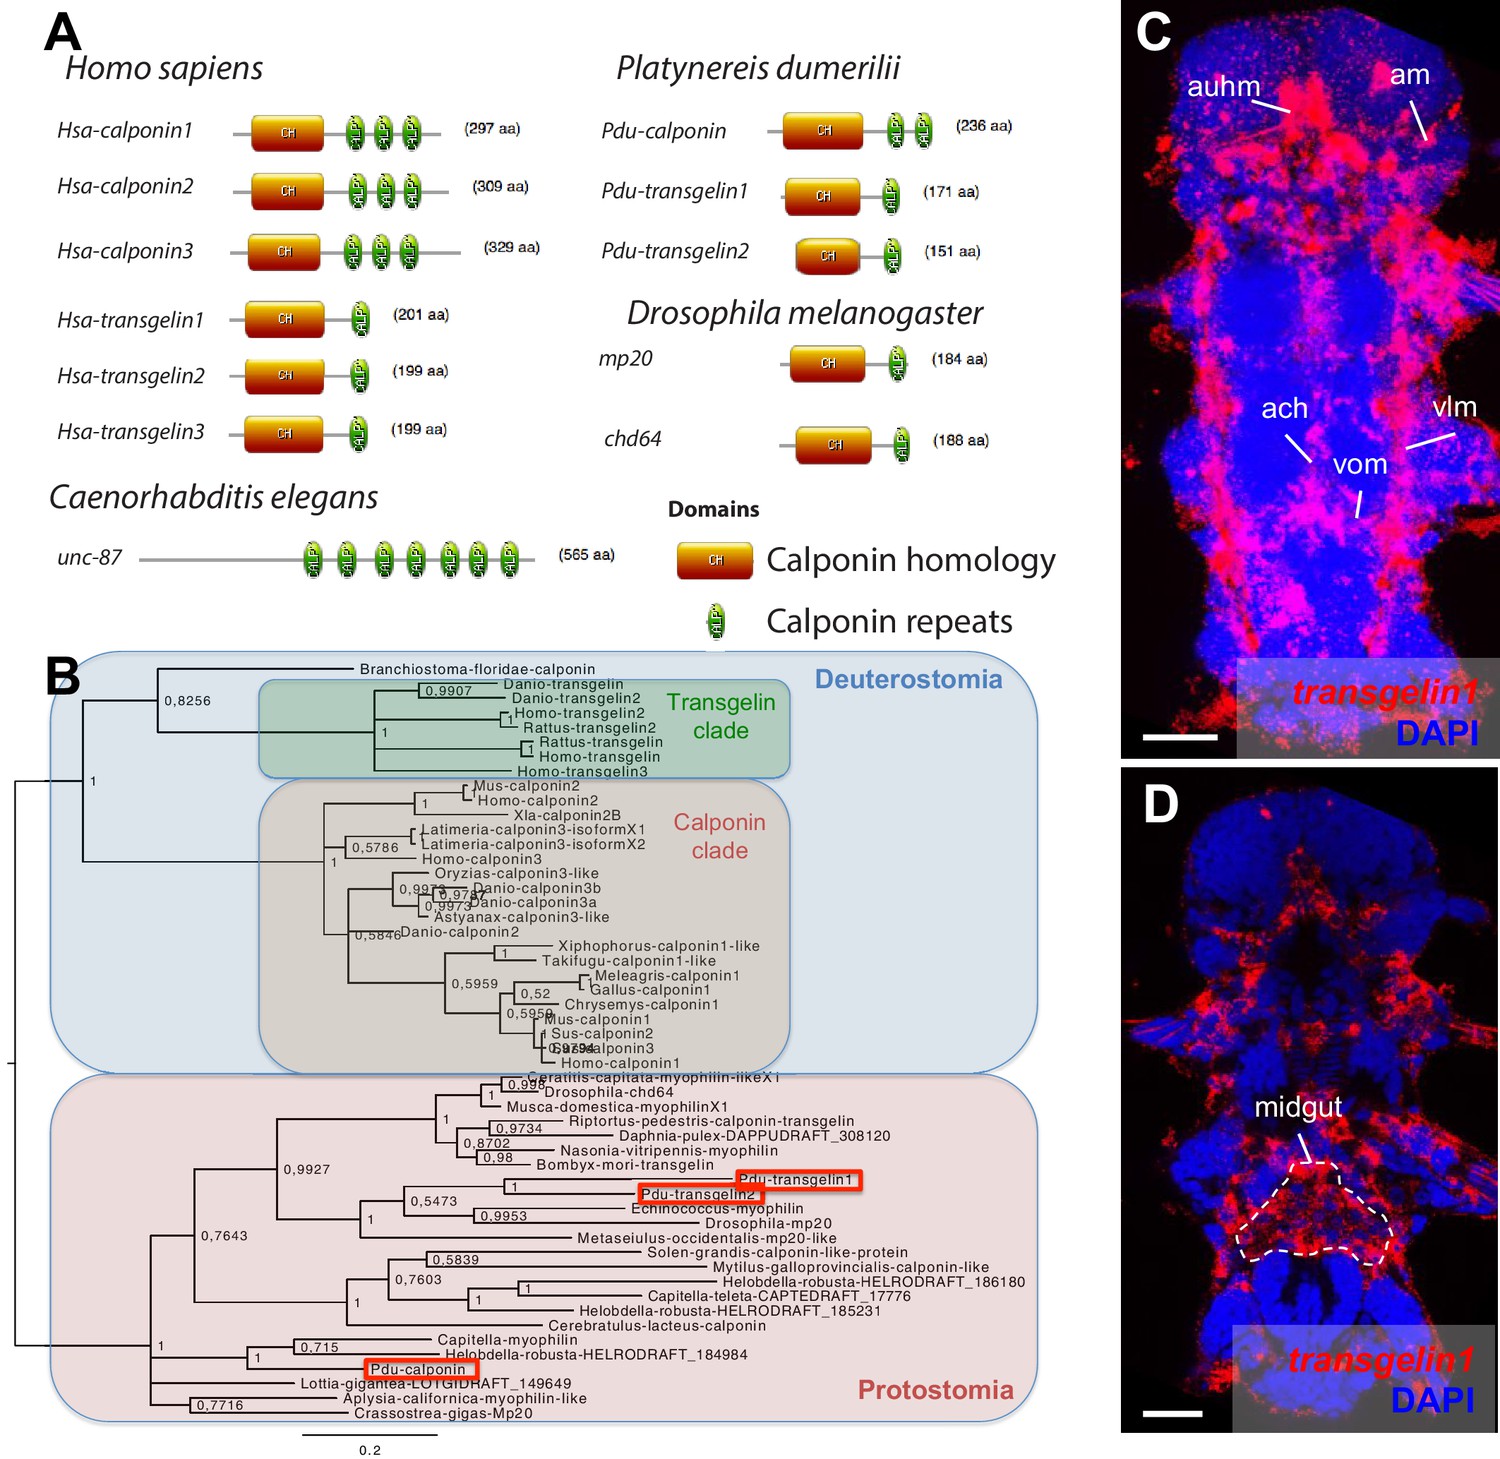
Domain structure, phylogeny and expression patterns of members of the calponin gene family.
(A) Domain structure of calponin-related proteins in bilaterians. Calponin is characterized by a Calponin Homology (CH) domain with several calponin repeats, while Transgelin is characterized by a CH domain and a single calponin repeat. In vertebrates, Calponin proteins are specific smooth muscle markers, and the presence of multiple CH repeats allows them to stabilize actomyosin (Gimona et al., 2003). Transgelins, with a single calponin repeat, destabilize actomyosin (Gimona et al., 2003), and are expressed in other cell types such as podocytes (Gimona et al., 2003), lymphocytes (Francés et al., 2006), and striated muscles (transiently in mice [Li et al., 1996] and permanently in fruit flies [Ayme-Southgate et al., 1989]). (B) Maximum Likelihood phylogeny of the calponin/transgelin family based on alignment of the CH domain. Paralogs with calponin and transgelin structures evolved independently in vertebrates and Platynereis (Pdu, in red squares). (C) Expression patterns of Pdu-transgelin1. Scale bar: 25 μm. As in vertebrates and insects, transgelin1 is not smooth myocyte-specific, but also detected in striated myocytes.
Videos
Video 1
Live imaging of somatic muscle contraction visualized by GCaMP6s.
Dorsal view of a three dpf Platynereis larva injected (at the zygote stage) with a mRNA encoding GCaMP6s and mounted in 3% LMP agar between a slide and a cover slip. Anterior side is up. Left side is the red (GCaMP6s) fluorescence channel, right side shows overlay of transmitted light and red fluorescence channel. Time step between two frames: 0.436 s.
Video 2
Live imaging of visceral muscle contraction visualized by FM-464FX.
Ventral view of a six dpf Platynereis larva stained with the vital dye FM-464FX and mounted in 3% LMP agar between a slide and a cover slip. Red fluorescence signal is shown. Anterior side is up. Time step between two frames: 1.29 s.
Video 3
Live imaging of gut peristalsis in a control 2-month-old juvenile worm.
Lateral view of an individual stained with FM-464FX and mounted in 3% LMP agar between a slide and a cover slip. Left side is the transmitted light signal and right side is the red fluorescence channel. Note the peristalsis waves travelling along the gut, interrupted with rest periods.
Video 4
Live imaging of gut peristalsis in a Brefeldin-A-treated 2-month-old juvenile worm.
Ventral view of an individual treated with 180 μM Brefeldin-A, stained with FM-464FX (not shown) and mounted in 3% LMP agar between a slide and a cover slip. Transmitted light signal is shown. Note the vigorous and constant gut peristalsis waves travelling along the gut. The straight posture of the animal (compare with its bent control sibling in Video 3) is an effect of somatic muscle inhibition by Brefeldin-A.
Additional files
-
Supplementary file 1
Phylogenetic trees of the markers investigated.
(A) Simplified Maximum Likelihood (ML) tree for Myosin Regulatory Light Chain (full tree in panel M), rooted with Calmodulin, which shares an EF-hand calcium-binding domain with MRLC. (B) ML tree for FoxF, rooted with FoxQ1, the probable closest relative of the FoxF family (Shimeld et al., 2010). (C) MrBayes tree for bilaterian ZASP/LBD3, rooted with the cnidarian ortholog (Steinmetz et al., 2012). (D) ML tree for bilaterian Myosin Heavy Chain, rooted at the (pre-bilaterian) duplication between smooth and striated MHC (Steinmetz et al., 2012). (E) MrBayes tree for Mef2, rooted by the first splice isoform of the cnidarian ortholog (Genikhovich and Technau, 2011). (F) MrBayes tree for Titin, rooted at the protostome/deuterostome bifurcation (Titin is a bilaterian novelty). (G) MrBayes tree for Troponin T, rooted at the protostome/deuterostome bifurcation (Troponin T is a bilaterian novelty). (H) MrBayes tree for Troponin I, rooted by the Calponin/Transgelin family, which shares an EF-hand calcium-binding domain with Troponin I. (I) MrBayes tree for MyoD, rooted at the protostome/deuterostome bifurcation (MyoD is a bilaterian novelty). (J) MrBayes tree for Myocardin, rooted at the protostome/deuterostome bifurcation (the Drosophila myocardin ortholog is established [Han et al., 2004]). (K) Complete MRLC tree. Species names abbreviations: Pdu: Platynereis dumerilii; Xenla: Xenopus laevis; Mus: Mus musculus; Hsa: Homo sapiens; Dre: Danio rerio; Gga: Gallus gallus; Dme: Drosophila melanogaster; Cte: Capitella teleta; Patvu: Patella vulgata; Brafl: Branchiostoma floridae; Nve or Nemv: Nematostella vectensis; Acdi: Acropora digitifera; Expal: Exaiptasia pallida; Rat: Rattus norvegicus; Sko: Saccoglossus kowalevskii; Limu or Lpo: Limulus polyphemus; Trib or Trca: Tribolium castaneum; Daph: Daphnia pulex; Prcau: Priapulus caudatus; Cgi or Cgig: Crassostrea gigas; Ling or Linan: Lingula anatina; Hdiv: Haliotis diversicolor; Apcal or Aca: Aplysia californica; Spu: Strongylocentrotus purpuratus; Poli or Polis: Polistes dominula; Cin or Cint: Ciona intestinalis; Hro: Helobdella robusta; Bos: Bos taurus; Capsa: Capsaspora owczarzaki; Thtr: Thecamonas trahens; Lpo:; Bga: Biomphalaria glabrata; Cel: Caenorhabditis elegans; Tt: Terebratalia transversa; Octo: Octopus vulgaris; Sma: Schmidtea mediterranea; Bbe: Branchiostoma belcheri, Batden: Batrachochytrium dendrobaditis; Monve: Mortierella verticillata; Alloma: Allomyces macrogynus; Salpun: Spizellomyces punctatus; Mucor: Mucor racemosus; Lichco: Lichtheimia corymbifera; Ephmu: Ephydatia muelleri; Sycon: Sycon ciliatum; Amqu: Amphimedon queenslandica; Osc: Oscarella lobularis; Metse: Metridium senile; Pfu: Pinctada fucata; Rypa: Riftia pachyptila; Plma: Placopecten magellanicus; Air: Argopecten irradians; Scolop: Scolopendra gigantea; Artfra: Artemia franciscana; Bmor: Bombyx mori; Loa: Loa loa; Necator-am: Necator americanus; Trichi: Trichinella spiralis; Asc: Ascaris lumbricoides; Wuch: Wucheria bancrofti; Ancy: Ancylostoma duodenale; Callorinc: Callorhinchus milii; Dana: Danaus plexippus; Anop: Anopheles gambiae; Asty: Astyanax mexicanus; Oreo: Oreochromis niloticus; Icta: Ictalurus punctatus.
- https://doi.org/10.7554/eLife.19607.025
Download links
A two-part list of links to download the article, or parts of the article, in various formats.
Downloads (link to download the article as PDF)
Open citations (links to open the citations from this article in various online reference manager services)
Cite this article (links to download the citations from this article in formats compatible with various reference manager tools)
The evolutionary origin of bilaterian smooth and striated myocytes
eLife 5:e19607.
https://doi.org/10.7554/eLife.19607


