Structural and biochemical analyses of the DEAD-box ATPase Sub2 in association with THO or Yra1
- Howard Hughes Medical Institute, The Rockefeller University, United States
Figures
Figure 1 with 2 supplements

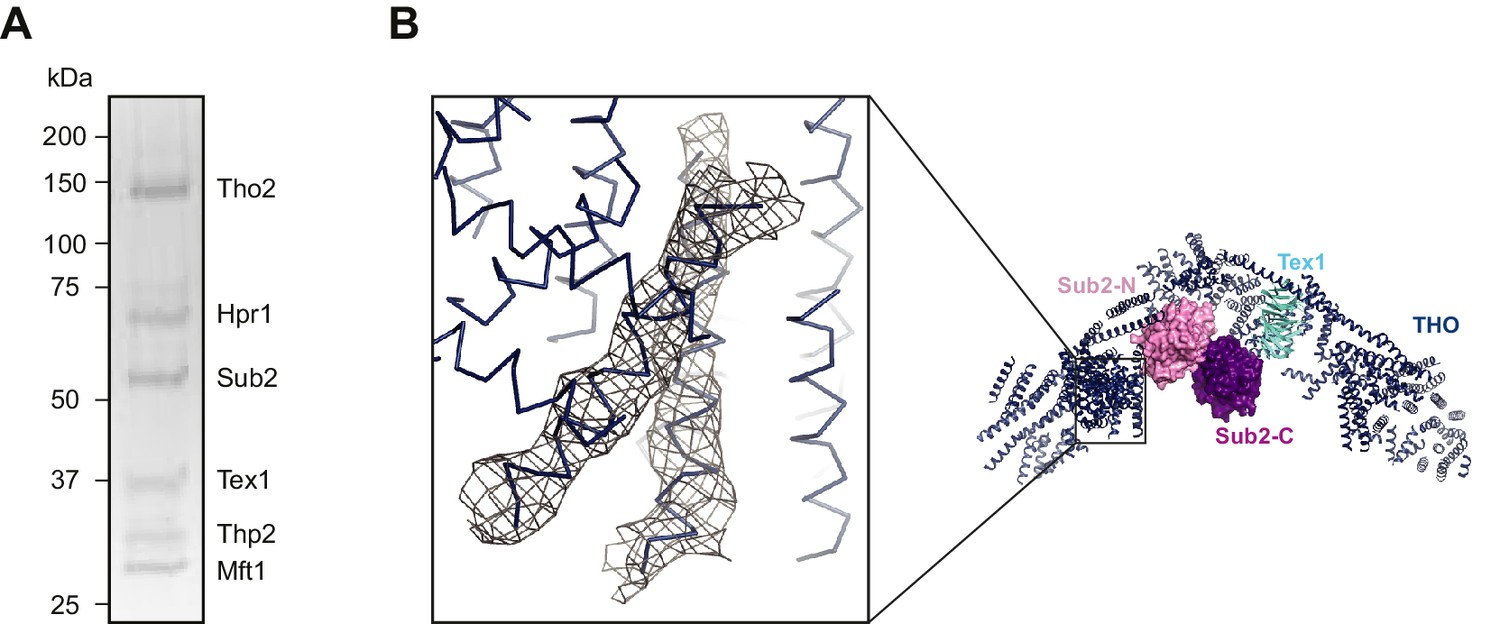
Structural overview of the THO*•Sub2 complex.
(A) Schematic representation of THO and Sub2. Recombinant protein fragments that were used for crystallization are indicated by bars. The THO core complex (THO*) contains S. cerevisiae Tho2, Hpr1, Mft1, and Thp2, as well as S. bayanus Tex1 (81% sequence identity with S. cerevisiae Tex1). The DEAD-box ATPase Sub2 contains two recombinase A (RecA)-like domains labeled as Sub2-N and Sub2-C. (B) Coomassie-stained SDS-polyacrylamide gel electrophoresis (PAGE) of purified THO* complex and full-length Sub2. (C) Three views of the THO*•Sub2 complex with THO* in a cartoon representation and Sub2 in a surface representation. (D) Experimental electron density map of Sub2 after density modification, contoured at 1.0σ level corresponding to the view of the upper left panel in C.
Figure 1—figure supplement 1
Crystallization of the THO*•Sub2 complex.
(A) Silver-stained SDS-PAGE analysis of washed crystals of the THO*•Sub2 complex, indicating the presence of stoichiometric amounts of each subunit. (B) Omit 2Fo-Fc electron density map of the THO*•Sub2 complex calculated by rigid body refinement of the model omitting two helices of THO*. Only density in the vicinity of the omitted helices is shown. The map is contoured at 1.0σ. The region of the omit map is indicated by the box on the right side overall view.
Figure 1—figure supplement 2

Subunit architecture of THO.
(A) Negative stain EM localization of THO subunits using N-terminal or C-terminal MBP tags. Four representative class averages are shown for each MBP tagged complex; one class average of the untagged THO* in the same orientation is shown as a control. The tag position is indicated by an arrowhead in each class average. Each box is approximately 44 × 44 nm. (B) Subunit localization indicated in the low-pass filtered THO* structure at 40 Å (Tang et al., 2007), according to A.
Figure 2 with 3 supplements
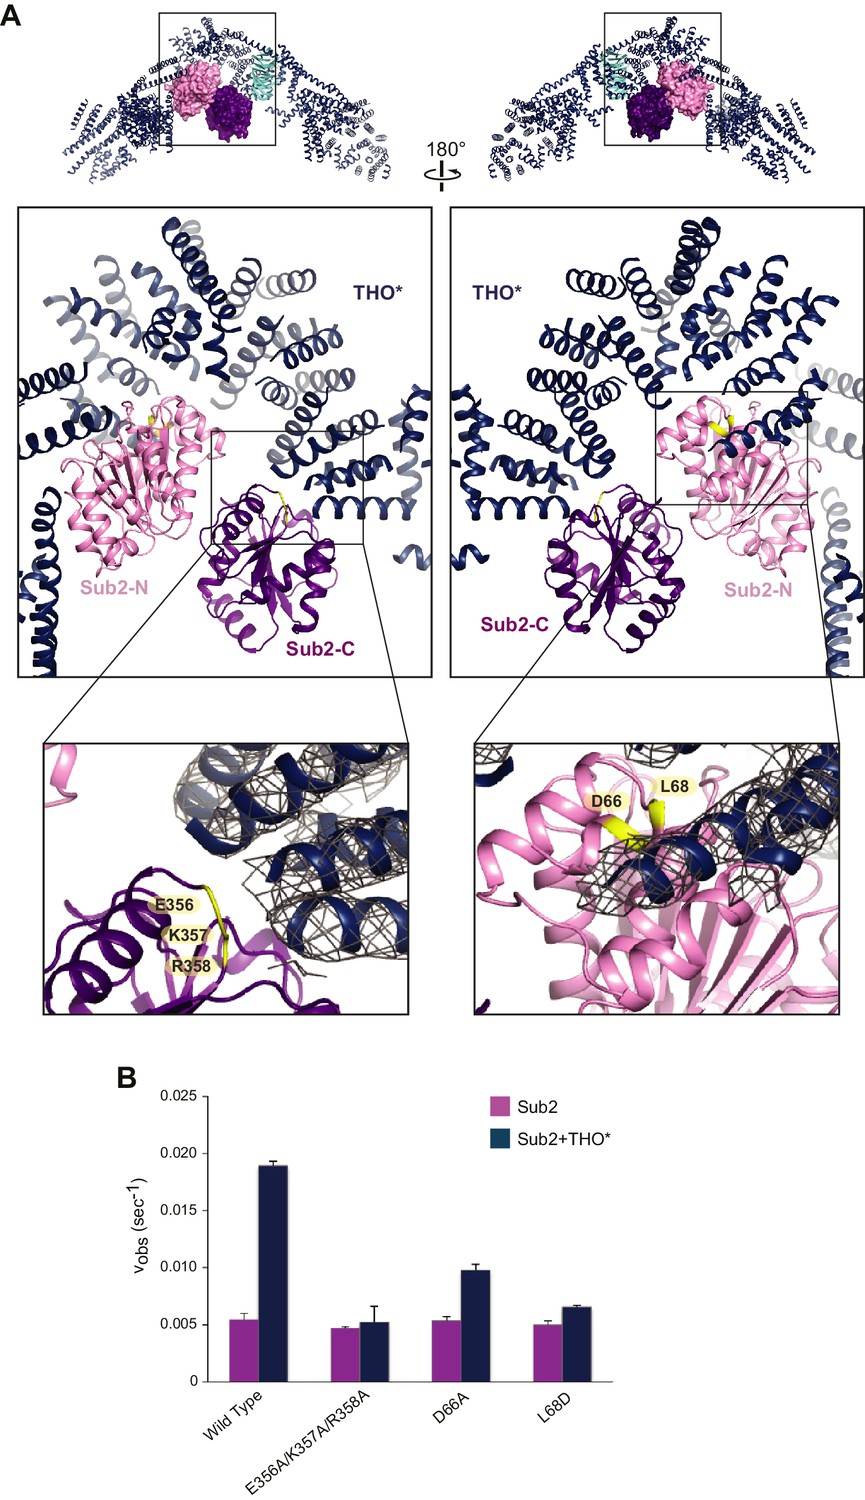
Structural basis of Sub2 stimulation by the THO complex.
(A) THO* binding induces a half-open conformation of Sub2. The upper panels indicate the positions of corresponding middle panels within the THO*•Sub2 complex. The Tex1 subunit of THO* does not contact Sub2 and is omitted in the middle panels for clarity. Interacting residues of Sub2, which have been subjected to mutagenesis in B, are highlighted in green. The lower panel close-up views show the experimental density map of THO* after density modification, contoured at 1.5σ level. (B) Disruption of the THO*-Sub2 interaction compromises the stimulation of Sub2 ATPase activity (mole of ADP produced per second per mole of Sub2) by THO*. Error bars represent standard deviation of three independent experiments.
Figure 2—figure supplement 1
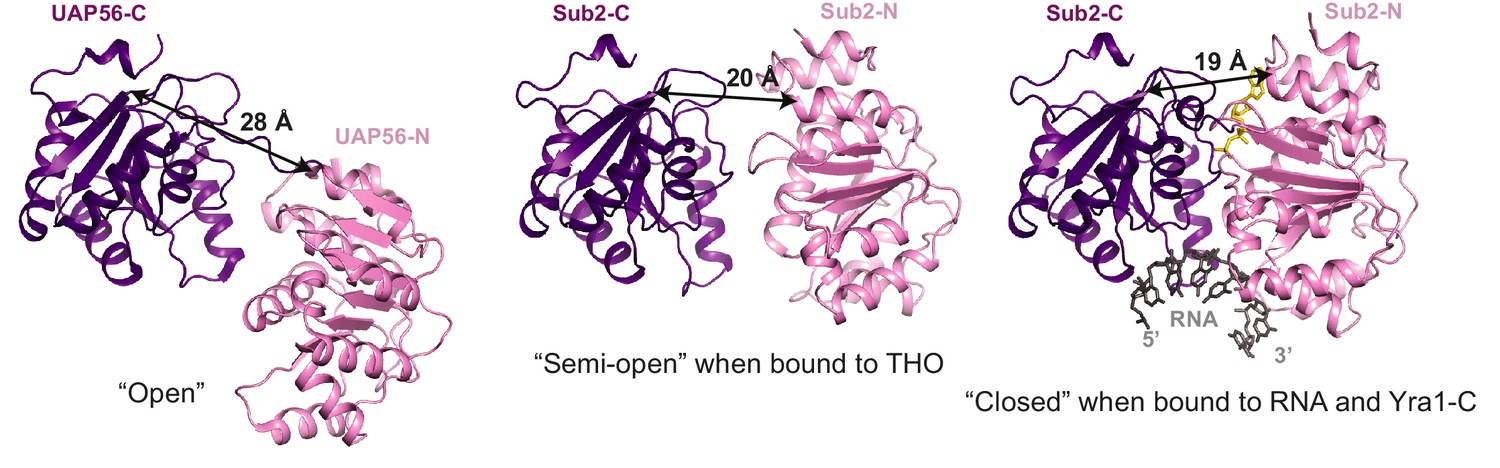
Different conformations of Sub2 during the ATP hydrolysis cycle.
Difference in the conformation of the ATPase in a nucleotide-free ‘open’ state (PDB 1XTI) as compared to a ‘semi-open’ state when bound to THO (Figure 1C, THO is omitted) and to a ‘closed’ state when bound to RNA and Yra1-C (Figure 3B, Yra1-C is omitted). The structures are viewed in the same orientation after alignment of the C-terminal RecA domain of the ATPase. The arrows indicate the distance between Leu281 and Glu87 of Sub2 or between equivalent residues of its human homolog UAP56.
Figure 2—figure supplement 2
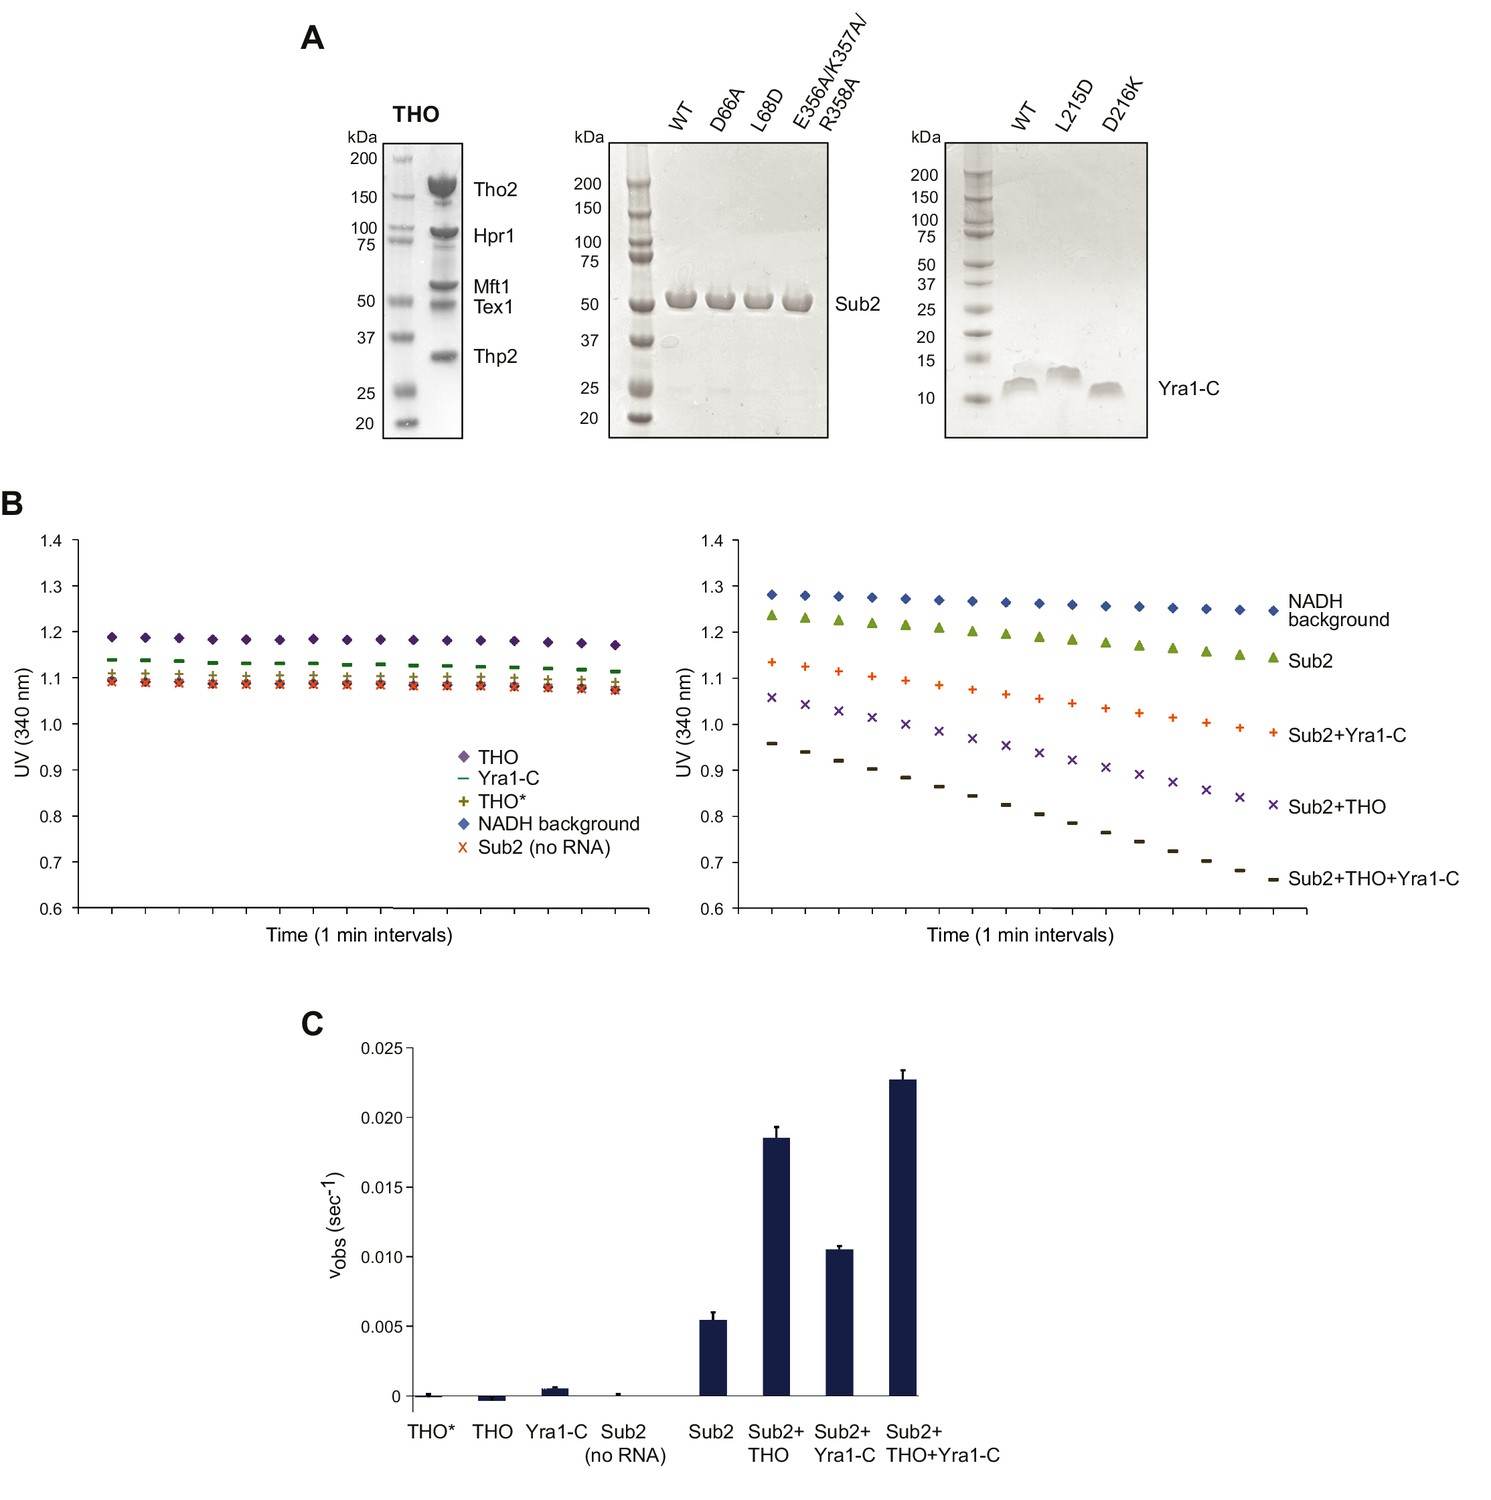
THO and Yra1-C jointly regulate the ATPase activity of Sub2.
(A) SDS-PAGE of the assembled full-length S. cerevisiae THO complex, as well as various Sub2 and Yra1 proteins used in biochemical assays. (B) UV readings at 340 nm (lightpath corrected) during the ATPase assay. The rate of background NADH decomposition was later subtracted to calculate the ATP hydrolysis rate. (C) THO and Yra1-C cumulatively accelerated the ATP hydrolysis rate of Sub2. Error bars represent standard deviation of three independent experiments. The reaction rates for Sub2 alone and for Sub2 in the presence of Yra1-C are the same as those in Figure 4B.
Figure 2—figure supplement 3

Structural comparison of THO*•Sub2 to Gle1•Dbp5, eIF4G•eIF4A, and CNOT1•DDX6.
Comparison of THO*•Sub2 with Gle1•Dbp5 (PDB 3RRN), eIF4G•eIF4A (PDB 2VSO), and CNOT1•DDX6 (PDB 4CT4) suggests a general binding mode between DEAD-box ATPases and their activators. The structures are viewed in the same orientation after alignment of the C-terminal RecA domain of the ATPases.
Figure 3 with 2 supplements
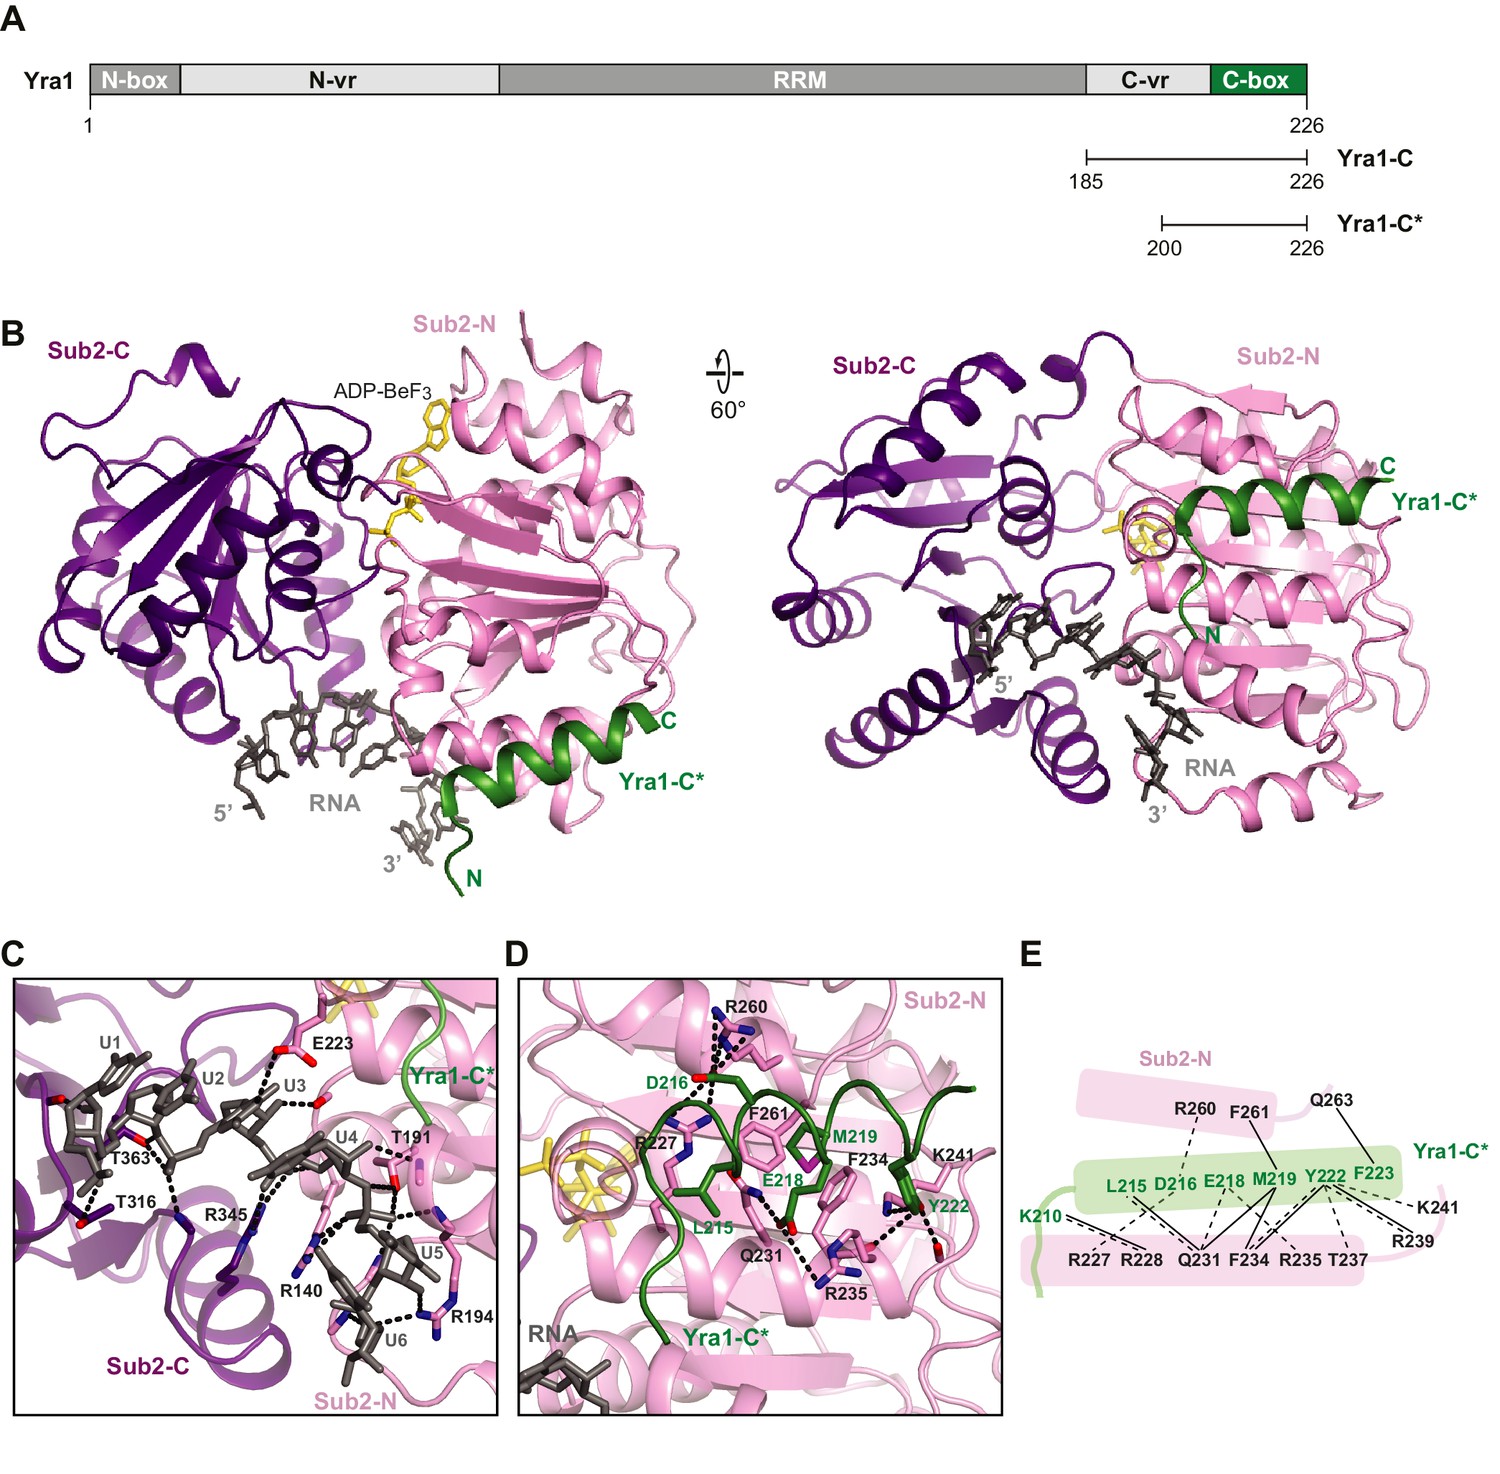
Crystal structure of the Sub2•Yra1-C*•RNA complex.
(A) Schematic representation of Yra1. Yra1-C and Yra1-C* were used for biochemical assays and crystallization studies, respectively. (B) Cartoon representation of the Sub2•Yra1-C*•RNA complex in two orientations. (C and D) Details of the Sub2-RNA and Sub2-Yra1 interactions, corresponding to the view in the right panel in B. The polar interaction network is indicated by black dashes. (E) Schematic representation of the Sub2-Yra1 interactions. Black dashes indicate polar interactions. Black lines indicate van der Waals interactions.
Figure 3—figure supplement 1
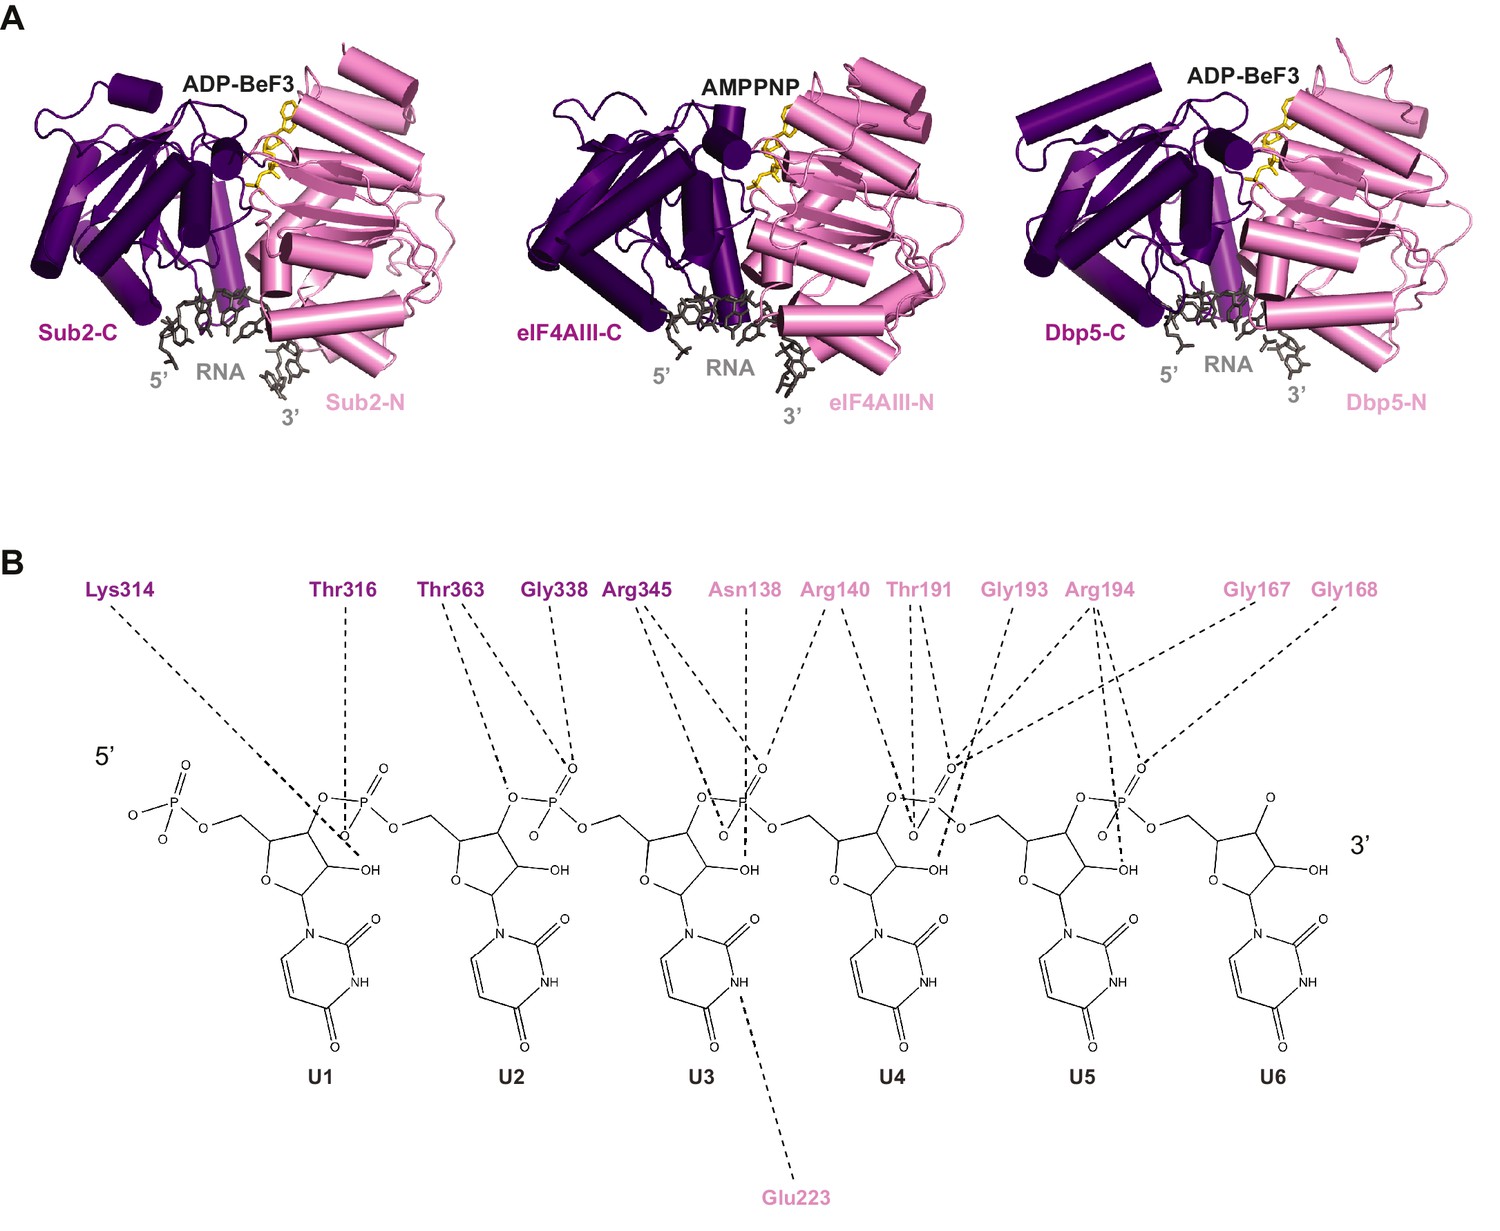
Comparison of RNA binding by DEAD-box proteins.
(A) Alignment of Sub2•RNA with eIF4AIII•RNA (PDB 2 J0S) and Dbp5•RNA (PDB 3FHT) indicates a conserved mechanism of RNA recognition by DEAD-box proteins. (B) Schematic drawing of the polar interactions between Sub2 and RNA.
Figure 3—figure supplement 2

Multispecies sequence alignment of Yra1-C.
Overall sequence conservation at each position is shaded from light gray (60% similarity) to black (100% identity). Numbering of the residues is according to yeast Yra1. The secondary structure as shown in Figure 3B is indicated above the sequence as rectangle (α-helix), line (coil region), and dots (disordered residues).
Figure 4

Sub2 and Yra1 cooperatively bind to RNA.
(A) Effect of Yra1 on the RNA binding properties of Sub2. An electrophoretic mobility shift assay was carried out with a fluorescently labeled poly(U) 20-mer RNA. Note that the Sub2•RNA complex (marked with a star) migrated slightly faster than the Sub2•Yra1-C•RNA complex. (B) Disruption of either Yra1-Sub2 or Yra1-RNA interaction compromises the stimulation of Sub2 ATPase activity by Yra1. Error bars represent standard deviation of three independent experiments. The reaction rate for Sub2 alone is the same as that in Figure 2B. (C) Schematic representation of the interaction between Sub2, Yra1-C, and RNA. The arrow indicates a potential interaction between the C-vr region of Yra1 and RNA, based on biochemical studies in A and the position of C-box in the Sub2•Yra1-C*•RNA structure.
Figure 5
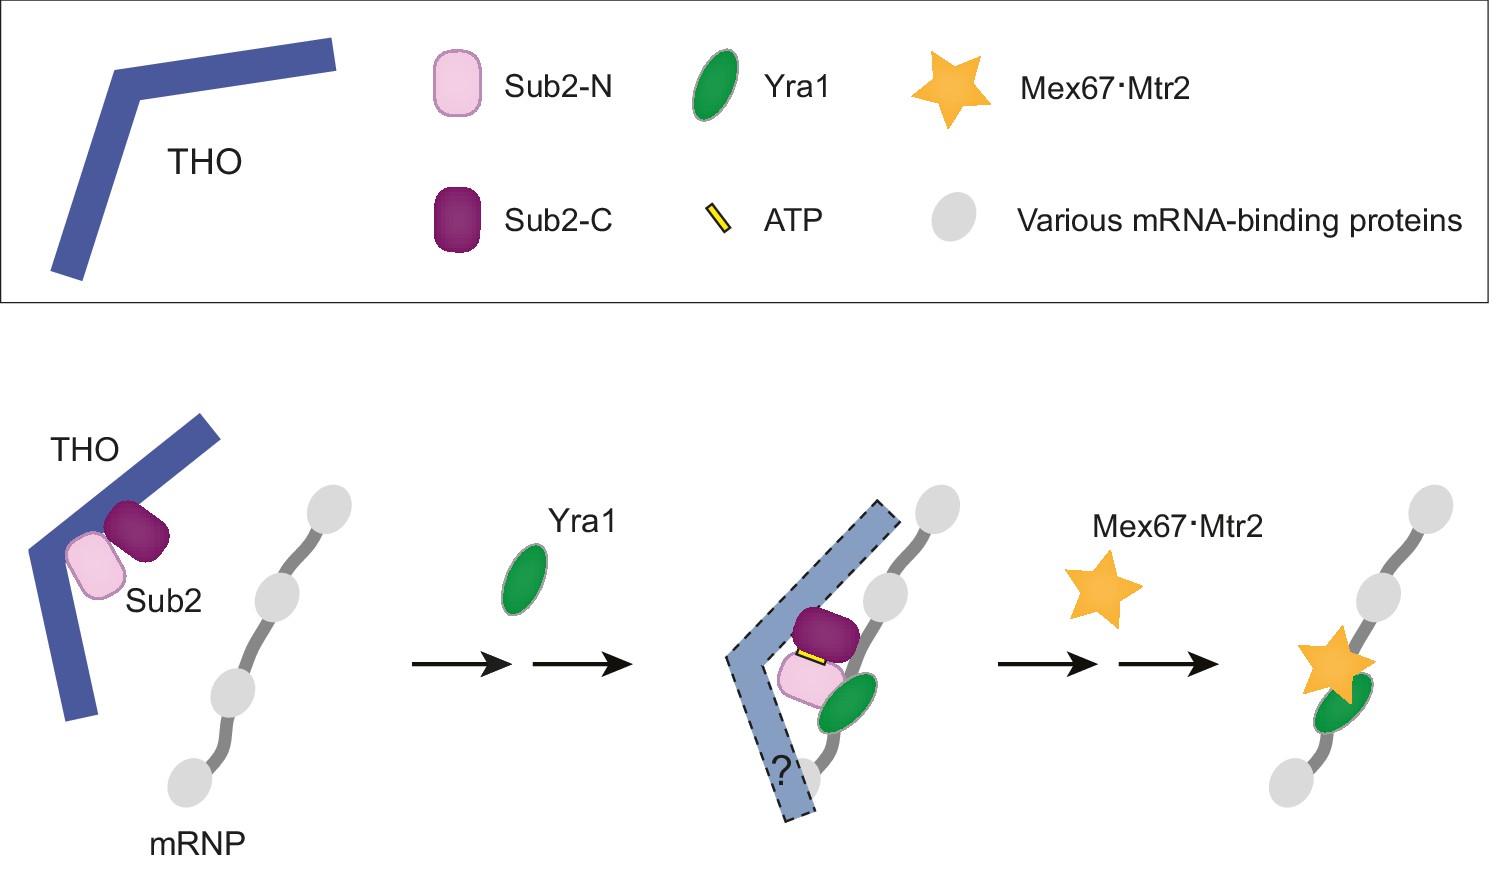
A working model of TREX-mediated mRNP remodeling prior to nuclear export.
THO recognizes some landmarks of properly processed mRNP, primes Sub2 in a semi-open configuration and mediates targeted deposition of Sub2 and Yra1 onto the mRNP. Next, THO and Yra1 assist in loading of the export receptor Mex67•Mtr2, thereby initiating a series of obligatory reactions for mRNP nuclear export.
Tables
Table 1
Data collection and refinement statistics for the structure of the THO*•Sub2 complex.
W-I | W-II | W-III | Ta-I | Ta-II | |
|---|---|---|---|---|---|
Data collection | |||||
Space group | P21 | P21 | P21 | P21 | P21 |
Cell dimensions | |||||
a, b, c (Å) | 152.9, 323.0, 176.8 | 153.3, 319.5, 176.4 | 152.7, 322.2, 175.6 | 153.3, 327.3, 175.2 | 153.3, 328.1, 174.4 |
β (°) | 101.3 | 101.0 | 101.1 | 101.9 | 101.9 |
Wavelength (Å) | 1.2123 | 1.2141 | 1.2141 | 1.2524 | 1.2553 |
Resolution (Å) | 50–6.0 | 50–6.8 | 50–7.2 | 50–7.6 | 50–7.5 |
(6.1–6.0)* | (6.92–6.80)* | (7.32–7.20)* | (7.73–7.60)* | (7.63–7.50)* | |
Rmerge (%) | 14.0 (75.1) | 18.2 (112.7) | 17.7 (87.6) | 11.5 (85.2) | 11.2 (90.5) |
<I / σI> | 13.3 (2.1) | 14.4 (2.7) | 11.5 (2.5) | 17.3 (2.2) | 17.6 (2.1) |
Completeness (%) | 98.8 (94.8) | 89.8 (78.3) | 99.8 (100.0) | 100.0 (100.0) | 100.0 (100.0) |
CC1/2 | 99.3 (68.5) | 99.5 (70.2) | 99.1 (72.8) | 99.7 (77.4) | 99.7 (79.8) |
Redundancy | 6.5 (4.8) | 9.8 (9.7) | 7.1 (7.2) | 6.8 (6.8) | 6.8 (6.8) |
SAD phasing | |||||
Resolution | 50–8.5 | 50–7.5 | 50–8.0 | 50–8.0 | 50–8.0 |
Number of sites | 11 | 19 | 19 | 18 | 18 |
Figure of Merit | 0.41 | 0.45 | 0.46 | 0.45 | 0.45 |
Refinement | |||||
Resolution (Å) | 50–6.0 | ||||
No. reflections | |||||
total | 41038 | ||||
test set | 2078 | ||||
Rwork / Rfree (%) | 43.6/43.4 | ||||
No. atoms | |||||
Protein | 30205 | ||||
Ligand/ion | 583 | ||||
B-factors | 200 | ||||
Ramachandran plot (%) | |||||
Favored/Allowed/Disallowed | 99.4/0.6/0.0 | ||||
R.m.s deviations | |||||
Bond lengths (Å) | 0.010 | ||||
Bond angles (°) | 1.408 |
-
*Highest-resolution shell is shown in parentheses.
Table 2
Data collection and refinement statistics for the structure of the Sub2•Yra1*-C•RNA complex.
Sub2•Yra1-C*•RNA | |
|---|---|
Data collection | |
Space group | P3121 |
Cell dimensions | |
a, b, c (Å) | 99.3, 99.3, 247.5 |
α, β, γ (°) | 90, 90, 120 |
Wavelength (Å) | 0.9792 |
Resolution (Å) | 50–2.6 (2.69–2.60)* |
Rmerge (%) | 16.4 (101.6) |
<I / σI> | 13.3 (2.3) |
Completeness (%) | 100.0 (100.0) |
CC1/2 | 99.4 (72.9) |
Redundancy | 9.9 (8.9) |
Refinement | |
Resolution (Å) | 50–2.6 |
No. reflections | |
total | 44,413 |
test set | 2235 |
Rwork / Rfree (%) | 21.9/26.8 |
No. atoms | |
Protein | 9644 |
RNA | 360 |
Ligand/ion | 96 |
Water | 27 |
B-factors | |
Protein | 56.3 |
RNA | 68.1 |
Ligand/ion | 46.2 |
Water | 34.9 |
Ramachandran plot (%) | |
Favored/Allowed/Disallowed | 97.6/2.4/0.0 |
R.m.s deviations | |
Bond lengths (Å) | 0.007 |
Bond angles (°) | 1.076 |
-
*Highest-resolution shell is shown in parentheses.
Download links
A two-part list of links to download the article, or parts of the article, in various formats.
Downloads (link to download the article as PDF)
Open citations (links to open the citations from this article in various online reference manager services)
Cite this article (links to download the citations from this article in formats compatible with various reference manager tools)
Structural and biochemical analyses of the DEAD-box ATPase Sub2 in association with THO or Yra1
eLife 6:e20070.
https://doi.org/10.7554/eLife.20070


