Relief of autoinhibition by conformational switch explains enzyme activation by a catalytically dead paralog
- University of Texas Southwestern Medical Center, United States
- Howard Hughes Medical Institute,University of Texas Southwestern Medical Center, United States
Figures
Figure 1
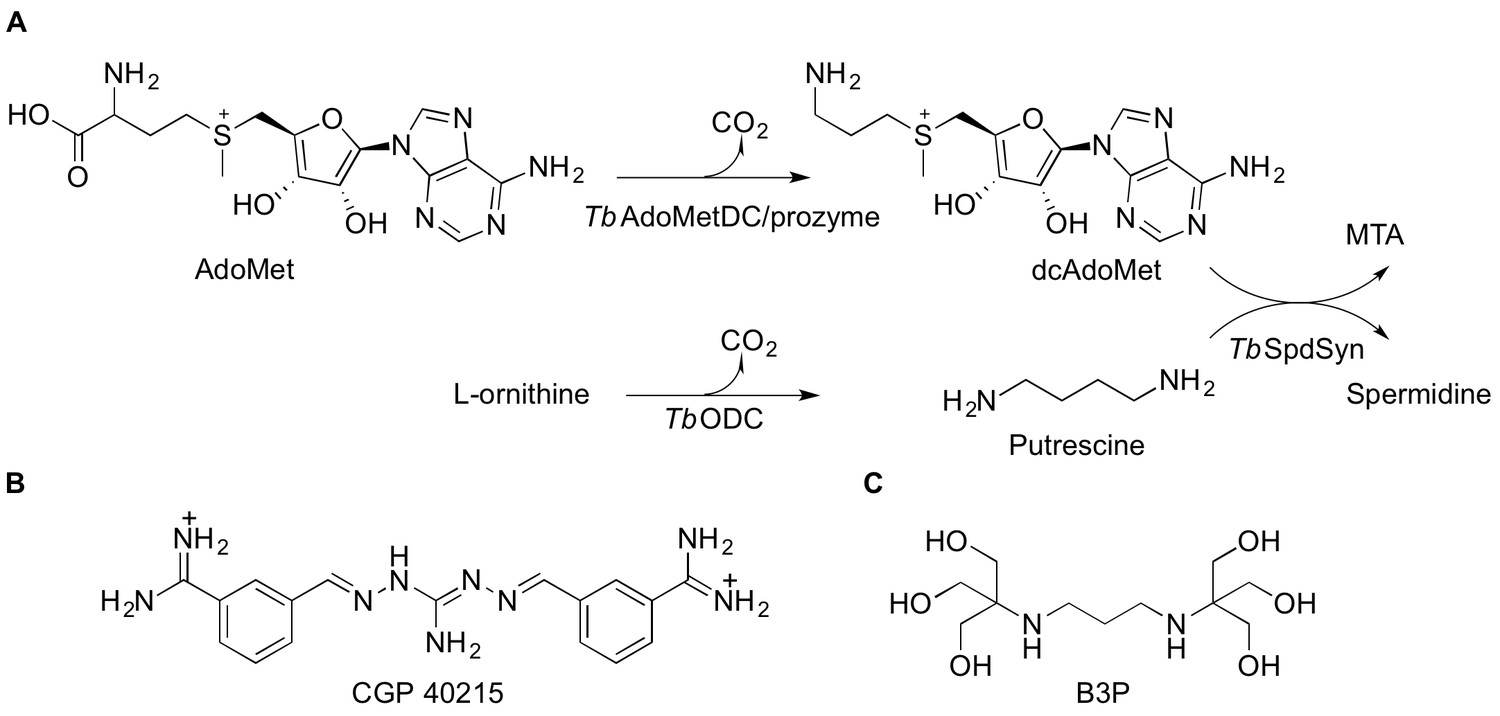
Polyamine biosynthetic pathway and TbAdoMetDC ligands.
(A) Reactions catalyzed by T. brucei S-adenosyl-L-methionine decarboxylase (TbAdoMetDC/prozyme heterodimer), ornithine decarboxylase (TbODC) and spermidine synthase (TbSpdSyn) are shown. AdoMet, S-adenosyl-L-methionine; dcAdoMet, decarboxylated S-adenosyl-L-methionine; MTA, methylthioadenosine. (B) CGP 40215 (CGP) is a competitive inhibitor of AdoMetDC (C) Bis-tris propane (B3P), a buffer component in the TbAdoMetDC/prozyme crystallization solution.
Figure 2 with 1 supplement
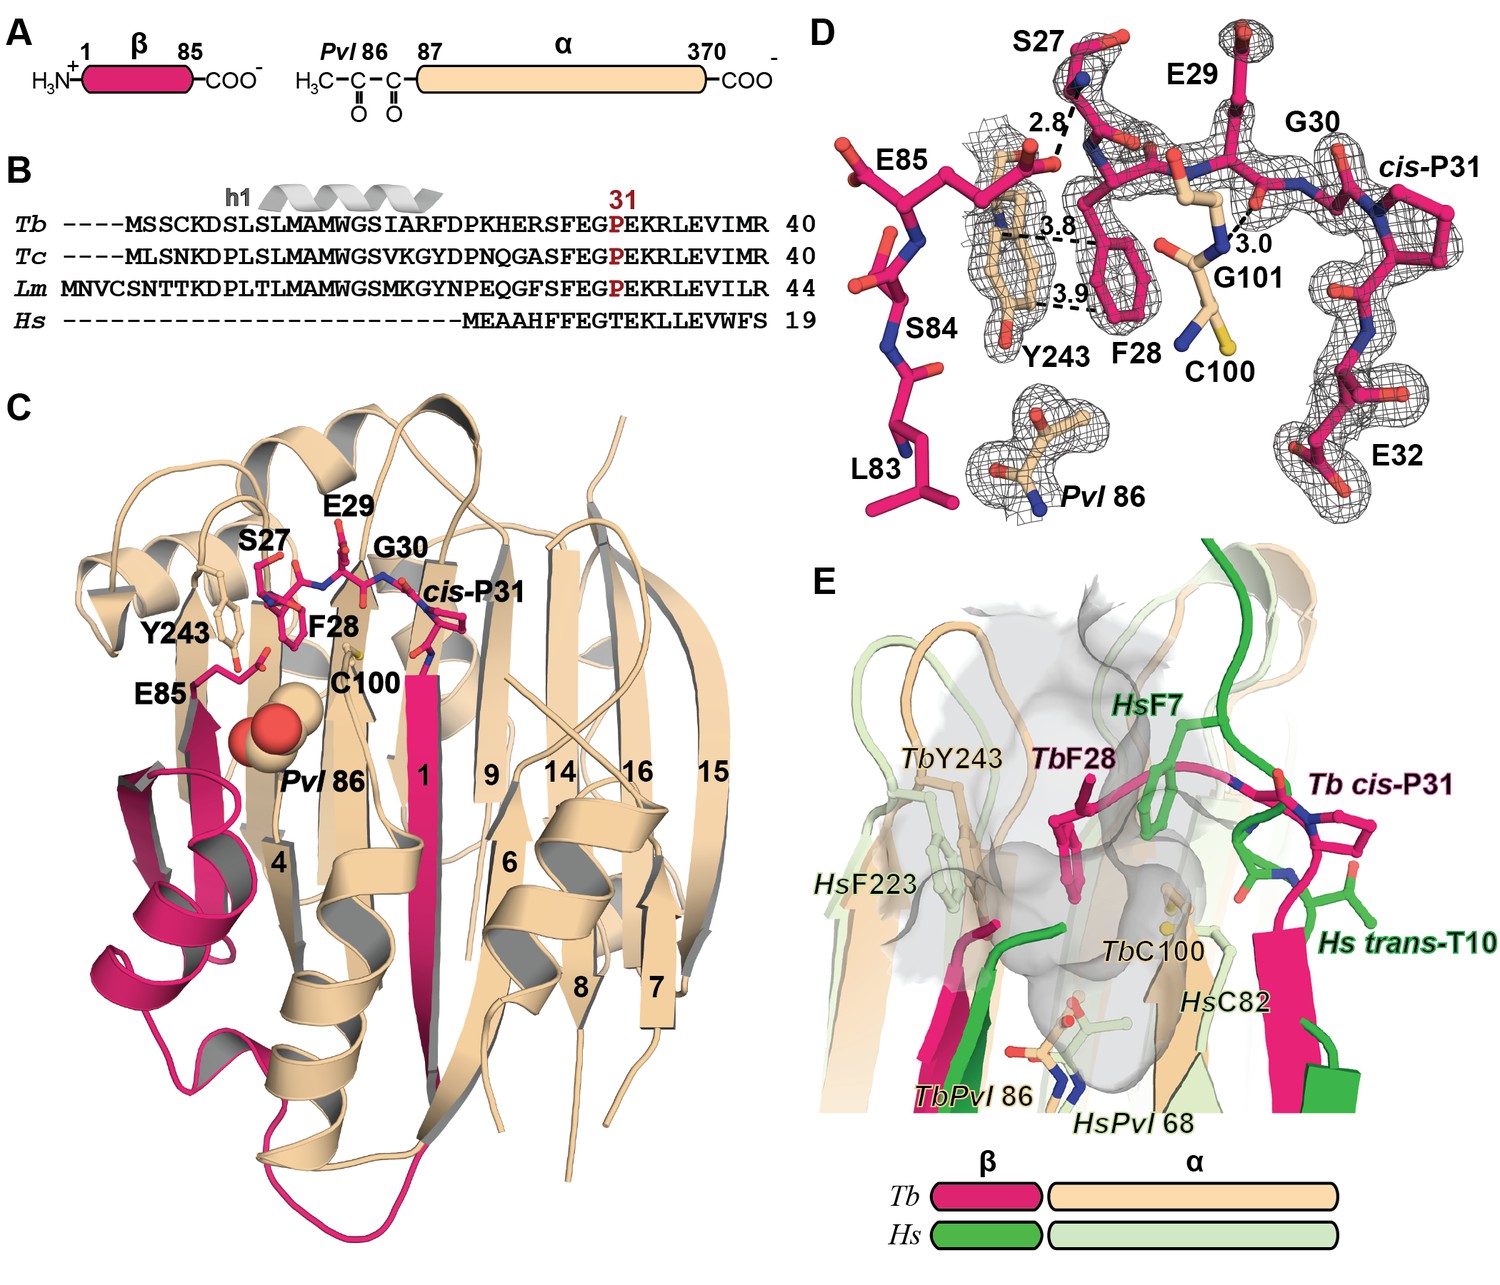
Mechanistic basis for the inactivity of the TbAdoMetDC△26 monomer.
(A) Schematic representation of TbAdoMetDC β-(pink) and α-(beige) chains resulting from autocatalytic serinolysis and pyruvoyl (Pvl86) formation. (B) Sequence alignment of the N-termini of trypanosomatid (Tb, T. brucei; Tc, T. cruzi; and Lm, Leishmania major) and Hs, human, AdoMetDCs. For the complete sequence alignment see Supplementary file 2. (C) Ribbon diagram of TbAdoMetDC△26 (β-chain in pink and α-chain in beige). Select β-strands are numbered. Pvl86 is shown in spheres and select residues in the autoinhibitory sequence and active site as sticks. Atom colors follow standard nomenclature where carbon is the indicated color, nitrogen (blue), oxygen (red) and sulfur (yellow). (D) 2m|Fo−DFc| electron density map of autoinhibitory residues contoured at the 1.2 σ. Dashed lines indicate distances (Å). (E) Active site comparison of TbAdoMetDC△26 and HsAdoMetDC (3DZ6) (β-chain dark green, α-chain light green). HsAdoMetDC active site surface is gray. Structures aligned with an RMSD of 2.6 Å over 277 Cα atoms. For full structural alignment see Figure 2—figure supplement 1.
Figure 2—figure supplement 1
Comparison of T. brucei and human (Hs) AdoMetDC.
Alignment of TbAdoMetDCΔ26 monomer β/α (pink/beige) and HsAdoMetDC β/α (bright green/light green) (PDB access code 1i7M). The HsAdoMetDC putrescine is shown in green spheres and the HsAdoMetDC inhibitor 4-amidinoindan-1-one-2'-amidinohydrazone (AAH) is shown in transparent green spheres. TbAdoMetDCΔ26 contains no ligands. Structures aligned with an RMSD of 2.6 Å over 277 Cα atoms.
Figure 3 with 2 supplements
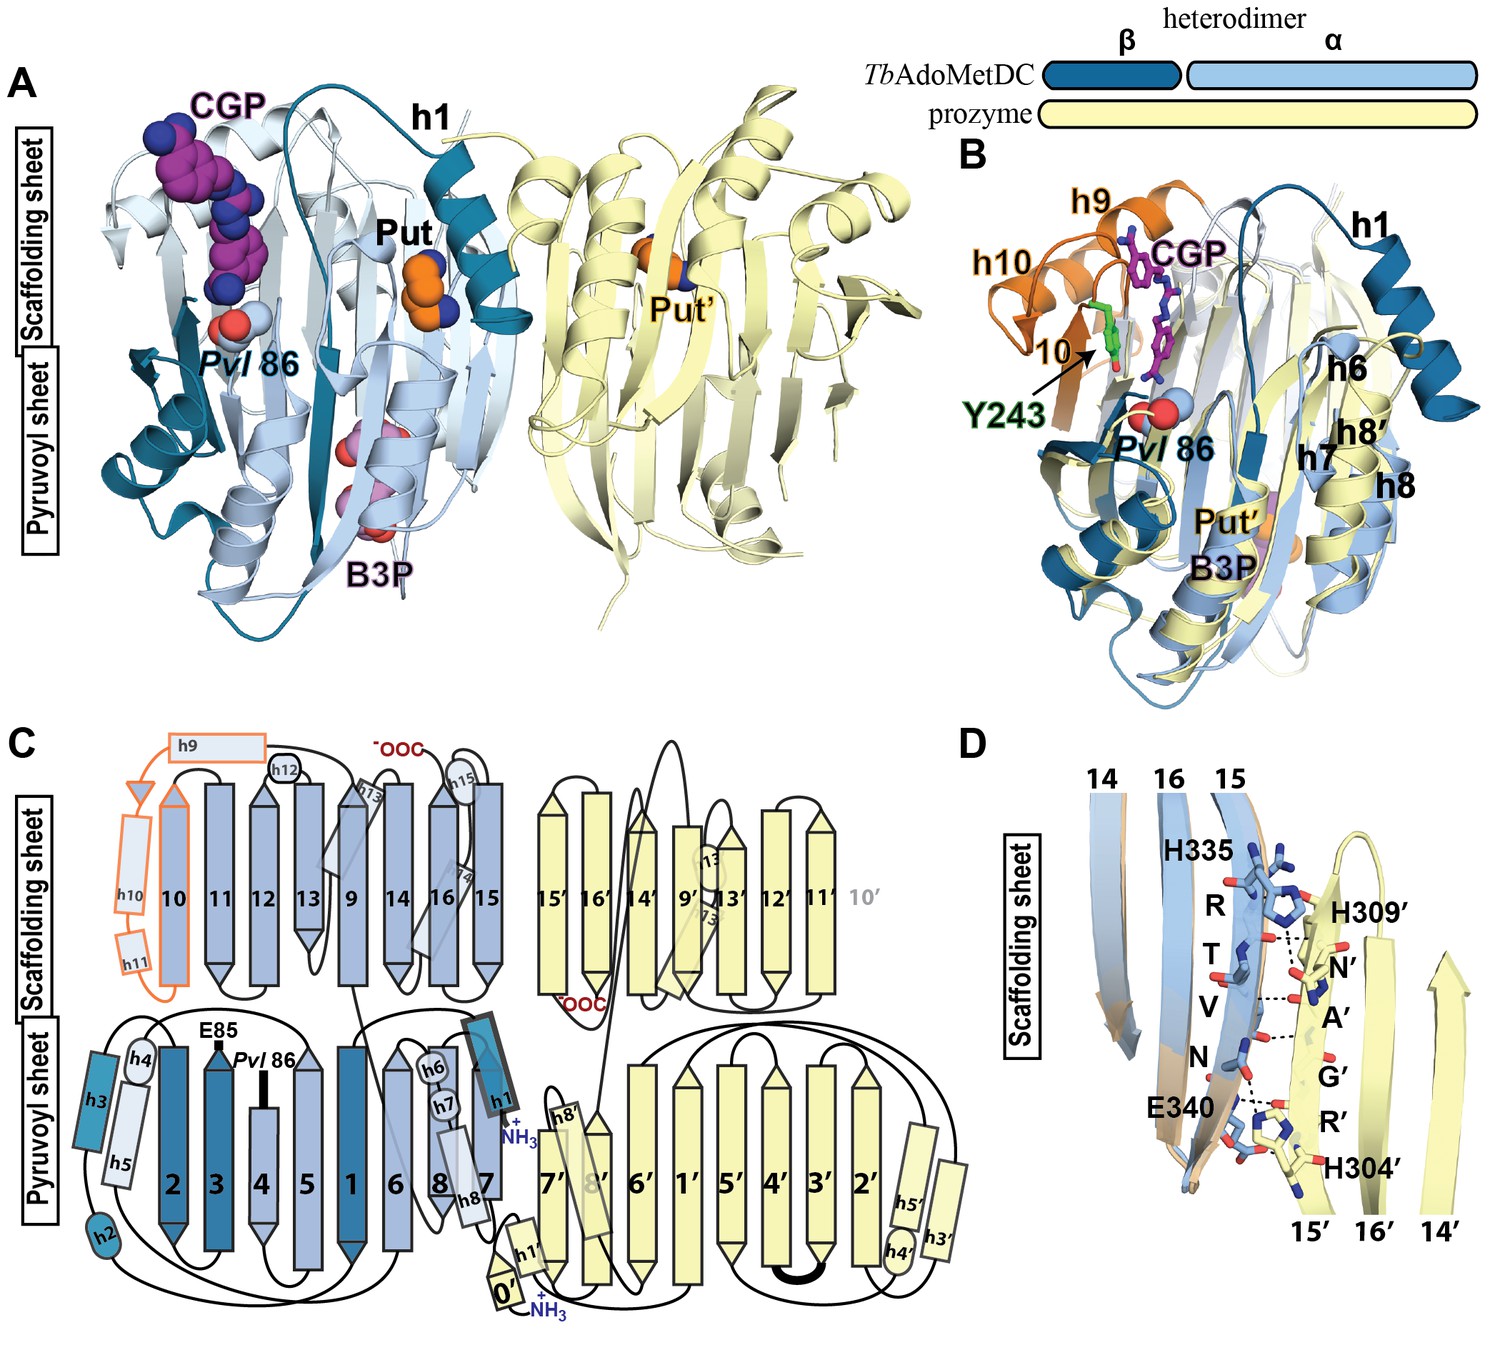
Structural organization of the TbAdoMetDC/prozyme heterodimer.
(A) Ribbon diagram of the CGP-bound heterodimer of TbAdoMetDC (teal (β) and sky blue (α)) and prozyme (yellow). The schematic depicts color codes for the various chains. Ligand colors are as follows: Pvl86 (sky blue), CGP (purple), Put (orange)(AdoMetDC site), Put’ (orange)(prozyme site), and B3P (violet) are shown as spheres. Residues and ligands in prozyme are marked (’). (B) Superposition of TbAdoMetDC and prozyme subunits from the CGP-heterodimer (RMSD = 2.4 Å over 261 Cα atoms). TbAdoMetDC active site helices/strands (residues 202–247) absent from prozyme are colored orange, Y243 (green), CGP (purple), B3P (violet), and prozyme Put' (orange). (C) Schematic representation of the TbAdoMetDC/prozyme heterodimer. Prozyme helices (rectangles) and strands (arrows) were numbered based on structural homology to TbAdoMetDC. (D) Superposition of the scaffolding sheets from TbAdoMetDC△26 and the apo-TbAdoMetDC heterodimer subunit showing main- and side-chain H-bond network (dashed lines) across the dimer interface (overall structures RMSD = 2.1 Å over 310 Cα atoms). For the tetramer structure observed in the asymmetric unit see Figure 3—figure supplement 1 and for the electron density supporting ligand placement see Figure 3—figure supplement 2.
Figure 3—figure supplement 1
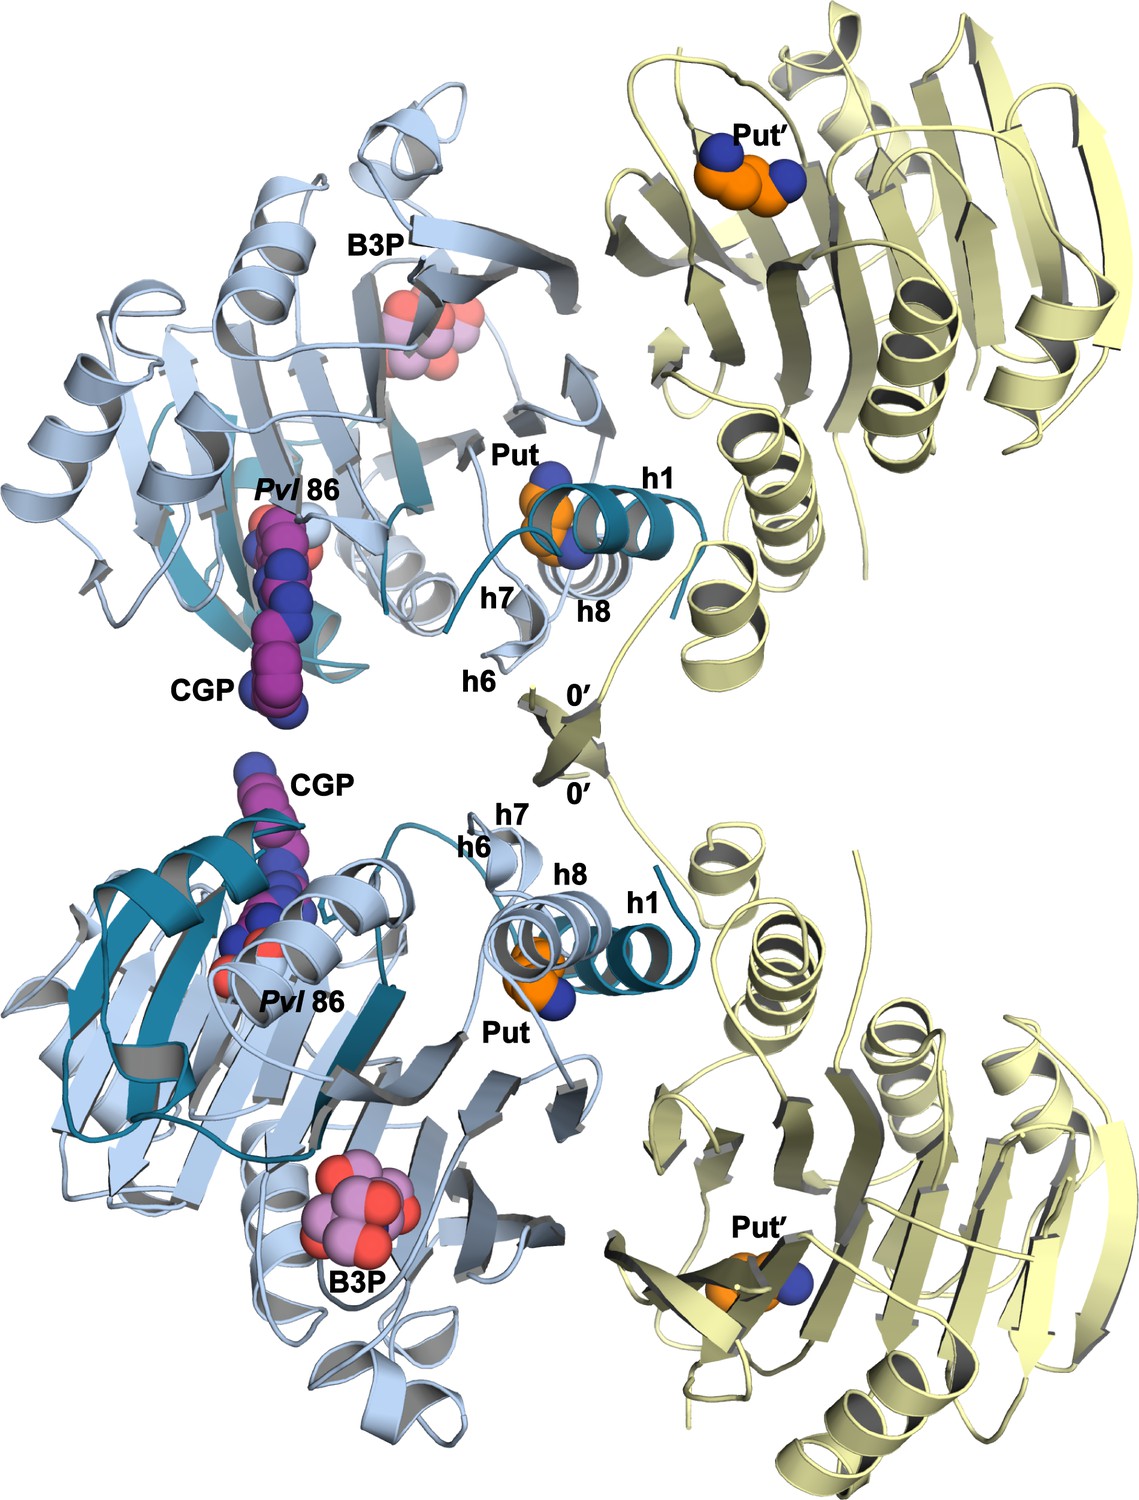
TbAdoMetDC/prozyme tetrameric structure.
The asymmetric unit of CGP 40215-bound TbAdoMetDC/prozyme heterodimer (AdoMetDC β/α (teal/sky blue) and prozyme (yellow)) is shown with pyruvoyl groups (Pvl 86) and ligands as spheres (Put and Put', in orange; B3P, in violet; CGP, in purple). Select TbAdoMetDC helices (h1, h6–h8) and prozyme N-terminal β-strands (0') are marked. The tetramer interface (buried surface area of 2,100 Å2) is formed by the non-crystallographic symmetry related prozyme β-strands β0’ configured as crossed arms (domain swap), with β0’ forming additional interactions with h6 and h6/h7 loop from the opposite TbAdoMetDC. A salt bridge between prozyme R5’ and the TbAdoMetDC residue E148 of h8 within the same dimer is also formed (not shown). The tetramer is not relevant to the solution configuration since TbAdoMetDC/prozyme highest molecular weight species in AUC experiments was a heterodimer (Velez et al., 2013; Willert et al., 2007). The predicted solvation energy gain of burying this surface is small (△G = −10 kcal/mol as calculated by PDBePISA (Krissinel and Henrick, 2007)), again consistent with the insignificance of the tetramer to the solution structure.
Figure 3—figure supplement 2
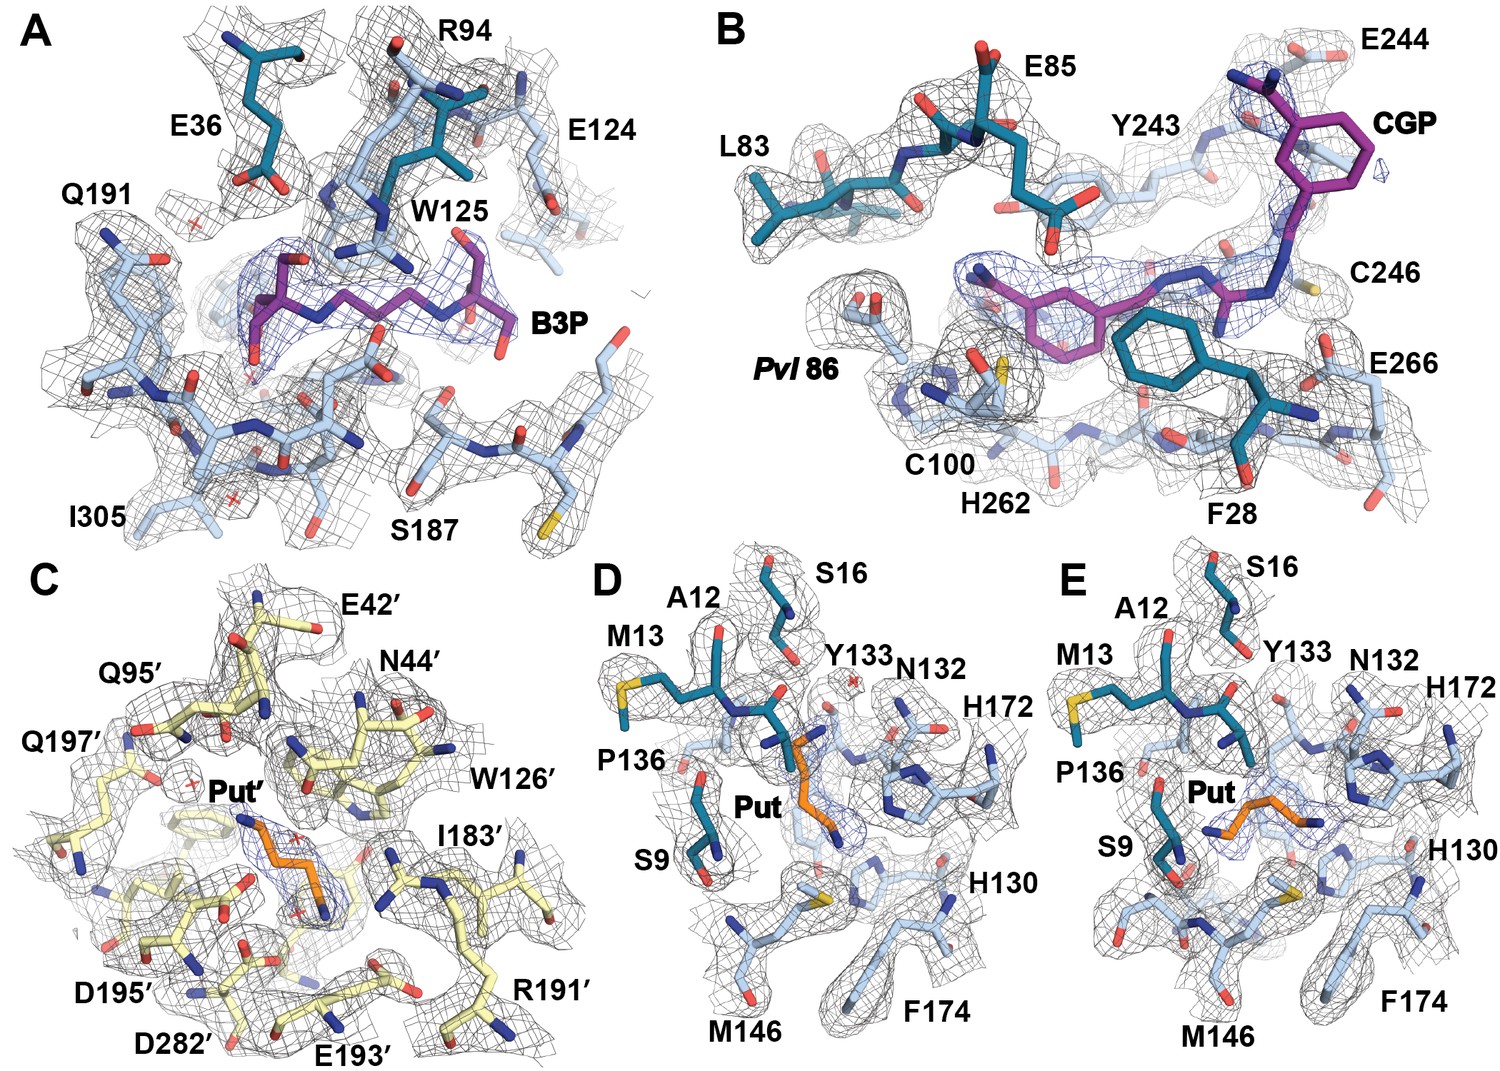
Simulated-annealing composite omit map around ligands in CGP-TbAdoMetDC/prozyme heterodimer.
The electron density map, contoured at 1.0 σ, is shown for a radius of 1.8 Å. The map is color-coded as follows: blue mesh represents density around ligand and gray mesh is density around residues in the binding site within 5 Å of a ligand. The β- and α-chains of TbAdoMetDC are in teal/sky blue, prozyme is in yellow. Select residues are labeled. (A) Bis-tris propane, B3P. (B) CGP 40215, CGP. (C) Putrescine in prozyme, Put'. (D, E). Putrescine, Put, in TbAdoMetDC h1 binding pocket. The two molecules in the asymmetric unit bind Put in alternative conformations (D vs E).
Figure 4 with 2 supplements
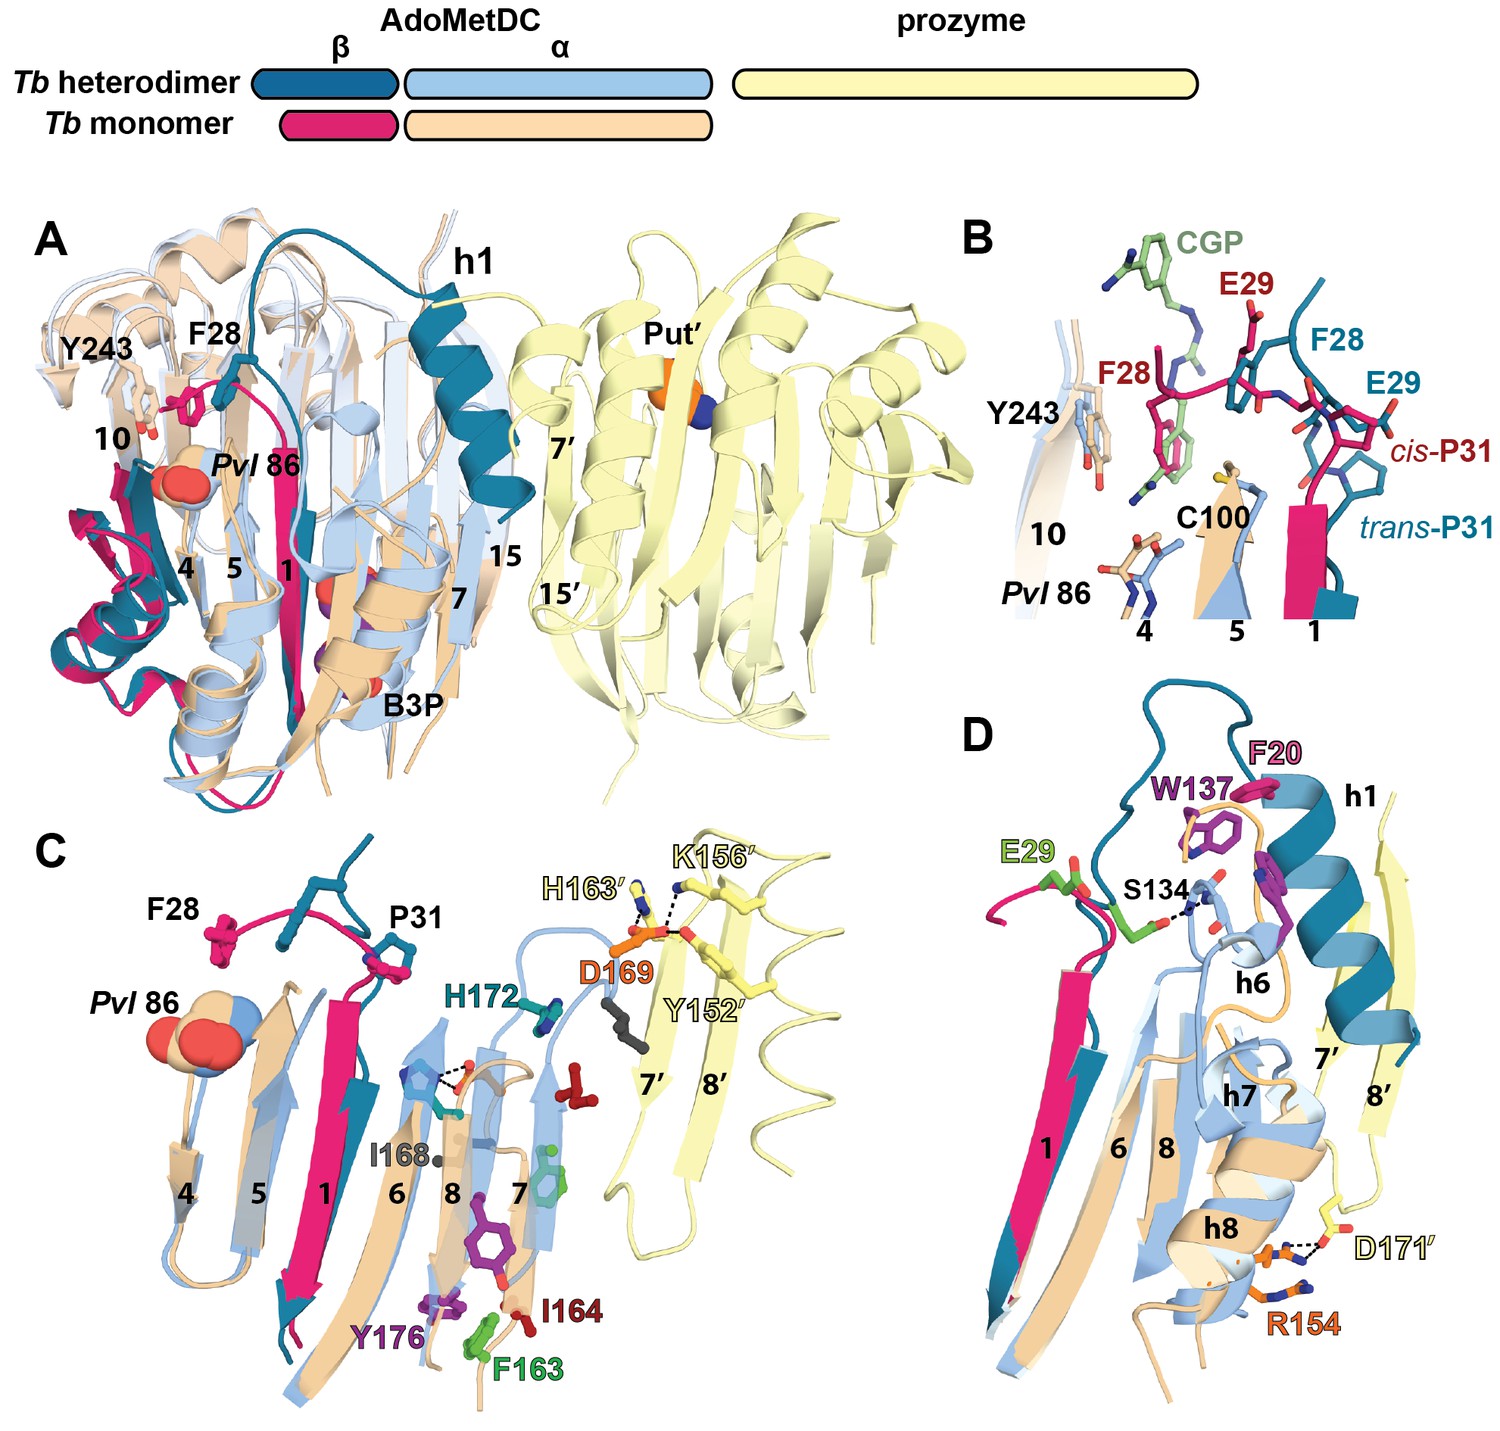
Structural basis for allosteric activation of TbAdoMetDC by prozyme.
(A) Ribbon diagram of superimposed inactive TbAdoMetDCΔ26 (pink/beige) with active apo-TbAdoMetDC/prozyme (teal/sky blue/yellow) (RMSD = 2.1 Å over 310 Cα atoms). The schematic depicts color codes for the various chains. Ligands are colored as follows: B3P (purple) and Put’ (orange). (B) Active site comparison of inactive TbAdoMetDCΔ26 with CGP-TbAdoMetDC/prozyme. Inhibitor CGP is shown in green. (C) Pyruvoyl β-sheet rearrangements between inactive TbAdoMetDC△26 and the apo-TbAdoMetDC subunit from the heterodimer. Representative residues on the β7 and β8 strands and nearby loops are highlighted as color-coded pairs: Y176 (purple); F163 (green); I164 (red); I168 (black); H172 (teal) and D169 (orange). Labels are positioned near the monomer for F163, I164, I168, and Y176 and the dimer for D169 and H172. Highlighted residues migrate over distances in parenthesis (Cα-to-Cα) between the inactive monomer and heterodimer structures: F163 (14.7 Å), I164 (15.2 Å), I168 (13.7 Å), D169 (14.3 Å), H172 (8.8 Å), Y176 (8.4 Å). (D) β6 to h8 connector (residues 130–145) rearrangements between the inactive monomer and the active heterodimer. Residues E29 (green) (5.0 Å), W137 (purple) (15.4 Å), R154 (orange) (3.5 Å) are shown as color coded pairs and the migration distances are in parenthesis. F20 is shown in pink and all other residues are colored the same as their chain color. For a schematic and surface representation of these conformational changes see Figure 4—figure supplement 1 and Figure 4—figure supplement 2, respectively. See also Video 1.
Figure 4—figure supplement 1
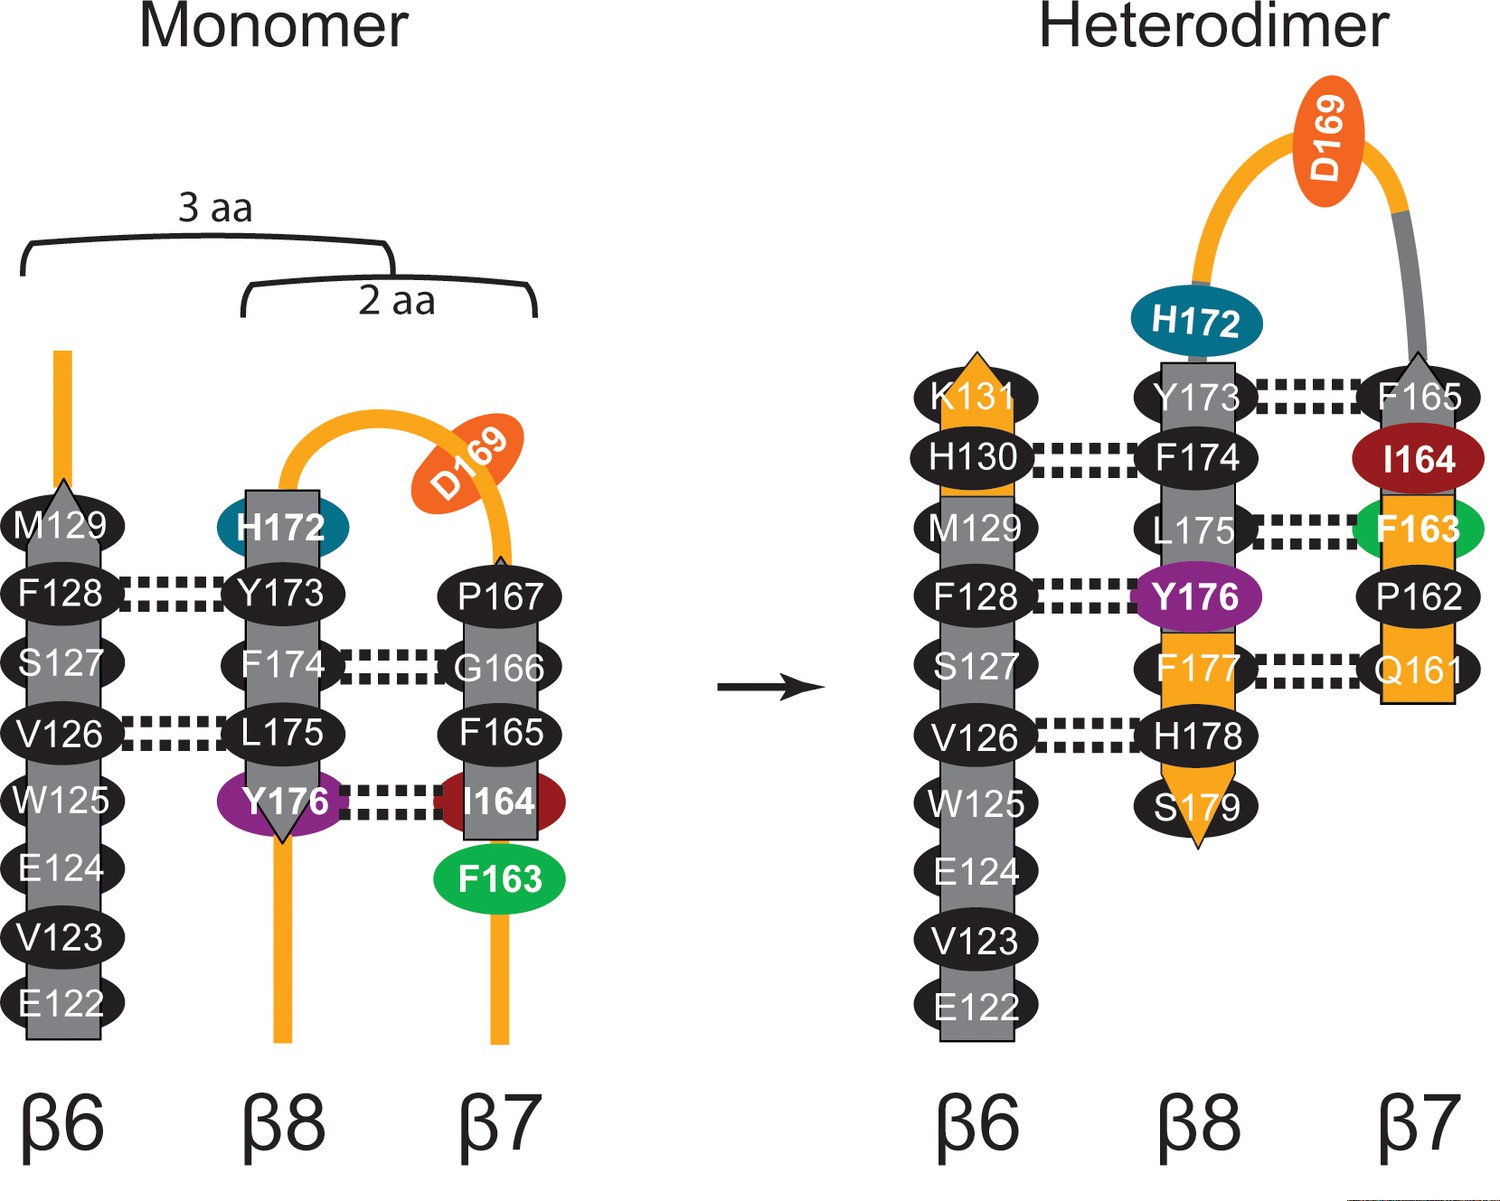
Diagram of β-sheet rearrangement between the inactive TbAdoMetDCΔ26 monomer and the active TbAdoMetDC/prozyme heterodimer.
β-sheets (flat arrows) and loops (lines) are respectively colored gray and orange in the monomer. The corresponding residues in the heterodimer are colored the same as in the monomer to demonstrate the change in secondary structure. The side chains of residues in the β-strands are shown as black ovals oriented towards either the outer helices (above plain) or scaffolding β-sheet (below plain). Side chains of F163, I164, D169, H172, and Y176 are colored as in Figure 3C. The backbone H-bonds (as defined by distances < 3.3 Å) are shown as dashed lines. The register shifts for the H-bond interactions going from the monomer to the heterodimer are depicted above the monomer.
Figure 4—figure supplement 2

Comparative surface diagram of amino acid residue movement between the inactive TbAdoMetDCΔ26 monomer and the active CGP-TbAdoMetDC/prozyme heterodimer.
Residues within 4 Å of alpha-helix h1 in the heterodimer structure are color-coded: N132-S134 (red), F135-W137 (orange), L144-A147 (yellow), I164 (green), I168-S170 (blue), D171-H172 (dark blue) and R298 (violet). The same labeling is reproduced in the monomer to demonstrate the structural changes. (A) Ribbon diagram of TbAdoMetDCΔ26 (β- and α-chains are pink and beige, respectively). Active site residues F28 (sticks) and Pvl 86 (spheres) are shown. (B) Ribbon diagram of heterodimeric CGP-TbAdoMetDC (β-/α-chains in teal/sky blue, CGP as purple sticks). (C) Surface representation of (A). (D) Surface representation of (B). Residues positioned N-terminal of P31 were not used in surface calculations.
Figure 5
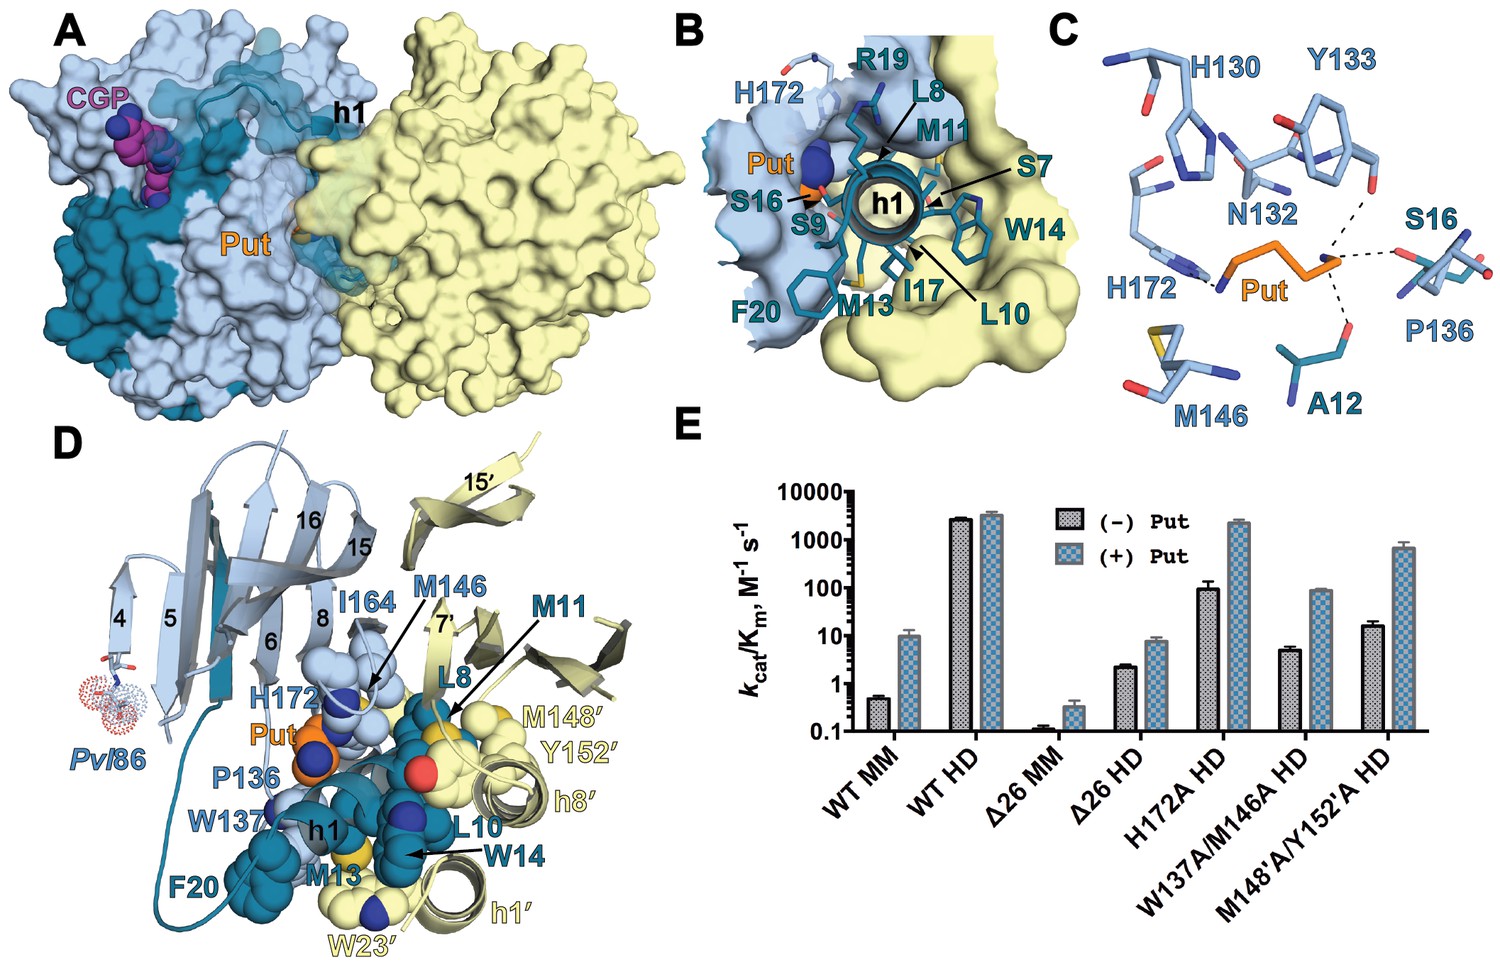
The h1 binding site in the CGP-TbAdoMetDC/prozyme structure.
(A) Surface overview of CGP-TbAdoMetDC/prozyme. Color coding is as follows TbAdoMetDC: (teal (β) and sky blue (α)), prozyme (yellow), CGP (purple) and Put (orange). (B) Top view of the h1 binding site. (C) TbAdoMetDC h1 Put-binding site showing the 4 Å shell. Dashed lines represent H-bonds as defined by distances <3.3 Å. (D) Select h1 interactions (4 Å shell) with TbAdoMetDC or prozyme residues (shown as spheres). (E) Steady-state kinetic analysis of TbAdoMetDC and prozyme mutants for data collected ±4 mM putrescine. The enzyme rates in triplicates over the range of AdoMet concentrations used in Michaelis-Menten analysis are in Figure 5—source data 1.
-
Figure 5—source data 1
Enzyme rates in triplicates over the range of AdoMet concentrations used in Michaelis-Menten analysis.
- https://doi.org/10.7554/eLife.20198.015
Figure 6 with 2 supplements
Ligand-binding sites in the CGP-TbAdoMetDC/prozyme heterodimer structure.
(A) Overlay of CGP-TbAdoMetDC β/α (teal/sky blue, CGP 40215 (TbCGP) and B3P in purple), prozyme (yellow, TbPut’ in orange) and HsAdoMetDC (3DZ6) β/α (dark green/light green, HsPut in green) structures viewed from the dimer interface. The schematic above the figure depicts color codes for the various chains. (B–C) Limited 4 Å shell showing the B3P- and putrescine-binding sites in TbAdoMetDC (B) and prozyme (C). (D) Overlay of the TbAdoMetDC CGP-binding site with HsAdoMetDC showing select residues in the 4 Å shell. H-bond interactions (distance < 3.3 Å) are shown by dashed lines. The electron density supporting ligand placement is shown in Figure 3—figure supplement 2, the complete structural alignment of Hs and Tb AdoMetDCs in Figure 6—figure supplement 1 and the comparison of the unliganded and liganded TbAdoMetDC structures in Figure 6—figure supplement 2.
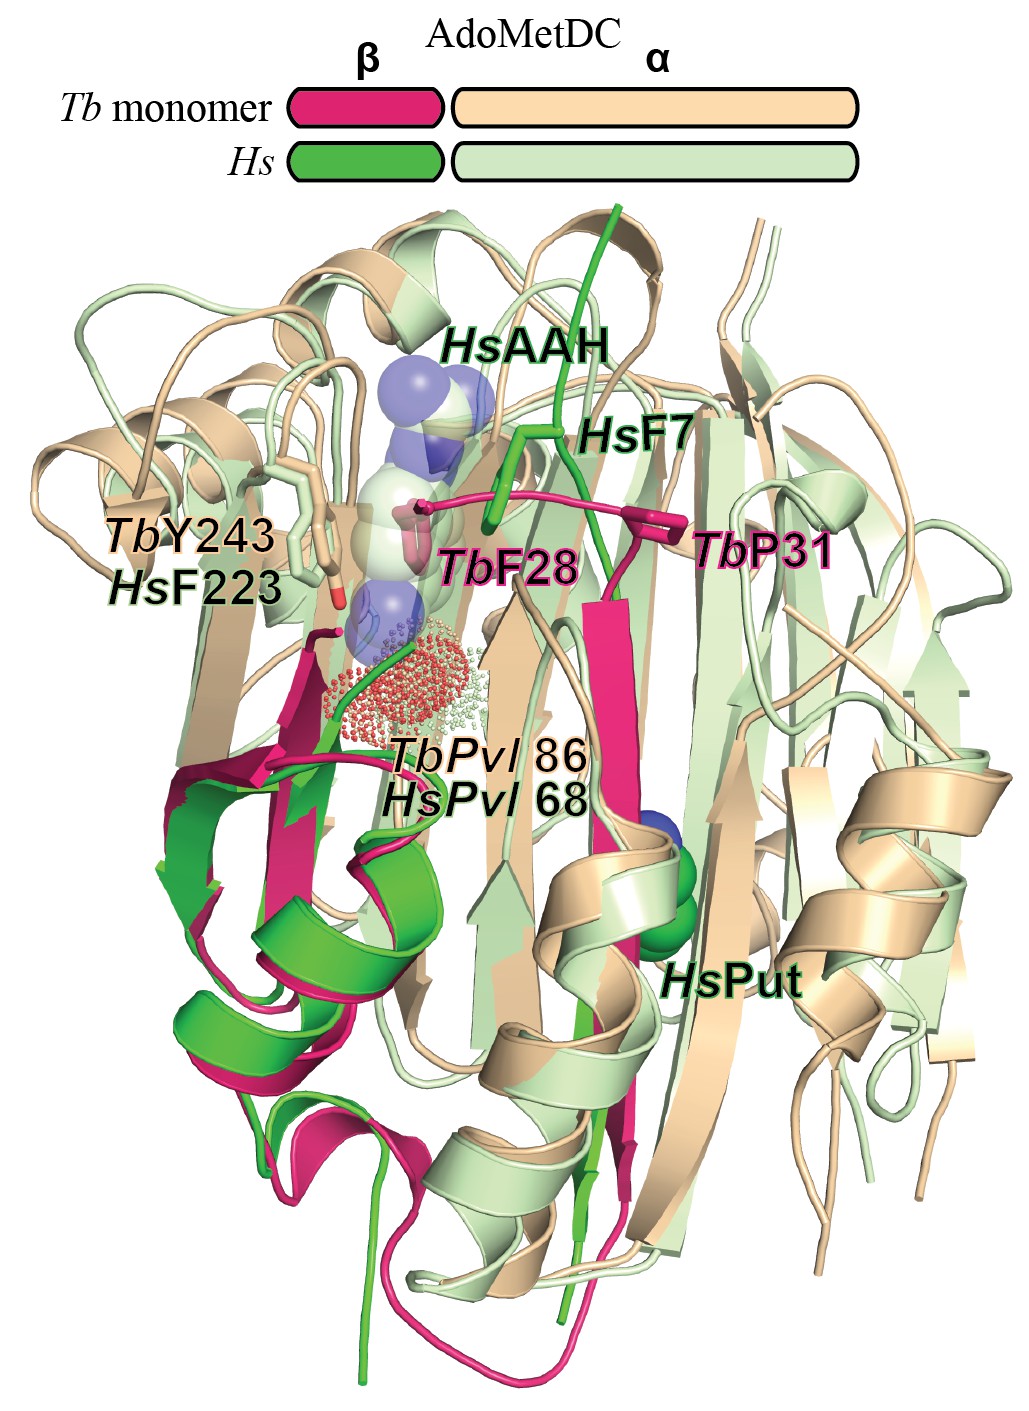
Figure 6—figure supplement 1
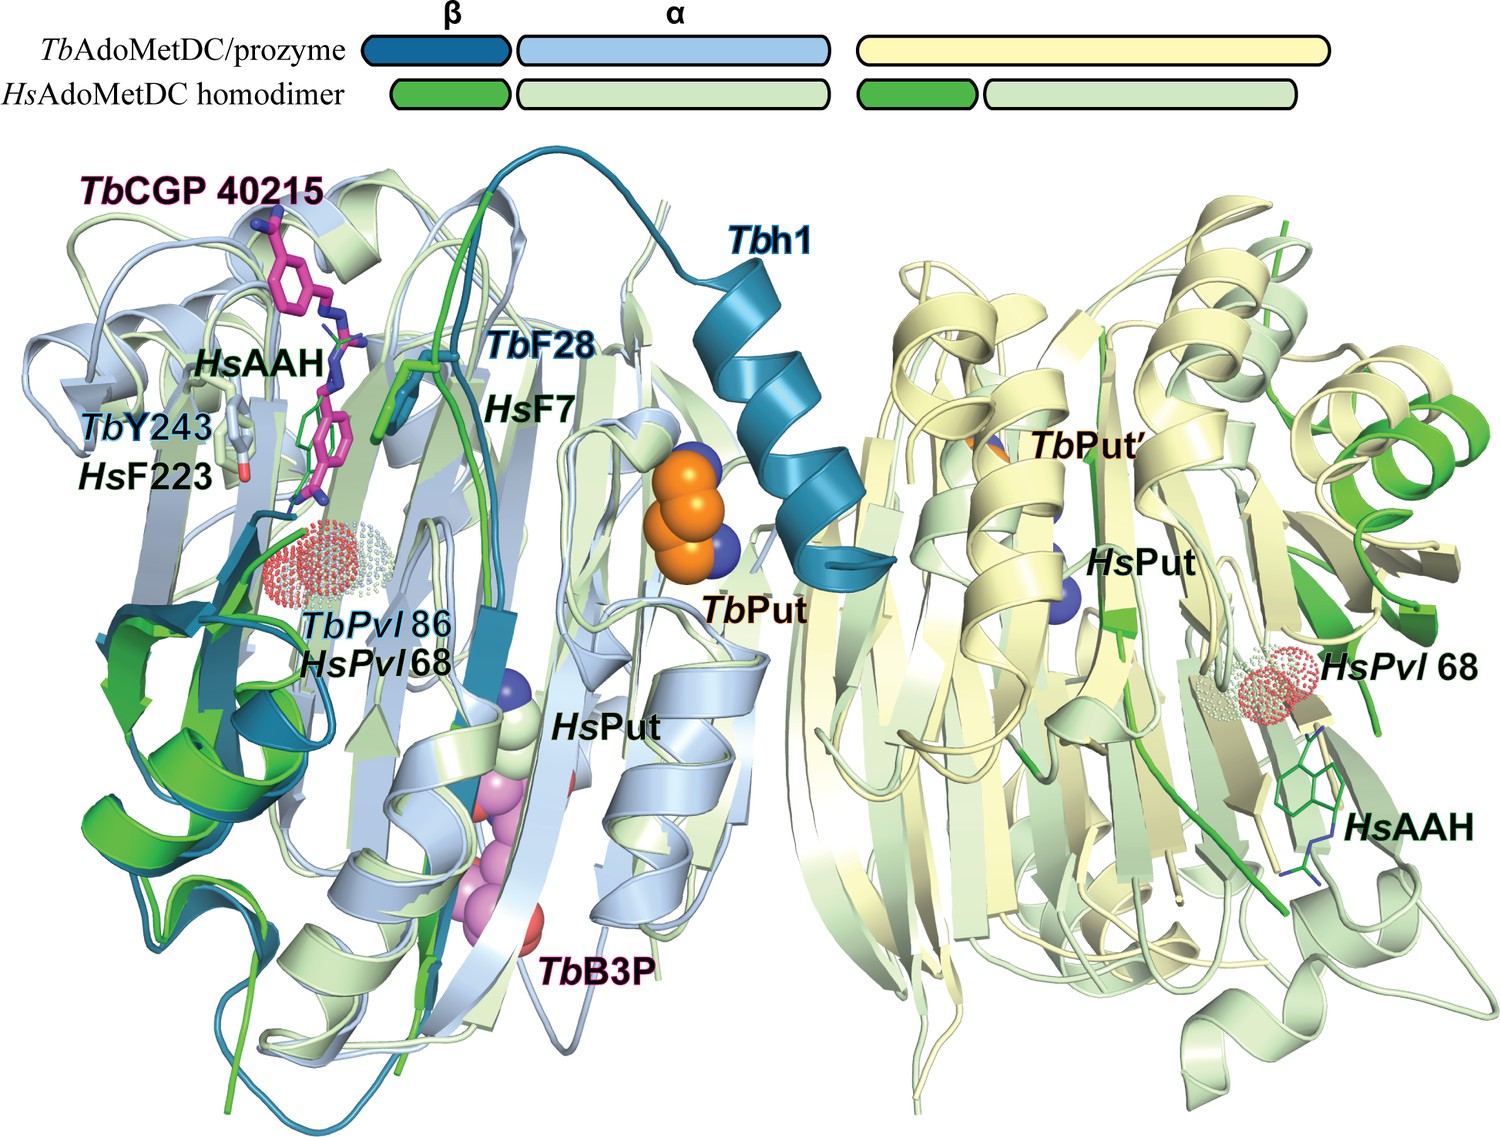
Comparison of TbAdoMetDC/prozyme and HsAdoMetDC dimer.
Alignment of TbAdoMetDC/prozyme CGP 40215-bound heterodimer (AdoMetDC β/α (teal/sky blue), prozyme (yellow)) with HsAdoMetDC 1i7M (β/α (bright green/light green). TbAdoMetDC pyruvoyl (TbPvl 86) is shown as dots. HsAdoMetDC ligands AAH (lines) and putrescine (spheres) are shown in green, TbAdoMetDC ligands (CGP and B3P) are shown in purple and Put is shown in tan, as is prozyme Put'. AdoMetDC subunits aligned with an RMSD of 1.6 Å over 290 Cα atoms.
Figure 6—figure supplement 2
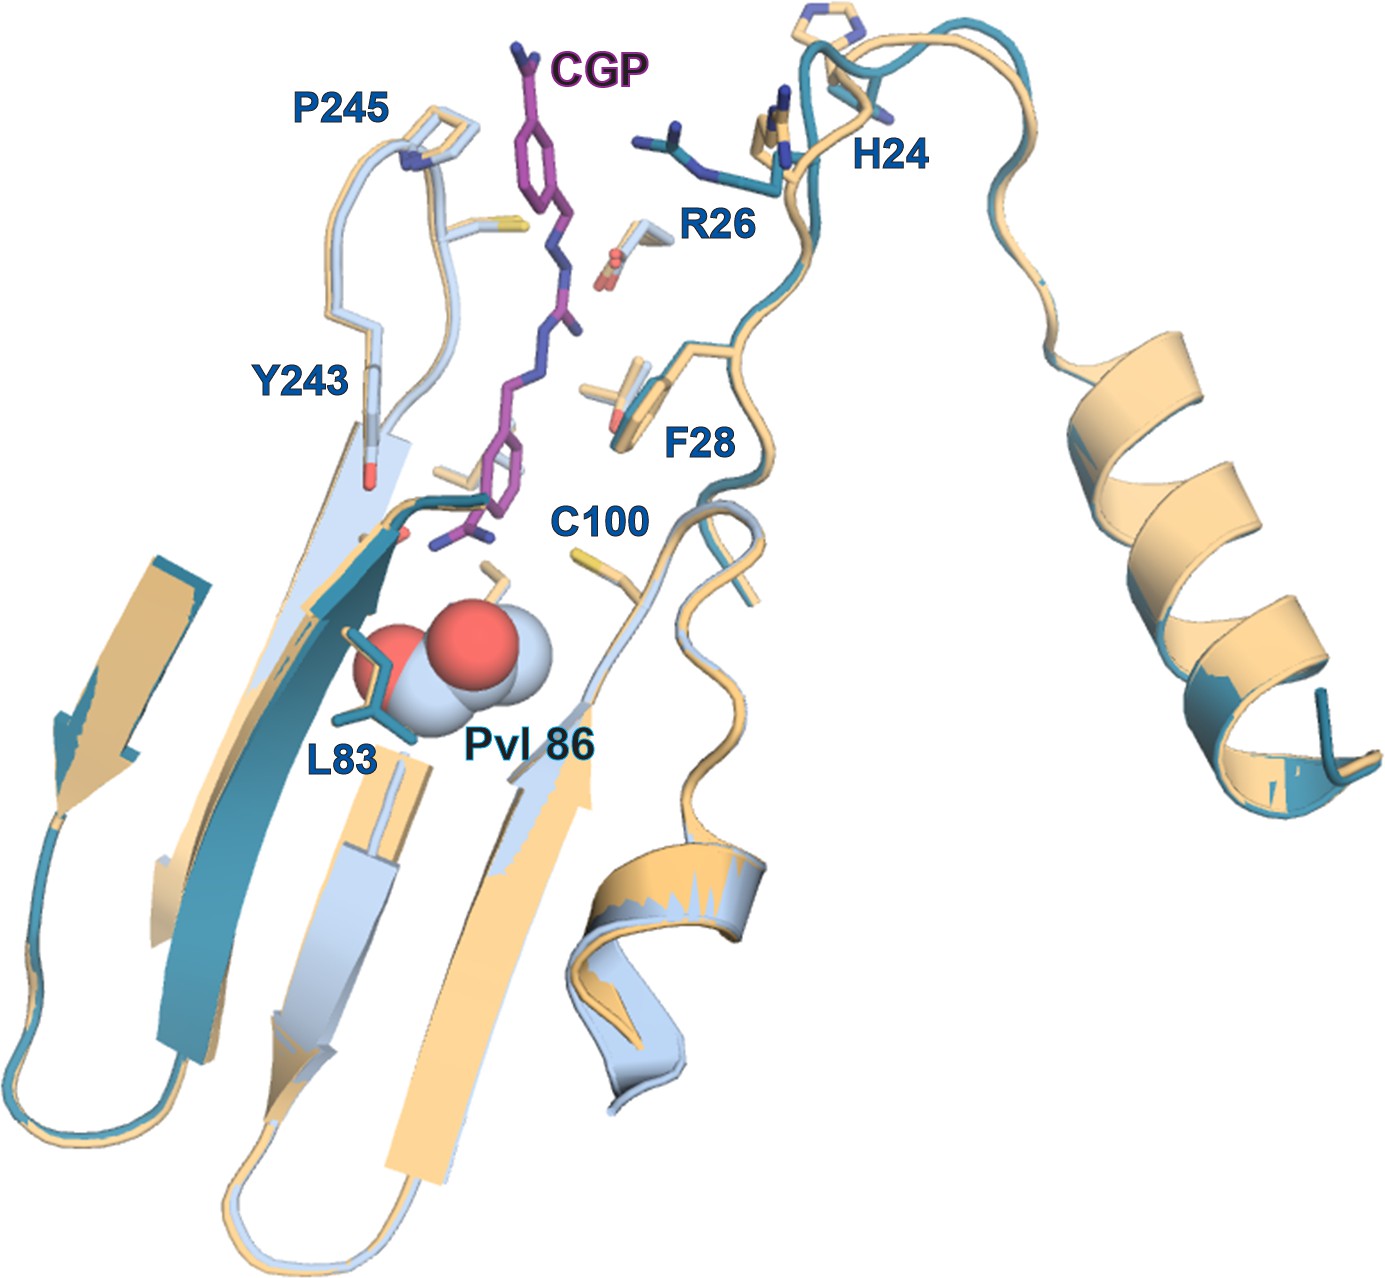
Comparison of apo- and CGP-bound TbAdoMetDC/prozyme active site.
Alignment of the AdoMetDC/prozyme apo structure (tan) with the CGP-bound structure (β/α in teal/sky blue) showing the active site region.
Figure 7
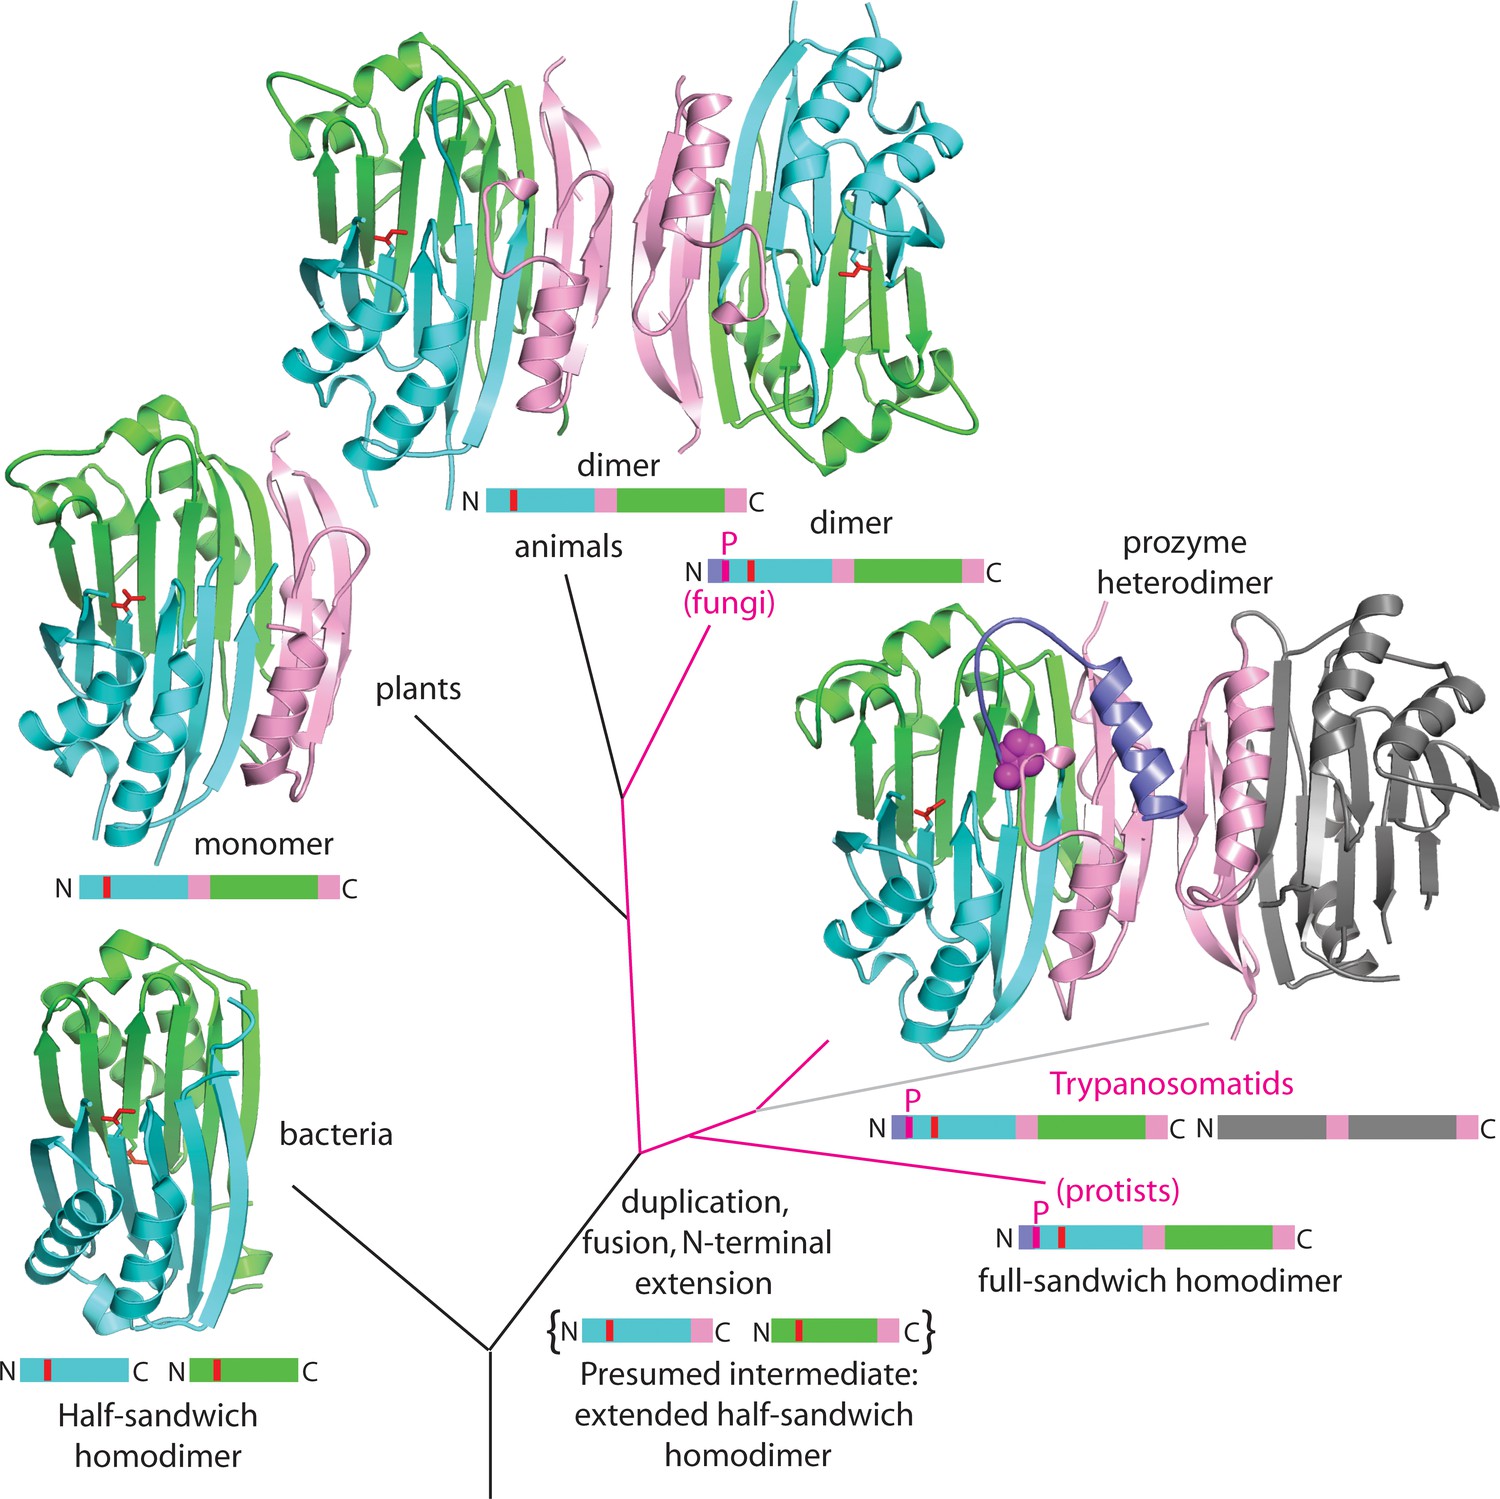
Theoretical tree diagram of the origin of eukaryotic AdoMetDCs.
The diagram depicts eukaryotic AdoMetDC enzymes evolving from their bacterial counterparts by extension, gene duplication and fusion. Two bacterial half-enzymes (lower left, PDB 3iwc) form an αββα sandwich through dimerization of the β-sheet faces, with interacting chains depicted in cyan and green cartoon and active site pyruvates in red stick. The primary sequence diagram (same colors) is depicted below. The primary sequence diagram illustrates a presumed intermediate with extended C-terminal αββ extensions (pink). The duplicated and fused eukaryotic enzymes adopt the same αββα sandwich fold (now within a monomer), with extension (pink) dictating edge-to-edge dimerization of the β-sheets (Bale and Ealick, 2010). Trypanosomatid enzymes (represented by the T. brucei structure from this paper) undergo a second gene duplication, with one (prozyme in gray, lower right) losing catalytic activity. Prozyme activates the catalytic enzyme (colored cartoon, lower right) through dimerization and cis-trans isomerization of a conserved proline (P31, magenta sphere) with movement of N-terminal helix (purple). Additionally, protist and fungal sequences retain the conserved proline (magenta lines in the tree with primary sequence diagrams showing the location of the proline (magenta P)). Plant sequences (illustrated by PDB structure 1mhm) have lost the proline, N-terminal helix and dimerization; animal sequences (illustrated by PDB structure 1i7b) retain a dimeric structure of two active chains without proline and N-terminus (depicted in colored cartoon).
Figure 8
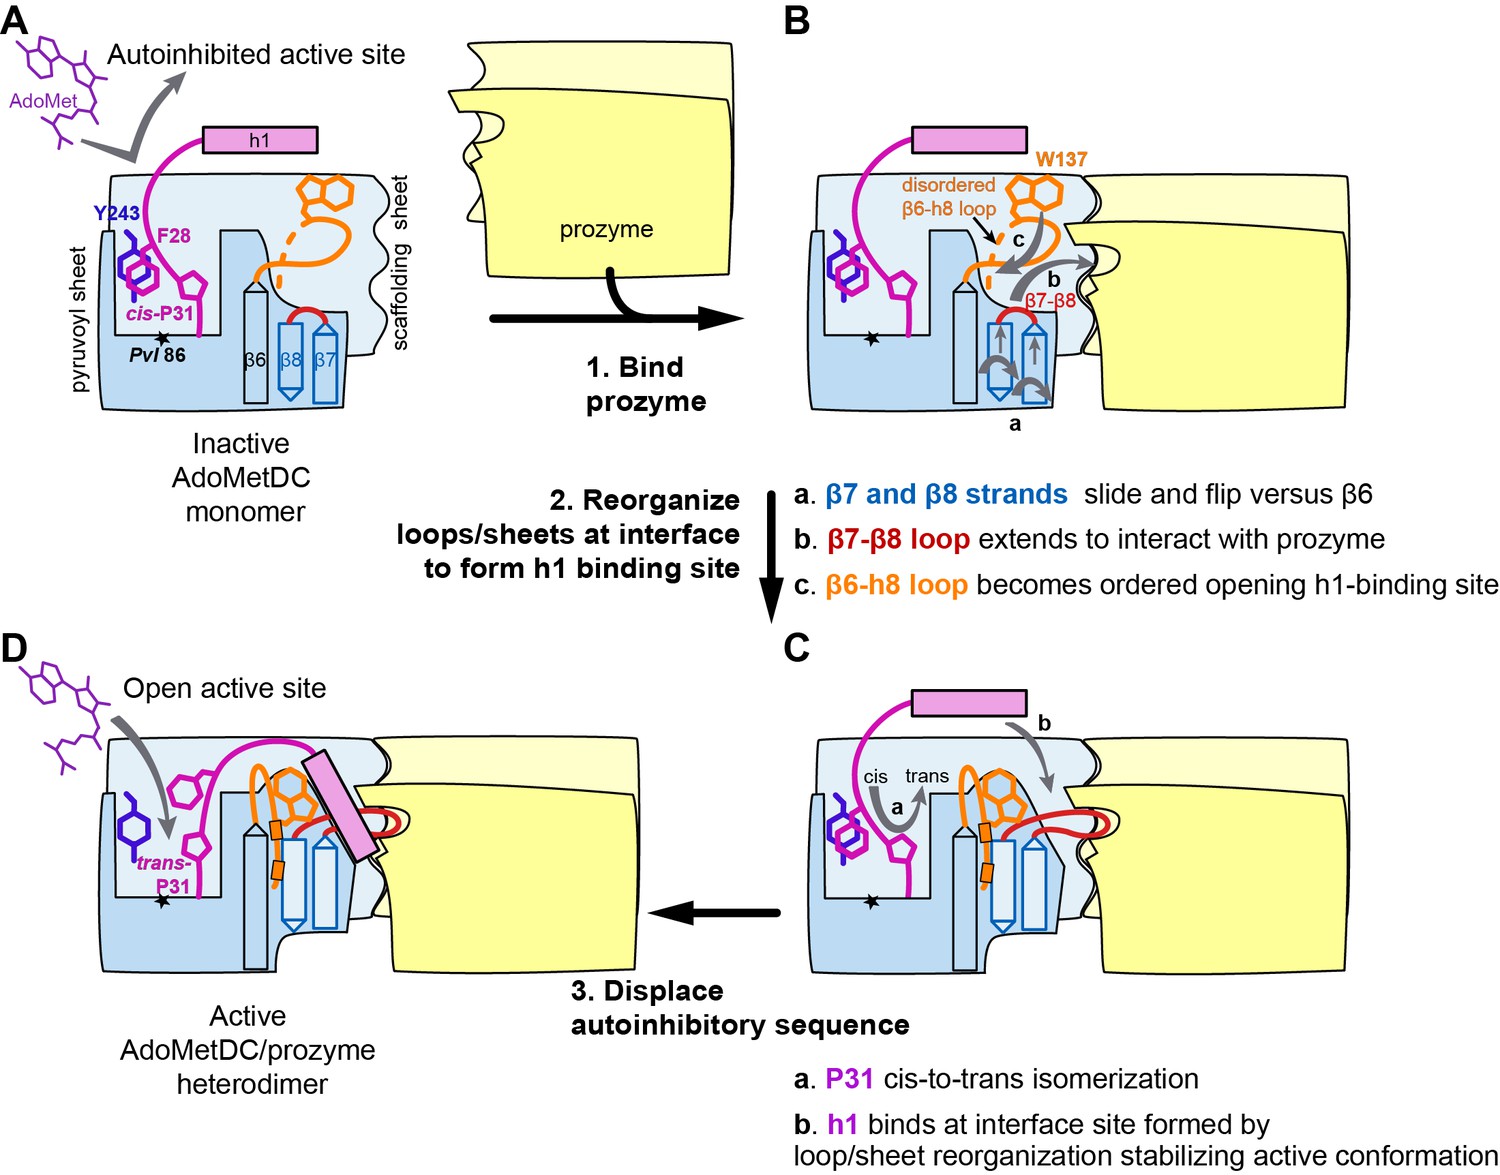
Mechanistic model of prozyme-induced TbAdoMetDC enzyme activation.
The model depicts a logical step-wise process assuming that the formation of the h1 binding site precedes insertion of the helix into the interface, but current data do not distinguish between a sequential versus a concerted activation mechanism and the ordering of events is hypothetical. (A) The inactive TbAdoMetDC monomer is composed of two β-sheets: pyruvoyl (blue) and scaffolding (light blue). The active site pyruvoyl residue (Pvl86, star) is blocked by the inhibitory sequence (S27–G30), which is oriented into the active site by the cis configuration of P31. This autoinhibitory closed confirmation is stabilized by π-π stacking between F28 (purple) and Y243 (blue). Residues N-terminal of S27, including helix h1 (purple rectangle), were not present in the monomer construct and their position in the diagram is hypothetical. (B) Binding of prozyme (yellow/light yellow) to AdoMetDC is nucleated by formation of the H-bond network between the two scaffolding sheets leading to formation of a continuous inter-subunit β-sheet that serves as a platform for the following conformational changes: (a) slipping of the interface strands β7 and β8 relative to β6, which results in flipping of their side chains from one surface to the other; (b) repositioning and elongation of the β7-β8 loop that forms the back of the h1 binding site, stabilized in this confirmation by interaction across the interface with prozyme; and (c) disordered-to-ordered transition and movement of the β6-h8 loop (H130-L144, orange) that leads to formation of the h1 binding pocket. (C) Upon the formation of the h1 binding pocket, (a) cis-to-trans isomerization of P31 displaces the autoinhibitory sequence from the active site and the open active site conformation is stabilized by (b) docking of the h1 helix at the dimer interface. (D) The active TbAdoMetDC/prozyme dimer is capable of binding ligands in the open active site, which leads to ~1000 fold increase in rates of AdoMet decarboxylation.
Videos
Video 1
Conformational rearrangements of TbAdoMetDC upon dimerization with prozyme.
The movie shows the changes within TbAdoMetDC from its confirmation as a TbAdoMetDCΔ26 monomer to the CGP-bound TbAdoMetDC/prozyme heterodimer. TbAdoMetDC is colored by chain (β in pink, α in beige, prozyme in yellow). The ribbon representation is based on the monomer secondary structure assignment. Key residues are shown: F28 (pink sticks) interacts with Y243 (beige sticks) in the monomer and forms the CGP (purple sticks) binding site in the heterodimer; D169 (beige spheres) interacts with H172 (beige spheres) in the monomer and moves 14 Å in the heterodimer to form new interactions with Y152', K156', H163' (yellow sticks); G30-P31 (pink spheres) forms cis-peptidyl bond in the monomer that trans-isomerizes in the heterodimer; W137 (orange spheres) is part of the β6-h8 connector (orange) that is partially disordered and blocks the h1 binding pocket in the monomer while repositioning and becoming structured in the heterodimer; F163 and F165 (cyan spheres) and F174, Y176 (green spheres) are residues on β7 and β8 strands, respectively, that flip from one surface of the β-strands in the monomer to the opposite surface in a heterodimer; pyruvoyl group (beige spheres) is only shown for the heterodimer. The morph and the movie were generated with PyMOL.
Tables
Table 1
Activity of T. brucei AdoMetDC and AdoMetDC/prozyme complexes.
TbAdoMetDC proteins | Prozyme proteins | kcat/Km (s−1M−1) | |||
|---|---|---|---|---|---|
TbAdoMetDC monomer | TbAdoMetDC/prozyme heterodimer | ||||
(+) Put | (−) Put | (+) Put | (−) Put | ||
Wild-type | Wild-type | 9.7 ± 3.5 | 0.48 ± 0.08 | 3.2 ± 0.6×10³ | 2.6 ± 0.3×10³ |
Δ16 | Wild-type | 16±3* | 16±11* | 28±5* | 18±3* |
Δ26 | Wild-type | 0.32 ± 0.07 | 0.11 ± 0.02 | 7.6 ± 1.7 | 2.2 ± 0.3 |
H172A | Wild-type | ND | ND | 2.1 ± 0.4×10³ | 93 ± 42 |
W137A/M146A | Wild-type | ND | ND | 87 ± 8 | 5.0 ± 0.9 |
Wild-type | M148'A/Y152'A | as above | as above | 0.66 ± 0.23×10³ | 16 ± 4 |
-
* data taken from (Velez et al., 2013). Data were collected in the presence of 4 mM putrescine (Put), except for the Δ16 mutant (5 mM putrescine*). In all cases, the heterodimer with the wild-type counterpart formed with sufficient affinity that the subunits could be copurified as a stable complex. Error represents the standard deviation for the fit of triplicate data points. ND, not determined.
Table 2
Crystallographic diffraction data and refinement statistics.
TbAdoMetDC△26 monomer | TbAdoMetDC/prozyme heterodimer | TbAdoMetDC/prozyme heterodimer with CGP | |
|---|---|---|---|
Data collection | |||
Space group | P212121 (No. 19) | P21 (No. 4) | P21 (No. 4) |
Unit cell dimensions (Å, °) | a = 46.67, b = 75.64, c = 87.92 | a = 81.30, b = 96.71, c = 99.58; β = 102.64 | a = 81.13, b = 96.31, c = 98.48; β = 102.22 |
Wavelength (Å) | 0.97935 | 0.97932 | 0.97934 |
Average mosaicity (°) | 0.25 | 0.85 | 0.62 |
Resolution range (Å) | 50–1.48 (1.51–1.48)* | 50–2.40 (2.44–2.40) | 50–2.42 (2.46–2.42) |
Unique number of reflections | 51,575 | 57,780 | 57,137 |
Average redundancy | 9.4 (4.8) | 6.9 (5.6) | 4.0 (3.4) |
Completeness (%) | 98.2 (79.2) | 99.5 (97.4) | 99.4 (98.5) |
Rr.i.m. (%) ‡ | 6.8 | 14.6 | 12.5 |
Rp.i.m. (%) § | 2.2 (39.3) | 5.5 (60.2) | 6.1 (69.7) |
<I /σI> | 29.8 (1.4) | 15.1 (1.3) | 16.6 (1.7) |
CC1/2 in the last resolution shell | 0.68 | 0.60 | 0.53 |
CC* in the last resolution shell | 0.90 | 0.87 | 0.83 |
Wilson B-factor (Å2) † | 17.2 | 42.0 | 25.1 |
Refinement | |||
Resolution range (Å) | 36.2–1.48 (1.53–1.48) | 37.9–2.41 (2.49–2.41) | 32.4–2.42 (2.51–2.42) |
Number of reflections Total/Rfree | 51,476/2000 (4315/167) | 57,703/2000 (5361/186) | 55,801/1674 (5172/155) |
Atoms (non-H protein/ligands/solvent) | 2584/6/252 | 10,275/60/101 | 10,214/124/261 |
Protein residues (resolved/sequence) | 314/344 ¶ | 1292/1390 ¶,** | 1282/1390¶,** |
Rwork (%) | 15.8 (25.1) | 22.8 (32.6) | 21.3 (29.1) |
Rfree (%) | 20.0 (32.6) | 27.1 (33.2) | 25.5 (34.6) |
RMSD bond length (Å) | 0.008 | 0.002 | 0.002 |
RMSD bond angle (°) | 1.0 | 0.46 | 0.48 |
Average B-factor (Å2) (protein/ligands/solvent) | 24.9/20.8/32.3 | 56.2/56.3/40.2 | 40.6/56.2/28.9 |
Ramachandran plot (%) (favored/allowed/disallowed) | 98.1/1.6/0.3†† | 96.4/3.6/0 | 96.9/3.1/0 |
Poor rotamers (%) | 0.34 | 0.70 | 0.18 |
Clashscore | 1.18 | 1.23 | 1.38 |
-
* Numbers in parentheses correspond to the last resolution shell.
-
† Maximum likelihood estimate of the overall B-value reported in Phenix.
-
‡ Redundancy-independent merging R factor, (Weiss, 2001)
-
§ Precision-indicating merging R factor, (Weiss, 2001)
-
¶ Residue count includes Pvl but ** excludes the first Ser after Ulp1 cleavage site.
-
†† I168 is the only residue in the disallowed region of the Ramachandran plot.
Additional files
-
Supplementary file 1
Primers used in molecular cloning of the expression constructs.
- https://doi.org/10.7554/eLife.20198.021
-
Supplementary file 2
Multiple sequence alignment of trypanosomatid prozymes with representative eukaryotic AdoMetDCs.
Residue positions are highlighted according to conservation: mainly hydrophobic (yellow), mainly small (gray), invariant residues in AdoMetDC enzymes that likely contribute to catalysis (black), coevolving residues that likely contribute to activation (magenta), conserved trypanosomatid prozyme/enzyme residues that stabilize the prozyme/enzyme interaction (orange), and conserved trypanosomatid prozyme/enzyme residues that form the N-helix pocket (wheat). Sequences are labeled according to NCBI GenInfo Identifier (GI) followed by the species. Alignment sections are labeled above according to taxonomy group. Non-conserved termini and insertions are removed from some sequences, with the numbers of omitted insertion residues that belong to unconserved positions indicated with brackets. Aligned sequences were ordered according to taxonomy, with the exception of protist sequences, which were split according to their similarity to other sequences in the alignment (Sphaeroforma arctica and Salpingoeca rosetta sequences are closer to metazoa than other protists) and to distinguish the Trypanosomatid group that contains prozyme sequences. Trypanosomatids were supplemented with sequences from additional species present in the NR database (Phytomonas sp. isolate EM1, Angomonas deanei, and Strigomonas culicis), and indicated prozyme sequences were extended to the N- or C-termini using TBLASTN (marked by *). The confirmed AdoMetDC domains were found to be fused to several additional domains in select sequences, including an AdoMetDC leader (pfam08132) in 35 plant sequences, an f-box-like domain (pfam12937) in one fungal sequence, pyridoxal-dependent ornithine decarboxylase (pfam02784 and pfam00278) in 9 apicomplexan and 3 plant sequences, and protein prenyltransferase alpha subunit repeat (pfam01239) in one Blastocystis sequence. The proline residue (T. brucei P31) that alters peptide bond isomerization upon activation belongs to the Trypanosomatid AdoMetDC sequence motif "FEGPEK" and is present in all complete fungal sequences, with a single exception from Vanderwaltozyma polyspora (XP_001646102.1). P31 was also present in all but 19 protist sequences, where it was replaced in all apicomplexans (11), choanoflagellates (2), Blastocystis (2), Perkinsida (1), Ichthyophonida (1), Apusomonadidae (1), and Capsaspora (1). Inspection of the multiple sequence alignment identified several residues that appeared to coevolve with the P31 in protist sequences (that have not lost the proline), including T104, N132, H172, and C269. The H172 coevolution also extends throughout fungal sequences, while the T104, N132, and C269 are restricted to a more limited subset. These residues occupy key positions in TbAdoMetDC with respect to the conformational changes that occur upon prozyme activation as described in the main manuscript.
- https://doi.org/10.7554/eLife.20198.022
Download links
A two-part list of links to download the article, or parts of the article, in various formats.
Downloads (link to download the article as PDF)
Open citations (links to open the citations from this article in various online reference manager services)
Cite this article (links to download the citations from this article in formats compatible with various reference manager tools)
Relief of autoinhibition by conformational switch explains enzyme activation by a catalytically dead paralog
eLife 5:e20198.
https://doi.org/10.7554/eLife.20198


