Organization and function of Drosophila odorant binding proteins
- Yale University, United States
Figures
Figure 1 with 1 supplement
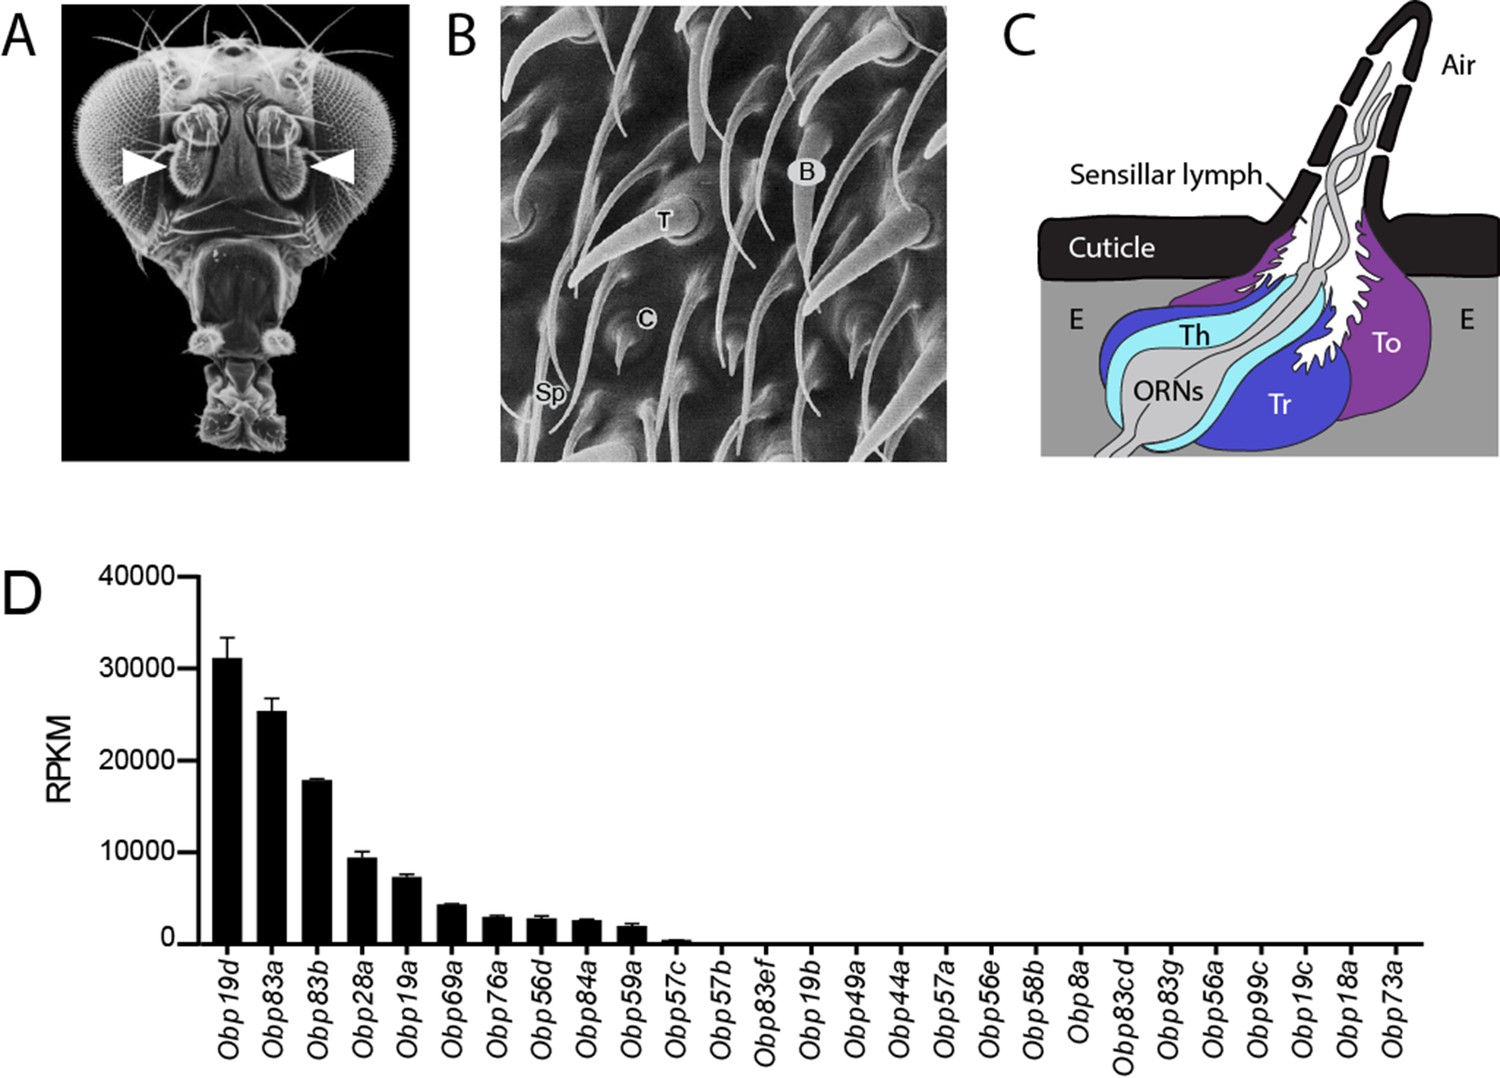
Organization of the antenna and expression of Obps.
(A) Scanning electron micrograph of antennae (arrowheads) on a Drosophila head. Adapted from http://www.sdbonline.org/sites/fly/aimain/images.htm, (Menuz et al., 2014). (B) Higher magnification image of antennal surface showing basiconic (B), trichoid (T), and coeloconic (C) sensilla surrounded by non-innervated spinules (Sp). Adapted from (Menuz et al., 2014; Shanbhag et al., 1999). (C) A generic sensillum containing two ORNs and thecogen (Th), trichogen (Tr), and tormogen (To) cells, separated from neighboring sensilla by epidermal cells (E). Adapted from (Menuz et al., 2014; Steinbrecht et al., 1992). (D) Members of the Obp gene family detected in the third antennal segment, where olfactory sensilla are located, at >1 read per million mapped reads in each of three samples. Genes are listed in decreasing order of expression level, indicated in terms of reads per million mapped reads per kilobase of gene length (RPKM). Obp76a is also known as LUSH. Adapted from (Menuz et al., 2014).
Figure 1—figure supplement 1
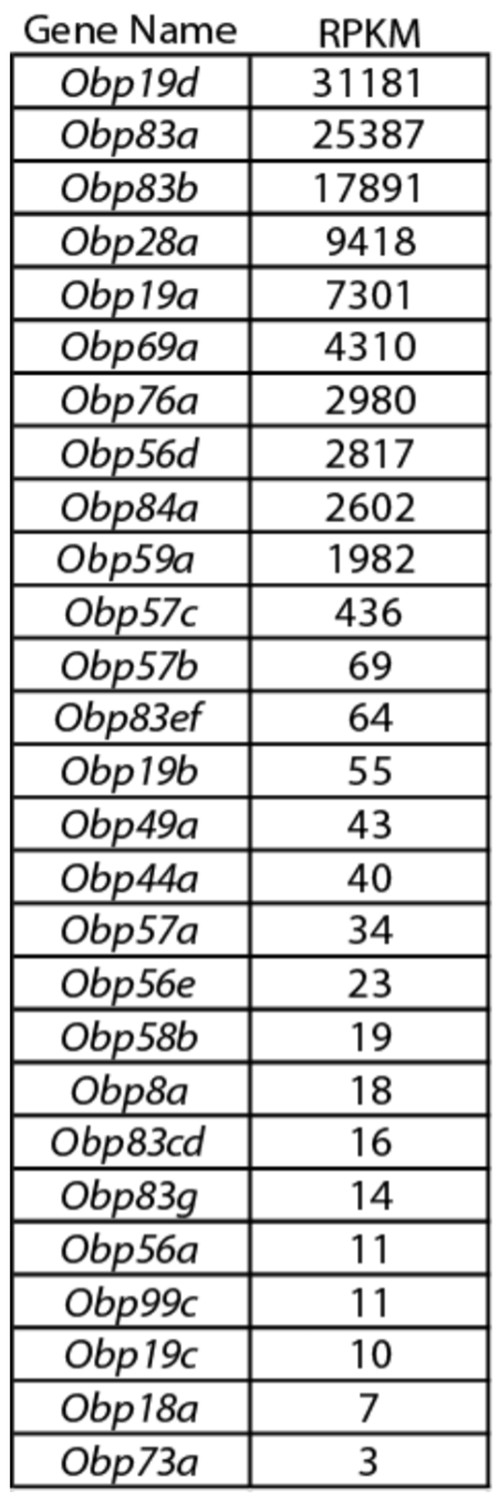
Obp expression levels.
Members of the Obp gene family detected with at least one read per million mapped reads (RPM) in each of three samples in the third antennal segment of Canton-S (CS) flies. The 27 genes detected at this level are listed in decreasing order of reads per million mapped reads per kilobase of gene length (RPKM). Adapted from (Menuz et al., 2014).
Figure 2
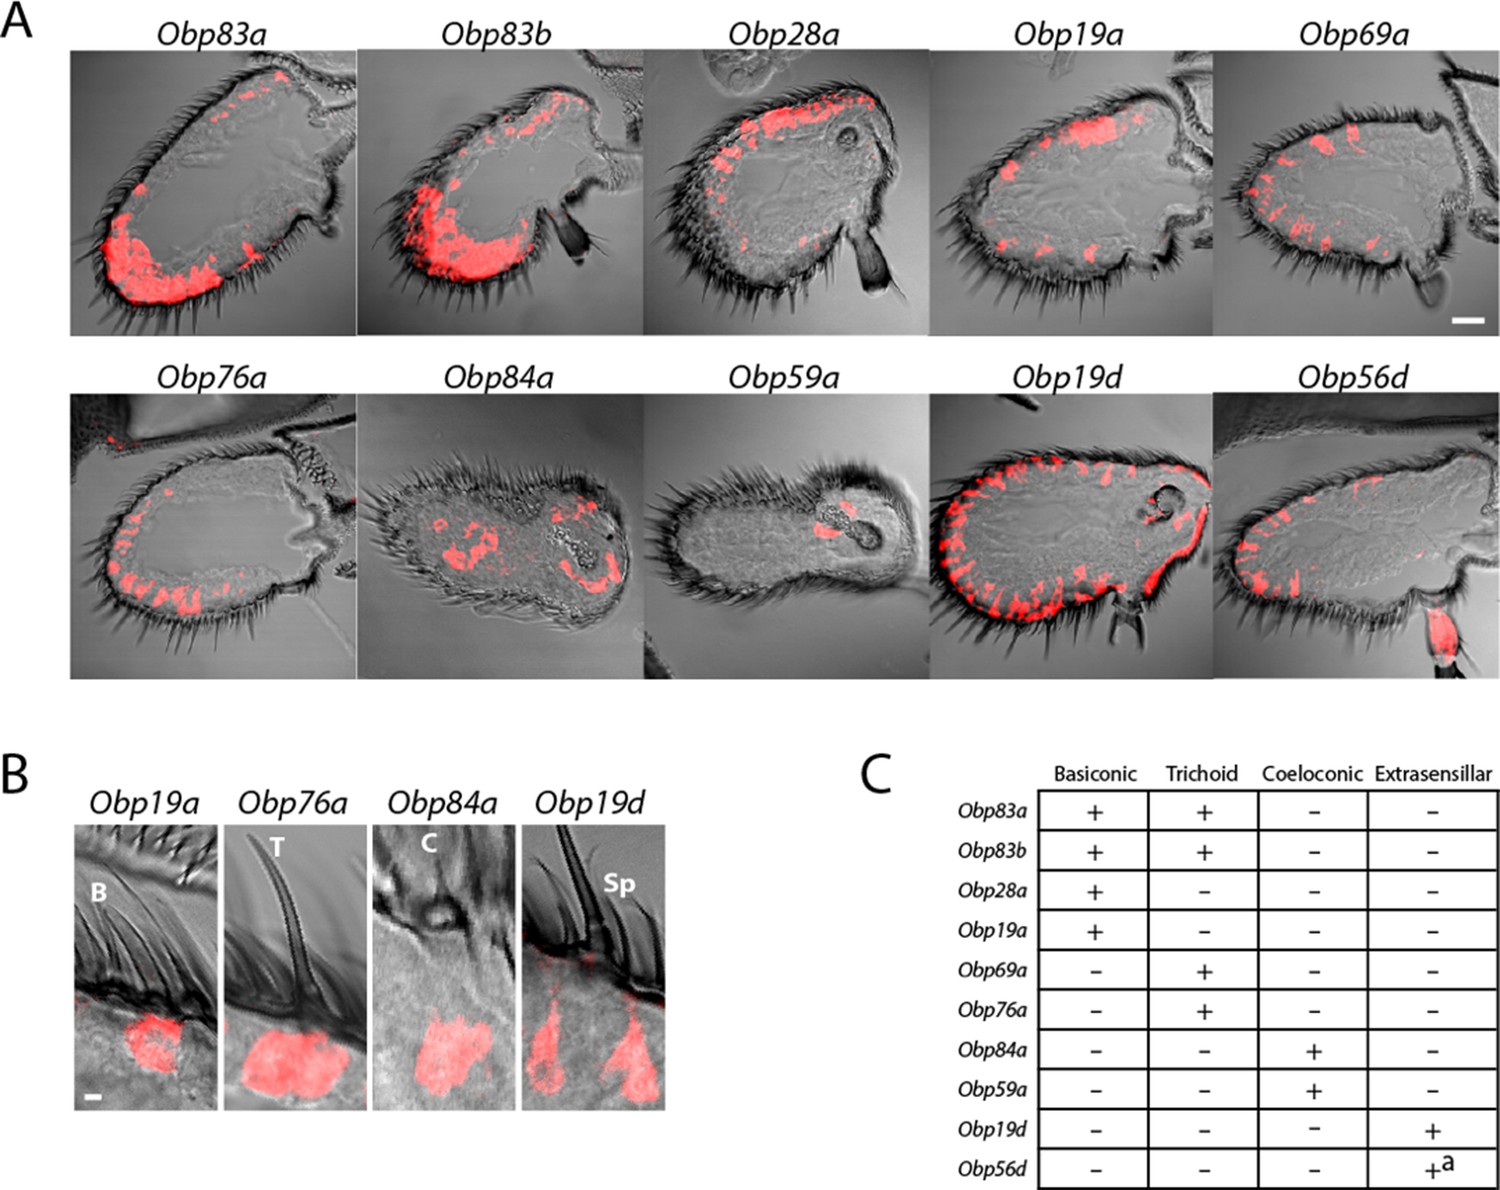
Diverse expression patterns of abundant Obps in the antenna.
(A) In situ hybridization of Obp antisense RNA probes to antennal sections. Scale bar = 20 μm. Male and female antennae were examined with each probe and no sexual dimorphism was observed except that females appeared to show stronger labeling than males with Obp56d in the region where trichoid sensilla are found. (B) Higher magnification images of sensilla labeled with Obp probes: Obp19a in a basiconic sensillum (B), Obp76a in a trichoid sensillum (T), Obp84a in a coeloconic sensillum (C), and Obp19d in cells that are located between sensilla and that are associated with uninnervated spinules (Sp). Scale bar = 2 μm. (C) Summary of Obp expression patterns. +a indicates expression in the arista as well as in cells between sensilla of the third antennal segment.
Figure 3
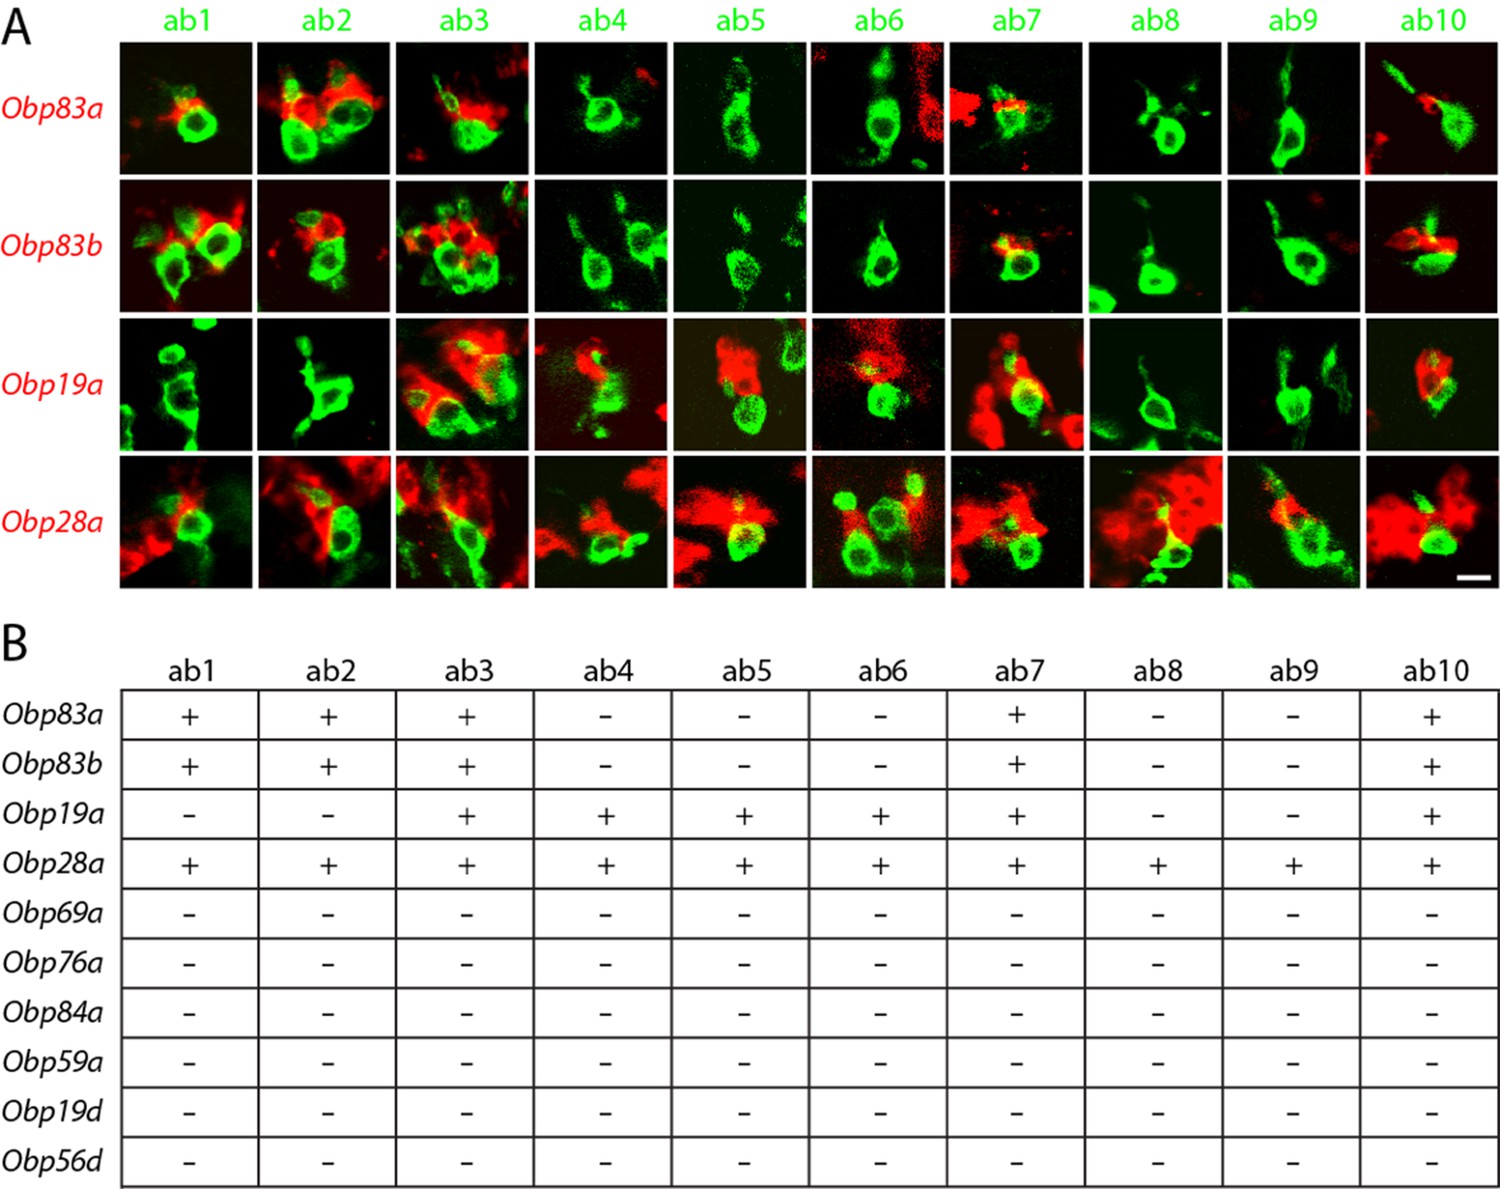
Obps are differentially expressed within basiconic sensillum types.
(A) Confocal images of in situ hybridization to antennal sections labeled with antisense probes for the Obps (red) and an antibody against GFP (green) driven by Or42b-GAL4 (ab1), Or59b-GAL4 (ab2), Or22a-GAL4 (ab3), Or56a-GAL4 (ab4), Or82a-GAL4 (ab5), Or49b-GAL4 (ab6), Or67c-GAL4; Or98a-GAL4 (used together to label ab7), Or43b-GAL4 (ab8), Or 67b-GAL4 (ab9), and Or49a-GAL4 (ab10). Many panels show more than one sensillum. Thus in some panels, such as Obp83a/ab2, two sensilla are labeled by both the Or-GAL4 driver and the Obp probe. In some other panels, such as Obp28a/ab1, Obp probes label multiple neighboring sensilla of which some are unlabeled by the GAL4 driver. Scale bar = 5 μm. (B) Summary of Obp expression in ten basiconic types. An Obp is considered to be expressed in a sensillum type if it labeled a cell that wraps around the dendrites of ORNs in the majority of labeled sensilla examined. Obp expression was more difficult to identify with confidence in ab9 because of its proximity to other sensilla with strong Obp expression.
Figure 4 with 1 supplement
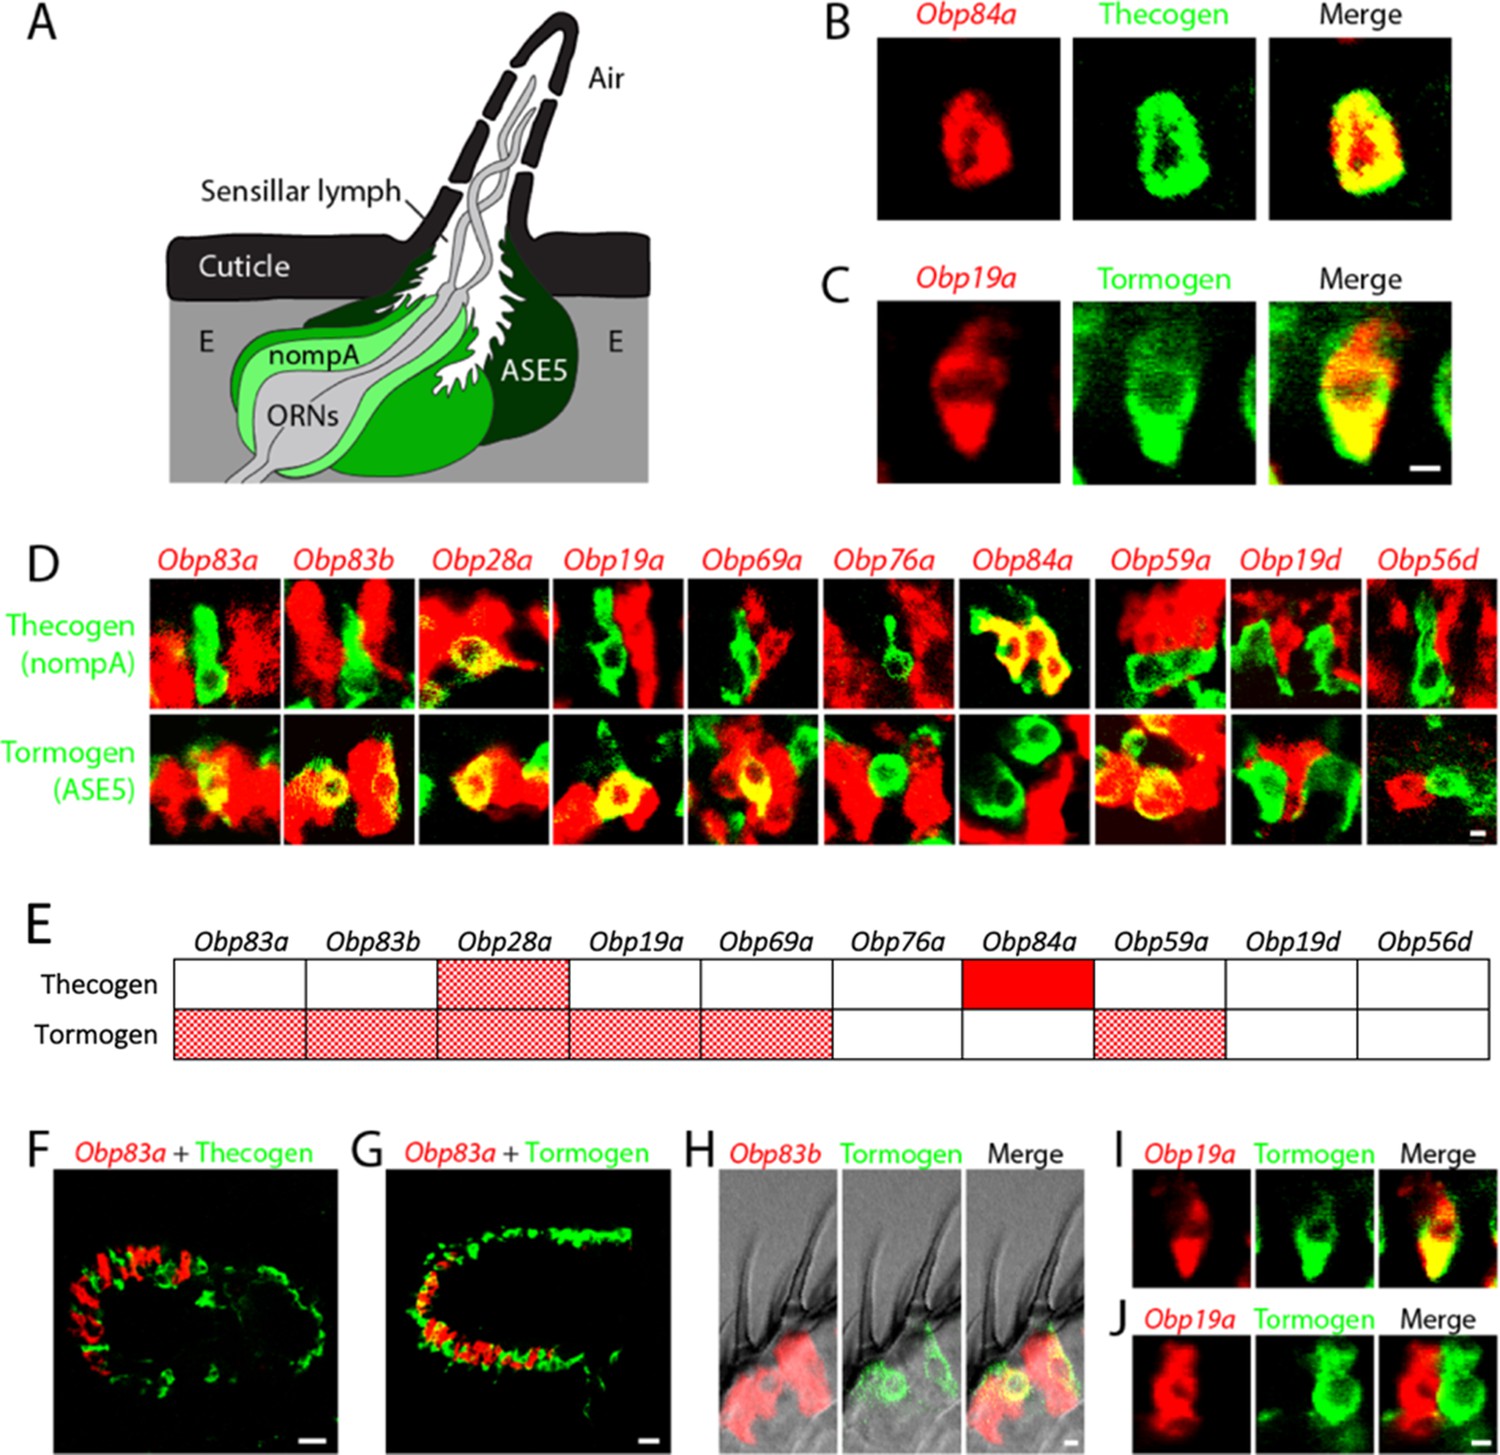
Obps are expressed in different cell types.
(A) Diagram of a generic sensillum containing ORNs, thecogen cells labeled with nompA-GAL4, trichogen cells (Tr), and tormogen cells labeled with ASE5-GAL4, separated from neighboring sensilla by epidermal (E) cells. Adapted from (Steinbrecht et al., 1992). (B–D), (F–J) Confocal images of antennal sections labeled with Obp antisense probes (red) and an antibody against GFP (green) driven by the thecogen cell driver nompA-GAL4 (B,D,F), and the tormogen cell driver ASE5-GAL4 (C–D,G–J). Yellow indicates coexpression. (E) Summary of coexpression experiments. The dark, solid red rectangle indicates that Obp84a was co-expressed with the thecogen cell type marker sensilla consistently in those sensilla that express Obp84a. In many cases, indicated by light, stippled red rectangles, an Obp was co-expressed in a specific cell type in some but not all sensilla. An empty rectangle indicates that the Obp did not co-localize with that cell type marker in any sensilla examined. F,G Images of whole antennal sections. Obp83a is expressed in many cells that are not labeled by the thecogen (F) or tormogen cell driver (G). (H) Two trichoid sensilla that each house one tormogen cell (green) and two Obp83b-expressing cells (red). (I) Obp19a is coexpressed with the tormogen cell driver in one sensillum. The image shows the same cell as in (C) but in a different focal plane. (J) Obp19a is not coexpressed with the tormogen cell driver in another sensillum. Scale bars = 2 μm.
Figure 4—figure supplement 1
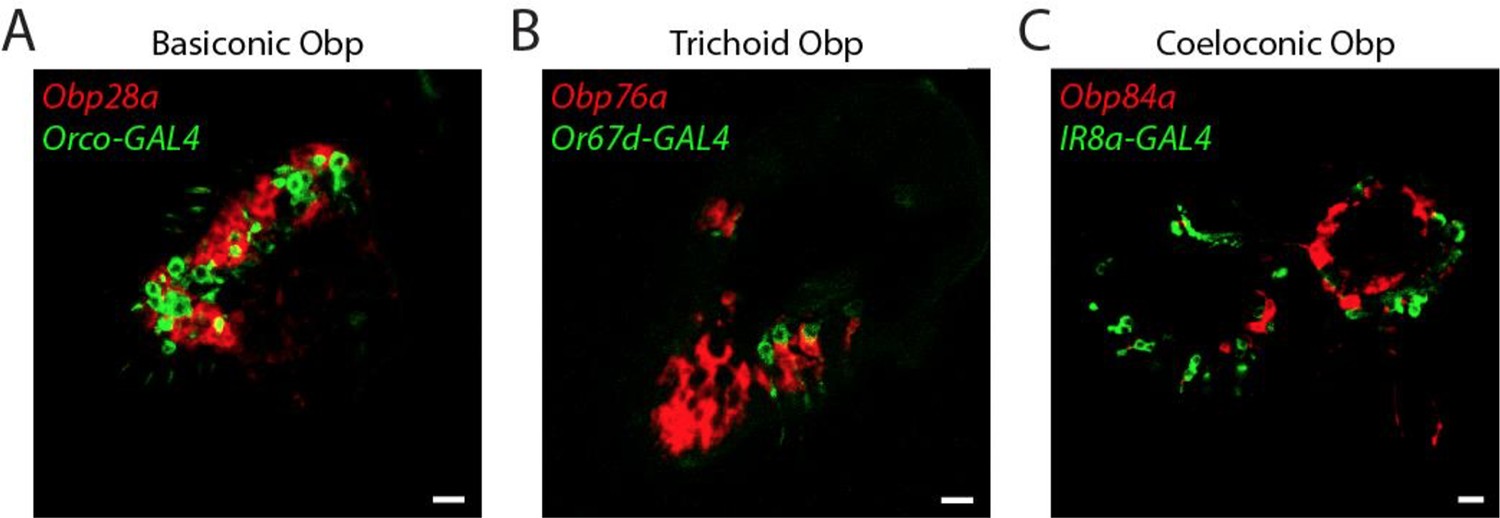
Lack of Obp expression in ORNs.
Confocal images of antennal sections labeled with antisense probes for the indicated Obps (red) and an antibody against GFP (green) driven by neuronal GAL4 drivers. (A) The Obp28a probe labels all basiconic sensilla. Orco-GAL4 labels all ORNs in basiconic sensilla, as well as all ORNS in trichoid sensilla (Larsson et al., 2004). Coexpression is not observed. (B) The Obp76a probe labels most if not all trichoid sensilla. Or67d-GAL4 labels an ORN in at1 sensilla (Couto et al., 2005). Coexpression is not observed. (C) The Obp84a probe and IR8a-GAL4 label most coeloconic sensilla (Abuin et al., 2011). Coexpression is not observed. Scale bars = 10 µm.
Figure 5 with 1 supplement
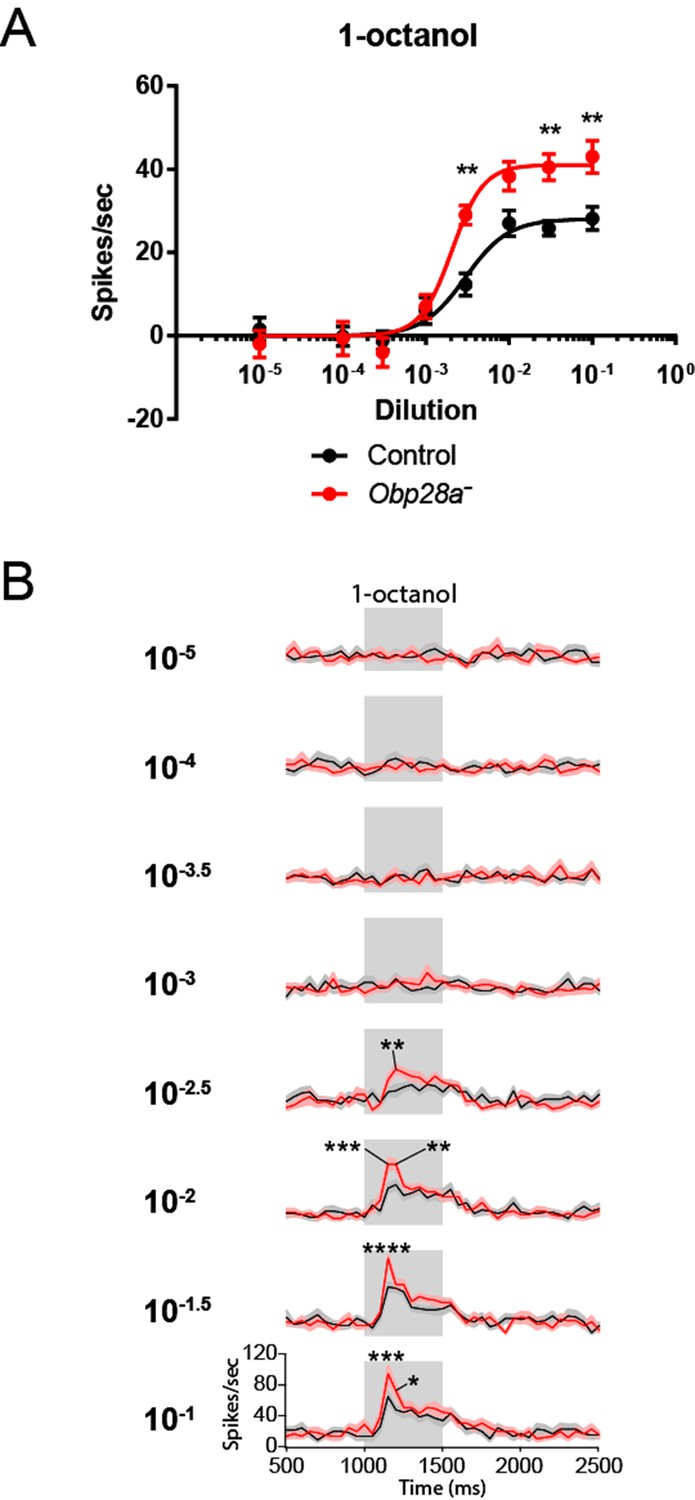
Robust and increased response of ab8 to 1-octanol in an Obp28a mutant.
(A) Dose-response curves of control (black) and Obp28a- (red) ab8 neuronal responses to a 0.5s pulse of 1-octanol. Responses were quantified by subtracting the spontaneous firing rate from the rate during the stimulus. The spike rates of both neurons were summed. (B) Peri-stimulus time histograms (PSTHs) of ab8 responses to increasing doses of 1-octanol. Gray boxes denote 0.5s stimulus presentations. The baseline firing rates of the mutant and control are comparable. Graphs display 2s time windows in 50 ms bins. Shaded areas surrounding each curve indicate SEM. * p<0.05, ** p<0.01, *** p<0.001, **** p<0.0001, n = 12.
Figure 5—figure supplement 1
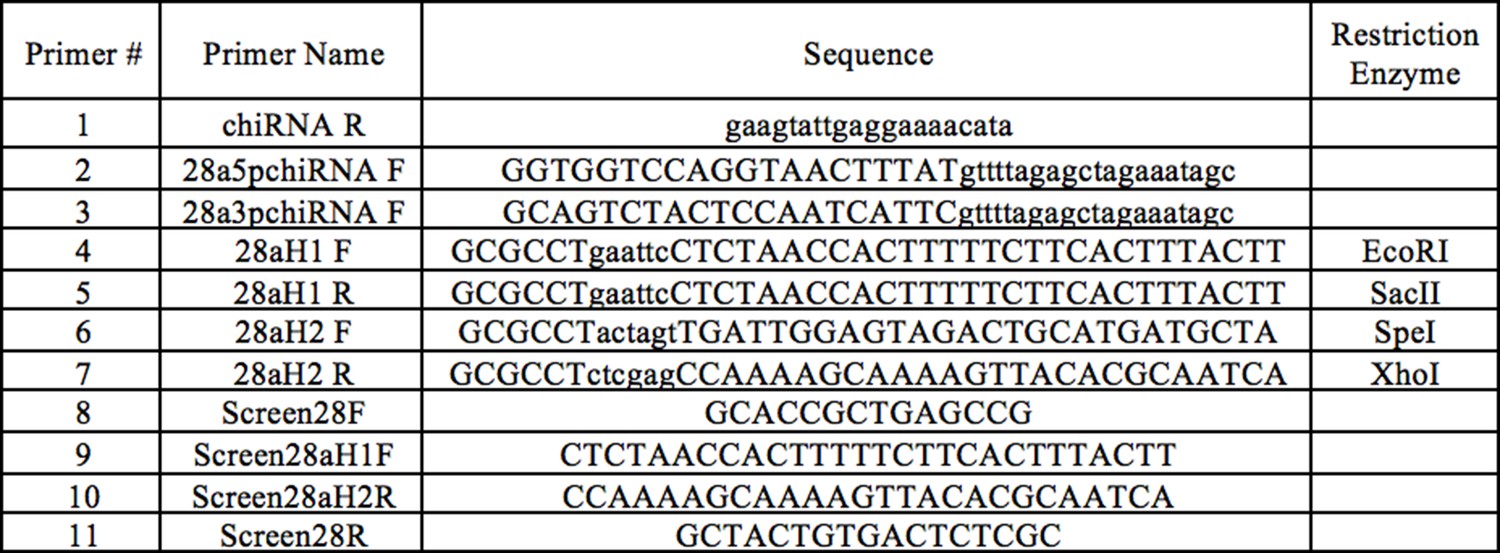
CRISPR mutant cloning and verification primers.
Primers #1–3 were used for creating CRISPR Guide chiRNA, primers #4–7 were used for constructing the CRISPR donor plasmid, and primers #8–11 were used to verify Obp28a deletion in transgenic flies.
Figure 6

Altered responses of Obp28a in prolonged stimulus paradigms.
(A) PSTH of ab8 responses to 30s presentations of a 10−1.5 dilution of 1-octanol in control (black) and Obp28a- (red). Gray box indicates stimulus presentation. Shaded areas display SEM. The graph displays a 60 s time window in 1 s bins. • p<0.05, n = 18; we note that for five of the bins, p<0.0001. We also asked whether the increased initial response of the mutant, indicated by *, was significant when the responses were examined in 50 ms bins, as in Figure 5, and found that p<0.05. (B) Background firing rates in response to prolonged (>5 min) stimulation of a 10−2.5 dilution of 1-octanol. Each bar represents data prior to the administration of a short pulse of the indicated dose. ns = not significant, n = 16. C Dose-response curves of ab8 neurons to increasing doses of 1-octanol superimposed on the 10−2.5 1-octanol background. Spike rates are calculated from the number of spikes during the stimulus period, without subtracting the background firing rate. **** p<0.0001, n = 16.
Figure 7 with 1 supplement

Obp28a mutants show robust and increased responses to other odorants that activate ab8A or ab8B Dose-response curves of control (black) and Obp28a- (red) ab8 neuronal responses to a 0.5s pulse of butyric acid (A) and ethyl acetate (B).
Responses were quantified by subtracting the spontaneous firing rate from the rate during the stimulus. * p<0.05, ** p<0.01, *** p<0.001. PSTHs of butyric acid (C) and ethyl acetate (D) responses are shown, with shaded areas indicating SEM. Gray boxes indicate 0.5 s stimulus presentations. Graphs depict 2s time windows with spikes summed in 50 ms bins. • indicates p<0.05 in all cases and p<0.01 in 80% of these cases. n = 12 (A,C) and 13 (B,D). (E) Responses of control (black) and Obp28a- (red) ab8 neurons to 0.5s pulses of odorants of different chemical classes: 3-methylthio-1-propanol (sulfur compound), γ-hexalactone (lactone), linalool oxide (terpene), methyl benzoate (aromatic), furfural (aldehyde), 2-pentanone (ketone), 2-pentanol (alcohol), and ethyl-3-hydroxybutyrate (ester). Responses were quantified by subtracting the spontaneous firing rate from the rate during the stimulus. * p<0.05, ** p<0.01. n = 12.
Figure 7—figure supplement 1
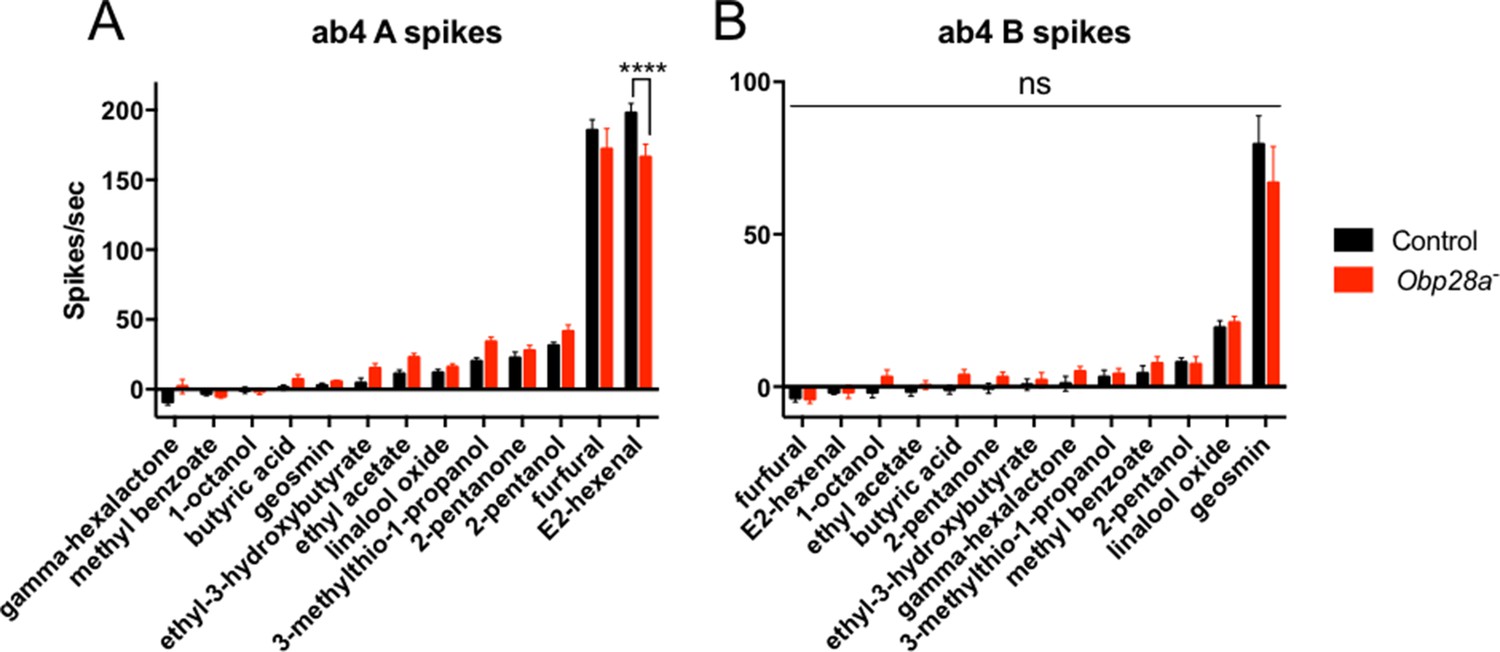
Robust responses from ab4 sensilla of Obp28a mutants to odorants that activate ab4A or ab4B.
Responses of control (black) and Obp28a- (red) ab4 neurons to 0.5s pulses of the odorants representing different chemical classes that were tested against ab8 as well as additional odorants that elicit strong responses from ab4A (E2-hexenal) and ab4B (geosmin). Responses were quantified by subtracting the spontaneous firing rate from the rate during the stimulus. **** p<0.0001 n = 12.
Figure 8
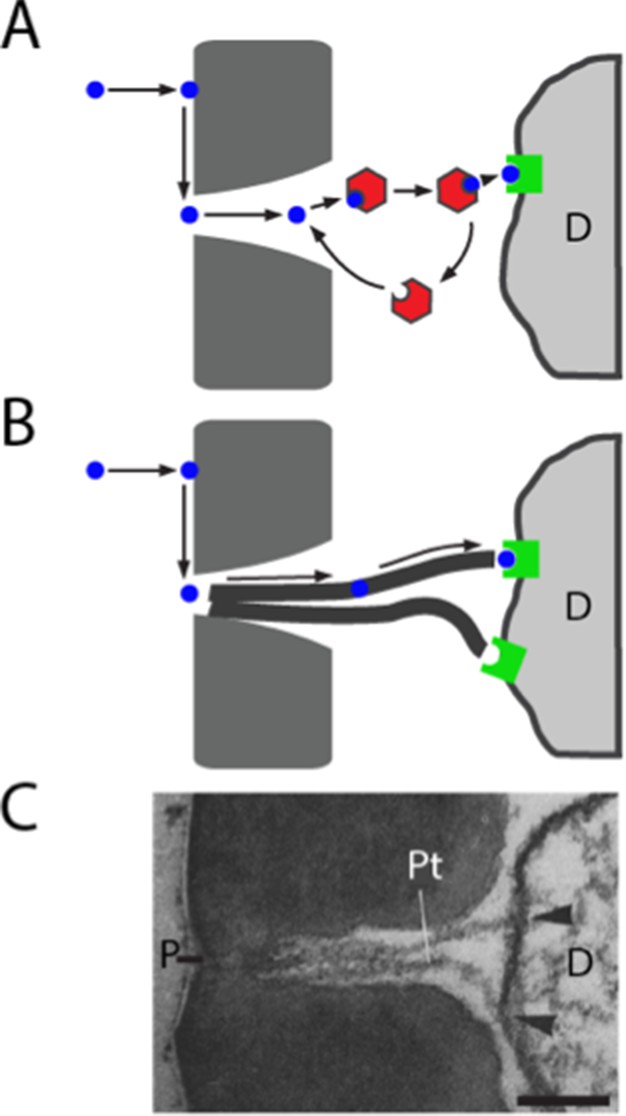
Models of odorant transport via Obps or pore tubules.
(A) Odorant transport via Obps in a sensillum. An odorant molecule contacts the membrane, diffuses in the surface of the cuticle (dark gray) until it reaches a pore, enters the sensillum lymph through the pore, binds to an Obp (red hexagon), and is transported to an olfactory receptor (green square) on an ORN dendrite (D). (B) Odorant transport via pore tubules. An odorant molecule contacts and diffuses on the cuticle surface, enters a pore, and is transported along a pore tubule to an olfactory receptor on a dendrite (D). An Obp could bind to the odorant and affect dynamics at any point after the odorant reaches the pore. (C) Transmission electron micrograph of the pore (P) and pore tubules (Pt) of a trichoid sensillum of Bombyx mori. Adapted from (Steinbrecht, 1973). Pore tubules can be seen to contact an ORN dendrite (D) in two locations (arrowheads). Scale bar = 0.1 μm.
Additional files
-
Supplementary file 1
Deleted regions of Obp28a gene Sequence of Obp28a genomic region.
PAM cleavage sites were located 19-nt downstream of the 5’ end and 37-nt downstream of the 3’ end of the Obp28a coding sequence.
- https://doi.org/10.7554/eLife.20242.015
Download links
A two-part list of links to download the article, or parts of the article, in various formats.
Downloads (link to download the article as PDF)
Open citations (links to open the citations from this article in various online reference manager services)
Cite this article (links to download the citations from this article in formats compatible with various reference manager tools)
Organization and function of Drosophila odorant binding proteins
eLife 5:e20242.
https://doi.org/10.7554/eLife.20242


