Genetic and environmental influences on adult human height across birth cohorts from 1886 to 1994
- University of Helsinki, Finland
- University of the Basque Country, Spain
- Mokpo National University, South Korea
- Osaka City University, Japan
- Institute of Research & Development, Sri Lanka
- Rajarata University of Sri Lanka, Sri Lanka
- NIHR Mental Health Biomedical Research Centre, South London and Maudsley NHS Foundation Trust and, Institute of Psychiatry Psychology and Neuroscience, King's College London, United Kingdom
- Keele University, United Kingdom
- King's College London, United Kingdom
- Institute of Public Health, University of Southern Denmark, Denmark
- Qingdao University Medical College, China
- Qingdao Centers for Disease Control and Prevention, China
- Kirikkale University, Turkey
- Karabuk University, Turkey
- Virginia Commonwealth University, United States
- Semmelweis University, Hungary
- Hungarian Twin Registry, Hungary
- University of Southern Denmark, Denmark
- Odense University Hospital, Denmark
- The University of Melbourne, Australia
- Seoul National University, Korea
- University of Murcia, Spain
- IMIB-Arrixaca, Spain
- QIMR Berghofer Medical Research Institute, Australia
- University of Southern California, United States
- USC Norris Comprehensive Cancer Center, United States
- Seoul National University, South-Korea
- Sungkyunkwan University School of Medicine, South-Korea
- Inje University College of Medicine, Korea
- University of California, San Diego, United States
- VA San Diego Center of Excellence for Stress and Mental Health, United States
- Boston University, United States
- HealthTwiSt GmbH, Germany
- Colorado State University, United States
- Duke University, United States
- Bielefeld University, Germany
- University of British Columbia, Canada
- Karolinska Institutet, Sweden
- The National Academies of Sciences, Engineering, and Medicine, United States
- Istituto Superiore di Sanità - National Center for Epidemiology, Surveillance and Health Promotion, Italy
- Washington State University - Health Sciences Spokane, United States
- Washington State University, United States
- University Hospitals Leuven, Belgium
- Ghent University Hospitals, Belgium
- Icahn School of Medicine at Mount Sinai, United States
- Stanford University School of Medicine, United States
- SRI International, United States
- Jönköping University, Sweden
- Goldsmiths, University of London, United Kingdom
- Örebro University, Sweden
- Healthy Twin Association of Mongolia, Mongolia
- Hiroshima University, Japan
- King's College, United Kingdom
- VU University Amsterdam, Netherlands
- Michigan State University, United States
- Norwegian Institute of Public Health, Norway
- University of Minnesota, United States
- University of Colorado, United States
- University of Washington, United States
- Osaka University, Japan
- Kio University, Japan
- University of Copenhagen, Denmark
- Bispebjerg and Frederiksberg Hospitals, Denmark
- Institute for Molecular Medicine FIMM, Finland
Figures
Figure 1
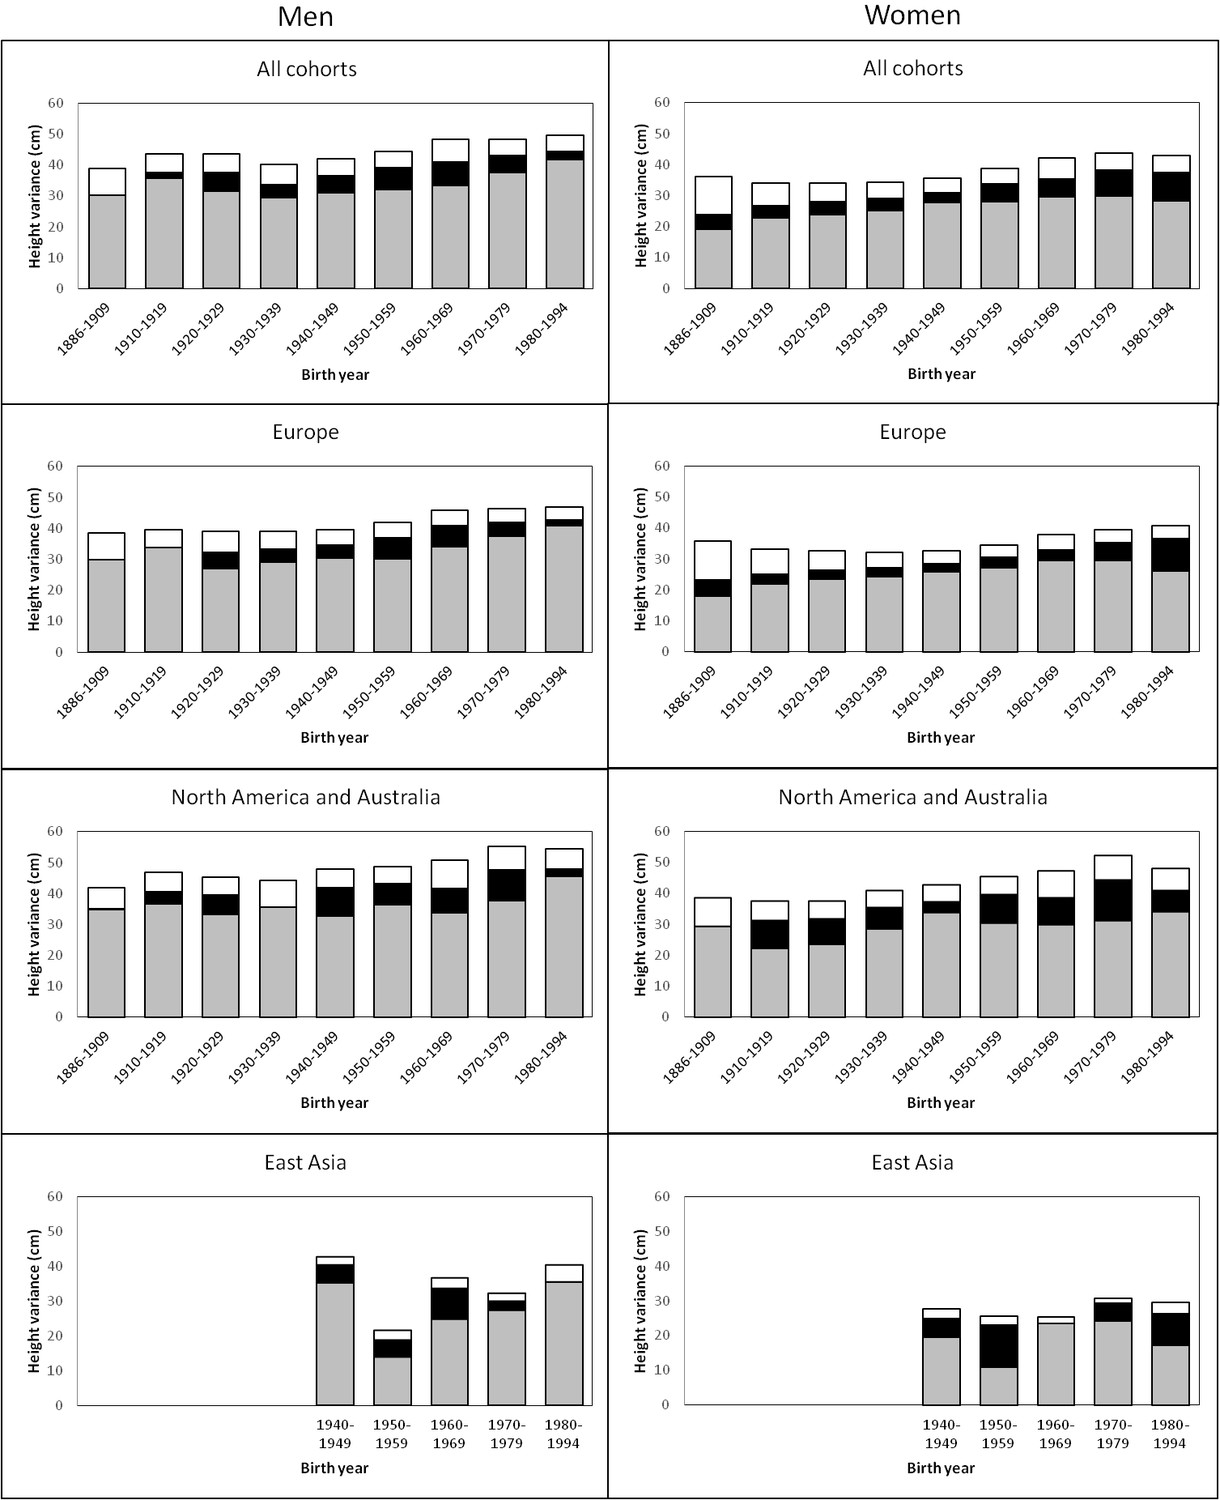
Additive genetic (grey), shared environmental (black) and unique environmental (white) variances of height across birth-year cohorts for the pooled data and by geographic-cultural region.
https://doi.org/10.7554/eLife.20320.003Tables
Table 1
Descriptive statistics of age and height by sex, birth year and geographic-cultural region. Names list of the participating twin cohorts in this study: two cohorts from Australia (Australian Twin Registry and Queensland Twin Register), six cohorts from East-Asia (Korean Twin-Family Register, Mongolian Twin Registry, Osaka University Aged Twin Registry, South Korea Twin Registry, Qingdao Twin Registry of Adults and West Japan Twins and Higher Order Multiple Births Registry), 18 cohorts from Europe (Adult Netherlands Twin Registry, Berlin Twin Register, Bielefeld Longitudinal Study of Adult Twins, Danish Twin Cohort, East Flanders Prospective Twin Survey, Finnish Older Twin Cohort, FinnTwin12, FinnTwin16, Genesis 12–19 Study, Hungarian Twin Registry, Italian Twin Registry, Murcia Twin Registry, Norwegian Twin Registry, Swedish Twin Cohorts, Swedish Young Male Twins Study of Adults, TCHAD-study, TwinsUK and Young Netherlands Twin Registry), two cohorts from South-Asia and Middle-East (Sri Lanka Twin Registry and Turkish Twin Study) and 12 cohorts from North-America (California Twin Program, Carolina African American Twin Study of Aging, Colorado Twin Registry, Michigan State University Twin Registry, Mid Atlantic Twin Registry, Minnesota Twin Registry, NAS-NRC Twin Registry, SRI-international, University of British Columbia Twin Project, University of Southern California Twin Study, University of Washington Twin Registry and Vietnam Era Twin Study of Aging).
Age | Height | ||||||||||||||||||
|---|---|---|---|---|---|---|---|---|---|---|---|---|---|---|---|---|---|---|---|
All cohorts | All cohorts | Europe | NA and Australia | East Asia | |||||||||||||||
Birth year | Mean | SD | Range | N | Mean (F, p-value)* | SD (F, p-value)† | N | Mean | SD | N | Mean | SD | N | Mean | SD | ||||
Men | |||||||||||||||||||
1886–1909 | 67.0 | 7.5 | 53.5–99.2 | 3747 | 171.6 (15, < 0.001) | 6.34 (2.5,0.019) | 3569 | 171.5 | 6.27 | 178 | 174.6 | 6.88 | |||||||
1910–1919 | 52.2 | 16.2 | 20.0–95.8 | 9171 | 174.2 (23, < 0.001) | 6.72 (5.0,<0.001) | 4117 | 173.3 | 6.37 | 5052 | 174.9 | 6.91 | |||||||
1920–1929 | 51.6 | 16.1 | 20.0–90.9 | 23147 | 175.4 (62, < 0.001) | 6.81 (5.7,<0.001) | 6382 | 173.9 | 6.42 | 16714 | 176.0 | 6.82 | |||||||
1930–1939 | 57.5 | 10.5 | 33.5–83.2 | 12028 | 175.7 (413, < 0.001) | 6.70 (2.9,<0.001) | 9308 | 175.2 | 6.42 | 2658 | 178.1 | 6.78 | |||||||
1940–1949 | 49.3 | 10.6 | 23.5–73.9 | 22967 | 177.4 (72, < 0.001) | 6.73 (2.5,<0.001) | 16629 | 177.0 | 6.53 | 6235 | 178.4 | 6.95 | 68 | 164.8 | 6.57 | ||||
1950–1959 | 41.4 | 10.0 | 19.5–65.0 | 24560 | 178.4 (120, < 0.001) | 6.96 (6.5,<0.001) | 15199 | 178.5 | 6.73 | 9124 | 178.7 | 7.04 | 161 | 167.1 | 4.79 | ||||
1960–1969 | 35.5 | 7.1 | 19.5–54.0 | 13264 | 179.0 (99, < 0.001) | 7.49 (2.3,<0.001) | 6218 | 179.6 | 7.04 | 6574 | 179.2 | 7.22 | 298 | 168.1 | 6.24 | ||||
1970–1979 | 28.7 | 5.4 | 19.5–44.0 | 14975 | 179.9 (121, < 0.001) | 7.55 (5.5,<0.001) | 10339 | 180.7 | 7.01 | 3906 | 179.7 | 7.51 | 456 | 170.1 | 5.68 | ||||
1980–1994 | 23.1 | 3.2 | 19.5–34.4 | 9948 | 178.4 (70, < 0.001) | 7.59 (4.9,<0.001) | 5077 | 178.8 | 7.22 | 4066 | 179.4 | 7.49 | 329 | 173.1 | 6.37 | ||||
Women | |||||||||||||||||||
1886–1909 | 68.5 | 8.1 | 53.5–98.0 | 5423 | 160.2 (23, < 0.001) | 6.14 (3.3,0.006) | 5011 | 160.2 | 6.11 | 412 | 160.2 | 6.41 | |||||||
1910–1919 | 62.0 | 10.9 | 43.6–95.9 | 7169 | 161.1 (18, < 0.001) | 5.93 (2.5,0.002) | 5621 | 161.0 | 5.85 | 1548 | 161.2 | 6.20 | |||||||
1920–1929 | 59.7 | 11.4 | 37.5–91.7 | 10975 | 162.1 (65, < 0.001) | 5.99 (3.8,<0.001) | 7908 | 162.0 | 5.89 | 3052 | 162.4 | 6.16 | |||||||
1930–1939 | 57.9 | 10.0 | 33.5–83.0 | 14610 | 162.7 (249, < 0.001) | 6.05 (5.8,<0.001) | 11226 | 162.5 | 5.83 | 3344 | 163.2 | 6.49 | |||||||
1940–1949 | 49.9 | 10.2 | 23.5–74.0 | 28537 | 163.7 (175, < 0.001) | 6.19 (10.3,<0.001) | 20097 | 163.9 | 5.93 | 8285 | 163.5 | 6.57 | 100 | 153.6 | 5.33 | ||||
1950–1959 | 41.3 | 9.5 | 19.5–64.0 | 31250 | 164.4 (146, < 0.001) | 6.58 (13.6,<0.001) | 18817 | 164.8 | 6.22 | 12080 | 164.1 | 6.78 | 225 | 155.1 | 5.10 | ||||
1960–1969 | 35.8 | 6.9 | 19.5–54.3 | 20422 | 165.1 (163, < 0.001) | 7.00 (8.6,<0.001) | 9604 | 166.2 | 6.58 | 10182 | 164.6 | 6.87 | 438 | 156.8 | 5.17 | ||||
1970–1979 | 29.3 | 5.4 | 19.5–44.3 | 19893 | 165.9 (180, < 0.001) | 7.27 (11.5,<0.001) | 11819 | 167.3 | 6.67 | 7034 | 165.0 | 7.22 | 718 | 158.5 | 5.58 | ||||
1980–1994 | 23.4 | 3.3 | 19.5–34.3 | 14694 | 164.7 (118, < 0.001) | 7.07 (6.2,<0.001) | 7291 | 165.6 | 6.77 | 6274 | 164.9 | 6.96 | 633 | 159.8 | 5.74 | ||||
-
*Welch ANOVA test for equality of means
-
†Levene’s test for equality of variances; SD: standard deviation
Table 2
Proportion of the height variance explained by additive genetic, shared environmental and unique environmental factors by birth year, sex and geographic-cultural region.
Men | Women | ||||||||||||||||||||||
|---|---|---|---|---|---|---|---|---|---|---|---|---|---|---|---|---|---|---|---|---|---|---|---|
Additive genetics | Shared environment | Unique environment | Additive genetics | Shared environment | Unique environment | ||||||||||||||||||
Birth year | A | 95% CIs | C | 95% CIs | E | 95% CIs | A | 95% CIs | C | 95% CIs | E | 95% CIs | |||||||||||
All cohorts | |||||||||||||||||||||||
1886–1909 | 0.78 | 0.69 | 0.80 | 0.00 | 0.00 | 0.08 | 0.22 | 0.20 | 0.25 | 0.53 | 0.43 | 0.62 | 0.13 | 0.05 | 0.21 | 0.34 | 0.31 | 0.37 | |||||
1910–1919 | 0.82 | 0.76 | 0.87 | 0.04 | 0.00 | 0.10 | 0.14 | 0.13 | 0.15 | 0.67 | 0.60 | 0.74 | 0.11 | 0.04 | 0.18 | 0.22 | 0.20 | 0.24 | |||||
1920–1929 | 0.72 | 0.69 | 0.76 | 0.14 | 0.10 | 0.17 | 0.14 | 0.13 | 0.15 | 0.70 | 0.64 | 0.76 | 0.12 | 0.07 | 0.18 | 0.18 | 0.17 | 0.19 | |||||
1930–1939 | 0.73 | 0.68 | 0.79 | 0.10 | 0.04 | 0.16 | 0.16 | 0.15 | 0.18 | 0.74 | 0.68 | 0.79 | 0.11 | 0.06 | 0.16 | 0.15 | 0.14 | 0.16 | |||||
1940–1949 | 0.74 | 0.70 | 0.78 | 0.13 | 0.09 | 0.17 | 0.13 | 0.12 | 0.13 | 0.78 | 0.75 | 0.82 | 0.09 | 0.05 | 0.13 | 0.13 | 0.12 | 0.13 | |||||
1950–1959 | 0.72 | 0.69 | 0.76 | 0.16 | 0.12 | 0.20 | 0.12 | 0.11 | 0.12 | 0.73 | 0.69 | 0.76 | 0.15 | 0.11 | 0.18 | 0.12 | 0.12 | 0.13 | |||||
1960–1969 | 0.69 | 0.63 | 0.76 | 0.16 | 0.09 | 0.21 | 0.15 | 0.14 | 0.16 | 0.70 | 0.66 | 0.75 | 0.14 | 0.09 | 0.18 | 0.16 | 0.15 | 0.17 | |||||
1970–1979 | 0.77 | 0.72 | 0.83 | 0.11 | 0.06 | 0.17 | 0.11 | 0.10 | 0.12 | 0.68 | 0.64 | 0.73 | 0.19 | 0.14 | 0.23 | 0.13 | 0.12 | 0.13 | |||||
1980–1994 | 0.84 | 0.77 | 0.90 | 0.05 | 0.00 | 0.13 | 0.11 | 0.10 | 0.12 | 0.66 | 0.61 | 0.72 | 0.21 | 0.16 | 0.27 | 0.13 | 0.12 | 0.13 | |||||
Europe | |||||||||||||||||||||||
1886–1909 | 0.78 | 0.69 | 0.80 | 0.00 | 0.00 | 0.08 | 0.22 | 0.20 | 0.25 | 0.50 | 0.40 | 0.60 | 0.14 | 0.06 | 0.23 | 0.35 | 0.32 | 0.39 | |||||
1910–1919 | 0.85 | 0.79 | 0.87 | 0.00 | 0.00 | 0.07 | 0.15 | 0.13 | 0.16 | 0.66 | 0.58 | 0.74 | 0.10 | 0.02 | 0.17 | 0.24 | 0.22 | 0.26 | |||||
1920–1929 | 0.69 | 0.62 | 0.76 | 0.14 | 0.07 | 0.20 | 0.17 | 0.16 | 0.19 | 0.72 | 0.65 | 0.79 | 0.09 | 0.03 | 0.16 | 0.19 | 0.17 | 0.21 | |||||
1930–1939 | 0.75 | 0.69 | 0.81 | 0.11 | 0.05 | 0.17 | 0.14 | 0.13 | 0.16 | 0.76 | 0.70 | 0.82 | 0.09 | 0.03 | 0.14 | 0.16 | 0.15 | 0.17 | |||||
1940–1949 | 0.77 | 0.72 | 0.82 | 0.10 | 0.06 | 0.15 | 0.13 | 0.12 | 0.13 | 0.79 | 0.75 | 0.83 | 0.08 | 0.04 | 0.13 | 0.13 | 0.12 | 0.13 | |||||
1950–1959 | 0.72 | 0.68 | 0.77 | 0.16 | 0.11 | 0.20 | 0.12 | 0.11 | 0.12 | 0.79 | 0.75 | 0.83 | 0.09 | 0.05 | 0.13 | 0.12 | 0.11 | 0.13 | |||||
1960–1969 | 0.74 | 0.66 | 0.83 | 0.15 | 0.06 | 0.23 | 0.11 | 0.10 | 0.12 | 0.78 | 0.72 | 0.85 | 0.08 | 0.02 | 0.15 | 0.13 | 0.12 | 0.14 | |||||
1970–1979 | 0.81 | 0.74 | 0.88 | 0.09 | 0.02 | 0.16 | 0.10 | 0.09 | 0.10 | 0.74 | 0.69 | 0.81 | 0.15 | 0.09 | 0.21 | 0.11 | 0.10 | 0.11 | |||||
1980–1994 | 0.87 | 0.77 | 0.92 | 0.04 | 0.00 | 0.14 | 0.09 | 0.08 | 0.10 | 0.64 | 0.57 | 0.72 | 0.26 | 0.18 | 0.32 | 0.10 | 0.09 | 0.11 | |||||
North America and Australia | |||||||||||||||||||||||
1886–1909 | 0.83 | 0.33 | 0.90 | 0.01 | 0.00 | 0.49 | 0.16 | 0.10 | 0.26 | 0.76 | 0.43 | 0.82 | 0.00 | 0.00 | 0.31 | 0.24 | 0.18 | 0.32 | |||||
1910–1919 | 0.78 | 0.70 | 0.87 | 0.09 | 0.00 | 0.17 | 0.13 | 0.12 | 0.15 | 0.60 | 0.44 | 0.78 | 0.24 | 0.06 | 0.39 | 0.16 | 0.14 | 0.19 | |||||
1920–1929 | 0.73 | 0.69 | 0.77 | 0.14 | 0.10 | 0.18 | 0.13 | 0.12 | 0.14 | 0.63 | 0.52 | 0.76 | 0.22 | 0.09 | 0.33 | 0.15 | 0.14 | 0.17 | |||||
1930–1939 | 0.81 | 0.66 | 0.83 | 0.00 | 0.00 | 0.14 | 0.19 | 0.17 | 0.22 | 0.70 | 0.59 | 0.82 | 0.17 | 0.04 | 0.28 | 0.13 | 0.12 | 0.15 | |||||
1940–1949 | 0.69 | 0.61 | 0.77 | 0.19 | 0.10 | 0.27 | 0.13 | 0.12 | 0.14 | 0.80 | 0.72 | 0.87 | 0.08 | 0.00 | 0.15 | 0.13 | 0.12 | 0.14 | |||||
1950–1959 | 0.75 | 0.68 | 0.82 | 0.14 | 0.07 | 0.21 | 0.11 | 0.10 | 0.12 | 0.67 | 0.61 | 0.73 | 0.21 | 0.15 | 0.26 | 0.13 | 0.12 | 0.13 | |||||
1960–1969 | 0.66 | 0.58 | 0.76 | 0.16 | 0.06 | 0.24 | 0.18 | 0.17 | 0.20 | 0.63 | 0.57 | 0.70 | 0.18 | 0.11 | 0.24 | 0.18 | 0.17 | 0.20 | |||||
1970–1979 | 0.68 | 0.57 | 0.81 | 0.18 | 0.05 | 0.29 | 0.14 | 0.13 | 0.16 | 0.60 | 0.53 | 0.67 | 0.25 | 0.18 | 0.32 | 0.15 | 0.14 | 0.16 | |||||
1980–1994 | 0.83 | 0.72 | 0.89 | 0.04 | 0.00 | 0.16 | 0.12 | 0.11 | 0.14 | 0.71 | 0.62 | 0.81 | 0.14 | 0.04 | 0.23 | 0.15 | 0.14 | 0.16 | |||||
East Asia | |||||||||||||||||||||||
1940–1949 | 0.83 | 0.33 | 0.97 | 0.12 | 0.00 | 0.61 | 0.05 | 0.03 | 0.12 | 0.71 | 0.17 | 0.94 | 0.19 | 0.00 | 0.73 | 0.10 | 0.06 | 0.18 | |||||
1950–1959 | 0.64 | 0.24 | 0.91 | 0.23 | 0.00 | 0.63 | 0.13 | 0.08 | 0.20 | 0.42 | 0.14 | 0.92 | 0.48 | 0.00 | 0.75 | 0.10 | 0.07 | 0.15 | |||||
1960–1969 | 0.67 | 0.36 | 0.94 | 0.24 | 0.00 | 0.56 | 0.08 | 0.06 | 0.12 | 0.92 | 0.67 | 0.94 | 0.00 | 0.00 | 0.25 | 0.08 | 0.06 | 0.10 | |||||
1970–1979 | 0.85 | 0.51 | 0.95 | 0.08 | 0.00 | 0.43 | 0.07 | 0.05 | 0.09 | 0.79 | 0.52 | 0.96 | 0.17 | 0.00 | 0.43 | 0.05 | 0.04 | 0.06 | |||||
1980–1994 | 0.88 | 0.51 | 0.91 | 0.00 | 0.00 | 0.37 | 0.12 | 0.09 | 0.17 | 0.58 | 0.34 | 0.90 | 0.31 | 0.00 | 0.55 | 0.11 | 0.09 | 0.14 | |||||
Additional files
-
Supplementary file 1
Supplementary tables.
(A) Height variance explained by additive genetic, shared environmental and unique environmental factors by birth year, sex and geographic-cultural region. (B) Model fit statistics for adult height by birth-year cohorts (all twin cohorts together). (C) Height variance and proportion of height variance explained by additive genetic, shared environmental and unique environmental factors by birth year, sex and geographic-cultural region.
- https://doi.org/10.7554/eLife.20320.005
Download links
A two-part list of links to download the article, or parts of the article, in various formats.
Downloads (link to download the article as PDF)
Open citations (links to open the citations from this article in various online reference manager services)
Cite this article (links to download the citations from this article in formats compatible with various reference manager tools)
Genetic and environmental influences on adult human height across birth cohorts from 1886 to 1994
eLife 5:e20320.
https://doi.org/10.7554/eLife.20320


