Thalamo-cortical axons regulate the radial dispersion of neocortical GABAergic interneurons
- Karolinska Institute, Sweden
- University of Minnesota Medical School, United States
- National University of Singapore, Singapore
Figures
Figure 1 with 6 supplements

Abnormal laminar distribution of cortical GABAergic interneurons in Gbx2 knock-out mice.
(A) Lhx6-GFP+ interneurons (green) combined with immunostaining (red) for CTIP2 (layer V marker, left panel) or Tbr1 (layer VI marker, right panel) in prospective somatosensory cortex of newborn wild type (wt) and Gbx2 knock-out (ko) mice. Cortical layers are indicated. IZ, intermediate zone. Scale bar, 50 µm. (B–D) Quantification of Lhx6-GFP+ interneurons in upper (B), middle (C) and lower (D) layers of prospective primary motor (M1), somatosensory (S1), and visual (V1) cortices of newborn wild type (wt) and Gbx2 knock-out (ko) mice. Results are expressed as average ± SEM (***p<0.0001; **p<0.0005; ns, not significant, N = 5 mice in each group). (E) Combined quantification of Lhx6-GFP+ interneurons in all layers of prospective M1, S1 and V1 neocortex of newborn wild type (wt) and Gbx2 knock-out (ko) mice. Layer VI was subdivided into VIa (Tbr1+) and VIb (subplate, Tbr1+ and CTGF+). No significant difference in the number of GABAergic interneurons was found in the marginal zone (layer I) of the Gbx2 mutants. Results are expressed as average ± SEM (ns, not significant, N = 5 mice in each group).
Figure 1—figure supplement 1

Loss of TCAs in Gbx2 knock-out mice.
Tracing of TCAs (arrowheads in top panels) after injection of DiI crystals in the dorsal thalamus at E16.5 (upper panels), prospective primary somatosensory (S1, middle panels) or visual (V1, lower panels) cortices of neonatal wild type (wt) and Gbx2 knock-out (Gbx2 ko) mice. ic, internal capsule; DLG, dorsal lateral geniculate nucleus; VLG, ventrolateral geniculate nucleus; VPL, ventral posteriolateral thalamic nucleus. Scale bar, 100 µm.
Figure 1—figure supplement 2
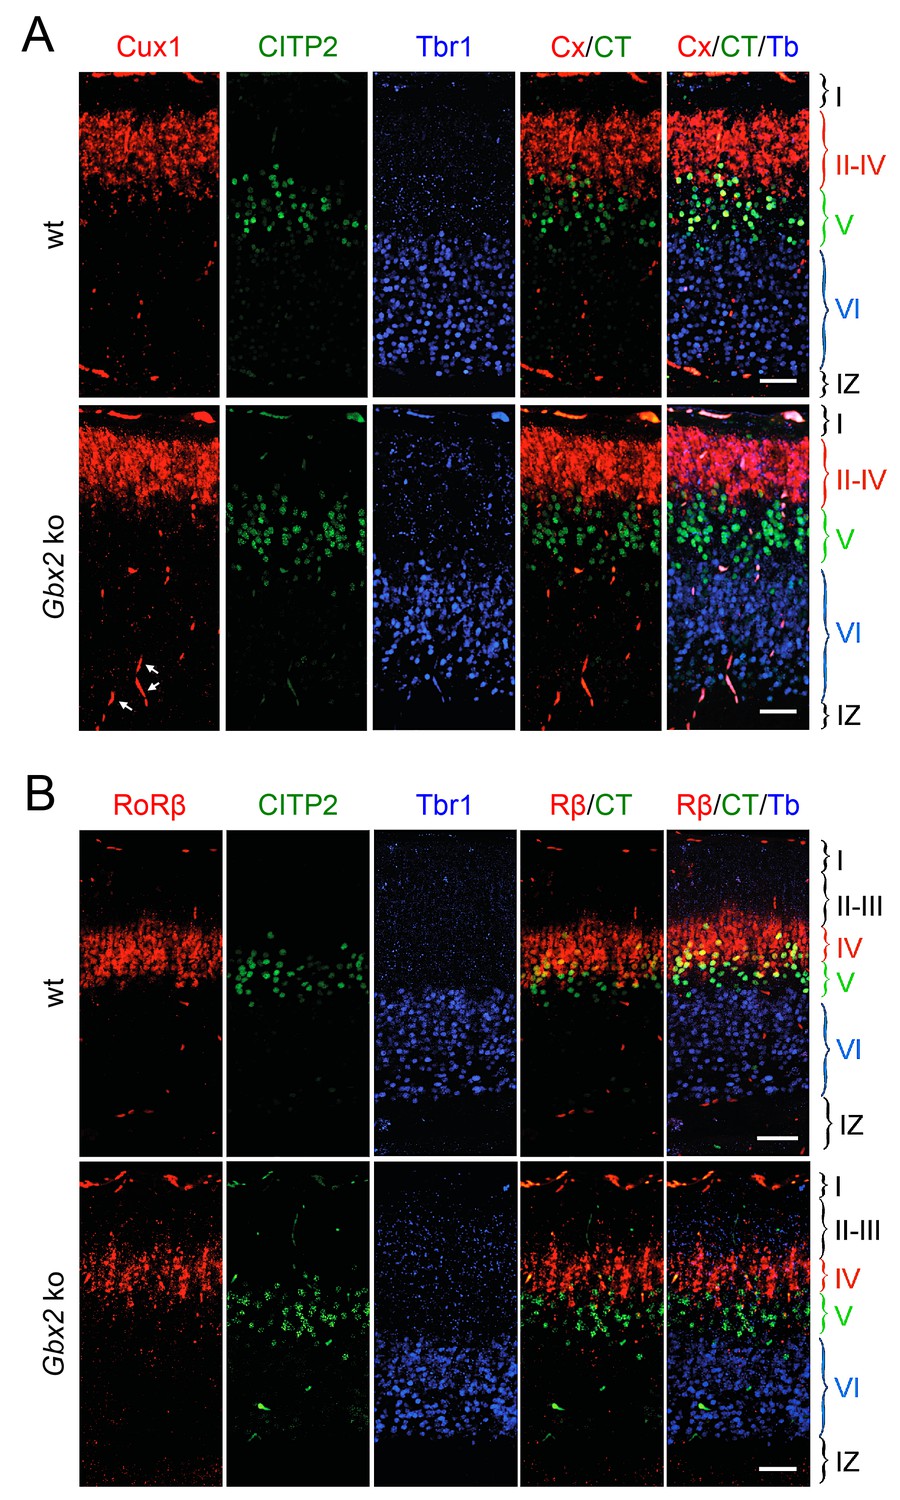
Loss of TCAs in Gbx2 knock-out mice does not affect neocortical layering at birth.
Expression of cortical layer markers (Molyneaux et al., 2007) in prospective S1 cortex of newborn wild type (wt) and Gbx2 knock-out mice. (A) In situ hybridization for Cux1 (CX, a marker of layers II-IV, red) and CTIP2 (CT, a marker of layer V, green) combined with immunohistochemistry for Tbr1 (Tb, a marker of layer VI, blue). Arrows denote unspecifically labeled blood vessels. IZ, intermediate zone. Scale bar, 50 µm. (B) In situ hybridization for RoRβ (Rβ, a marker of layer IV, red), CTIP2 (green) combined with immunohistochemistry for Tbr1 (blue). Scale bar, 50 µm.
Figure 1—figure supplement 3

Loss of TCAs in Gbx2 knock-out mice does not affect neocortical arealization.
Neocortical arealization (sagittal views) in newborn wild type (wt) and Gbx2 knock-out mice assessed by in situ hybridization for Lmo4 (A) and Cad8 (B). Arrowheads indicate borders between different areas. Fr, frontal cortex; Par, parietal cortex (prospective somatosensory cortex); Occ, occipital cortex (prospective visual cortex); Str, striatum; Hip, hippocampus. Scale bar, 250 µm.
Figure 1—figure supplement 4
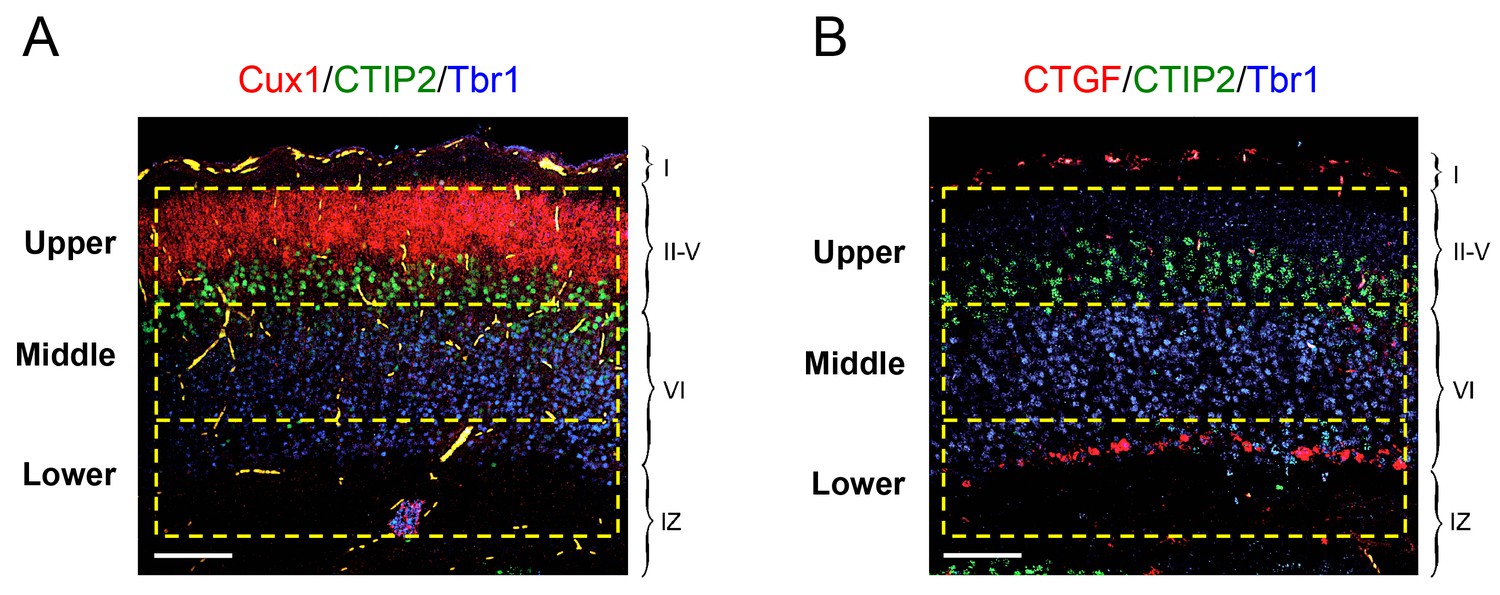
Schematic of upper, middle and lower frames used for quantification of laminar distribution of GABAergic interneurons in newborn mouse neocortex.
In situ hybridization for Cux1 (red, panel A) and CTGF (red, panel B) combined with immunohistochemistry for Tbr1 (blue) and CTIP2 (green). Scale bar, 100 µm. The upper frame encompassed layers II to V demarcated by the expression of Cux1 and CTIP2. The middle frame encompassed the majority of the Tbr1-positive territory between the CTIP2 and CTGF markers (layer VIa). The lower frame included layer VIb (or subplate) expressing CTGF and the underlying intermediate zone (IZ). Each frame was 150 × 600 μm in size, corresponding to an area of 9 × 104 μm2.
Figure 1—figure supplement 5
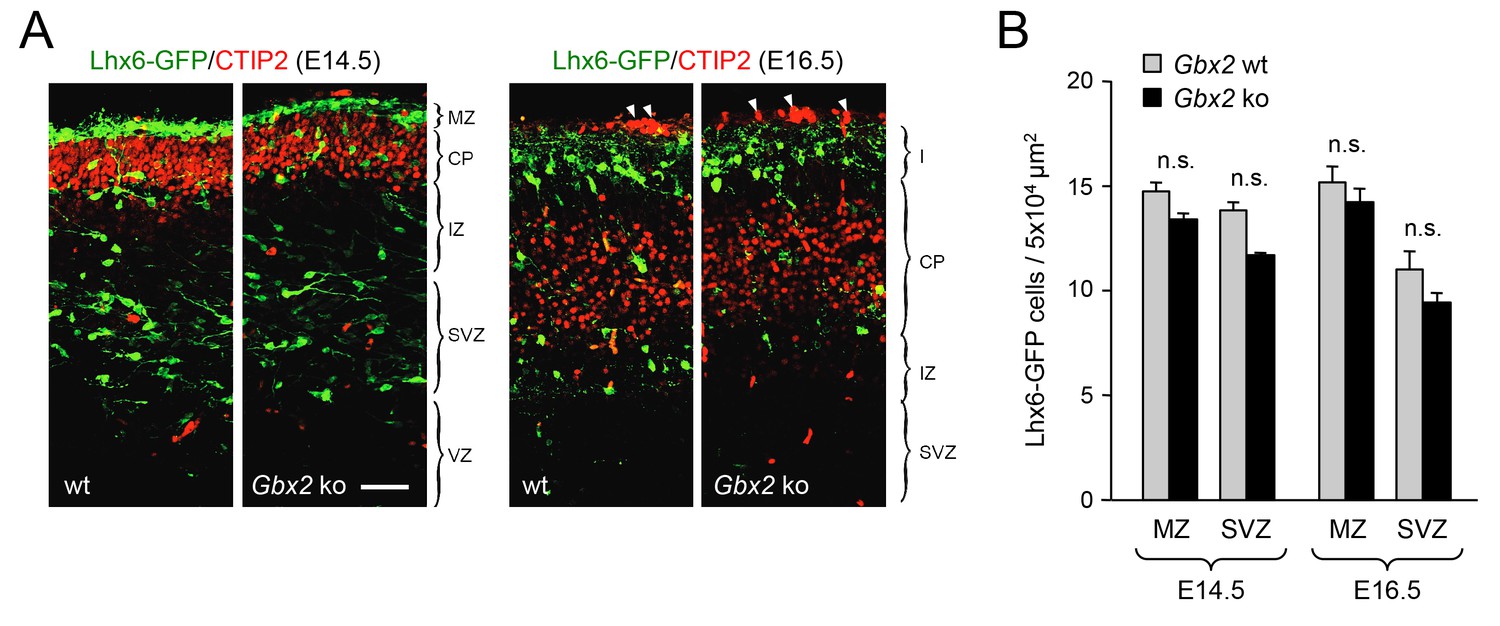
Normal proportion of GABAergic interneurons in superficial versus deep routes of tangential migration in Gbx2 knock-out embryos.
(A) Lhx6-GFP+ interneurons (green) in prospective somatosensory cortex of newborn wild type (wt) and Gbx2 knock-out (ko) mice at E14.5 and E16.5 combined with immunostaining against CTIP2 (red). Arrow head indicate unspecifically labeled blood vessels above cortex. Scale bar, 50 µm. (B) Quantification of Lhx6-GFP+ interneurons in the marginal zone (MZ) and subventricular/intermediate zones (SVZ/IZ) in Gbx2 knock-out and wild type embryos at E14.5 and E16.5. Results are expressed as average ± SEM (n.s., not significant [p > 0.05]; N = 6 mice per group).
Figure 1—figure supplement 6
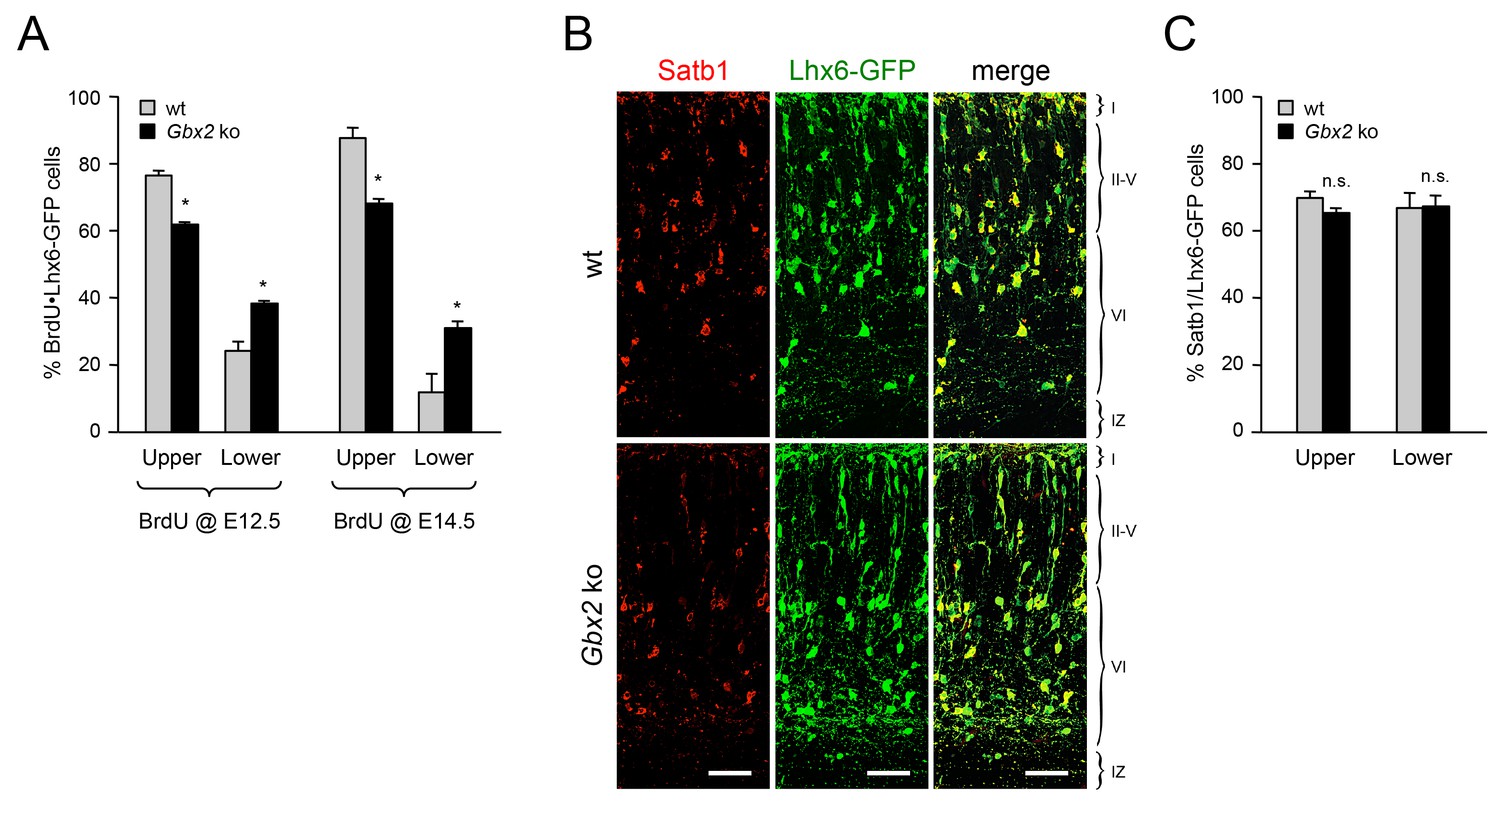
Lack of TCAs in Gbx2 mutant mice affects the laminar distribution of different classes of MGE-derived interneurons to a similar extent.
(A) Relative distribution of BrdU•Lhx6-GFP double positive cells in upper and lower cortical layers of wild type (wt) and Gbx2 knock-out E18.5 embryos injected with BrdU at E12.5 (left) or E14.5 (right). Results are expressed as average percentage ± SEM relative to the total number of BrdU•Lhx6-GFP double positive cells counted (*p<0.05, N = 3 embryos in each group). (B) Satb1+ (red) and Lhx6-GFP+ (green) interneurons in prospective somatosensory cortex of newborn wild type (wt) and Gbx2 knock-out (ko) mice. Scale bar, 50 µm. (C) Quantification of the percentage of Satb1+ cells among Lhx6-GFP+ interneurons in upper and lower cortical layers of wild type (wt) and Gbx2 knock-out newborn mice. Results are expressed as average ± SEM (n.s., non-significant; N = 3 mice).
Figure 2 with 4 supplements
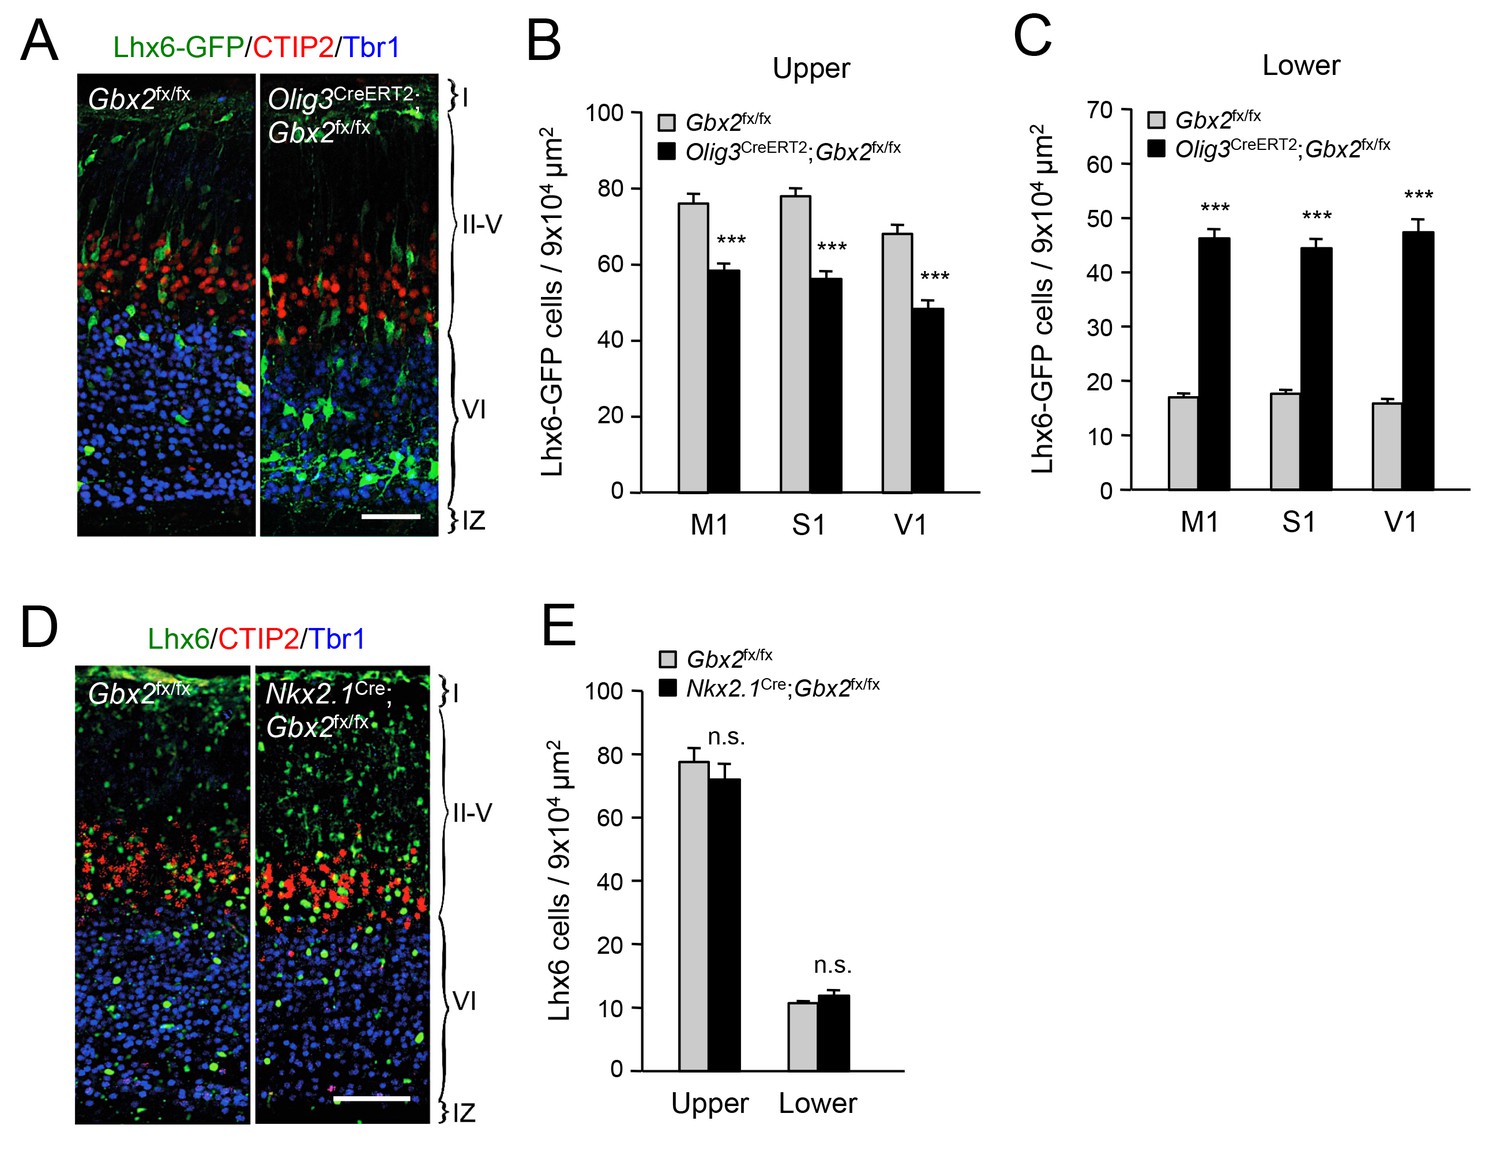
Thalamic Gbx2 affects radial dispersion of cortical GABAergic interneurons non-cell-autonomously.
(A) Lhx6-GFP+ interneurons (green) combined with immunostaining for CTIP2 (red) and Tbr1 (blue) in prospective somatosensory cortex of newborn Olig3-CreERT2;Gbx2fx/fx conditional mutant and Gbx2fx/fx control mice after tamoxifen injection at E10.5. Scale bar, 50 µm. (B–C) Quantification of Lhx6-GFP+ interneurons in upper (B) and lower (B) layers of prospective primary motor (M1), somatosensory (S1), and visual (V1) cortices of newborn Olig3-CreERT2;Gbx2fx/fx conditional mutant and Gbx2fx/fx control mice. Results are expressed as average ± SEM (***p<0.0005; N = 6 mice per group). (D) Lhx6+ interneurons (green) combined with immunostaining for CTIP2 (red) and Tbr1 (blue) in prospective somatosensory cortex of newborn Nkx2.1Cre;Gbx2fx/fx conditional mutant and Gbx2fx/fx control mice. Scale bar, 100 µm. (E) Quantification of Lhx6+ interneurons in upper and lower layers of prospective somatosensory cortex of newborn Nkx2.1Cre;Gbx2fx/fx conditional mutant and Gbx2fx/fx control mice. Results are expressed as average ± SEM (n.s., non-significant; N = 3 mice per group).
Figure 2—figure supplement 1
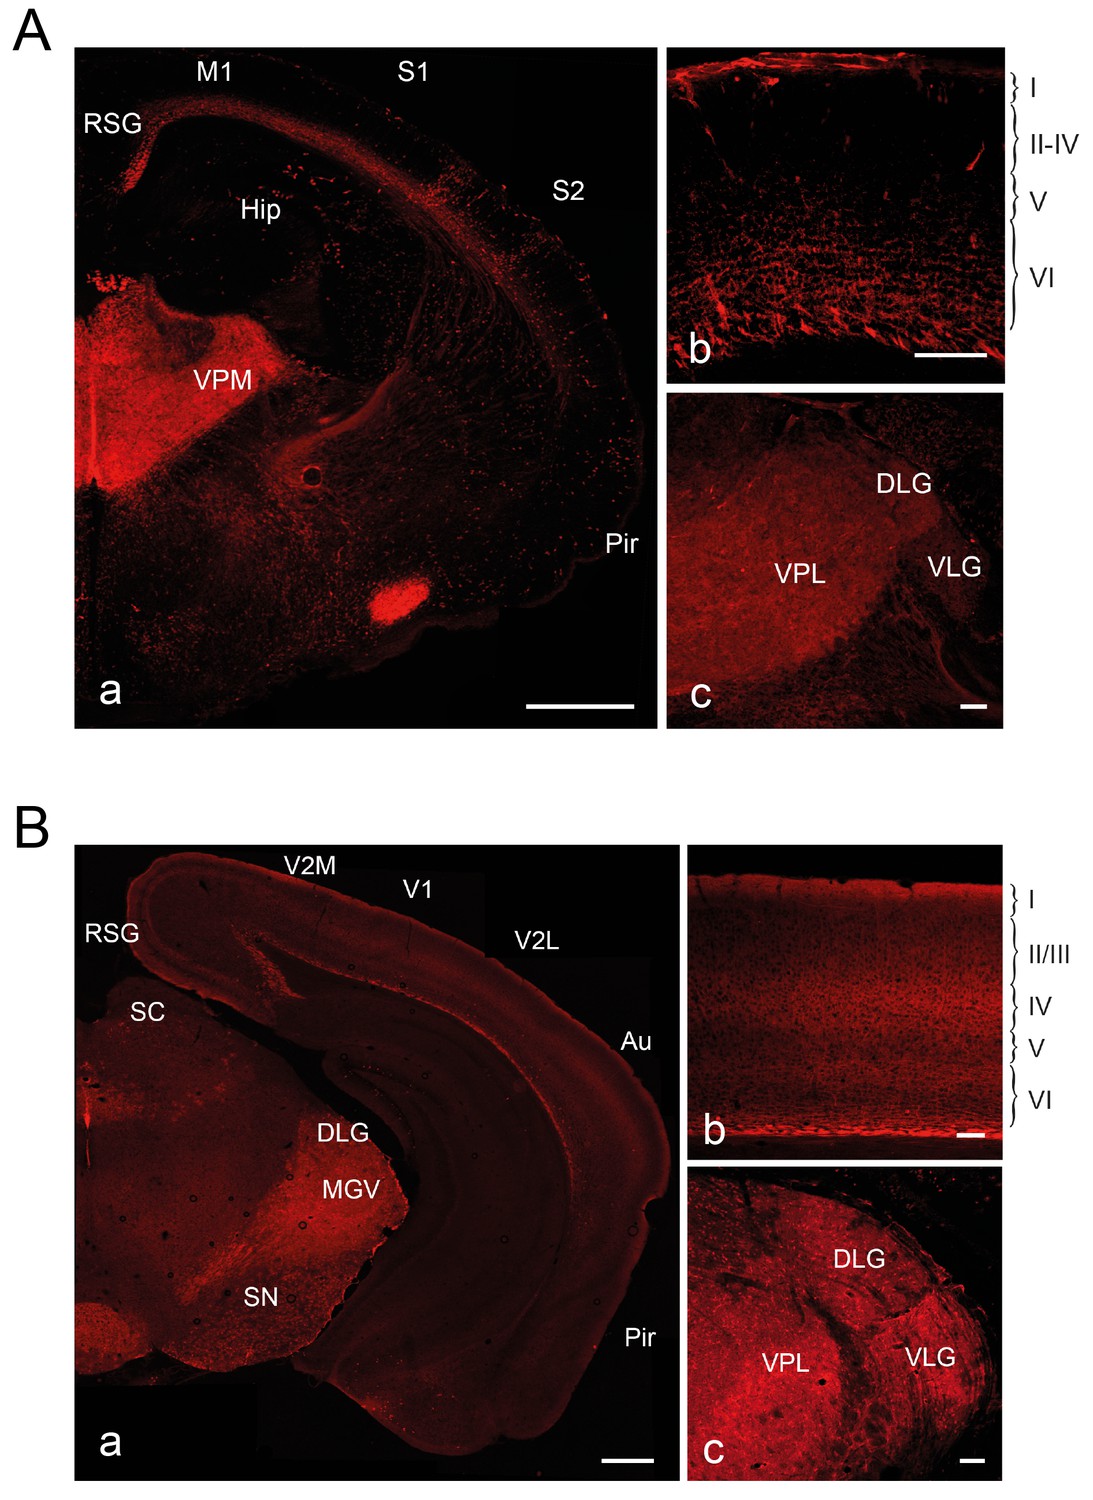
Fate mapping of Olig3+ E10.5 precursors at P0 and P21.
dTomato expression in brains of Olig3-CreERT2;dTom mice at P0 (A) or P21 (B) after tamoxifen administration at E10.5. Shown are fluorescent micrographs of coronal sections taken at the level of the thalamus (a), visual cortex (b) and thalamic sensory and visual projection nuclei (c). RSG, retrosplenial granular cortex; M1, primary motorcortex; S1, primary somatosensory cortex; S2, secondary somatosensory cortex; V1, primary visual cortex; V2M, secondary medial visual cortex; V2L, secondary lateral visual cortex; Hip, hippocampus; Au, auditory cortex; Pir, piriform cortex; MGV, medial geniculate nucleus; SC, superior colliculus, SN, substantia nigra; DLG, dorsal lateral geniculate nucleus; VLG, ventrolateral geniculate nucleus; VPL, ventral posterolateral thalamic nucleus; VPM, ventral posteromedial thalamic nucleus. Scale bars, 500 µm (a) and 100 µm (b and c).
Figure 2—figure supplement 2
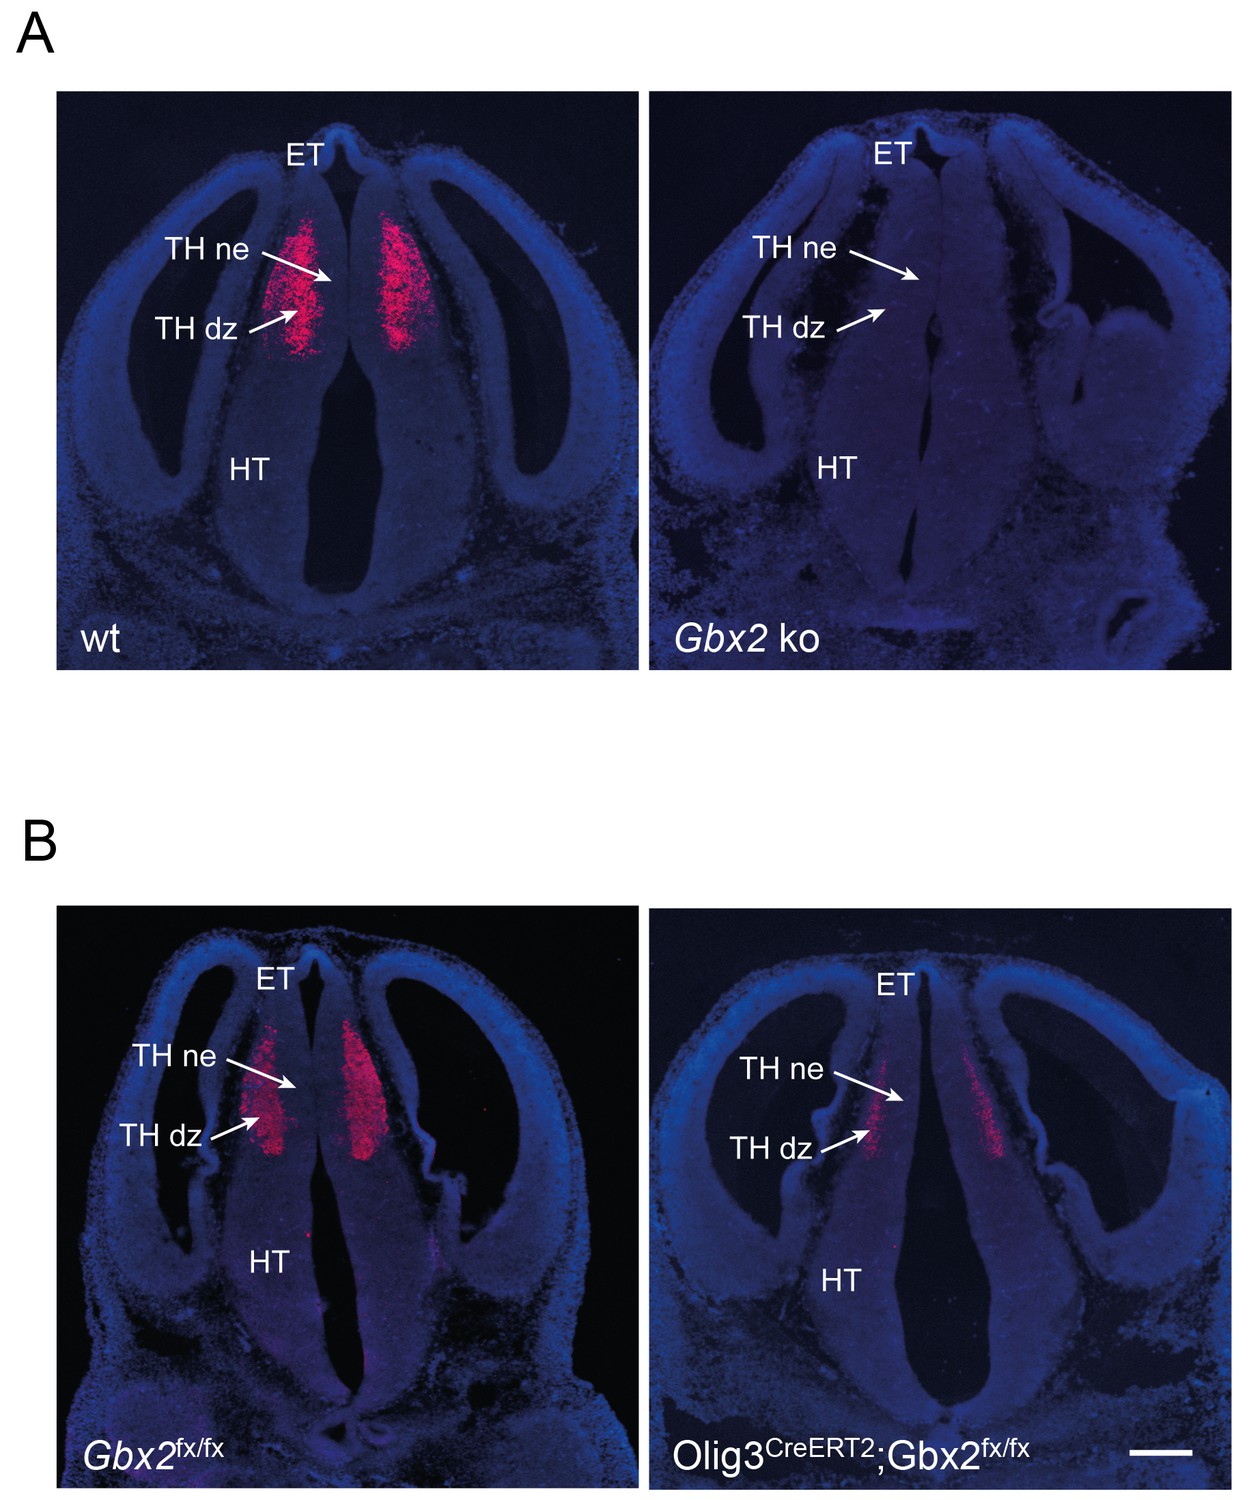
Verification of removal of Gbx2 expression in the thalamus of Gbx2 mutant mice.
In situ hybridization for Gbx2 in wild type (wt) and Gbx2 knock-out (Gbx2 ko) mice (A) and in Gbx2fx/fx and Olig3-CreERT2;Gbx2fx/fx conditional mutant mice (B) at E12.5. Conditional mutant embryos received tamoxifen at E10.5, causing significant reduction of Gbx2 expression. ET, epithalamus; THne, intermediate thalamic neuroepithelium; THdz, intermediate thalamic differentiating zone; HT, hypothalamus. Scale bar, 100 µm.
Figure 2—figure supplement 3
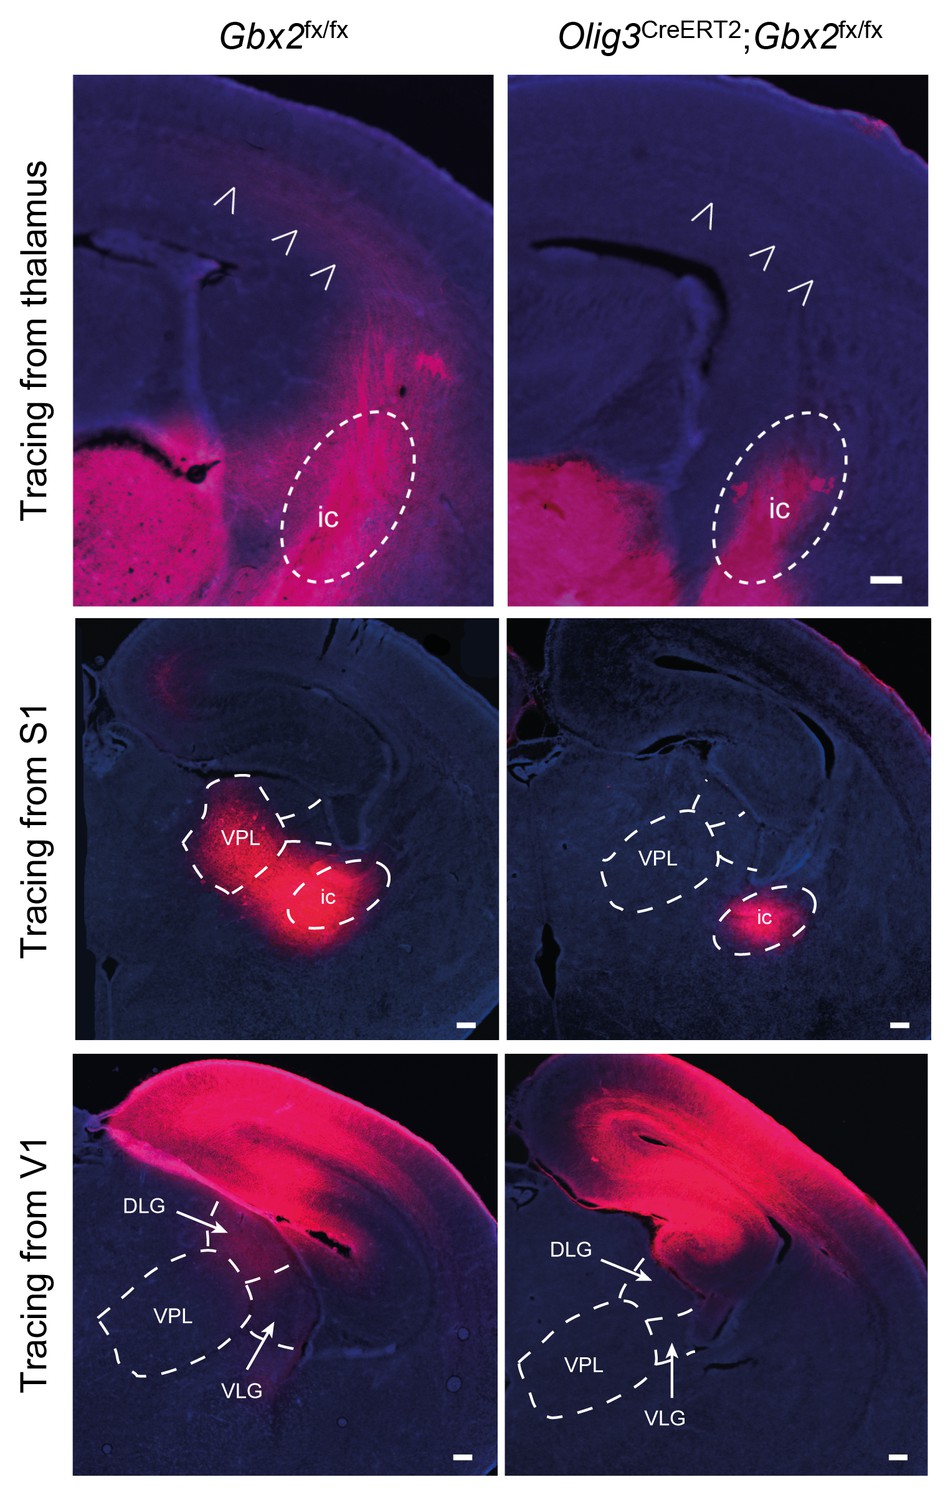
Loss of TCAs in Olig3-CreERT2;Gbx2fx/fx conditional mutant mice.
Tracing of TCAs (arrowheads in top panels) after injection of DiI crystals in dorsal thalamus at E16.5 (upper panels), prospective primary somatosensory (S1, middle panels) or visual (V1, lower panels) cortices of neonatal Gbx2fx/fx controls and Olig3-CreERT2;Gbx2fx/fx conditional mutant mice. Note the absence of DiI staining in ventral posterolateral nucleus (VPL) of conditional mutant after S1 injection and in the lateral geniculate nucleus (DLG and VLG) after V1 injection. ic, internal capsule; DLG, dorsal lateral geniculate nucleus; VLG, ventral lateral geniculate nucleus. Scale bar, 200 µm.
Figure 2—figure supplement 4
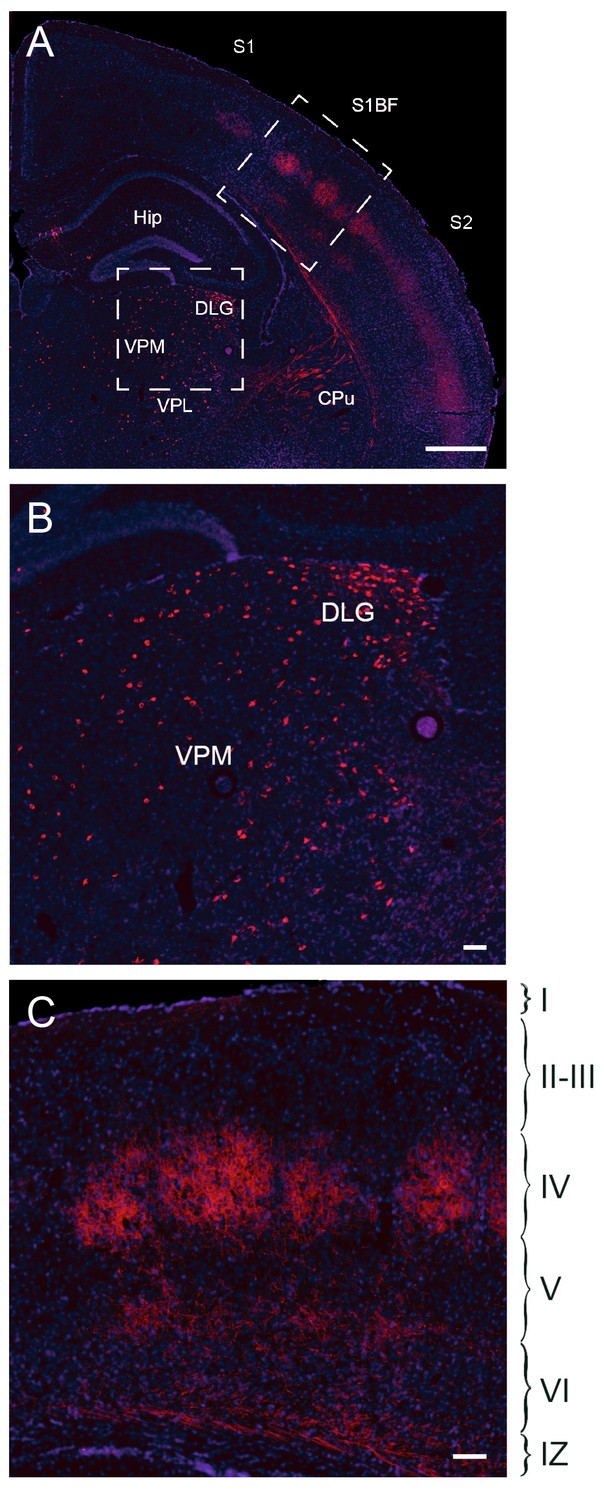
Fate mapping of Gbx2+ precursor cells.
Coronal section of Gbx2-CreERT2;dTom P21 brain (A) after tamoxifen injection at E10.5 showing cell bodies in thalamic nuclei (lower inset, B) and axonal projections in cortex barrel fields of S1 (upper inset, C). Note the absence of labeled neuronal cell bodies in S1 neocortex (C), indicating lack of contribution of embryonic Gbx2-expressing precursors to the postnatal neocortex. Cpu, caudate-putamen; DLG, dorsal lateral geniculate nucleus; Hip, hippocampus; S1, primary somatosensory cortex; S1BF: barrel field of primary somatosensory cortex; S2: secondary somatosensory cortex; VPM, ventral posteromedial thalamic nucleus; VPL, ventral posterolateral thalamic nucleus; I-VI, layer I-VI; IZ, intermediate zone. Scale bars A, 500 µm; B, C, 100 µm.
Figure 3

Deficient tangential to radial orientation switch in GABAergic interneurons of neocortex lacking TCAs.
(A) Criteria for classification of the orientation of interneurons in cortical slices, modified from (Martini et al., 2009). (B–C) Quantification of the percentage of radially oriented Lhx6-GFP+ interneurons in upper (B) and lower (B) layers of prospective M1, S1, and V1 cortices of newborn wild type (wt) and Gbx2 knock-out (ko) mice. Results are expressed as average ± SEM (*p<0.05; **p<0.005; ***p<0.0005; N = 3 mice per group). (D–E) Quantification of morphological types of Lhx6-GFP+ interneurons in upper (D) and lower (E) layers of prospective S1 cortex of newborn wild type (wt) and Gbx2 knock-out (ko) mice. Results are expressed as average percentage of specific type of total interneuron number. ± SEM (***p<0.0001; n.s., not significant; N = 5 mice per group).
Figure 4
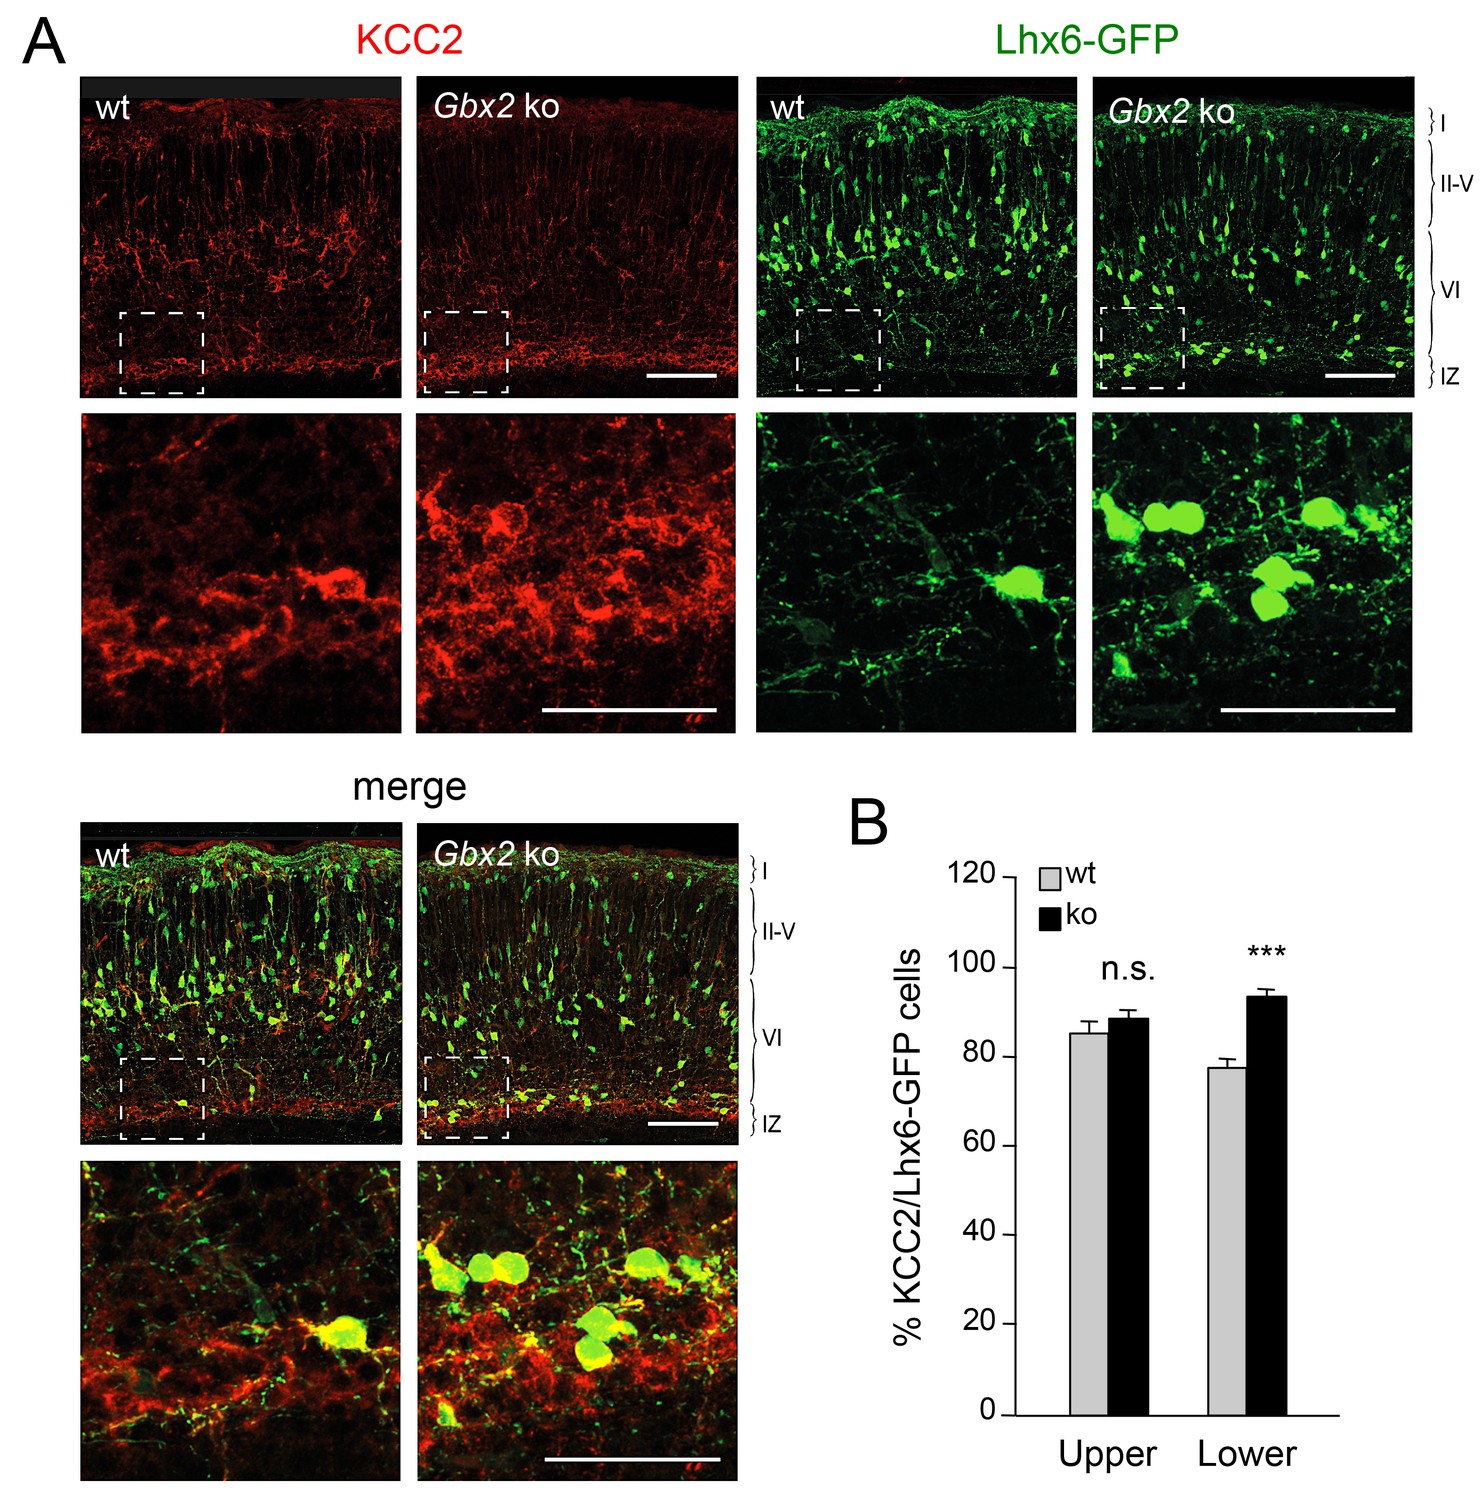
Elevated KCC2 expression in GABAergic interneurons of lower cortical layers lacking TCAs.
(A) Expression of KCC2 (red) in Lhx6-GFP+ interneurons (green) detected by immunohistochemistry in prospective somatosensory neocortex of newborn wild type (wt) and Gbx2 knock-out (Gbx2 ko) mice. Lower rows show higher magnification of area denoted in upper panels. Scale bar, 100 µm (upper rows), 50 µm (lower rows). (B) Quantification of the percentage of Lhx6-GFP+ interneurons expressing KCC2 in upper and lower layers of wild type (wt) and Gbx2 knock-out (ko) newborn mice. This shows that, not only do more Lhx6-GFP+ interneurons accumulate in lower layers, but a greater proportion of these express KCC2. Results are expressed as average ± SEM (***p<0.0005; n.s., non-significant; N = 3 mice).
Figure 5
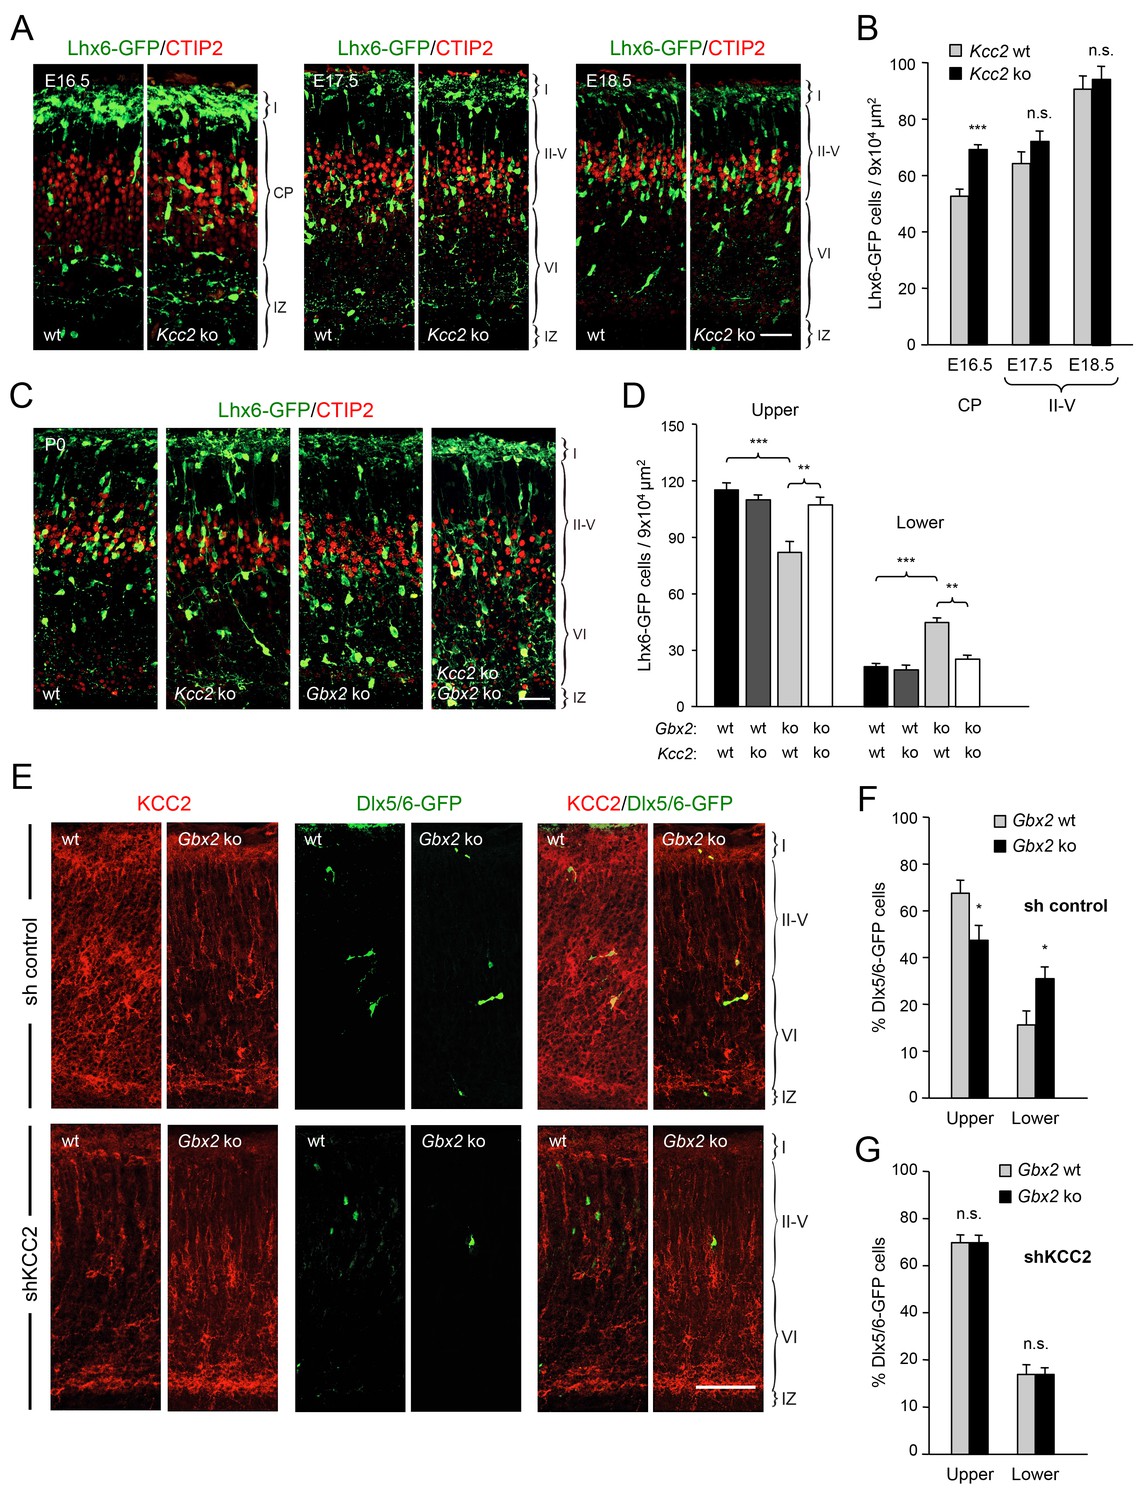
Deletion of Kcc2 allows precocious radial dispersion of GABAergic interneurons in embryonic cortex and rescues abnormal laminar distribution of cortical interneurons in newborn Gbx2 knock-out mice.
(A) Lhx6-GFP+ interneurons (green) combined with immunostaining for CTIP2 (red) in embryonic cortex of wild type (wt) and Kcc2 knock-out (Kcc2 ko) mice at embryonic stages E16.5, E17.5 and E18.5. Scale bar, 50 µm. (B) Quantification of Lhx6-GFP+ interneurons in embryonic cortical plate (CP) or upper layers (II-V) of wild type (wt) and Kcc2 knock-out (Kcc2 ko) mice at the indicated embryonic stages. Results are expressed as average ± SEM (**p<0.005; ***p<0.0005; N = 5 mice per group). (C) Lhx6-GFP+ interneurons (green) combined with immunostaining for CTIP2 (red) in prospective S1 cortex of newborn wild type (wt), Kcc2 knock-out (Kcc2 ko), Gbx2 knock-out (Gbx2 ko) and Kcc2/Gbx2 double knock-out (Kcc2 ko Gbx2 ko) mice. Scale bar, 50 µm. D) Quantification of Lhx6-GFP+ interneurons in upper and lower layers of newborn wild type mice and Kcc2 and Gbx2 single and double knock-out mice, as indicated. Results are expressed as average ± SEM (**p<0.005; ***p<0.0005; N = 4 mice per group). (E) Representative images of immunohistochemistry for KCC2 (red) of neonatal Gbx2 wildtype (wt) or mutant (Gbx2 ko) cortex after in utero electroporation with control shRNA (first row) or KCC2 shRNA (second row) in combination with Dlx5/6GFP (green). Scale bar, 100 µm. (F–G) Quantification of GABAergic interneurons in upper and lower layers after in utero electroporation of either control shRNA (F) or KCC2 shRNA (G) in Gbx2 wild type or knock-out embryos. Results are presented as percentage of transfected EGFP positive neurons in upper or lower cortical layers relative to all transfected cells. Results are expressed as average ± SEM (*p<0.05; N = 5; n.s., not significant difference).
Figure 6 with 1 supplement
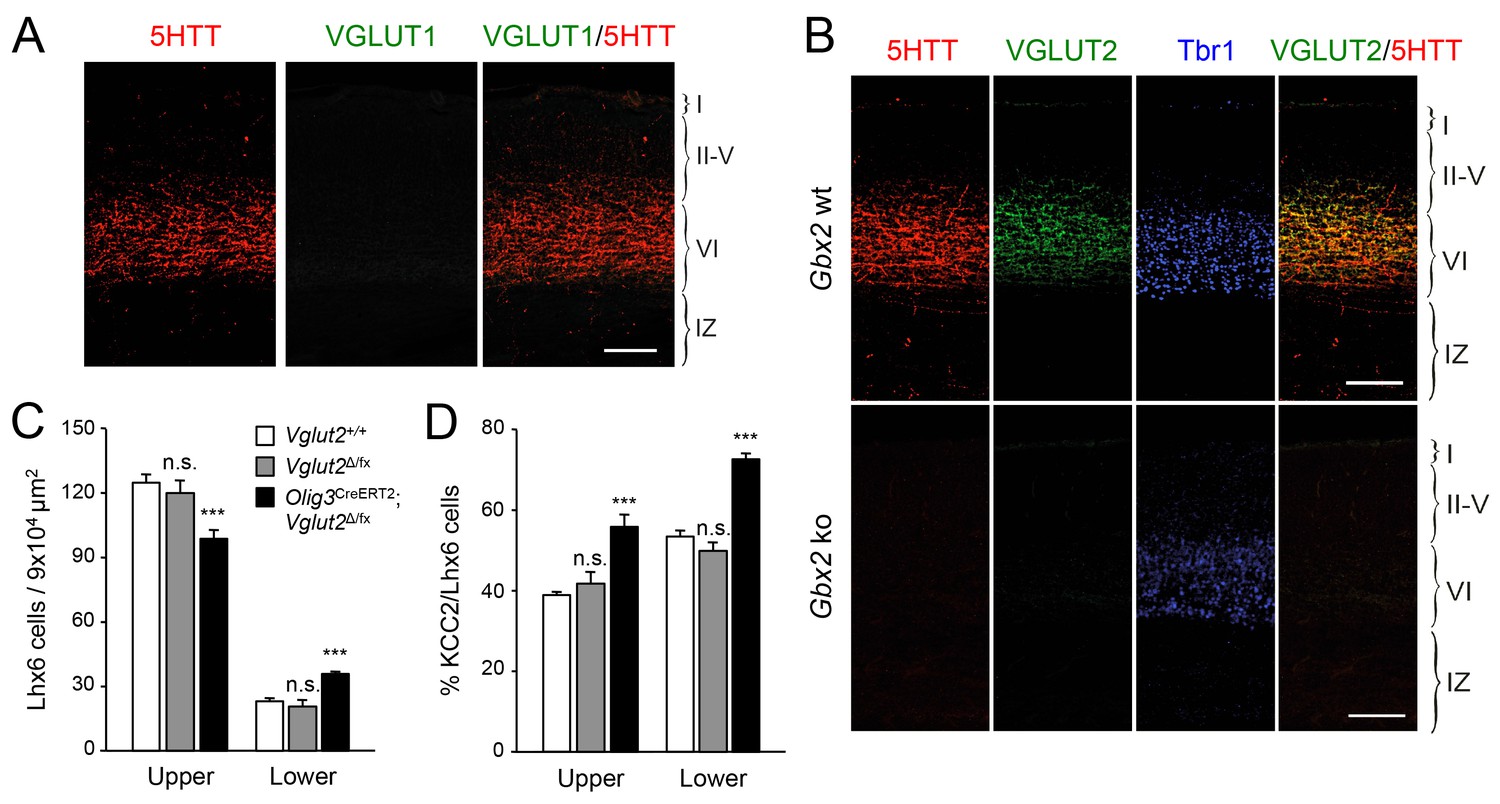
VGLUT2 ablation in TCAs induces abnormal laminar distribution of GABAergic interneurons in neonatal cortex.
(A) Immunohistochemistry for VGLUT1 (green) and 5HTT (red) in prospective S1 cortex of wild type newborn mouse brain. Note the absence of VGLUT1 expression in TCAs (specifically labeled by 5HTT [Mizuno et al., 2014]) in the newborn neocortex. Scale bar, 100 µm.B) Immunohistochemistry for VGLUT2 (green), 5HTT (red) and Tbr1 (blue) in prospective S1 cortex of wild type and Gbx2 knock-out newborn mouse brain. Note expression of VGLUT2 in TCAs (labeled by 5HTT) in the newborn wild type cortex and absence in the Gbx2 knock-out mutant. Scale bar, 100 µm. (C) Quantification of Lhx6+ interneurons (identified by immunostaining) in upper and lower layers in newborn Vglut2+/+ (open bars), Vglut2Δ/fx (gray bars) and Olig3-CreERT2;Vglut2Δ/fx conditional mutant mice (black bars) after tamoxifen injection at E10.5. Results are expressed as average ± SEM (***p<0.0005; n.s., not significant; N = 5 mice per group). (D) Quantification of the percentage of KCC2-positive cells among Lhx6+ interneurons (identified by immunostaining) in upper and lower layers of newborn Vglut2+/+ (open bars), Vglut2Δ/fx (gray bars) and Olig3-CreERT2;Vglut2Δ/fx conditional mutant mice (black bars). Results are expressed as average ± SEM (***p<0.0005; n.s., non-significant; N = 3 mice).
Figure 6—figure supplement 1

Absence of VGLUT1 expression in TCAs of Olig3-CreERT2;Vglut2Δ/fx conditional mutant mice.
Immunohistochemistry for VGLUT1 (green) and 5HTT (red) in prospective S1 cortex of wild type (Vglut2+/+) and Olig3-CreERT2;Vglut2Δ/fx conditional mutant mice. VGLUT1 expression remained undetectable in TCAs lacking VGLUT2. Scale bar, 100 µm.
Figure 7 with 1 supplement
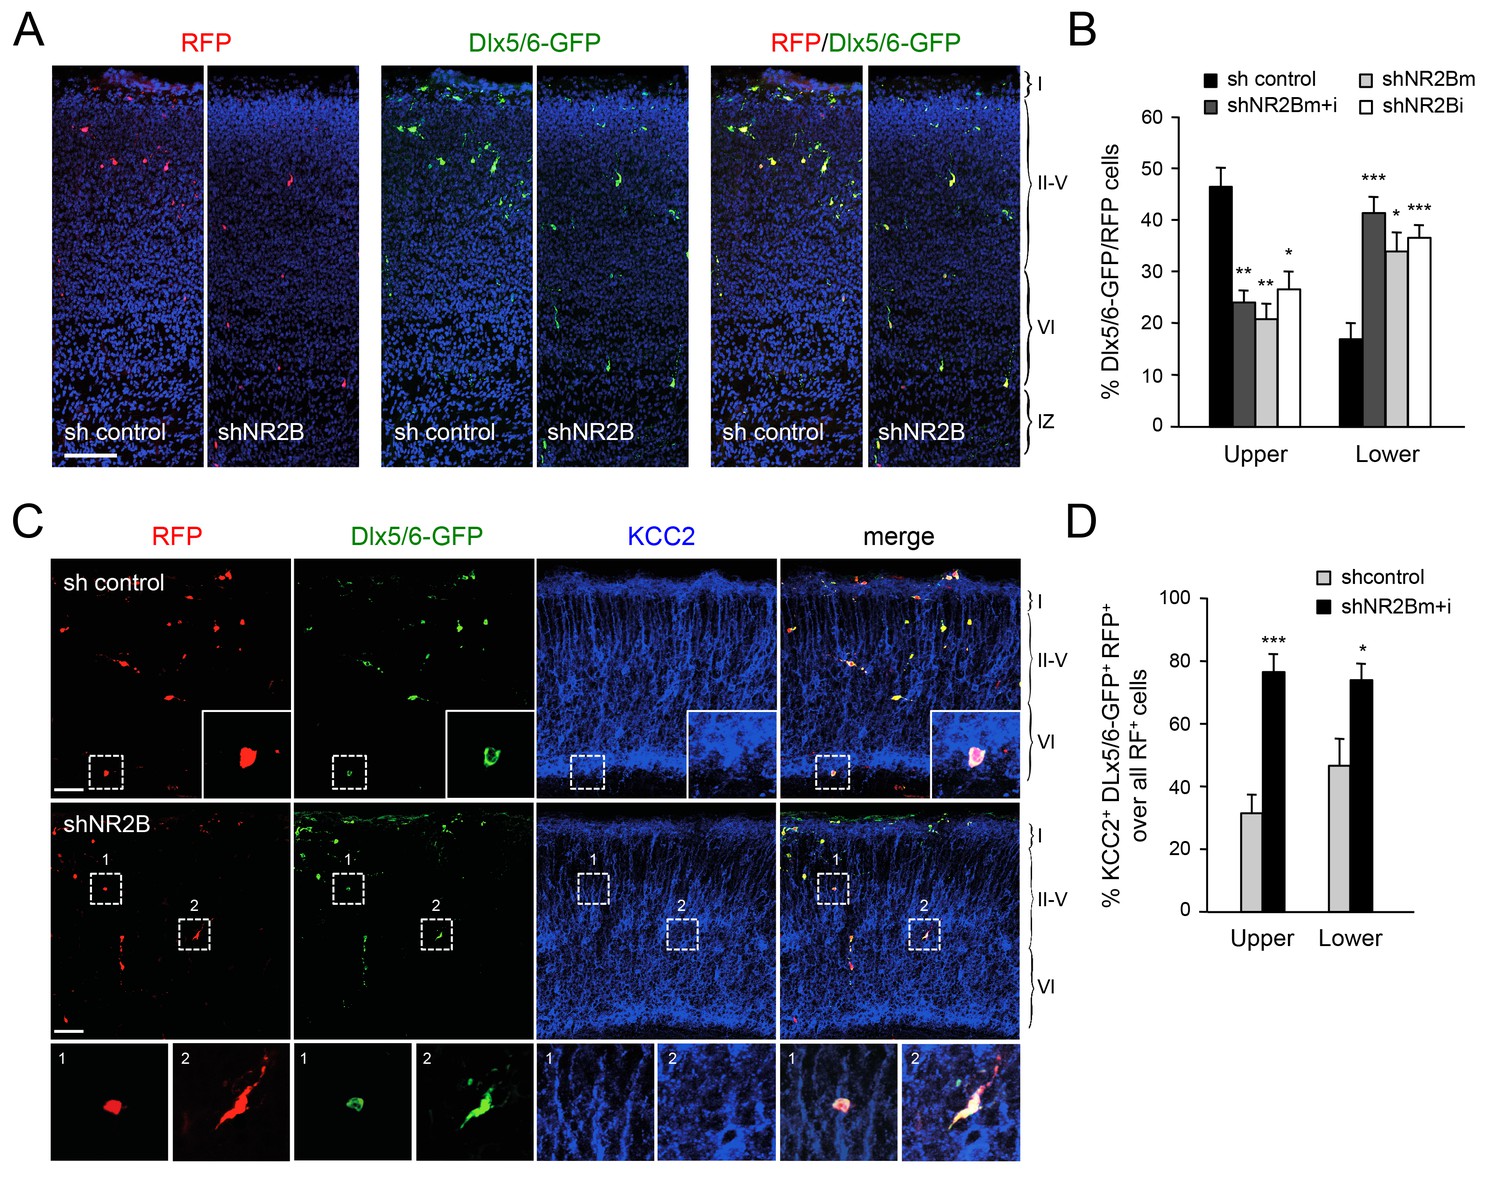
Abnormal laminar distribution of cortical GABAergic interneurons after interneuron-specific shRNA knock-down of NMDA receptor subunit NR2B.
(A) GABAergic interneurons transfected by in utero electroporation with control or NR2B shRNAs combined with Dlx5/6-GFP (green) and RFP (red) from prospective S1 neocortex counterstained with DAPI (blue). RFP marks all transfected cells; Dlx5/6-GFP marks MGE-derived GABAergic interneurons. Note almost complete overlap between EGFP and RFP, indicating successful electroporation of MGE-derived interneurons. Scale bar, 100 µm. (B) Quantification of GABAergic interneurons in upper and lower layers after in utero electroporation of either control shRNA, NR2Bm shRNA, NR2Bi shRNA or combination of the two NR2B shRNAs (m+i). Results are presented as percentage of EGFP/RFP double-positive neurons in upper or lower cortical layers relative to EGFP/RFP double-positive neurons in all layers. Results are expressed as average ± SEM (*p<0.05; **p<0.005; ***p<0.0005; N = 13, sh control; N = 10, shNR2Bm+i; N = 9, shNR2Bm; N = 10, shNR2Bi). (C) GABAergic interneurons transfected by in utero electroporation with control or NR2B shRNAs combined with Dlx5/6-GFP (green) and RFP (red) from prospective S1 neocortex counterstained by immunohistochemistry for KCC2 (blue). RFP marks all transfected cells; Dlx5/6-GFP marks MGE-derived GABAergic interneurons. Scale bars, 50 µm. Insets show higher magnifications of areas inside dashed lines. (D) Percentage of KCC2+ Dlx5/6-GFP+ RFP+ triple positive interneurons among all transfected (RFP+) cells in upper and lower layers after in utero electroporation of either control shRNA (grey bars) or NR2B shRNA (black bars). Results are presented as percentage of triple-positive neurons in upper or lower cortical layers relative to all transfected neurons. Results are expressed as average ± SEM (**p<0.0001; *p<0.05; N = 4, sh control; N = 8, shNR2B).
Figure 7—figure supplement 1
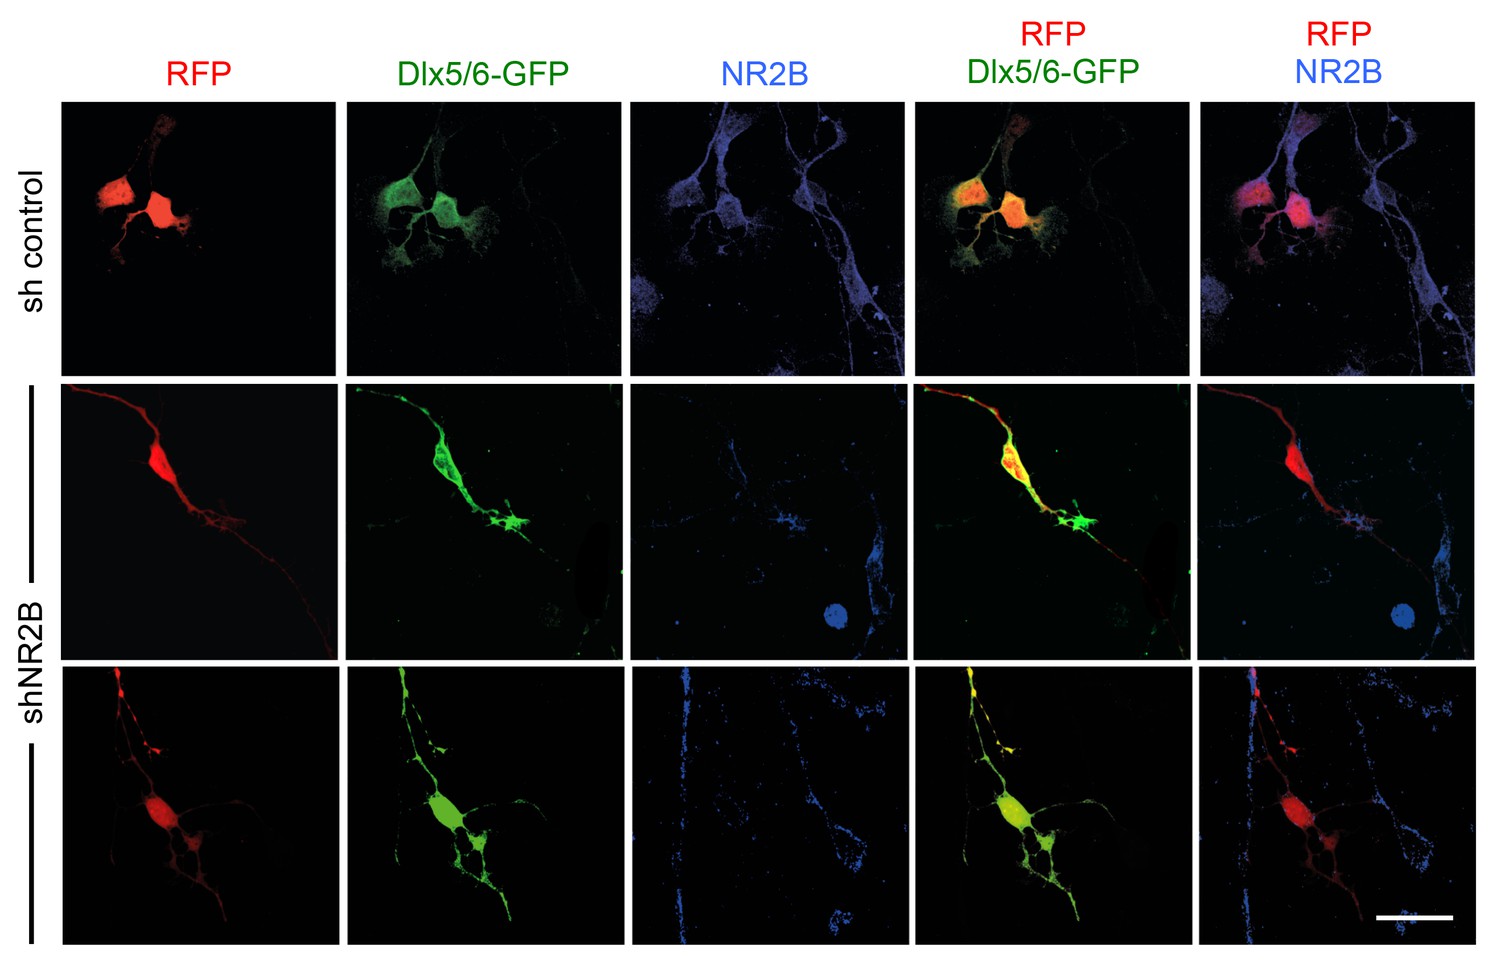
Knock-down of NMDA receptor subunit NR2B in GABAergic interneurons by in utero electroporation.
Analysis of NR2B expression in cultured GABAergic interneurons dissociated from the MGE of embryos subjected to in utero electroporation. Immunocytochemistry for NR2B is shown in blue. RFP (red) marks all electroporated neurons. EGFP (green) expressed under the Dlx5/6 promoter marks electroporated GABAergic interneurons. Note the loss of NR2B immunoreactivity in neurons electroporated with shNR2B but not in neurons that received control shRNA or in non-electroporated cells. Scale bar, 50 µm.
Figure 8
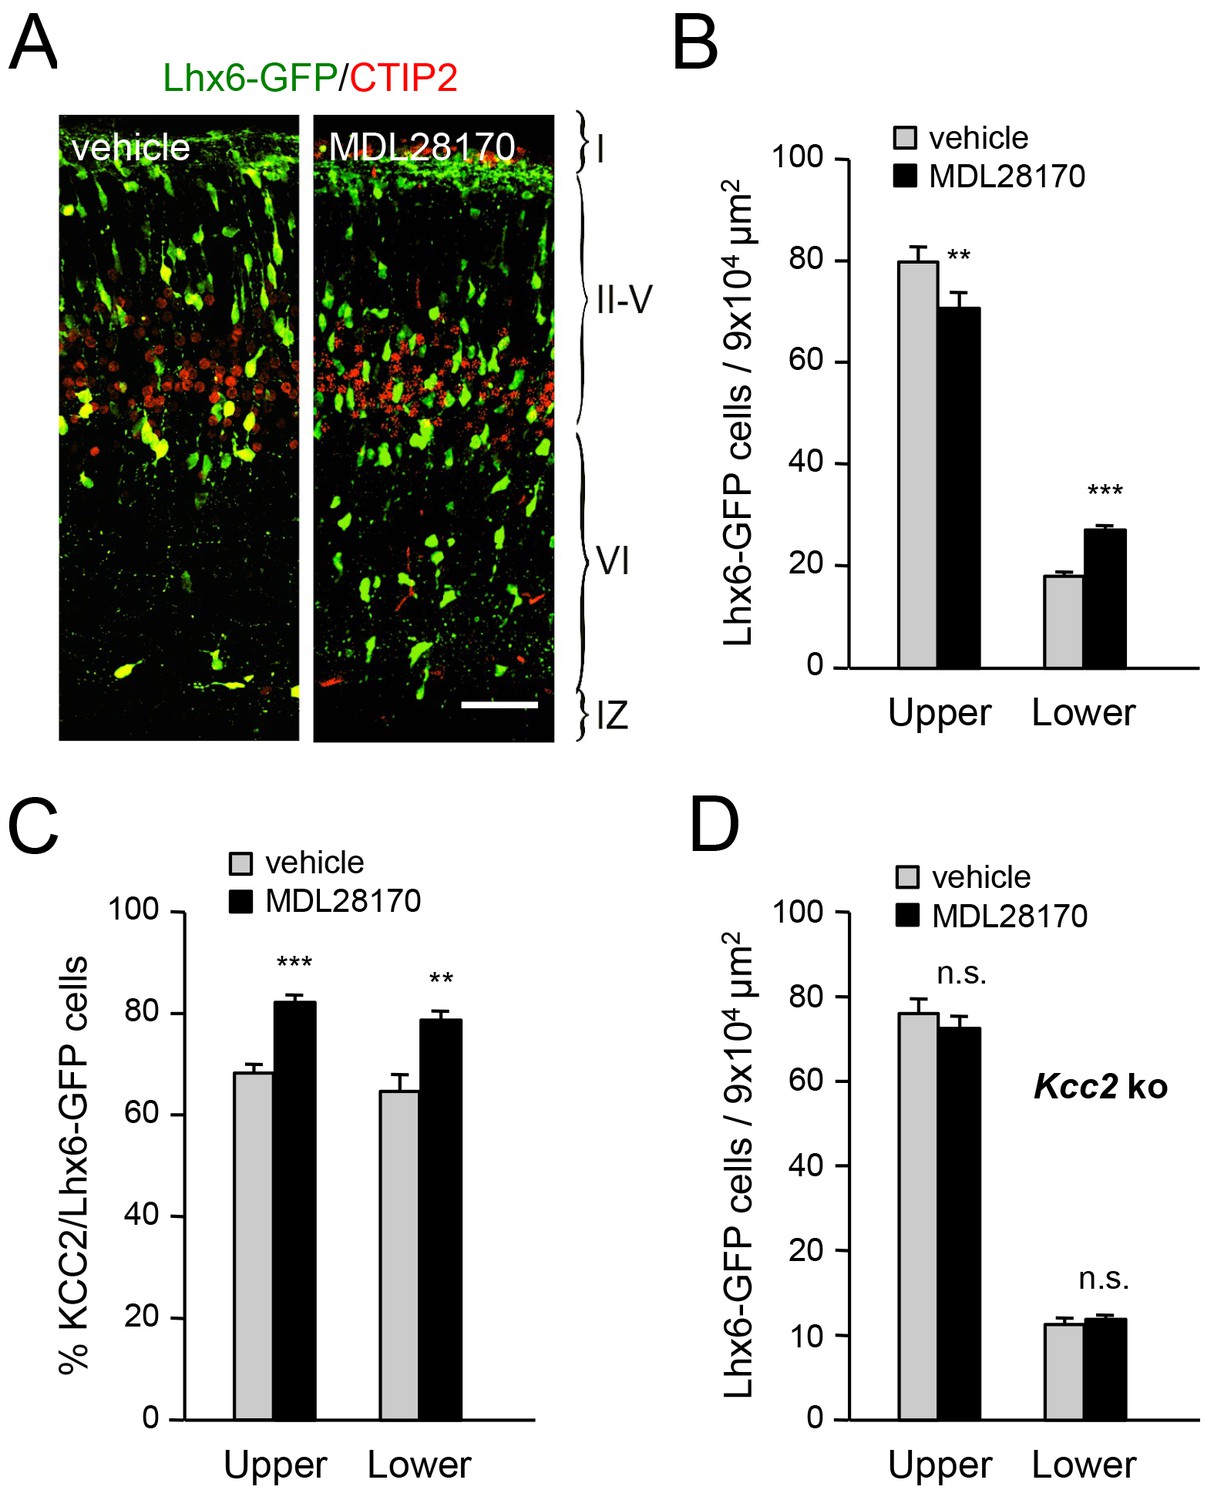
Inhibition of calpain alters the laminar distribution of cortical GABAergic interneurons in wild type but not in Kcc2 mutant mice.
(A) Lhx6-GFP+ interneurons (green) combined with immunostaining for CTIP2 (red) in prospective S1 cortex of newborn mice treated at E17.5 and E18.5 with either vehicle or calpain inhibitor MDL28170. Scale bar, 50 µm. (B) Quantification of Lhx6-GFP+ interneurons in upper and lower layers of prospective M1, S1 and V1 cortices from newborn wild type mice treated at E17.5 and E18.5 with either vehicle (gray bars) or calpain inhibitor MDL28170 (black bars). Results are expressed as average ± SEM (**p<0.005; ***p<0.0005; N = 5 mice per group). (C) Quantification of the percentage of KCC2-positive cells among Lhx6-GFP+ interneurons in upper and lower layers of prospective M1, S1 and V1 cortices from newborn wild type mice treated at E17.5 and E18.5 with either vehicle or calpain inhibitor MDL28170. Results are expressed as average ± SEM (*p<0.05; **p<0.005; ***p<0.0005; N = 5 mice). (D) Quantification of Lhx6-GFP+ interneurons in upper and lower layers of prospective M1, S1 and V1 cortices from newborn Kcc2 knock-out mice treated at E17.5 and E18.5 with either vehicle (gray bars) or calpain inhibitor MDL28170 (black bars). Results are expressed as average ± SEM (n.s., not significant; N = 5 mice per group).
Figure 9 with 1 supplement
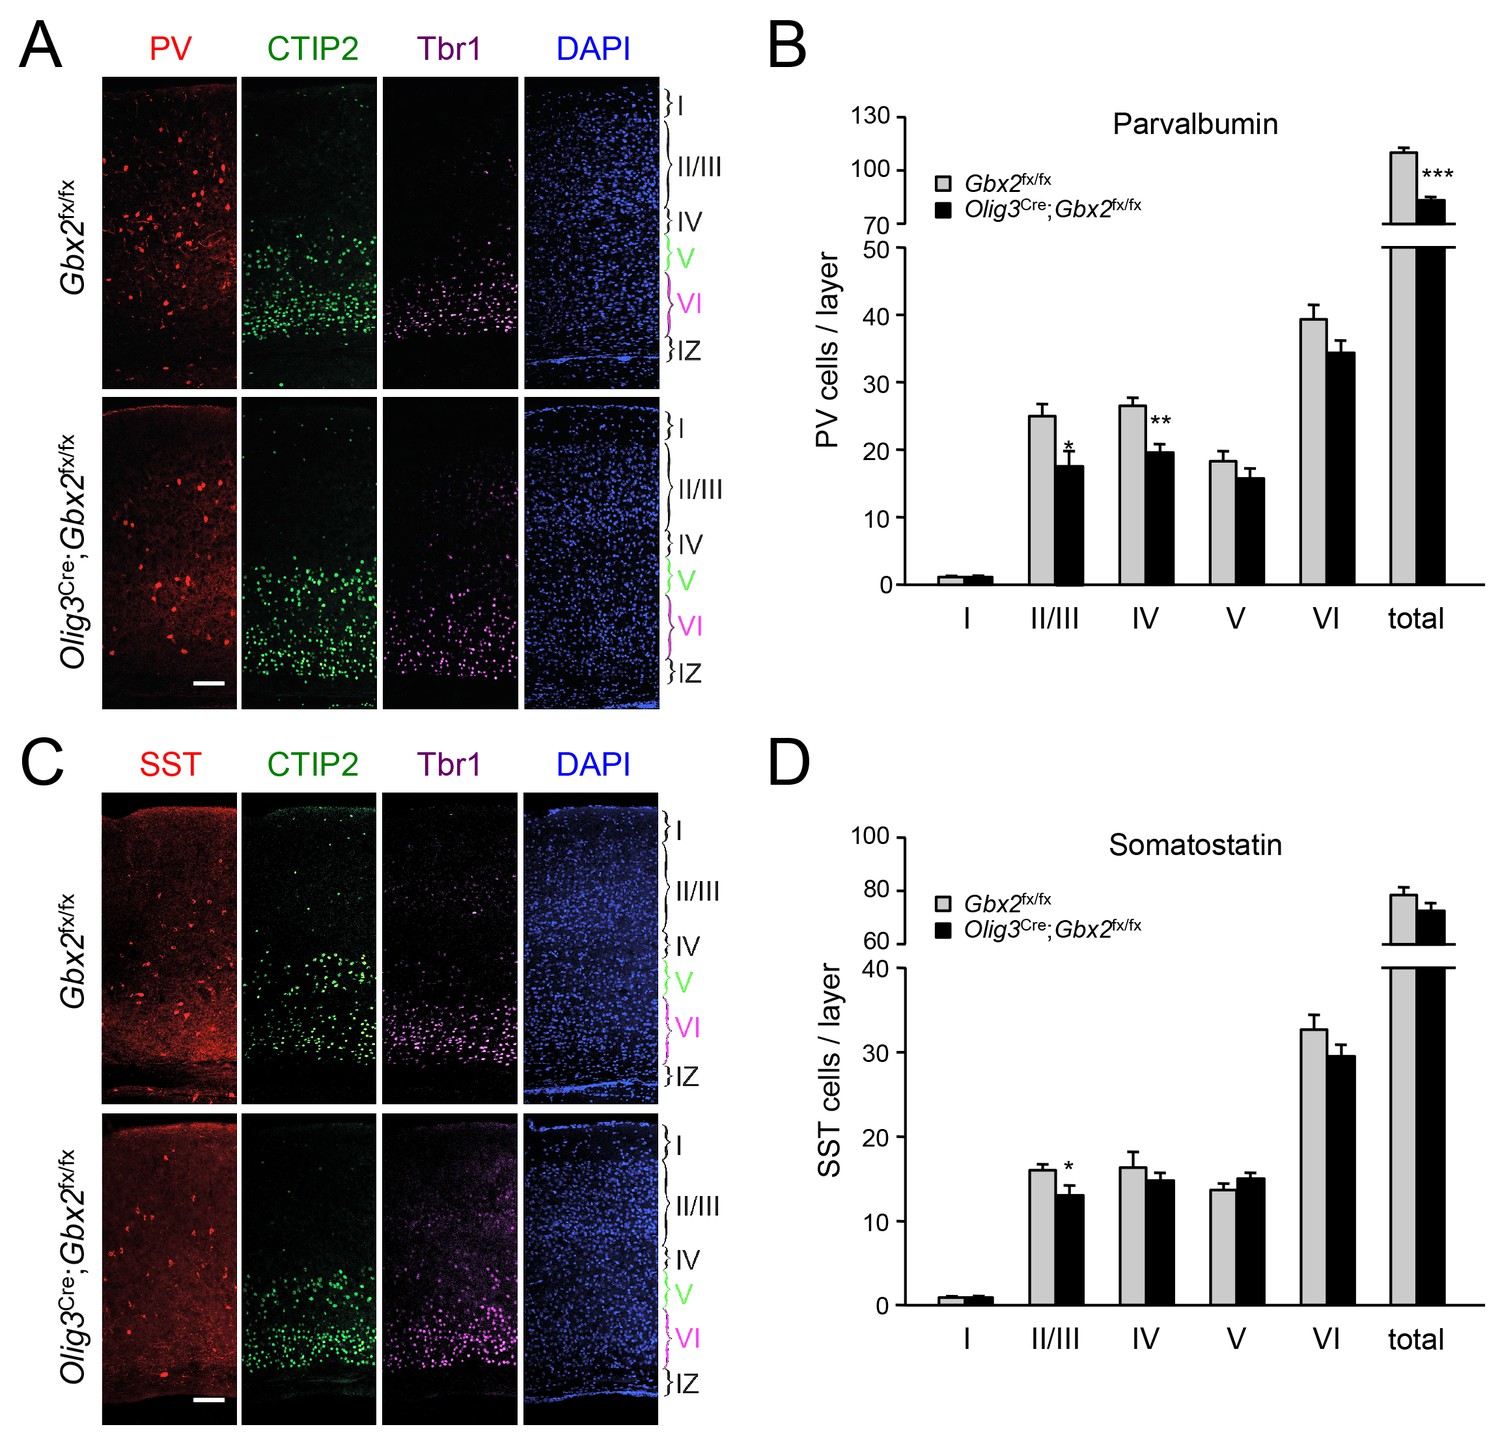
GABAergic interneuron deficits in postnatal neocortex lacking TCAs.
(A) Immunostaining for parvalbumin (PV, red), CTIP2 (green), Tbr1 (purple) and DAPI counterstaining (blue) in primary visual cortex of 3 week old Olig3-Cre;Gbx2fx/fx conditional mutant and Gbx2fx/fx control mice. At this age, CTIP2 marks neurons in both layers V and VI. Cortical layers are indicated. Scale bar, 100 µm. (B) Quantification of PV+ in different layers of primary visual cortex in three week old Olig3-Cre;Gbx2fx/fx conditional mutant and Gbx2fx/fx control mice. Results are expressed as average ± SEM (*p<0.05; **p<0.005; ***p<0.001; N = 6 mice per group). (C) Immunostaining for somatostatin (SST, red), CTIP2 (green), Tbr1 (purple) and DAPI counterstaining (blue) in primary visual cortex of 3 week old Olig3-Cre;Gbx2fx/fx conditional mutant and Gbx2fx/fx control mice. Cortical layers are indicated. Scale bar, 100 µm. (D) Quantification of SST+ in different layers of primary visual cortex in three week old Olig3-Cre;Gbx2fx/fx conditional mutant and Gbx2fx/fx control mice. Results are expressed as average ± SEM (*p<0.05; N = 6 mice per group).
Figure 9—figure supplement 1
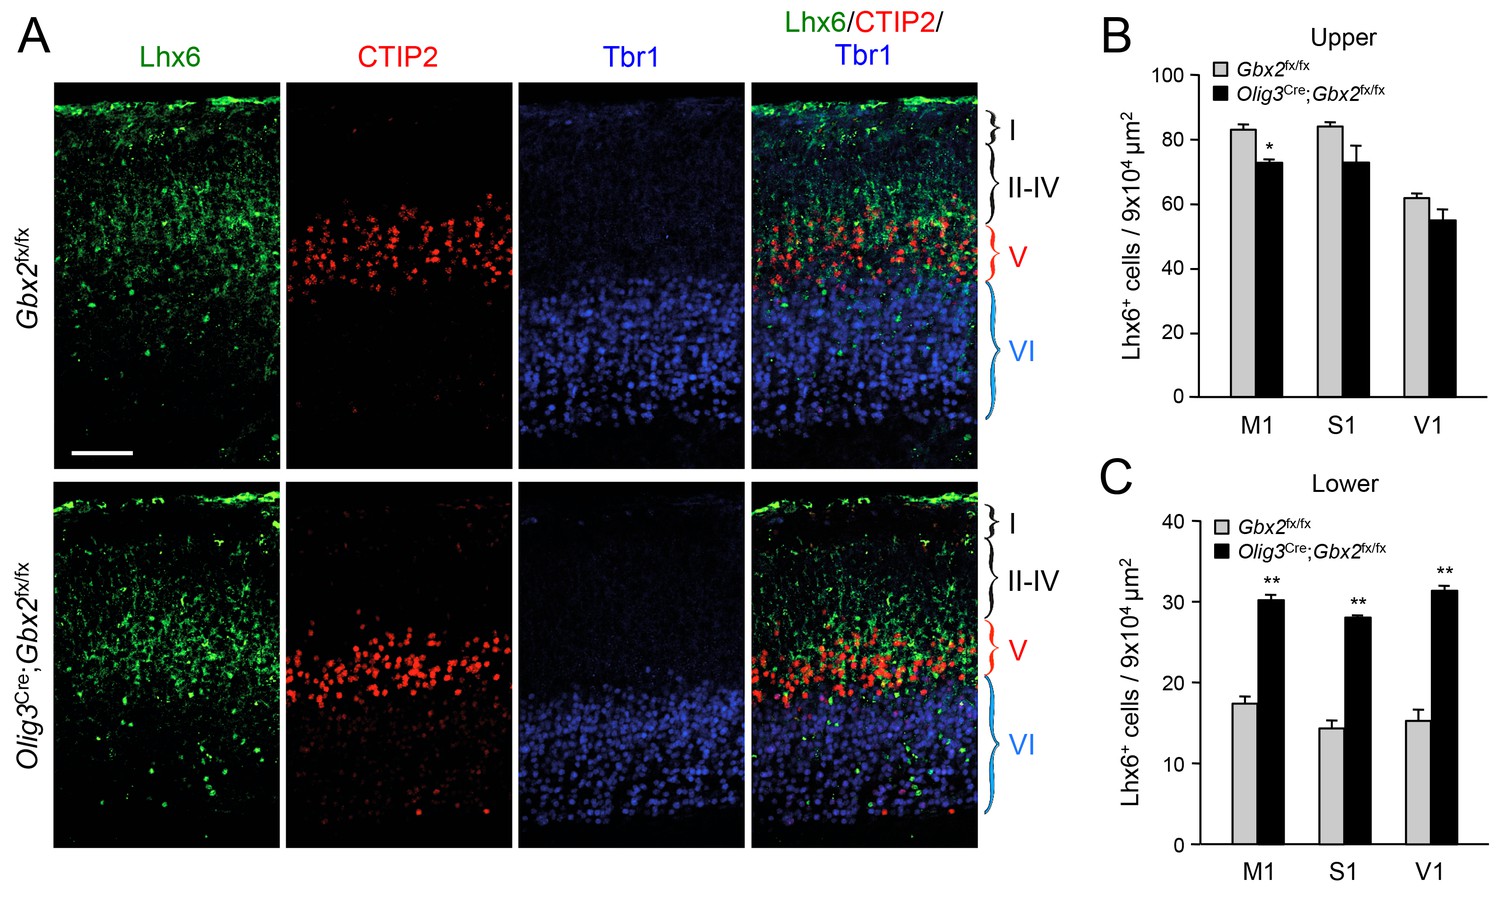
Abnormal laminar distribution of cortical GABAergic interneurons in newborn Olig3-Cre;Gbx2fx/fx mice.
(A) Immunostaining for Lhx6 (green), CTIP2 (red) and Tbr1 (blue) in prospective visual cortex of newborn Olig3-Cre;Gbx2fx/fx conditional mutant and Gbx2fx/fx control mice. Scale bar, 100 µm. (B–C) Quantification of Lhx6+ interneurons in upper (B) and lower (C) layers of prospective primary motor (M1), somatosensory (S1), and visual (V1) cortices of newborn Olig3-Cre;Gbx2fx/fx conditional mutant and Gbx2fx/fx control mice. Results are expressed as average ± SEM (*p<0.05; **p<0.005; N = 3 mice per group).
Download links
A two-part list of links to download the article, or parts of the article, in various formats.
Downloads (link to download the article as PDF)
Open citations (links to open the citations from this article in various online reference manager services)
Cite this article (links to download the citations from this article in formats compatible with various reference manager tools)
Thalamo-cortical axons regulate the radial dispersion of neocortical GABAergic interneurons
eLife 5:e20770.
https://doi.org/10.7554/eLife.20770


