Embryonic transcription factor expression in mice predicts medial amygdala neuronal identity and sex-specific responses to innate behavioral cues
- The George Washington University, United States
- Children's National Medical Center, United States
- Kumamoto-University, Japan
- University of Colorado School of Medicine, Colorado
Figures
Figure 1 with 3 supplements
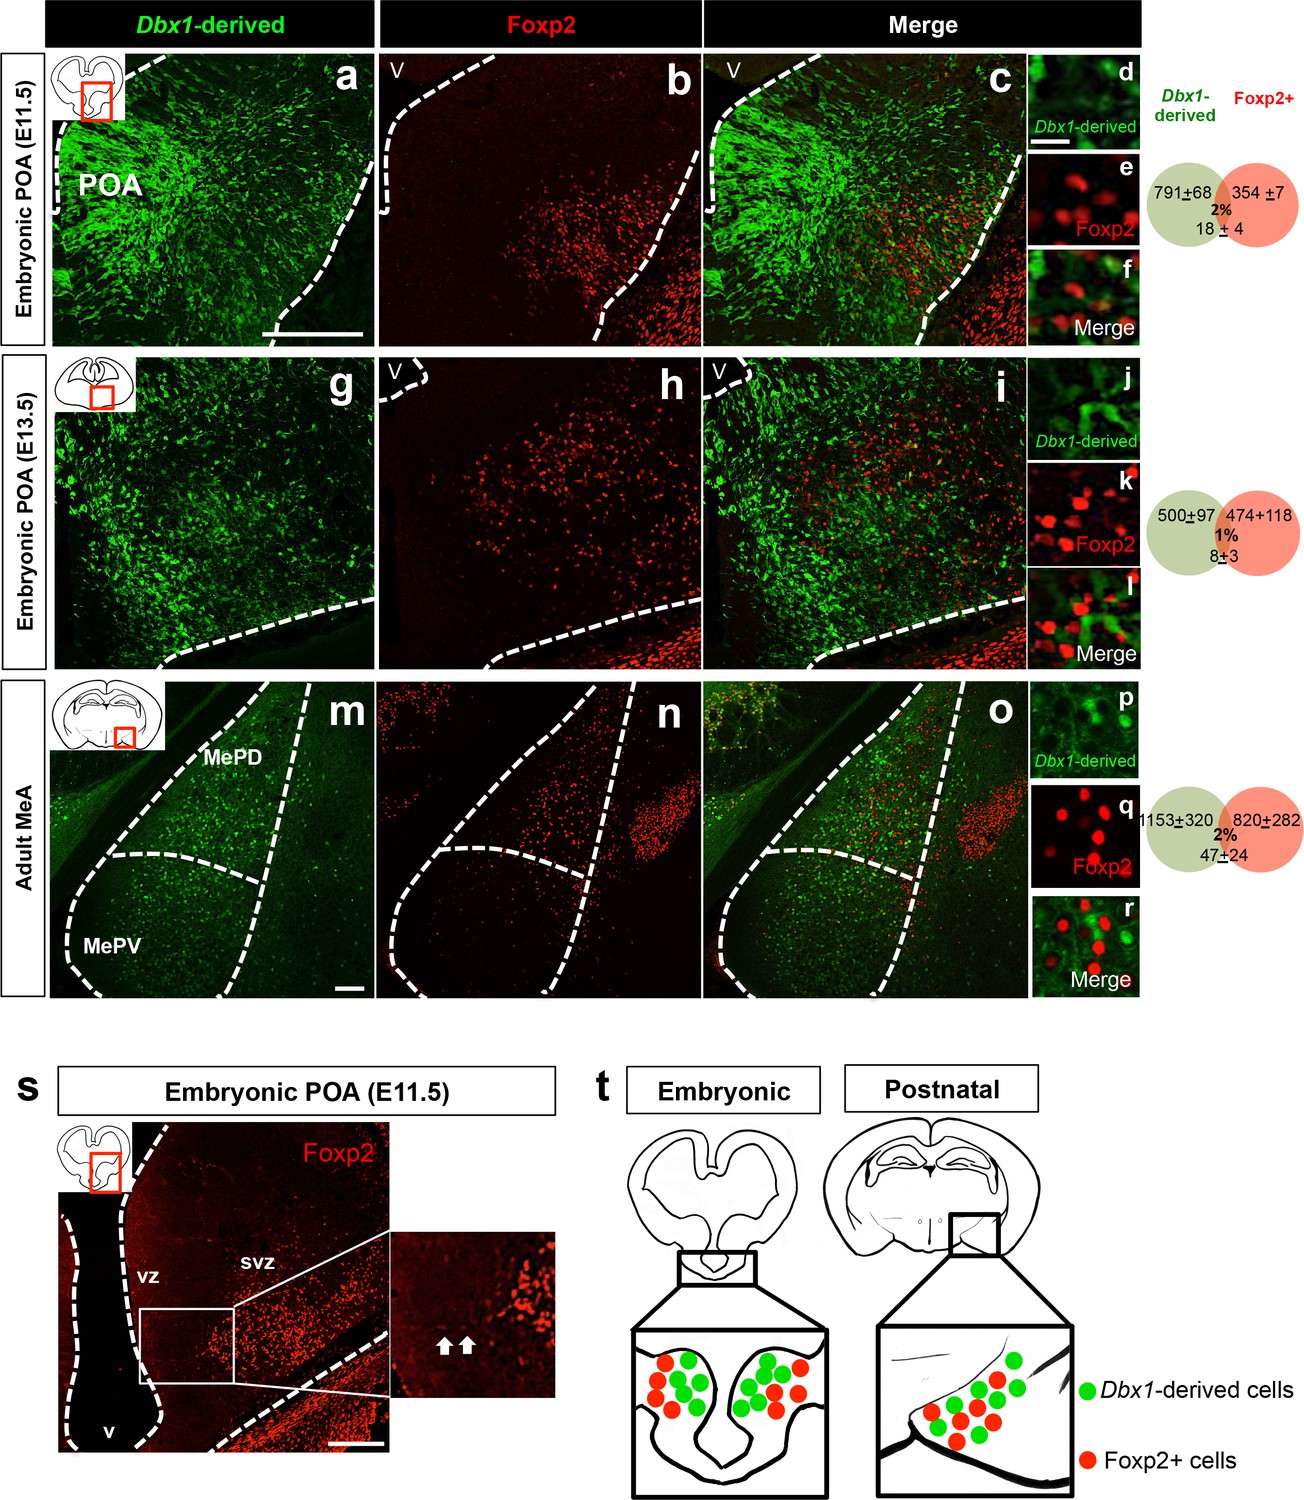
Embryonic and postnatal segregation of Dbx1-derived and Foxp2+ cells.
Minimal co-localization of Dbx1-derived (green) and Foxp2+ (red) labeled cells in coronal sections at the level of the POA at E11.5 (a–f) and E13.5 (g–l). As shown at E11.5 (s) Foxp2+ precursors in the VZ (arrows) are observed putatively migrating to the SVZ. The segregation of Dbx1-derived and Foxp2+ cells persists into adulthood (m–r). Summary schematic of spatial segregation of Dbx1-derived and Foxp2+ cells in the embryonic POA and postnatal MeA (t). Venn diagram depicting the overlap of the total number of Dbx1-derived and Foxp2+ cells in 2–3 sections/embryo or 5–8 sections/adult brain. The scale bars represent 200 μm (a–c, g–i, s), 100 μm (m–o) and 25 μm (d–f, j–l, p–r). Abbreviations: MeA, medial amygdala; MePD, medial amygdala-posterior dorsal; MePV, medial amygdala posterior ventral; POA, preoptic area; SVZ, subventricular zone; V, ventricle; VZ, ventricular zone. n = 3 embryonic brains; n = 5 postnatal brains. Data are mean ± s.e.m. n is the number of animals.
Figure 1—figure supplement 1
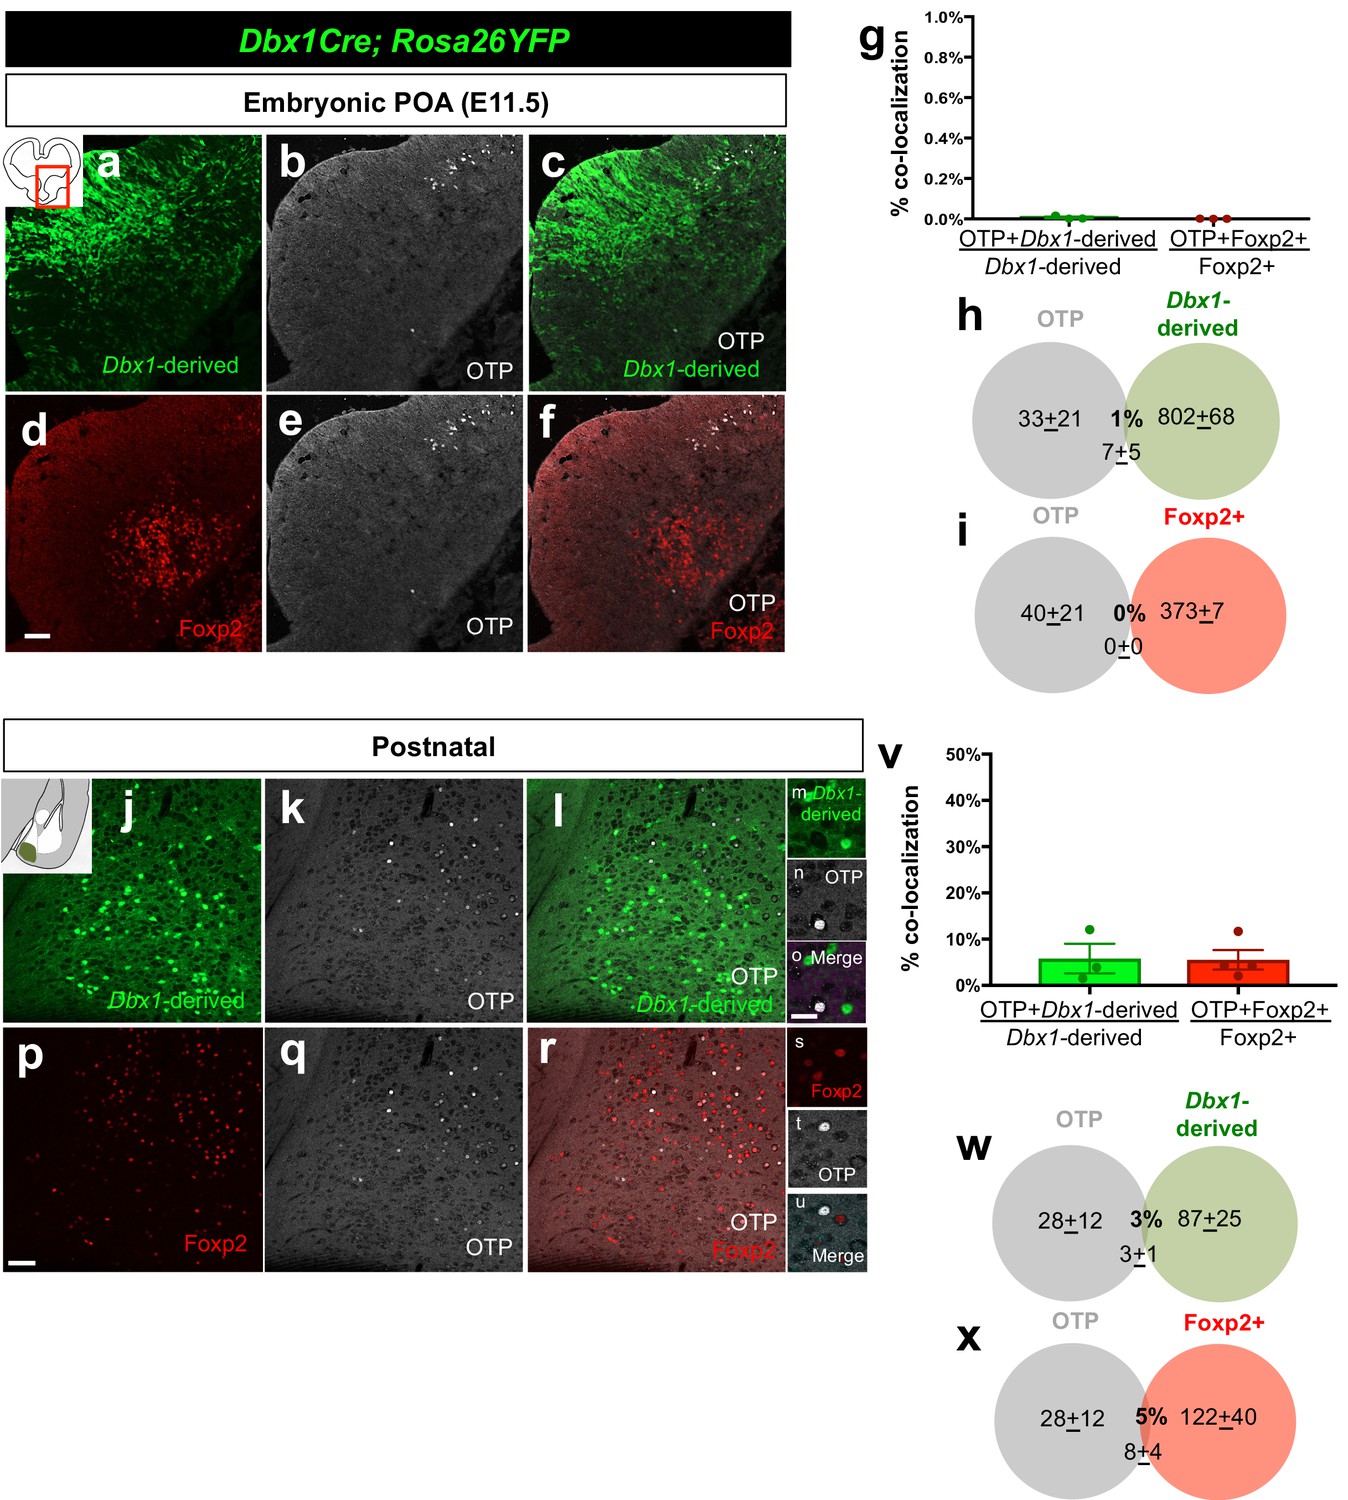
Embryonic and postnatal distribution of OTP+ cells.
Dual immunostaining of coronal sections at the telencephalic-diencephalic border at E11.5 shows very little overlap between Dbx1-derived (green) (n = 3) and the Foxp2+ (red) (n = 3) progenitor populations with the OTP+ population (white) (a–f). Quantification of overlap of OTP with the Dbx1-derived and Foxp2+ populations (YFP+ and OTP+/ total YFP+ population for Dbx1-derived cells; Foxp2+ OTP+/ total Foxp2+ population for Foxp2+ cells) (g). Venn diagrams depicting the overlap of the total number of Dbx1-derived (h) and Foxp2+ cells (i) with the OTP+ population (2–3 sections/embryo). Dual immunostaining of postnatal coronal sections also revealed very little overlap of Dbx1-derived population (n = 3) or Foxp2+ populations (n = 4) with OTP (j–u). Quantification of overlap of OTP with the Dbx1-derived and Foxp2+ populations (YFP+ and OTP+/ total YFP+ population for Dbx1-derived cells; Foxp2+ OTP+/ total Foxp2+ population for Foxp2+ cells) (v). Venn diagram depicting the overlap of the total number of Dbx1-derived (w) and Foxp2+ cells (x) with the marker OTP+ (average of MeA A-P extent across 5–8 sections). p<0.05 (*). The scale bar represents 100 μm (a–f, j–l, p–r) and 100 μm (m–o, s–u). Data are mean ± s.e.m. n is the number of animals.
Figure 1—figure supplement 2
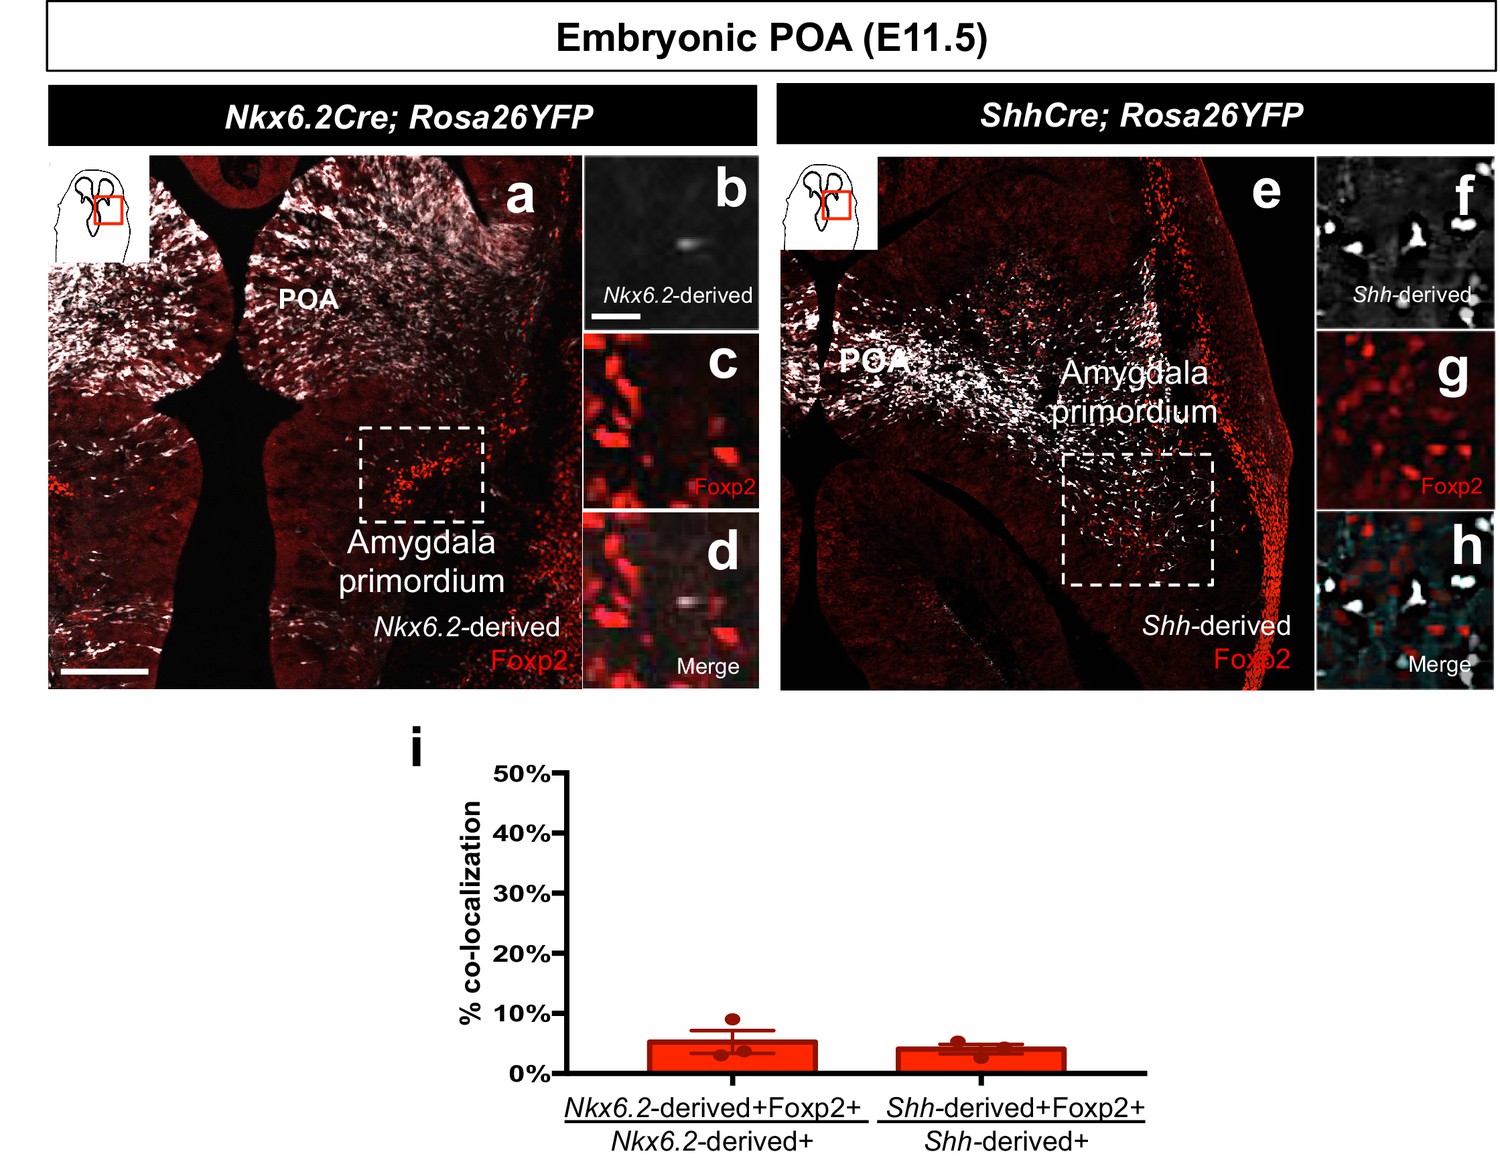
Foxp2+ cells are not derived from the Shh- or Nkx6.2 lineages.
Dual immunostaining of the amygdala primordium in horizontal sections at E11.5 reveals minor contribution of either the Nkx6.2-lineage (n = 3) (white) (a–d, i) or the Shh-lineage (n = 3) (white) (e–h, i) to the Foxp2+ population (red). Data are mean ± s.e.m. n is the number of animals. p<0.05 (*). The scale bar represents 200 μm (a, e) and 25 μm (b–d, f–h).
Figure 1—figure supplement 3
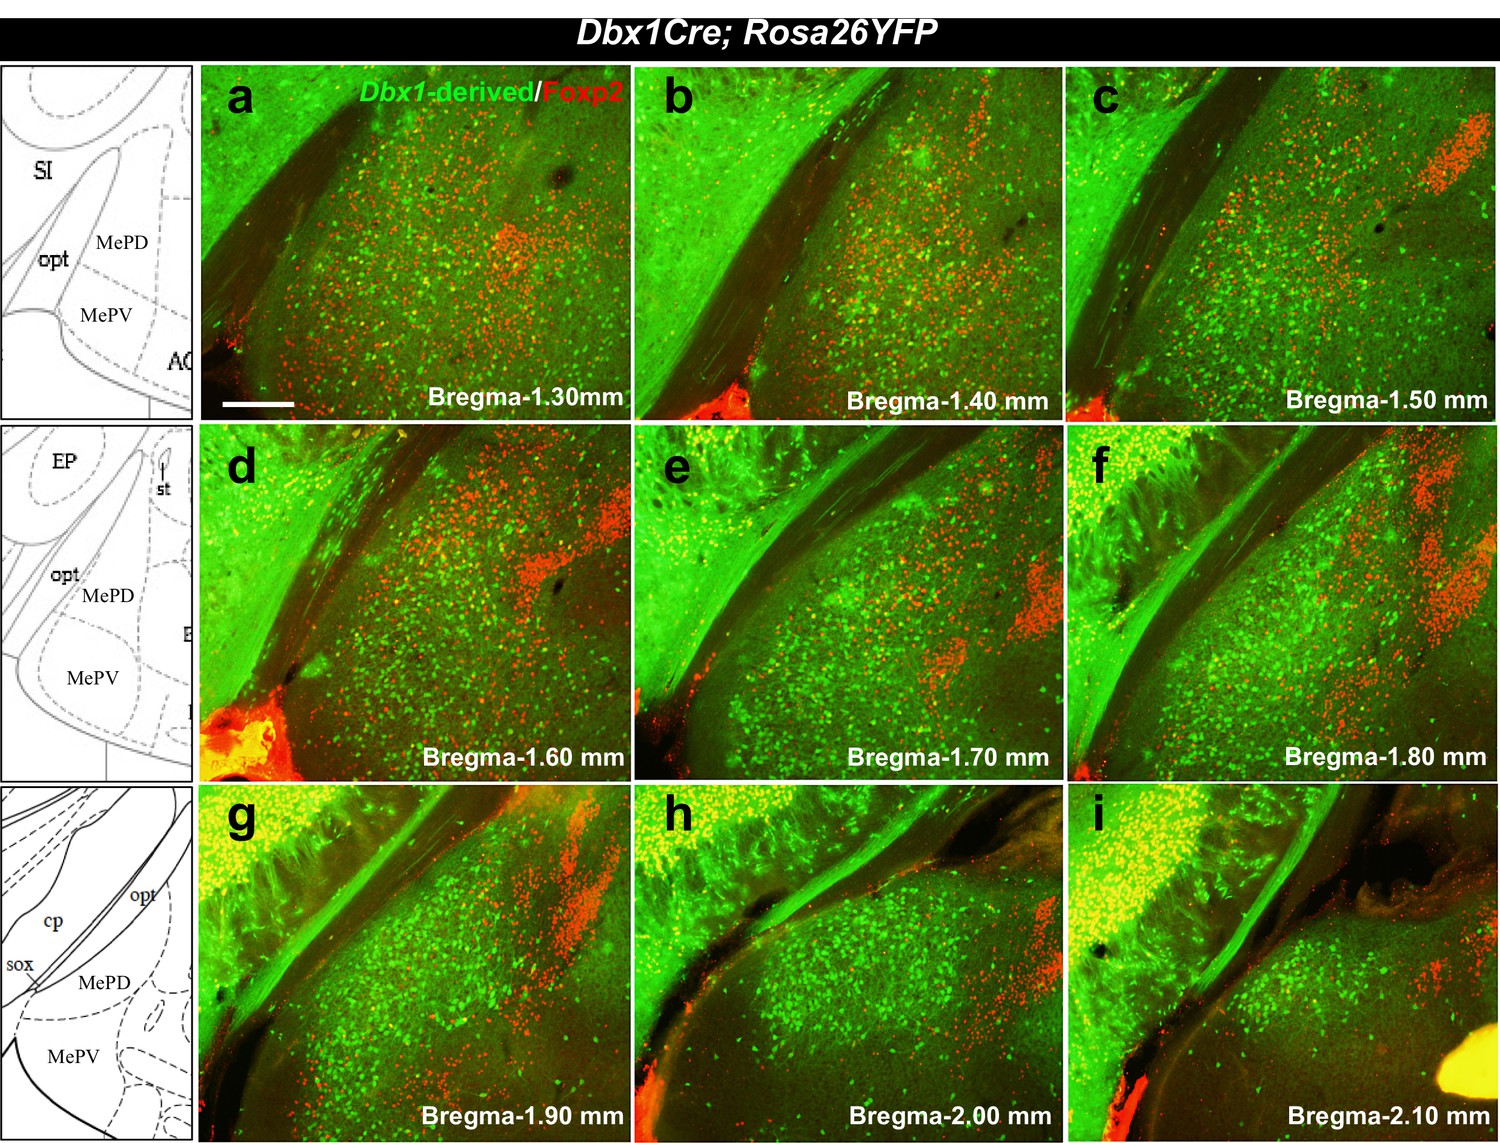
Localization of Dbx1-derived and Foxp2+ cells in the adult MeA.
Double immunofluorescence staining of adult coronal sections at the level of the MeA shows patterns of localization of Dbx1-derived (green) and Foxp2+ (red) cells across the anterior to the posterior extent of the MeA (a–i). Bregma levels correspond to the K. Franklin and G. Paxinos Mouse Brain in Stereotaxic Coordinates Atlas. The scale bar represents 200 μm.
Figure 2 with 1 supplement
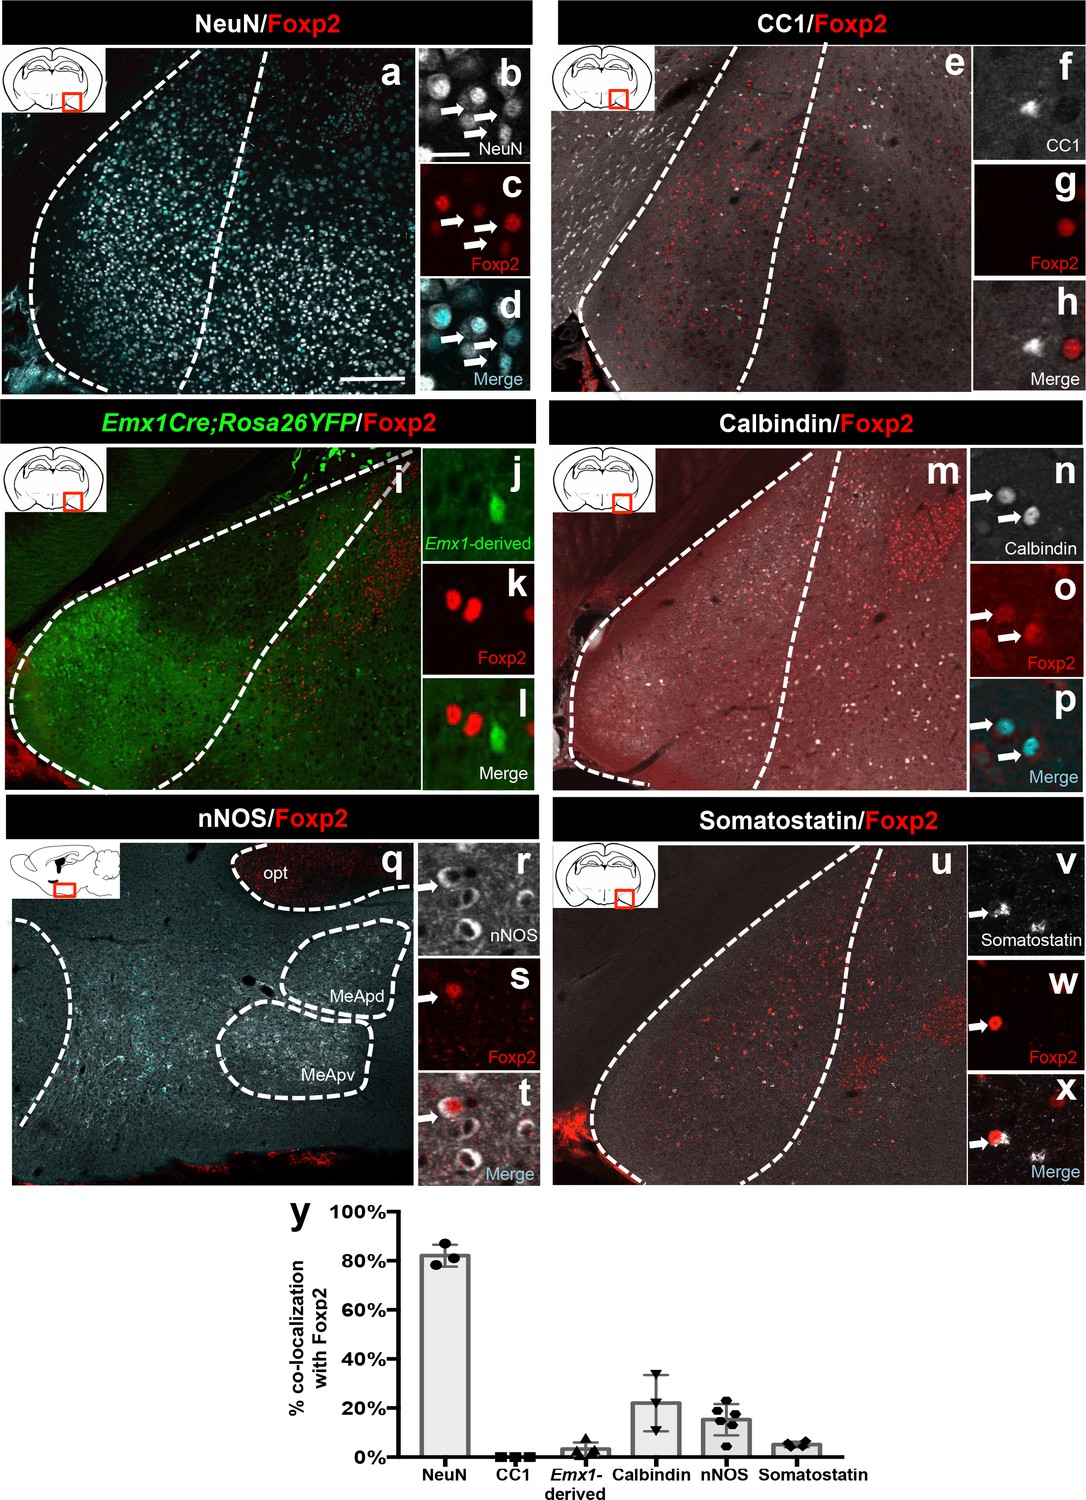
Identity of Foxp2+ medial amygdala neurons.
Dual immunofluorescence of Foxp2 with NeuN (n = 3 mice) (a–d), CC1 (n = 3 mice) (e–h), YFP (in Emx1cre;RYFP mice) (n = 5 mice) (i–l), calbindin (n = 3 mice) (m–p), nNOS (n = 6 mice) (q–t), and somatostatin (n = 4 mice) (u–x) (arrows show double-labeled cells). Quantification of co-localization with each marker (y). Data are mean ± s.e.m. n is the number of animals. The scale bar represents 200 μm (a, e, i, m, q, u) and 25 μm (b–d, f–h, j–l, n–p, r–t, v–x).
Figure 2—figure supplement 1

Identity of OTP+ medial amygdala neurons.
Dual immunofluorescence of Foxp2 with YFP (in Emx1cre;RYFP mice) (n = 3) (a–d), CAMKIIα (n = 3) (e–h), calbindin (n = 3) (i–l) and somatostatin (n = 3 mice) (m–p) (arrows show double-labeled cells). Quantification reveals that most Foxp2+ are not Emx1-derived, nor express somatostatin, express to some extent CAMKIIα, but are mainly Calbindin+ (q) Data are mean ± s.e.m. n is the number of animals. The scale bar represents 100 μm (a, e, i, m) and 25 μm (b–d, f–h, j–l, n–p).
Figure 3 with 1 supplement
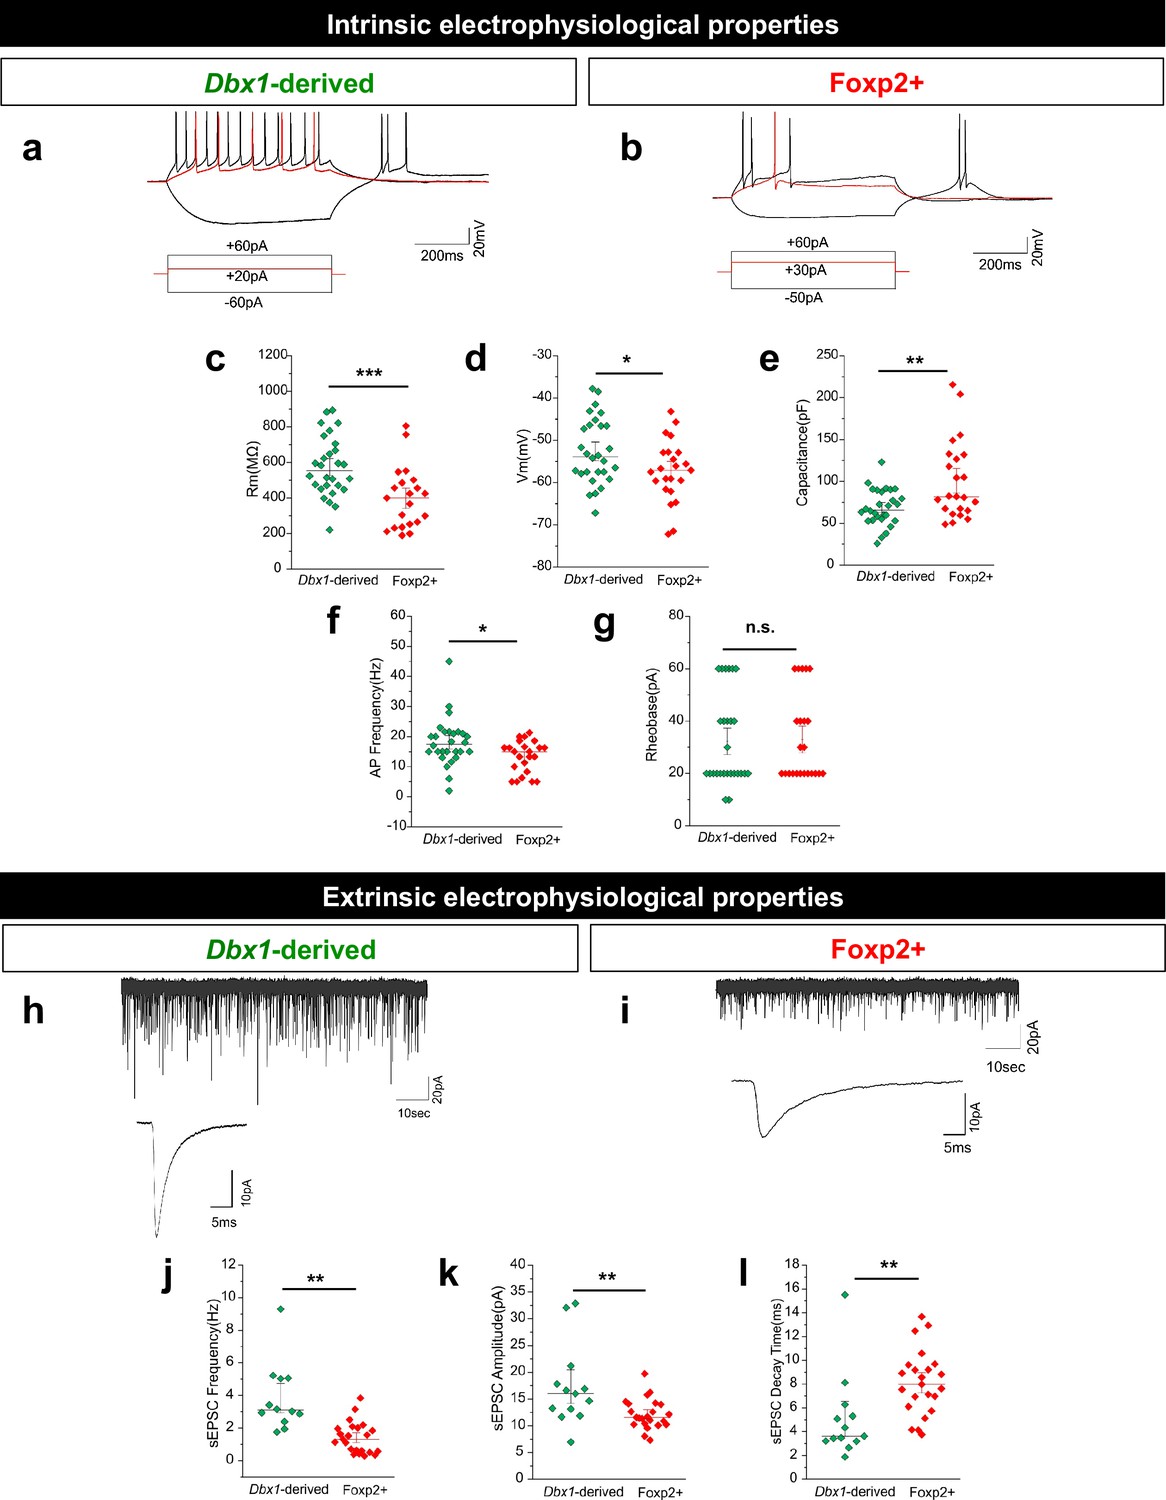
Dbx1-derived and Foxp2+ MeA neurons possess distinct electrophysiological properties.
Typical firing patterns of Dbx1-derived (a) and Foxp2+ (b) neurons with current injections at −60 pA,+20 pA and +60 pA. Significant differences across populations in resting membrane potential (Rm) (c), voltage at rest (Vrest) (d), capacitance (e), and action potential (AP) firing patterns (f) but not rheobase (g) are observed (two-tailed t-test, (c) p=0.0006, t = 3.676, df = 49; (d) p=0.036, t = 2.159, df = 49; (e) p=0.002, t = 3.1987, df = 49; (f) p=0.016, t = 3.1988, df = 49; (g) p=0.610, t = 0.514, df = 49; n = 28 Dbx1-derived cells and n = 23 Foxp2+ cells). Spontaneous excitatory post-synaptic currents (sEPSCs) are observed in both Dbx1-derived (h) and Foxp2+ (i) neurons, with significant differences in sEPSC frequency (j), amplitude (k) and decay (l) (two-tailed t-test, (j) p=<0.0001, t = 3.041, df = 34; (k) p=0.006, t = 2.949, df = 34; (l) p=0.005, t = 3.041, df = 34; n = 28 Dbx1-derived neurons, n = 23 Foxp2+ neurons). Data are mean ± s.e.m. n is the number of cells. p<0.05 (*), p<0.01 (**), and p<0.001 (***), n.s.; not significant.
Figure 3—figure supplement 1

Foxp2+ neurons possess projection neuronal morphology.
Biocytin filling depicting the morphology of a typical Foxp2+ neuron possessing dendritic spines (a-b, arrow). Representative 3-D reconstruction of several Foxp2+ neurons (c–e). The scale bars represent 100 μm (a) and 10 μm (b).
Figure 4 with 2 supplements
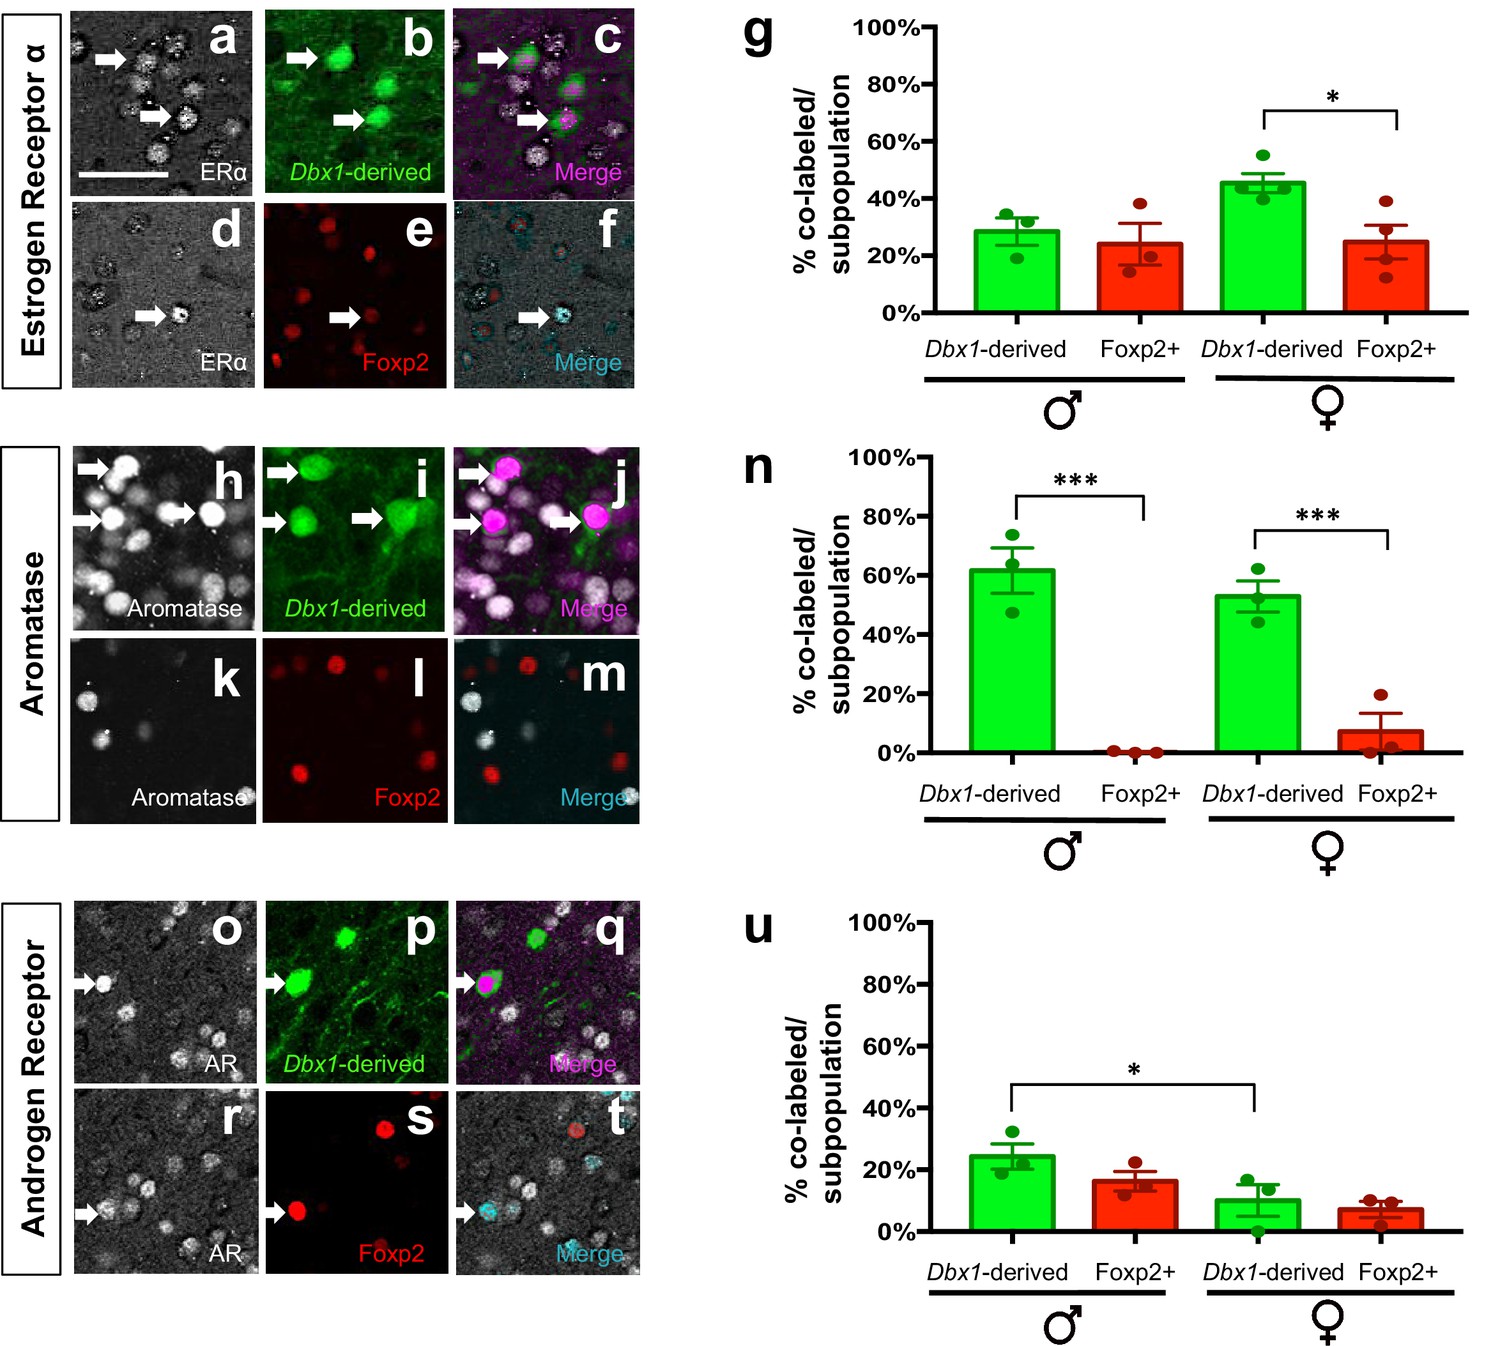
Expression of sex hormone pathway markers in Dbx1-derived and Foxp2+ cells.
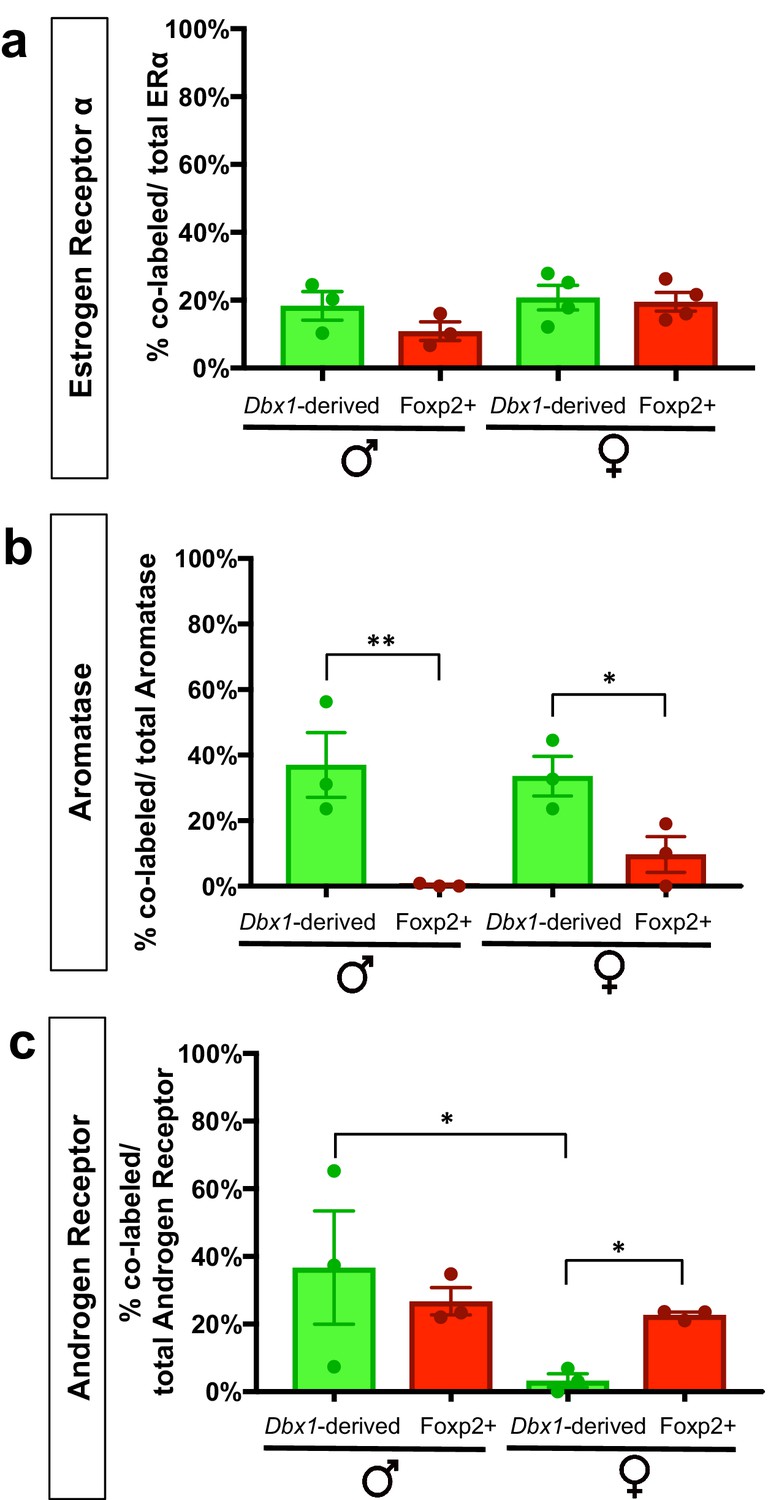
Dual immunofluorescence for YFP (green) or Foxp2 (red) with the sex steroid hormone pathway markers (white): estrogen receptor α (ERα) (a–g), aromatase (h–n) or androgen receptor (AR) (o–u) (arrows show double-labeled cells). Subpopulations of both Dbx1-derived (a–c, g) and Foxp2+ cells express ERα (d–g). Quantification reveals a greater percentage of Dbx1-derived cells expressing ERα compared to Foxp2+ cells in females (two-way ANOVA with no interaction between subpopulation and sex, but with main effect for subpopulation p=0.0433, F(1,10)=5.352; n = 4 and x = 45.38 for Dbx1-derived cells in female mice, n = 4 and x = 24.77 for Foxp2+ cells in female mice, n = 3 and x = 28.43 for Dbx1-derived cells in male mice, n = 3 and x = 24 for Foxp2+ cells in male mice). The majority of Dbx1-derived cells express aromatase in both males and females (h–j, n). In contrast, only a small percentage of Foxp2+ cells in both males and females express aromatase (two quantile regression analysis for non-normal distributions shows no interaction for sex and subpopulation but a main effect for subpopulation p=0.000 with a 95% confidence interval of 31.27 and 69.53, n = 3 for Dbx1-derived cells in male mice, n = 3 and for Foxp2+ cells in male mice, n = 3 for mice for Dbx1-derived cells in female mice, n = 3 and for Foxp2+ female mice). A greater percentage of Dbx1-derived neurons in males express AR in comparison to Dbx1-derived cells in female mice (o–q, u). No differences in percentages of Foxp2+ male or female subpopulations expressing AR (r–u) nor differences across subpopulations were observed (two-way ANOVA with no interaction between subpopulation and sex, but with main effect for sex p=0.0166, F(1,8)=9.118; n = 3 and x = 10.07 for Dbx1-derived cells in female mice, n = 3 and x = 7.133 for Foxp2+ cells in female mice, n = 3 and x = 24.3 for Dbx1-derived cells in male mice, n = 3 and x = 16.27 for Foxp2+ cells in male mice). Data are mean ± s.e.m. n is the number of animals and x is the mean. The scale bar represents 50 μm. p<0.05 (*) and p<0.01 (**).
Figure 4—figure supplement 1
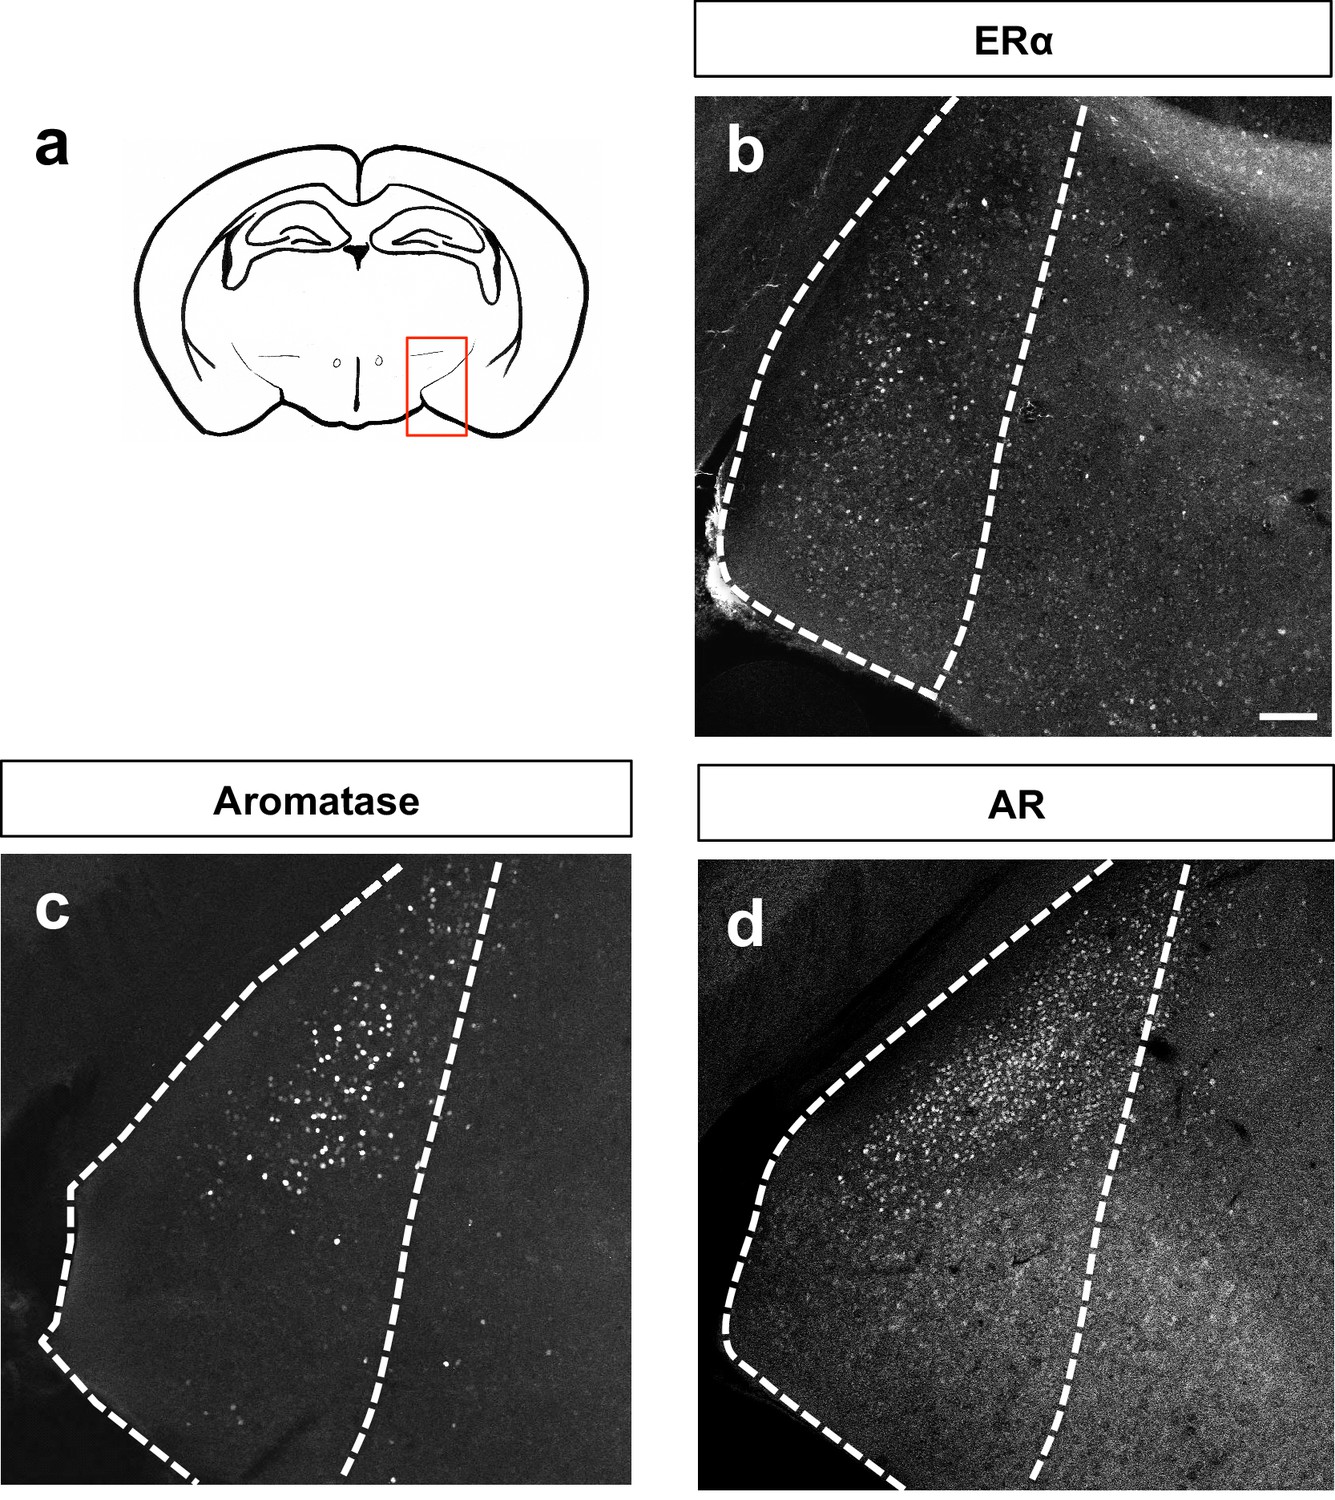
Patterns of MeA expression of sex steroid hormone markers.
Schematic of adult brain shows MeA (red box) (a). Immunostaining for ERα (b), aromatase (c) or AR (d) shows patterns of localization in the MeA. The scale bar represents 100 μm.
Figure 4—figure supplement 2
Percent contribution of Dbx1-derived and Foxp2+ cells to sex steroid hormone marker populations.
The percent contribution of Dbx1-derived cells and Foxp2+ cells in male and female brains to the ERα+, Aromatase+ and AR+ populations are as follows: ERα+ population: Dbx1-derived contribution: 18% ± 4.2 (male n = 3, x = 18.37), 21% ± 3.59 (female n = 4, x = 20.75). Foxp2+ contribution: 11% ± 2.72 (male n = 3, x = 10.89); 21% + 3.0 (female n = 4, x = 19.48). No subpopulation or sex differences were observed (two-way ANOVA with no interaction between subpopulation and sex and no main effects (F(1,10)=0.8261 p=0.3848) (a). Aromatase+ population: Dbx1-derived contribution: 37% ± 9.89 (male n = 3, x = 37), 34% + 6.05 (female n = 3, x = 33.6). Foxp2+ contribution: 0% ± 0.3 (male n = 0.3), 10% + 5.49 (female n = 3, x = 9.667) (b). This difference in expression was significant across subpopulations (two-way ANOVA with no interaction between subpopulation and sex, with a main effect for subpopulation p=0.0015, F(1,8)=22.33). AR+ population: Dbx1-derived contribution: 36.7% + 16.71 (male n = 3, x = 31.81), 3% + 2.0 (female n = 3, x = 2.11), Foxp2+ contribution: 27% ± 4.05 (male n = 3, x = 26.45), 23% ± 0.85 (female n = 3, x = 22.69) (c). A two-way ANOVA revealed no interaction between subpopulation and sex; however the value was trending (p=0.0660), with a main effect for sex within the Dbx1-derived subpopulation (p=0.0107, F(1,8)=10.95). As the interaction was trending, we also analyzed subpopulation differences and found significant increases in the percent of AR+ expressing Foxp2+ cells in comparison to the Dbx1-derived subpopulation in females (p=0.0308, F(1,8)=6.85) (c). n is the number of animals and x is the mean. p<0.05 (*), p<0.01 (**), and p<0.001 (***).
Figure 5 with 1 supplement
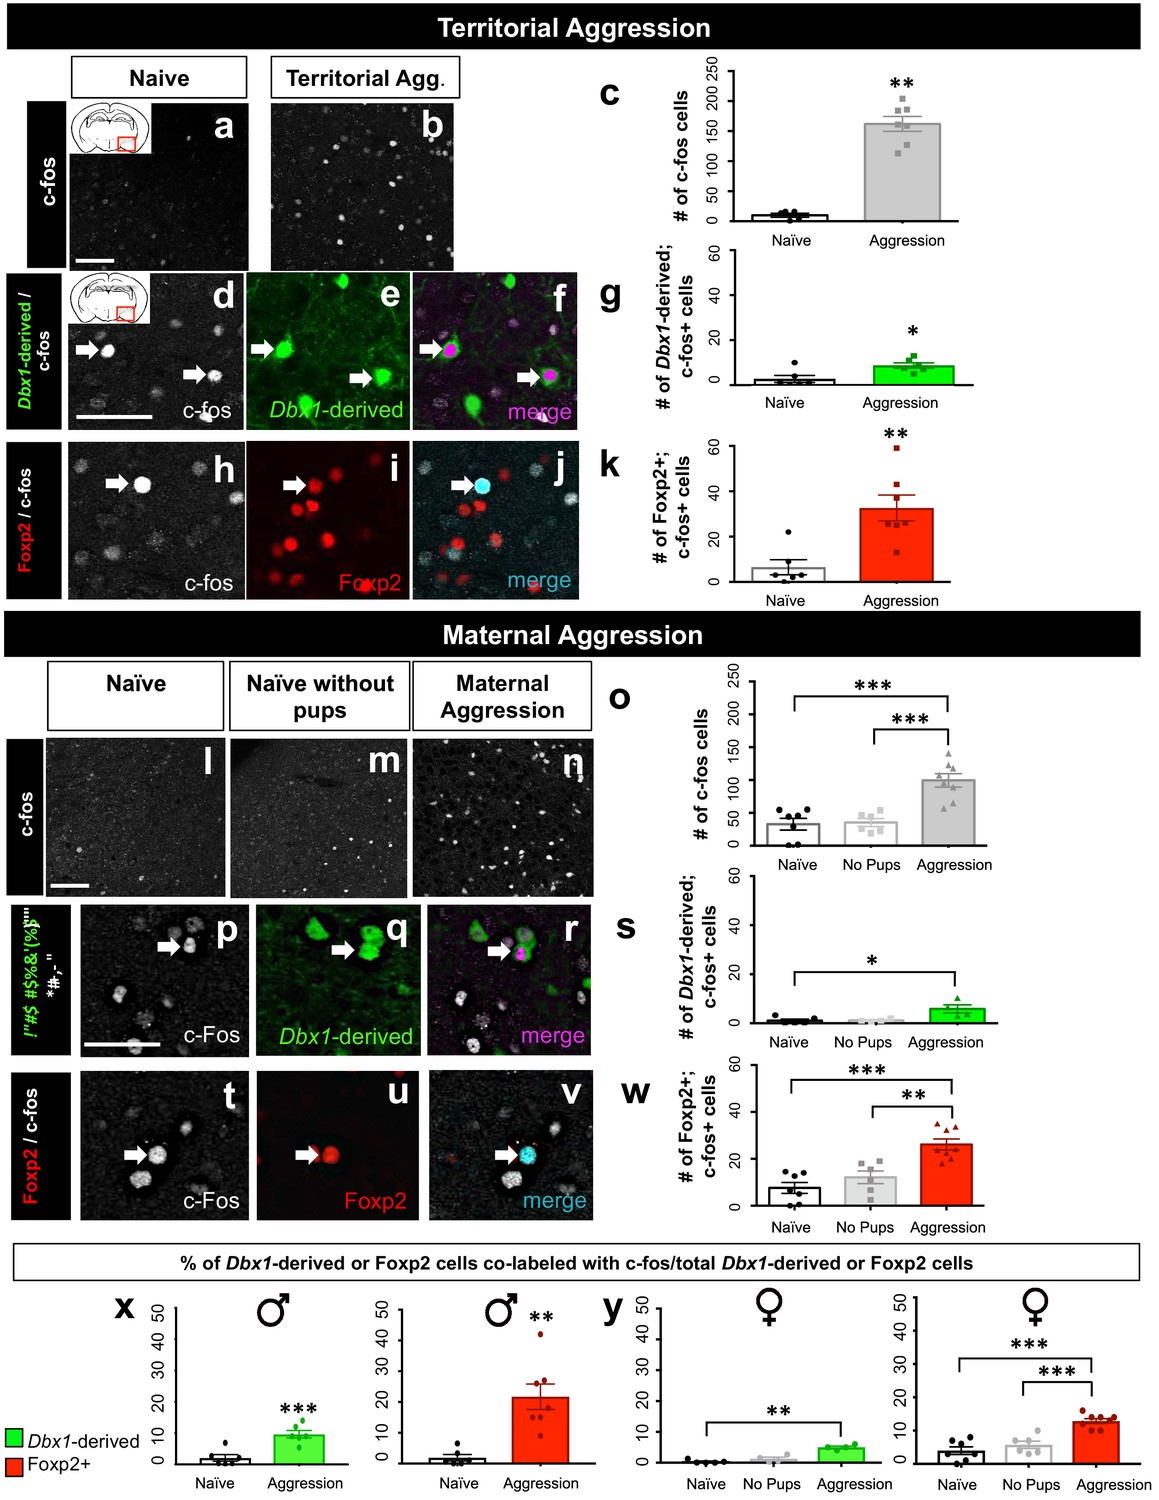
Dbx1-derived and Foxp2+ neurons are activated during aggressive encounters.
Significant increases in the number of c-fos+ cells (white) compared to controls are observed in the MeA during both male territorial aggression (a–c) (two tailed Mann-Whitney test, U = 0, p=0.0025, n = 5 naïve mice, n = 7 territorial aggression) and maternal aggression (one-way ANOVA, p=<0.0001, F(2, 18)=19.05, n = 7 naïve mice, n = 6 ‘no pup’ condition, n = 8 maternal aggression) (l–o). Dual immunofluorescence for c-fos (white) and YFP (green) or Foxp2 (red) after male territorial aggression reveals an increase in the number of Dbx1-derived cells (two-tailed Mann-Whitney test, U = 4, p=0.0238, n = 6) (d–g) and Foxp2+ cells (two-tailed Mann-Whitney test, U = 0, p=0.0023 n = 7) expressing c-fos in comparison to naïve control mice (n = 6) not exposed to an intruder (h–k). In female mice, an increase in the number Dbx1-derived cells expressing c-fos during maternal aggression (n = 4) in comparison to naïve (n = 5), but not in the ‘no pups’ conditions (n = 4), is observed (Kruskal-Wallis test, X2(3,13)=7.124 p=0.0164) (p–s). There is also an increase in the number of Foxp2+ cells (n = 8) expressing c-fos during maternal aggression in comparison to the naïve (n = 7) and ‘no pups’ control conditions (n = 6) (one-way ANOVA p=<0.0001, F(2,18)=16.93) (t–w). Analyses of the percentage of both Dbx1-derived (YFP+ and c-fos+ /total YFP+) and Foxp2+ cells (Foxp2+ and c-fos+/ total Foxp2+) expressing c-fos in male mice reveals an increase in both the Dbx1-derived subpopulation (n = 6) (two-tailed t-test, p=0.0009, t = 4.685, df = 11) and the Foxp2+ subpopulation (n = 7) (two-tailed t-test, p=0.001, t = 4.295, df = 11) in comparison to naïve controls (n = 6) (x). In females, the percentage of Dbx1-derived cells expressing c-fos during maternal aggression is higher in comparison to the naïve condition but not to the ‘no pups’ condition (Kruskal-Wallis test, X2(3,13)=9.461 p=0.0005, n = 5 naïve, n = 4 ‘no pups’ and n = 4 aggression) (y). The percentage of Foxp2+ cells expressing c-fos during maternal aggression is also higher during maternal aggression (n = 8) in comparison to both the naïve (n = 7) and ‘no pups’ (n = 6) controls (one way ANOVA, p=<0.0001, F(2,18)=24.16) (y). Data are mean ± s.e.m. n is the number of animals. Arrows show double-labeled cells. p<0.05 (*), p<0.01 (**), and p<0.001 (***). The scale bar represents 50 μm.
Figure 5—figure supplement 1
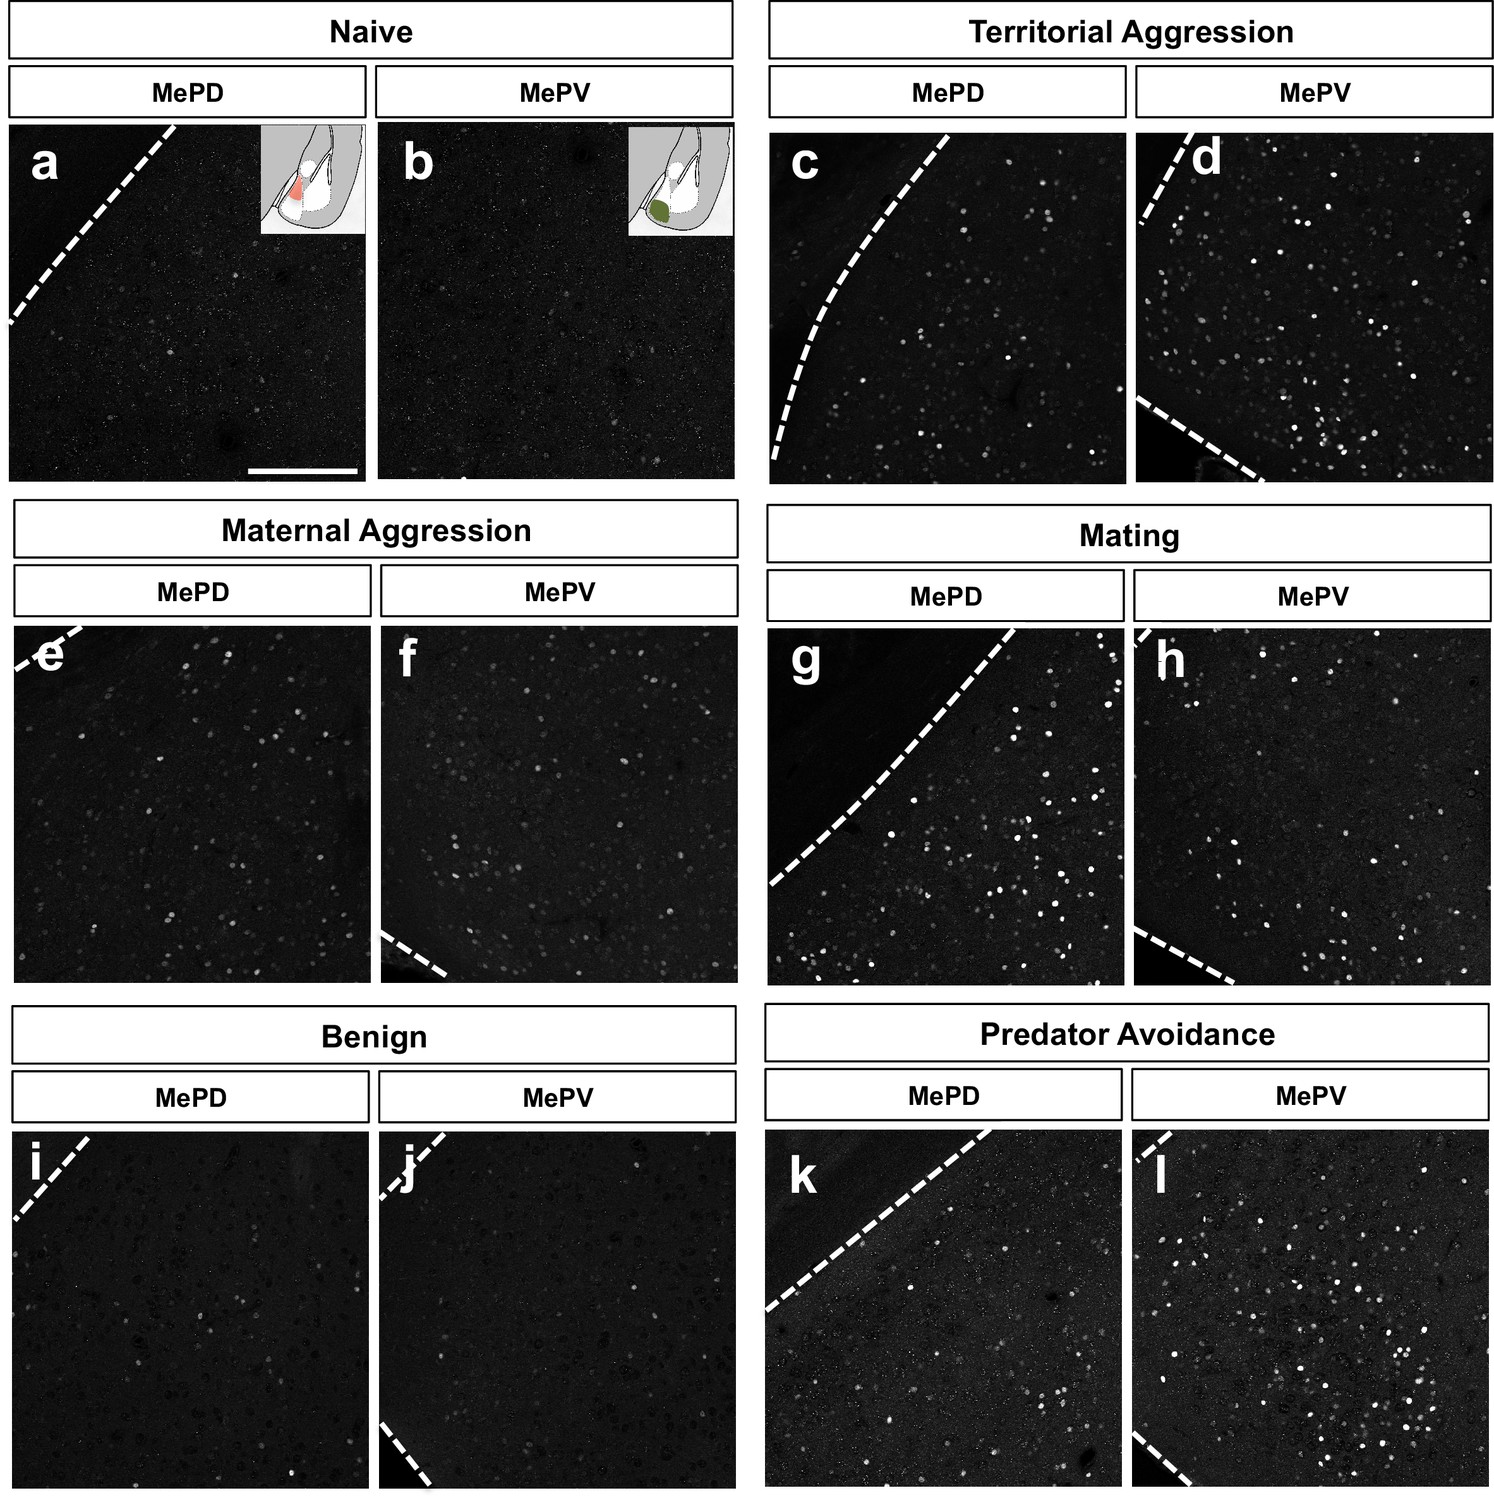
c-fos expression in the posterio-medial (MePD) and posterio-ventral (MePV) subnuclei during different innate behavioral assays.
Immunofluorescence staining for c-fos after innate behavioral assays: territorial (c–d) and maternal (g–h) aggression, mating (g–h), predator avoidance (k–l) and their respective native (a–b) and benign (i–j) controls.
Figure 6
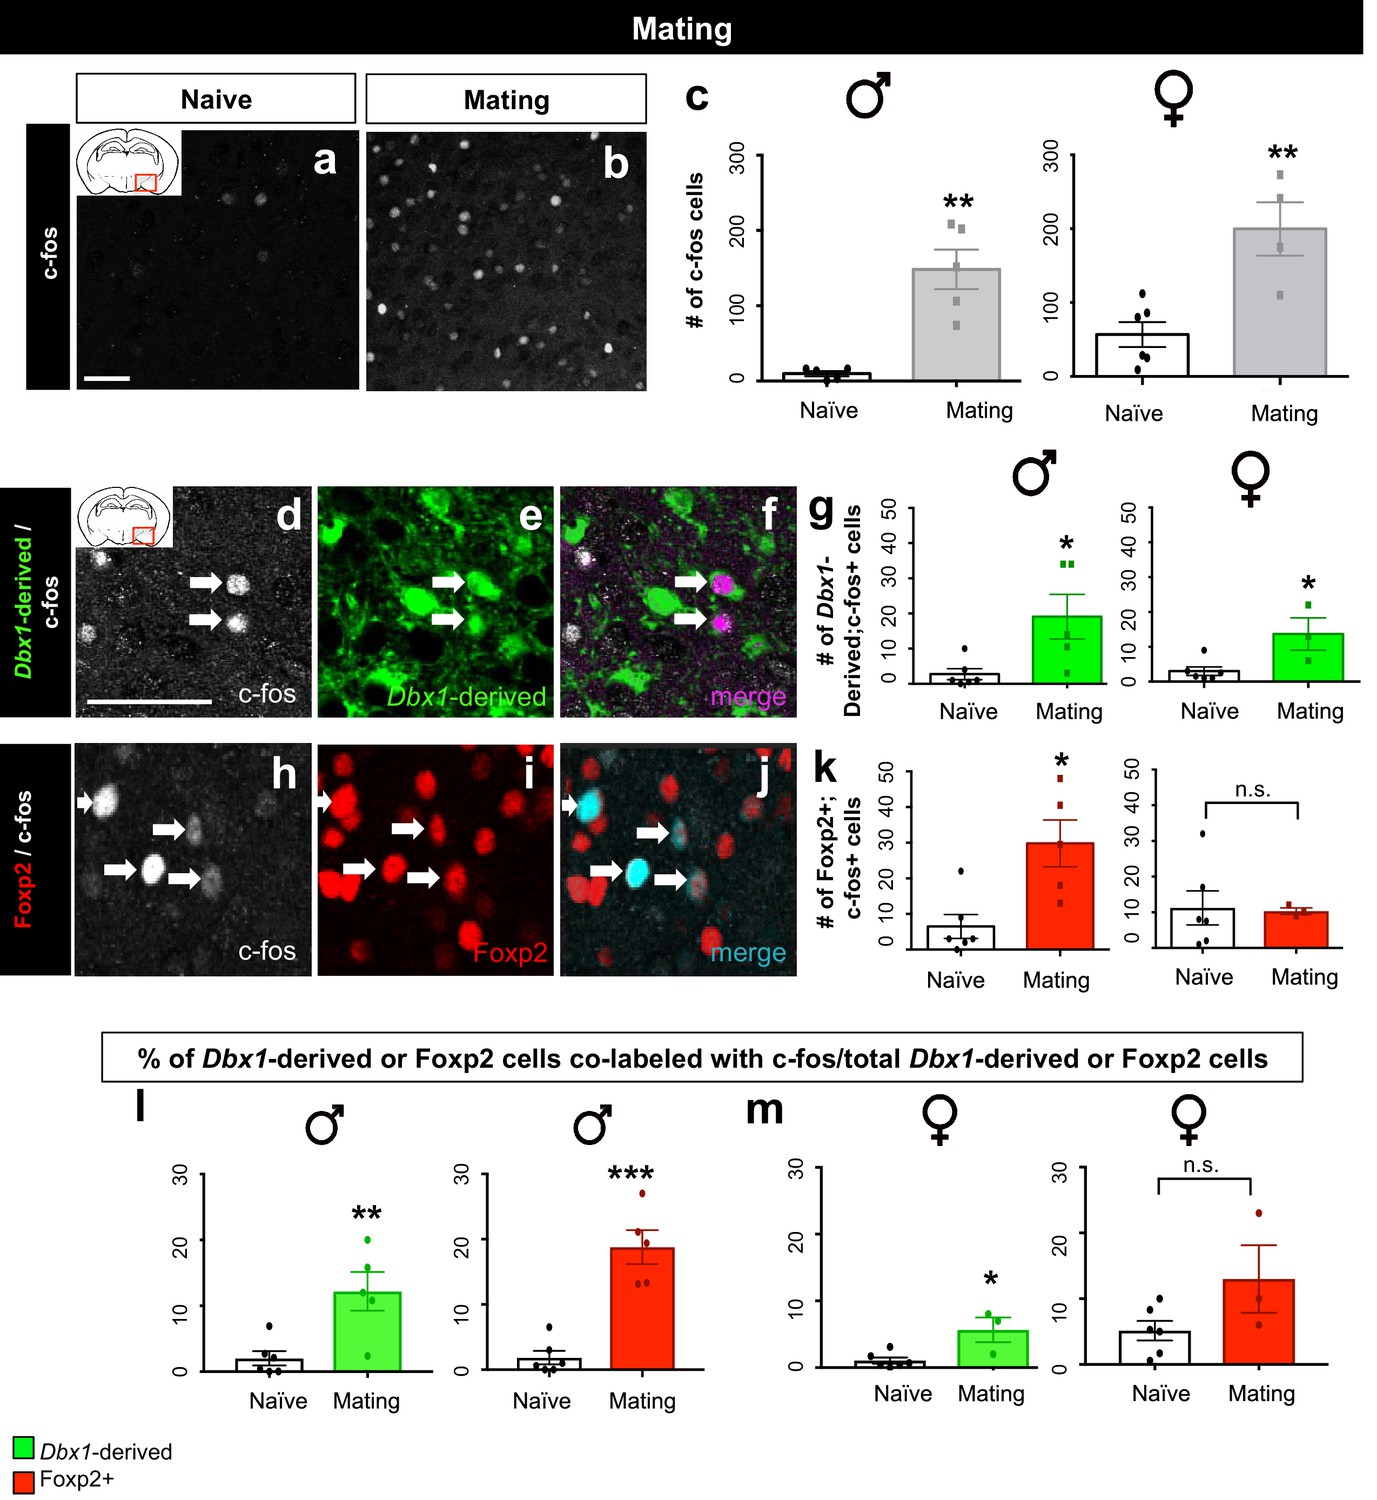
Sex-specific subpopulation responses during mating.
A significant increase in the number of c-fos+ cells (white) in the MeA during mating compared to naïve control is observed in both male (two tailed Mann-Whitney test, U = 0, p=0.0079, n = 5 naïve, n = 5 mating) and female brains (two-tailed t-test, p=0.0038, t = 4.022, df = 8, n = 6 naïve, n = 4 mating) (a–c). Double immunofluorescence for c-fos (white) and YFP (green) or Foxp2 (red) after mating reveals an increase in the number of Dbx1-derived neurons expressing c-fos in male (two tailed Mann-Whitney test, U = 2, p=0.0152, n = 6 naïve, n = 5 mating) and female (two tailed Mann-Whitney test, U = 1, p=0.0476, n = 6 naïve, n = 3 mating) brains (d–g). A significant increase in the number of Foxp2+ cells expressing c-fos is only observed in male mice during mating (two-tailed t-test, p=0.009, t = 3.331, df = 9, n = 6 naïve, n = 5 mating) but not in female mice during mating (two tailed t-test, p=0.8993, t = 0.1312, df = 7, n = 6 naïve, n = 3 mating) as compared to naïve controls (h–k). A significant increase in the percentage of Dbx1-derived cells expressing c-fos (YFP+ and c-fos+ /total YFP+) is observed in males during mating in comparison to the naïve controls (two-tailed t-test, p=0.0067, t = 3.507, df = 9, n = 6 naïve, n = 5 mating) (l). A significant increase in the percentage of Foxp2+ cells expressing c-fos (Foxp2+ and c-fos+ /total Foxp2+) in male brains during mating is also observed in comparison to naïve controls (two-tailed t-test, p=0.0001, t = 6.477, df = 9, n = 6 naïve, n = 5 mating) (l). An increase in the percentage of Dbx1-derived cells expressing c-fos (two-tailed t-test, p=0.0131, t = 3.302, df = 7, n = 6 naïve, n = 3 mating) is observed in female brains during mating (m). In contrast, no increase is observed in the Foxp2+ population (two-tailed t-test, p=0.0905, t = 1.96, df = 7, n = 6 naïve, n = 3 mating) in female brains during mating (m). Data are mean ± s.e.m. n is the number of animals. p<0.05 (*), p<0.01 (**), and p<0.001 (***), n.s.; not significant. Arrows show double labeled cells. The scale bar represents 50 μm.
Figure 7 with 1 supplement
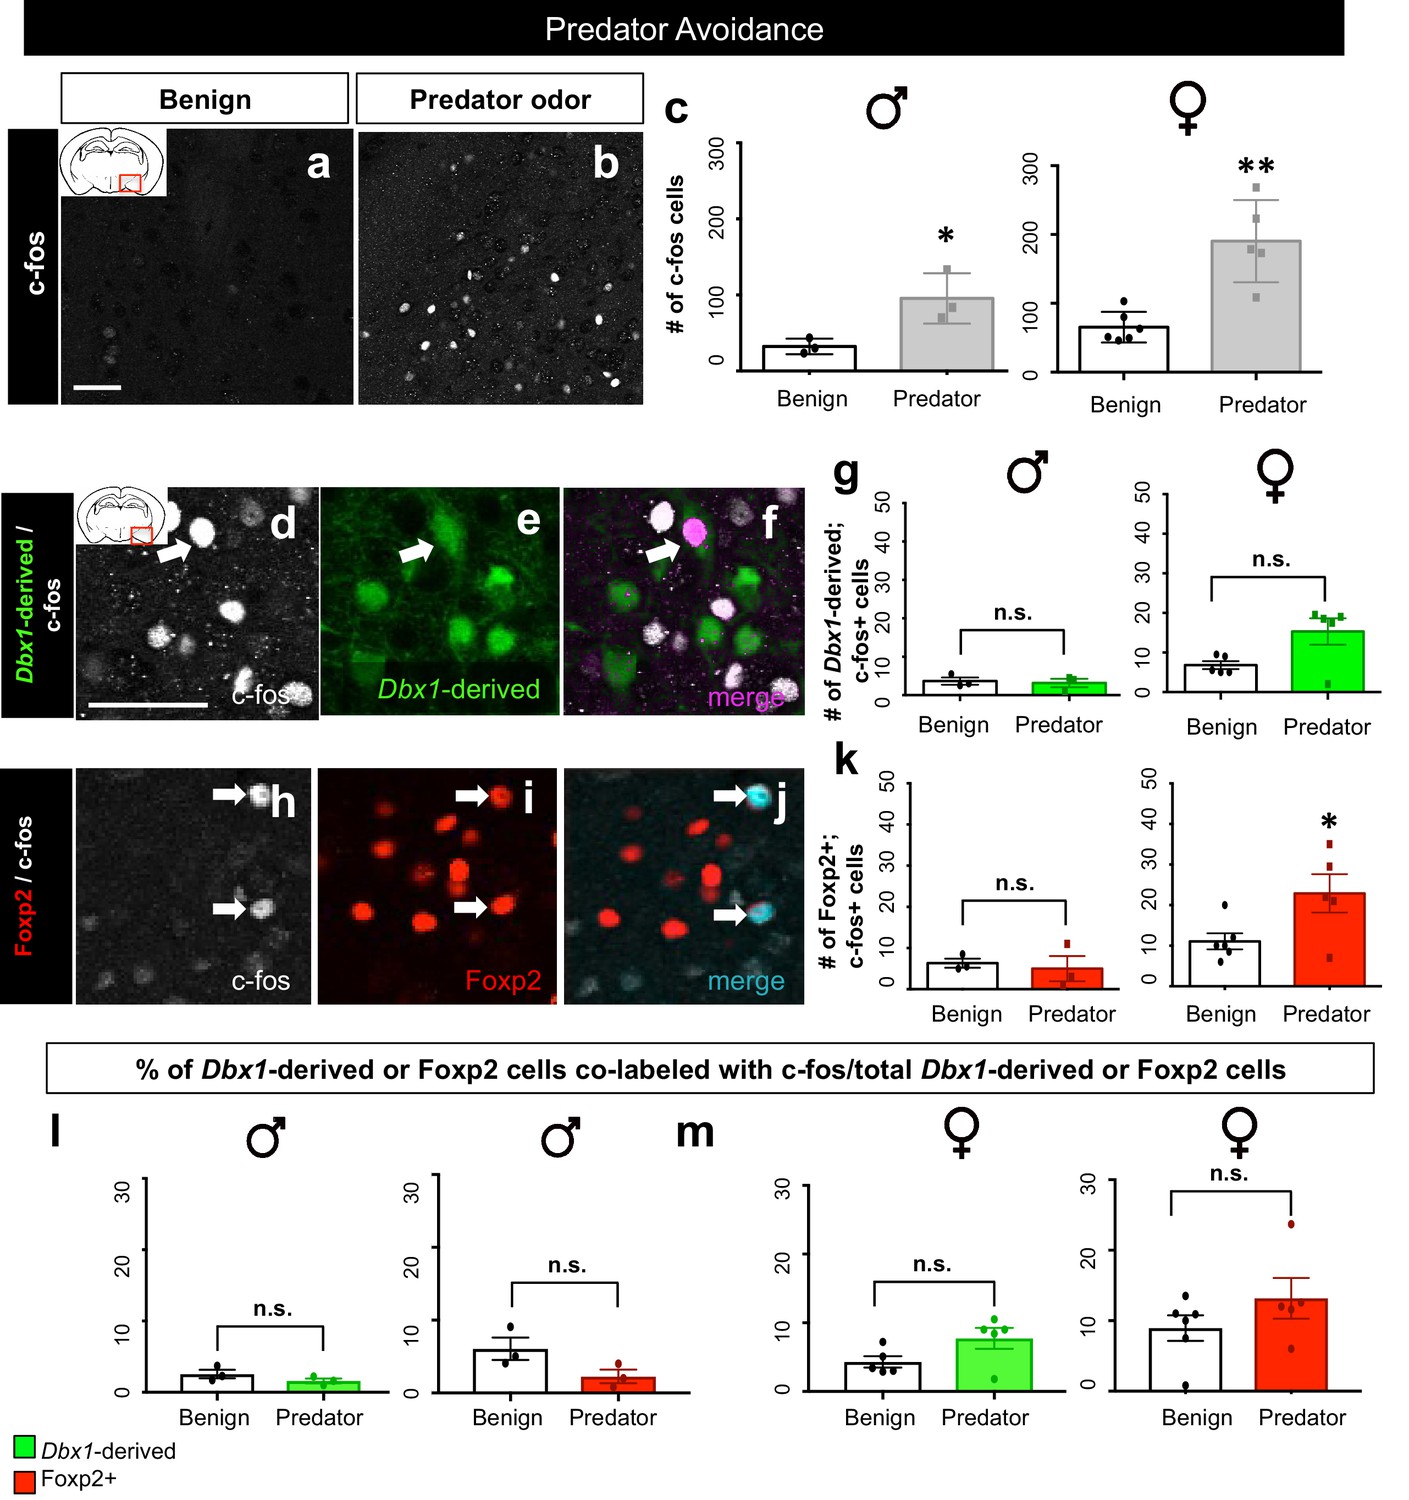
Dbx1-derived and Foxp2+ MeA subpopulation activation patterns in response to predator odor.
A significant increase in the number of c-fos+ cells (white) in the MeA in both male (two-tailed t-test, p=0.0344, t = 0.30.153, df = 4, n = 3 benign, n = 3 predator avoidance) and female (two-tailed t-test, p=0.001, t = 4.778, df = 9, n = 6 benign, n = 5 predator avoidance) brains is observed in the presence of rat bedding compared to benign unsoiled bedding (a–c). Double immunofluorescence for c-fos (white) and YFP (green) or Foxp2 (red) after predator odor exposure reveals no increase in the number of Dbx1-derived cells (two-tailed t-test, p=0.687, t = 0.35, df = 4, n = 3 benign, n = 3 predator avoidance) (d–g) or Foxp2+ cells (two-tailed t-test, p=0.703, t = 0.70, df = 4, n = 3 benign, n = 3 predator avoidance) (h–k) expressing c-fos in male brains as compared to control. In the female brain, there is also no increase in the number of Dbx1-derived cells during predator odor exposure as compared to control (two tailed Mann-Whitney, U = 5, p=0.1349, n = 5 benign, n = 5 predator avoidance) (d–g). In contrast, an increase the number of Foxp2+ cells (two-tailed t-test, p=0.036, t = 2.47. df = 9, n = 6 benign, n = 5 predator avoidance) in female brains is observed (h–k). Analysis of the percentage of Dbx1-derived (YFP+ and c-fos+ /total YFP+) and Foxp2+ cells (Foxp2+ and c-fos+/ total Foxp2+) expressing c-fos in both male and female brains revealed no increases in either population (Dbx1-derived population in male mice: two-tailed t-test, p=0.2318, t = 1.408, df = 4, naïve n = 3, predator avoidance n = 3; Foxp2+ population in male mice: two-tailed t-test, p=0.1023, t = 2.11, df = 4, naïve n = 3, predator avoidance n = 3; Dbx1-derived population in female mice: two-tailed Mann-Whitney, U = 5, p=0.1349, naïve n = 5, predator avoidance n = 5; Foxp2+ population in female mice: two-tailed t-test, p=0.2299, t = 1.288, df = 9, naïve n = 6, predator avoidance n = 5). Data are mean ± s.e.m. n is the number of animals. Arrows show double-labeled cells. p<0.05 (*), p<0.01 (**), and p<0.001 (***), n.s.; not significant). The scale bar represents 50 μm.
Figure 7—figure supplement 1
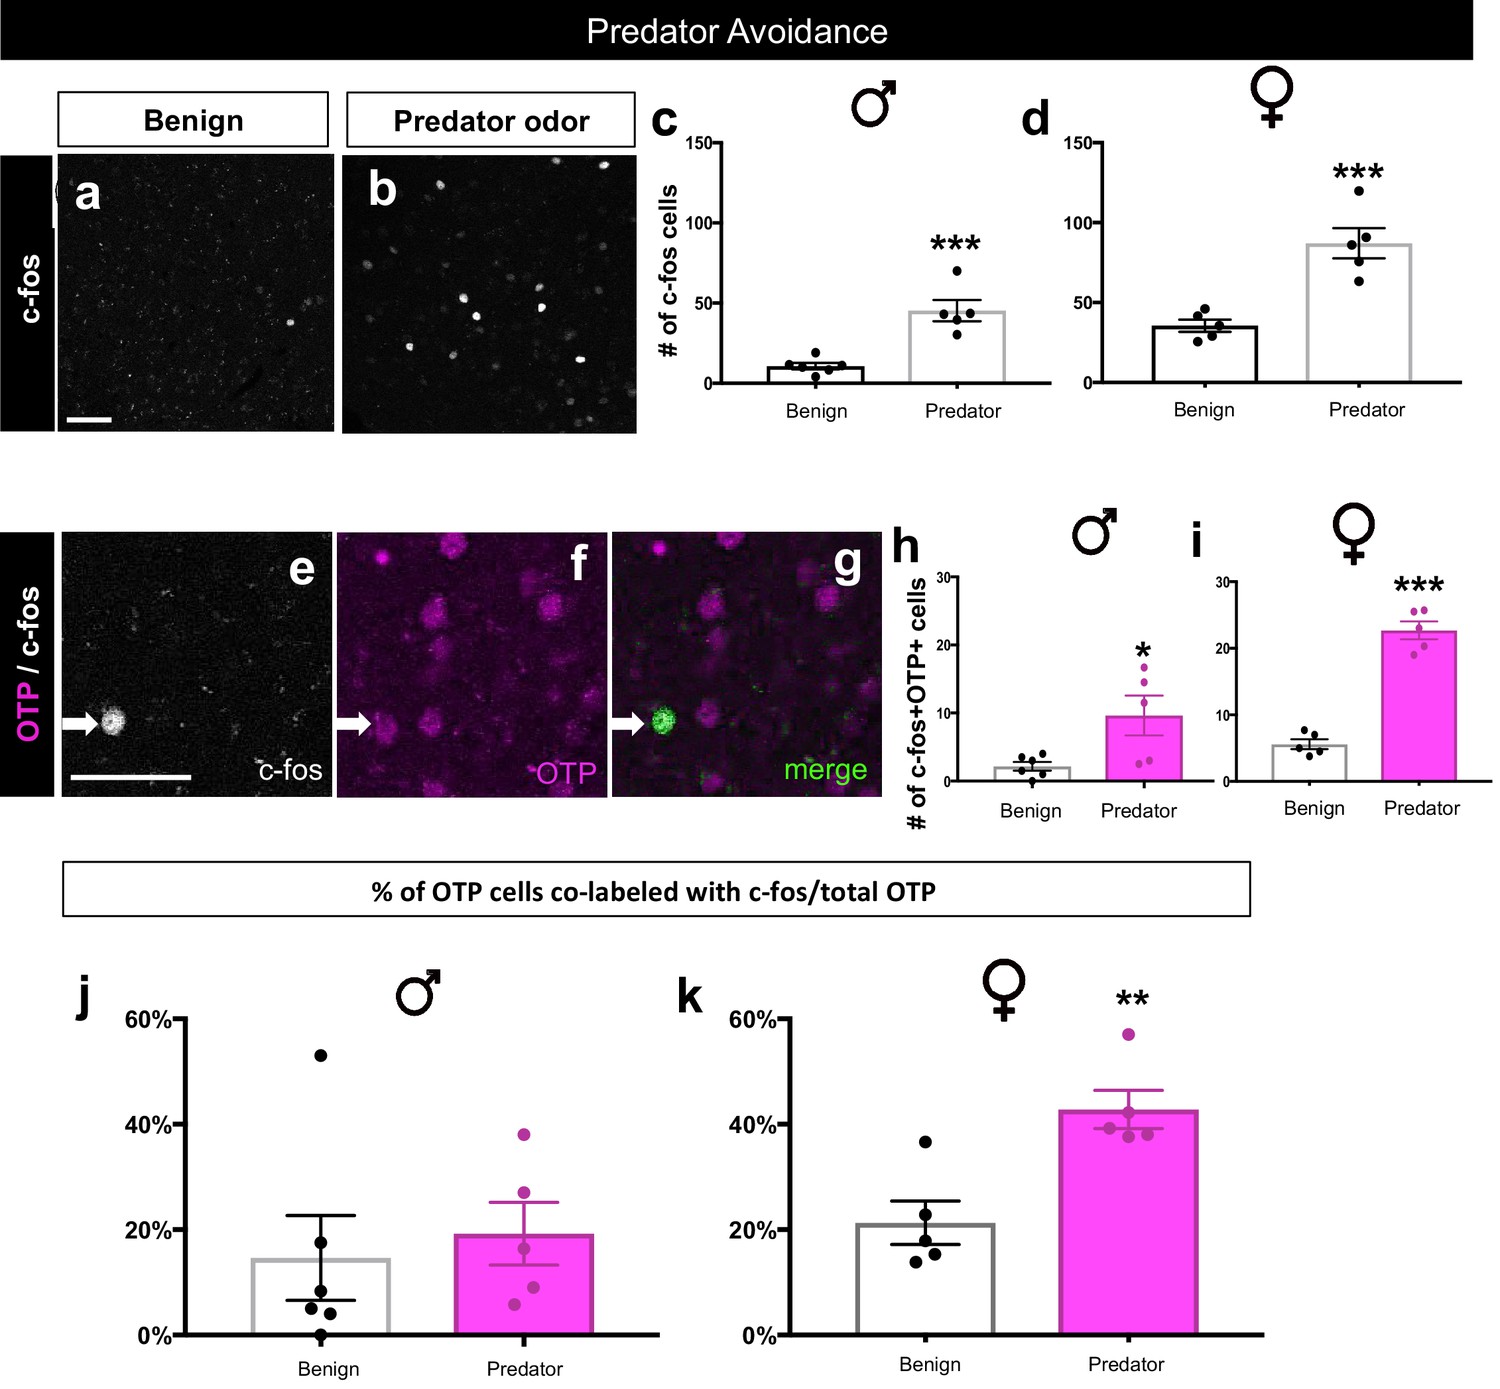
Sex-specific activation of OTP+ cells during predator avoidance.
A significant increase in the number of c-fos+ cells (white) in the MeA in males (two-tailed t-test, p=0.0004, t = 5.435, df = 9, n = 6 benign, n = 5 predator avoidance) (a–c) and in females (two-tailed t-test, p=0.0010, t = 5.08, df = 8, n = 5 benign, n = 5 predator avoidance) (a–b, c) in the presence of rat bedding compared to benign unsoiled bedding. Double immunofluorescence for c-fos (white) and OTP (pink) after predator odor exposure reveals an increase in the number of cells expressing c-fos in the male OTP+ subpopulation (two-tailed t-test, p=0.023, t = 2.727, df = 9, n = 6 benign, n = 5 predator avoidance) (e–h) and in the female OTP+ subpopulation (two-tailed t-test, p<0.0001, t = 11.09, df = 8, n = 5 benign, n = 5 predator avoidance). There is no difference in the percentage of OTP+ cells expressing c-fos (OTP+c-fos+/total OTP) between benign (n = 6) and predator avoidance (n = 6) conditions in males (two tailed Mann-Whitney test, U = 9, p=0.3290) (j). In contrast, there is a significant increase in the percent of OTP+ cells expressing c-fos between benign (n = 5) and predator avoidance (n = 5) conditions in female brains (two tailed Mann-Whitney test, U = 0, p=0.0079, n = 5 benign, n = 5 predator avoidance condition). p<0.05 (*), p<0.01 (**), and p<0.001 (***). Arrows show double- labeled cells. The scale bar represents 50 μm.
Figure 8

Summary of findings.
Schematic summarizing our findings in which embryonic segregation of Dbx1-derived (green) and Foxp2+ (red) cells in the embryonic brain predicts postnatal intrinsic electrophysiological profiles and differential sex and subpopulation-specific neuronal activation patterns (neurons indicate activation and X’s indicate no activation) in response to aggression (territorial and maternal), mating and predator avoidance. The OTP+ population is shown responding to predator odor in female brains. The male predator odor responsive population remains to be determined.
Download links
A two-part list of links to download the article, or parts of the article, in various formats.
Downloads (link to download the article as PDF)
Open citations (links to open the citations from this article in various online reference manager services)
Cite this article (links to download the citations from this article in formats compatible with various reference manager tools)
Embryonic transcription factor expression in mice predicts medial amygdala neuronal identity and sex-specific responses to innate behavioral cues
eLife 6:e21012.
https://doi.org/10.7554/eLife.21012


