Super-resolution imaging of a 2.5 kb non-repetitive DNA in situ in the nuclear genome using molecular beacon probes
- Shenzhen University, China
- Tsinghua University, China
- The University of Hong Kong, China
- LemonData Biotech, China
- Phil Rivers Technology, China
- The University of Texas at Dallas, United States
Figures
Figure 1 with 3 supplements
MB probes can efficiently reduce non-specific fluorescence and facilitate probe-target binding.
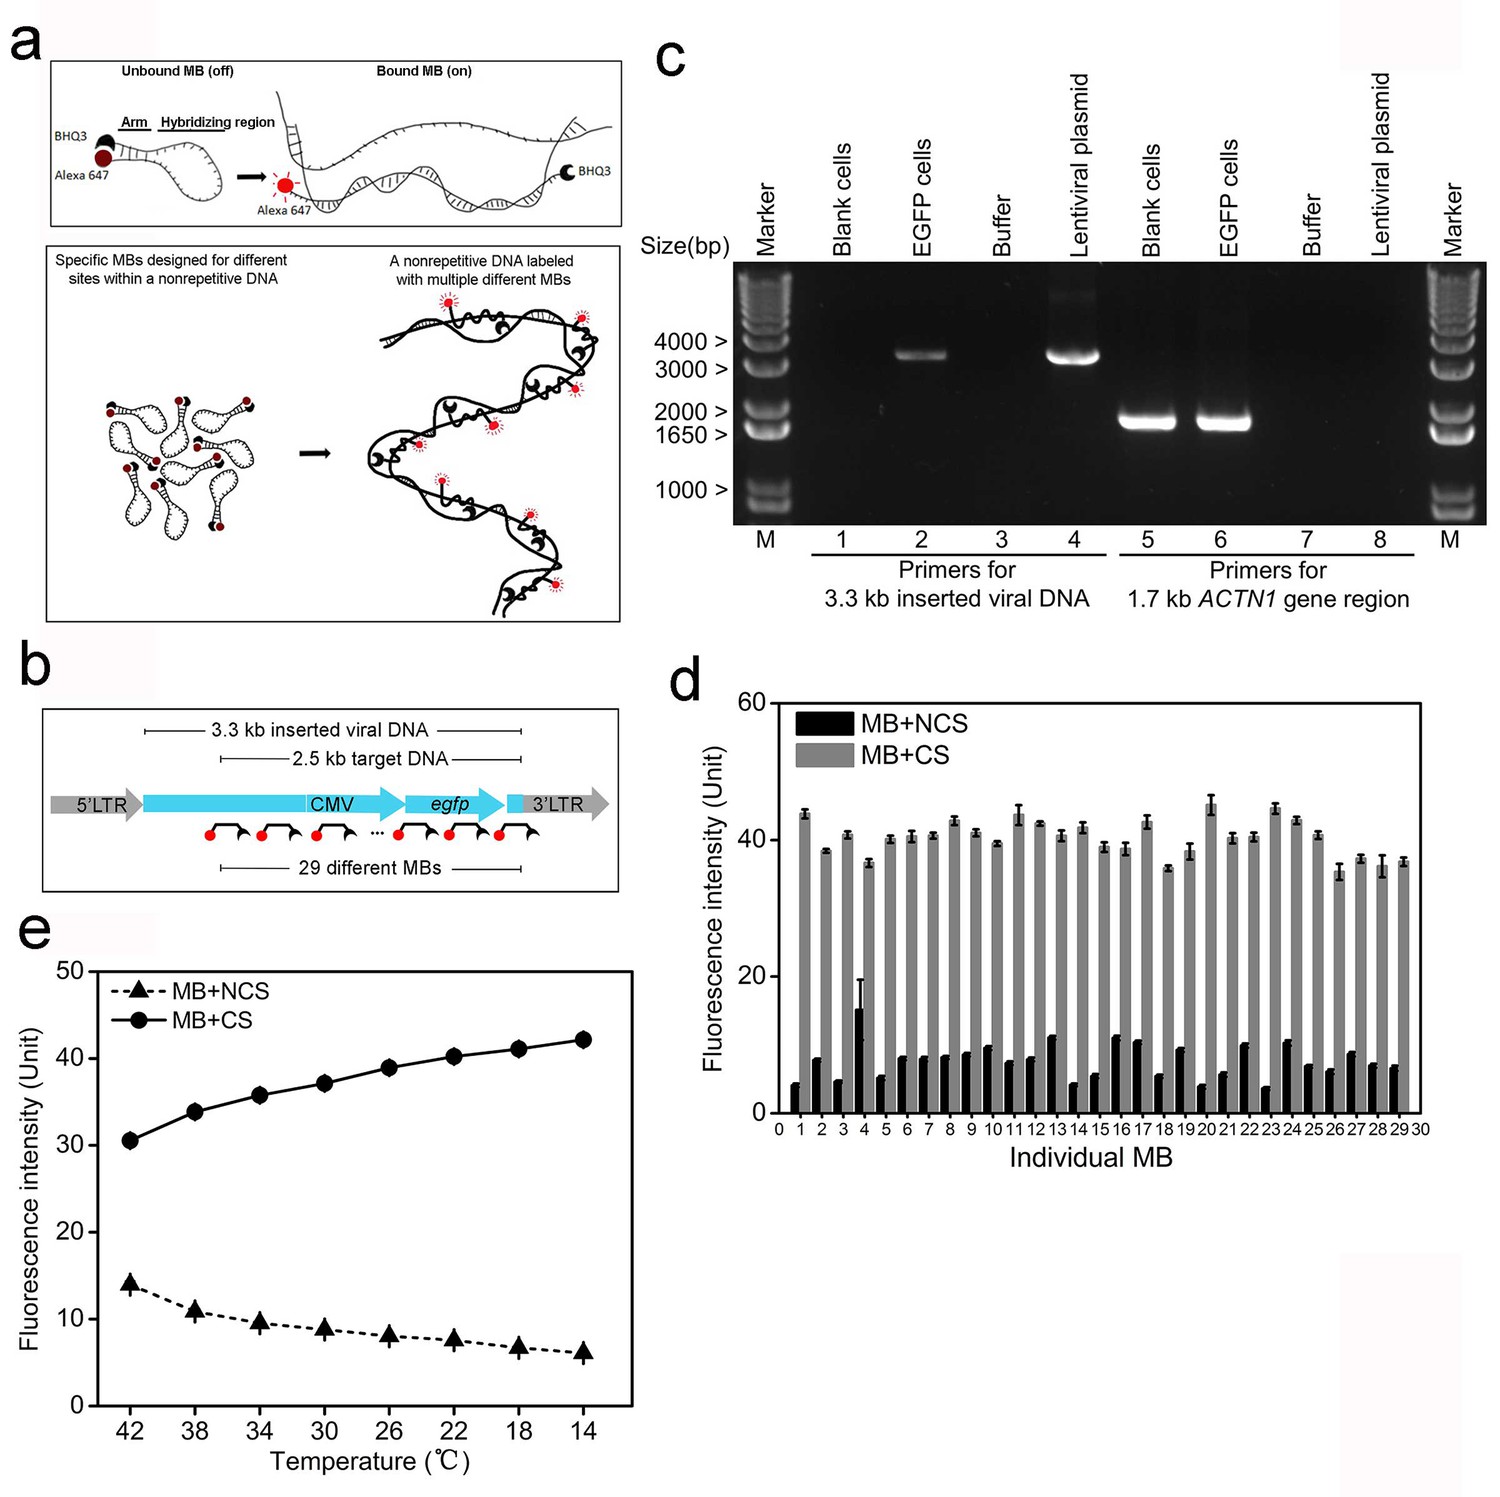
(a) Schematic illustration of the MB design for minimizing fluorescence of unbound/non-specifically bound probes. Alexa-647 and BHQ3 was conjugated to MB at 5’ and 3’ ends, respectively. Two short arms flanking the 42 bp hybridizing region are complementary and will bind to each other in the absence of a complementary sequence (CS) forming a hairpin structure that quenches the fluorescence (top). The set of MB probes were designed to tile along the non-repetitive target DNA in the nuclear genome and fluoresce only upon in situ hybridization to the target, which minimizes non-specific fluorescence (bottom). (b) Schematic illustration of the integrated viral DNA with the target in the inserted region. A 3.3 kb non-repetitive lentiviral region (blue) between 5’ and 3’ LTRs was randomly inserted into the human genome by viral infection. The target DNA was a 2.5 kb sequence containing a CMV promoter and an egfp gene within the 3.3 kb inserted region, which was then labeled with the 29 specific MB probes. Each MB is shown as broken-line with red dot (dye) and black crescent (quencher). (c) PCR confirmation of lentiviral integration in the human genome. Using primers targeting the 3.3 kb inserted lentiviral regions (lanes 1–4), a 3.3 kb electrophoretic band was amplified from the lentiviral plasmid (lane 4) and genomic DNA of EGFP cells (lane 2), but not from blank controls (lane 1) or PCR mixture without any template (lane 3). Using primers targeting a 1.7 kb portion of human ACTN1 gene (lanes 5–8), a 1.7 kb PCR product was amplified from genomic DNA of both cells (lanes 5 and 6). Lane Marker: different-sized (bp) DNA ladder bands are shown on the left of gel picture. (d) Fluorescence spectrophotometry measurements of 29 individual MB probes (numbered 1–29 in the x-axis) in FISH hybridization buffer with excessive amounts of the corresponding CS (gray bars) or NCSs (black bars) at room temperature. Representative results are shown from three independent experiments. Error bars, SEM. CS: complementary sequence, NCSs: non-complementary sequences. (e) Fluorescence spectrophotometry measurements of 29 individual MB probes in the FISH hybridization buffer with excessive amounts of the corresponding CS (solid line with circles) or NCSs (dashed lines with triangles) at different temperatures. Averaged fluorescence readings of the whole probe set are presented for each temperature decreasing from 42°C to 14°C (x-axis). Representative results are shown from three independent experiments. Error bars, SEM. CS: complementary sequence, NCSs: non-complementary sequences.
-
Figure 1—source data 1
Design of 29 specific MBs (Viral_MBs) for labeling the 2.5 kb integrated lentiviral target sequence.
Design of 29 Viral_MBs are shown in the table. Each Viral_MB was a 56-nt oligonucleotide composed of a 42-nt hybridizing region (upper-case) and two 7-nt flanking arms (lower-case). The hybridizing region melting temperature (hybridizing region Tm) was the temperature at which the hybridizing region dissociated from the complementary target sequence in the genome (denoted as sense/antisense stand as +/-). The arm melting temperature (arm Tm) was the temperature at which the two flanking arms dissociated from each other. The melting temperature (Tm) values were obtained from DINAMelt’s online ‘Quickfold Prediction’ tool. All MB sequences were BLASTed against the human genome and transcripts, and the maximum identical sequence was restrained to 22 nt.
- https://doi.org/10.7554/eLife.21660.003
-
Figure 1—source data 2
Source data for 1d and e.
Fluorescence spectrophotometry measurements of 29 individual Viral_MB probes in FISH hybridization buffer with excessive amounts of the corresponding CS or NCSs at room temperature or averaged reading of the whole probe set at different temperature (42°C to 14°C).
- https://doi.org/10.7554/eLife.21660.004
Figure 1—figure supplement 1
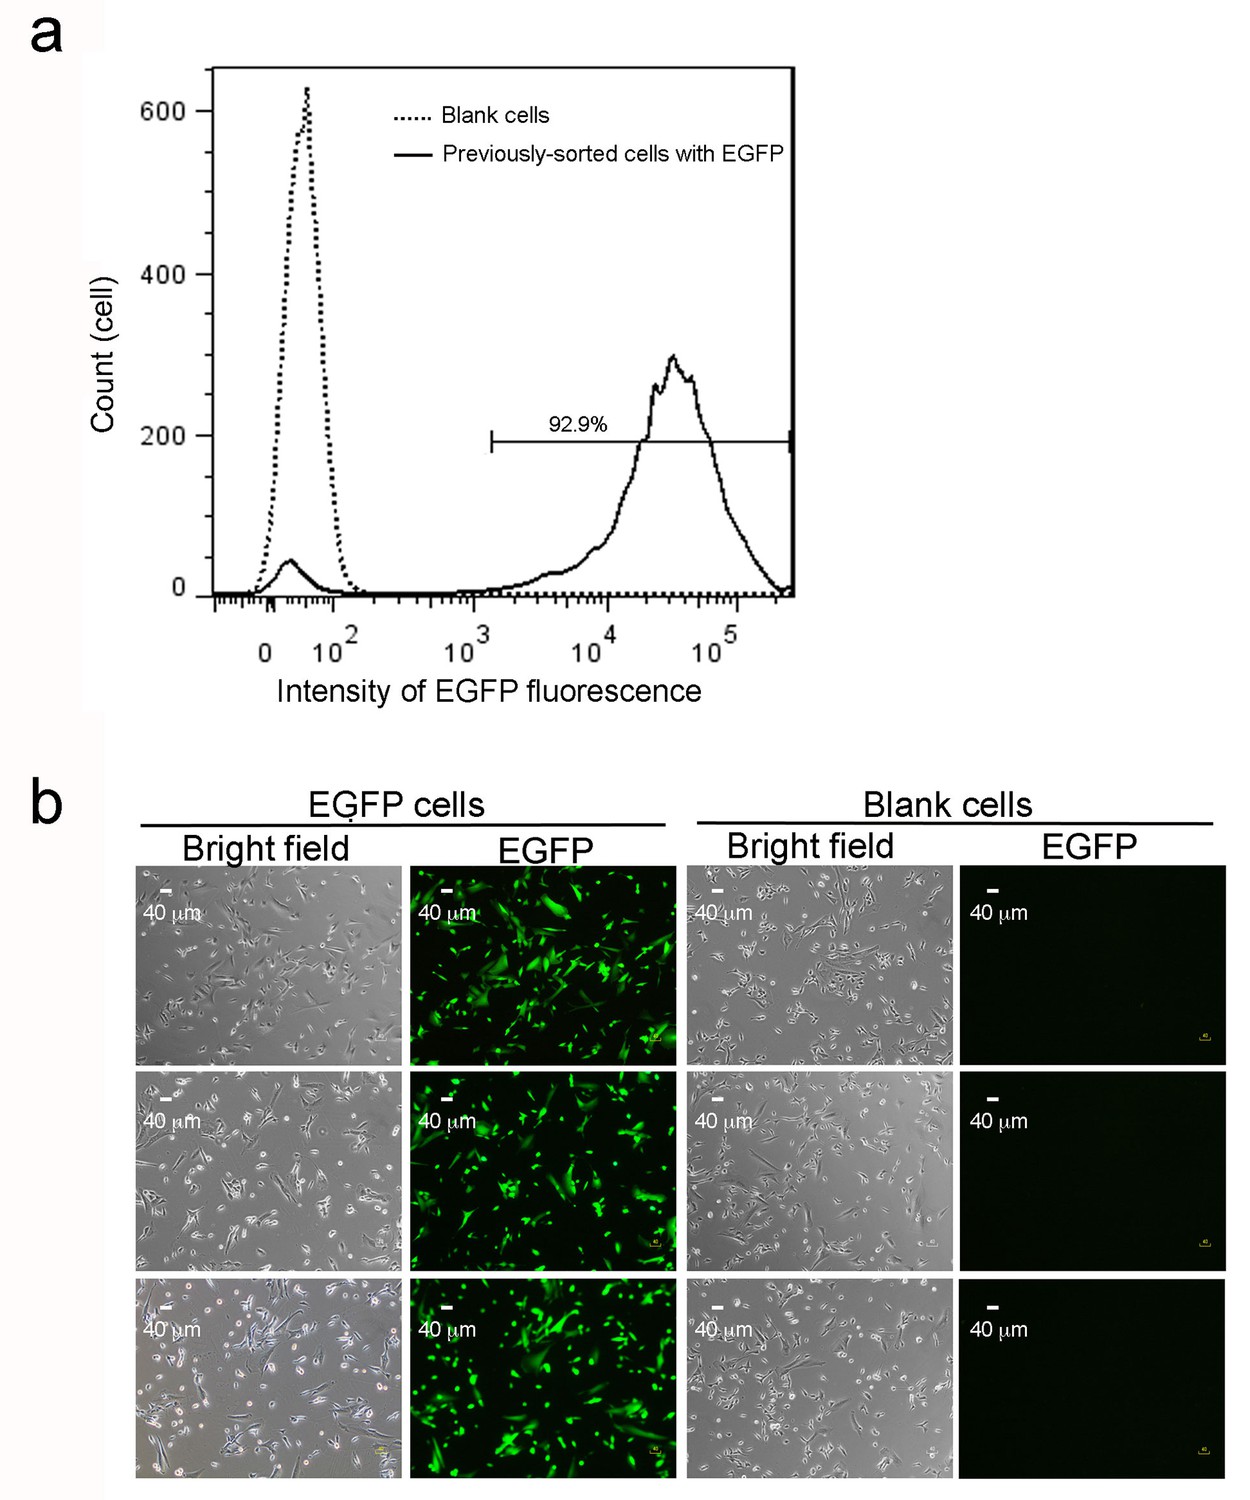
EGFP expression in sorted cells after multiple culture passages.
(a) Flow cytometry analysis of 14,370 previously sorted EGFP cells after eight further culture passages. The solid line with two peaks indicate a major population (right peak) with maintained EGFP expression and a minor fraction (left peak) with lower fluorescence intensity. The dotted line reveals a single peak from 11,816 blank cells, which confirms the left peak (solid line) as a small fraction of cells losing EGFP expression. (b) EGFP cells were sorted by fluorescence cytometry 4 days after lentiviral infection and after eight further culture passages. Blank (non-infected) cells, sorted transfectants on coverslips, or EGFP before fixation were imaged under bright field. Scale bars are 40 μm. Three representative images are shown for each collection. 2. PCR confirmation of no tandem repeats of lentiviral integration in a single inserted locus in EGFP cells.
Figure 1—figure supplement 2
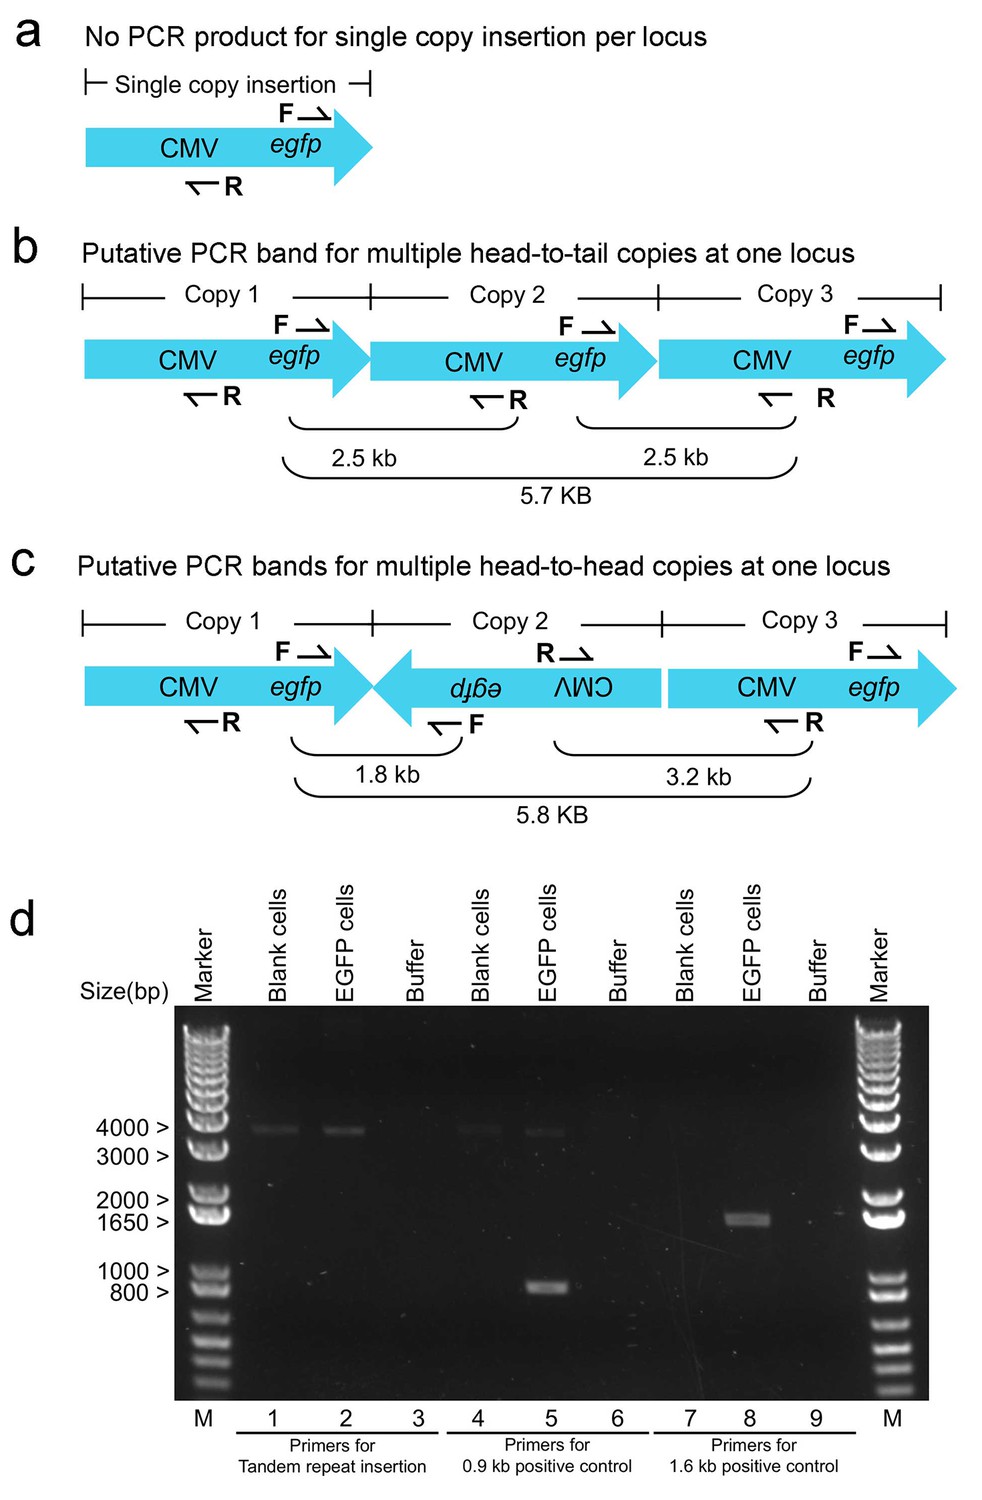
PCR confirmation of no tandem repeats of lentiviral integration in a single inserted locus in EGFP cells.
(a) Schematic illustration of single-copy inserted viral DNA and a pair of upstream reverse (R) and downstream forward (F) primers used to detect tandem repeats insertion. (b,c) Multiple PCR bands could be amplified if there exists two or more copies inserted at the same site in a head-to-tail (b) or head-to-head fashion (c). PCR confirmed no tandem viral copies inserted at the same site. Using a pair of upstream reverse (R) and downstream forward (F) primers targeting tandem viral copies (lanes 1–3), no specific PCR bands were amplified from genomic DNA of EGFP cells (lane 2) or blank controls (lane 1). Pairing the downstream forward (F) primer with a downstream reverse primer (lane 4–6), a 0.9 kb PCR band was specifically amplified from genomic DNA of EGFP cells (lane 5) but not from blank controls (lane 4). Pairing the upstream reverse (R) primers with an upstream forward primer (lane 7–9), a 1.6 kb PCR band was specifically amplified from genomic DNA of EGFP cells (lane 8) but not from blank controls (lane 7). Lane Marker: the different sized (bp) DNA ladder bands are shown on the left of gel picture.
Figure 1—figure supplement 3
Sequence of inserted viral DNA with 29 sites for specific MB probes (Viral_MBs) within the 2.5 kb target region.
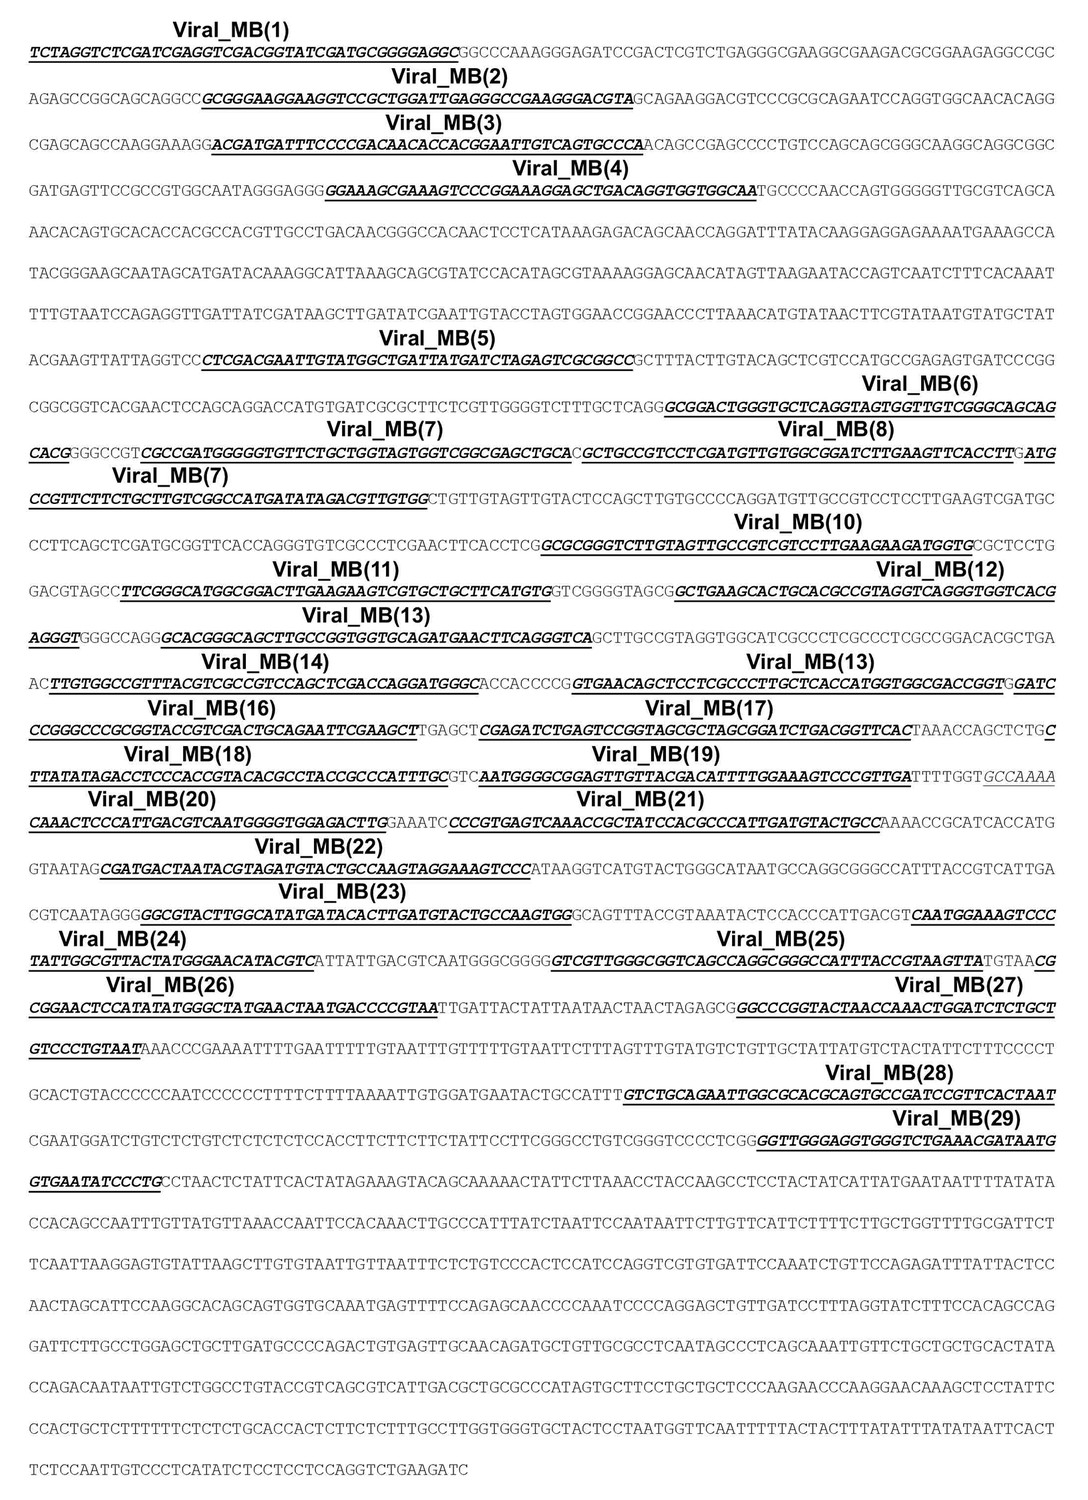
Antisense strand of the 3.3 kb inserted viral DNA are shown as 100 bp per line. The 29 underlined sequences represented the specific binding sites for 29 specific Viral_MBs covering the 2.5 kb target region.
Figure 2

Optimized STORM imaging conditions allow efficient identification of Alexa-647 from the background cellular autofluorescence.
(a,b) Nuclei of fixed SK-N-SH cells were sparsely labeled with Alexa-647-conjugated 10T or 10T controls (input concentration of 200 pM) via non-specific association between oligonucleotide and the nuclear genome at low temperature (4°C). Randomly selected fields were imaged in standard imaging buffer (pH 8.0) using 3D-STORM under the indicated conditions for 180 s. (a) Representative STORM images show switching events (green dots) within a 14 µm x 14 µm nuclear area excited under condition XII (left panel). The middle and right panels are the zoomed views of the two white boxed regions (1 and 2) in the left panel, respectively. The green dots show the fitted position of each event. Each cluster of green dots indicates multiple events collected during the whole imaging process, probably contributed by a single dye. The pseudo-color (green) is used to visualize the dots. (b) Event number per unit area (event number/µm2) is shown as a bar, representing the results from Alexa-647-conjugated 10T (color) or control (white) samples. Power density of the 641 nm or 405 nm laser is shown below each bar. False discovery rate (FDR) calculated as the ratio of event number per µm2 from controls to that from cells treated with Alexa-647-conjugated 10T is shown at the bottom. (*) indicates the condition with lowest FDR value. Representative results are shown from three independent experiments. Error bars, SEM. Control, 10T; Alexa-647, Alexa-647-conjugated 10T. (c) Cell samples were labeled with Alexa-647-conjugated 10T or 10T controls (input concentration of 200 pM) and imaged in a modified buffer containing half concentrations of glucose oxidase and catalase (GLOX) at a relatively low pH of 7.5. Conditions VII-VIII at 60 Hz and XI-XII at 85 Hz were used in the assessments. (*) indicates the condition with lowest FDR value. (d) Event numbers detected per 5 s (Figure 2b) under experimental conditions IX to XII at 85 Hz were calculated and normalized to the first time slot. The plot shows the trend during the entire image series. Error bars, SEM. (e,f) Cell samples were labeled with Alexa-647-conjugated 10T or 10T controls (input concentration of 80 pM) and imaged by optimized or unoptimized STORM (conditions I and XII in Figure 2b, respectively). (e) Event numbers per unit area (event number/µm2) are shown as gray and white bars, representing data collected under optimized and unoptimized conditions, respectively. Representative results are shown from three independent experiments. Error bars, SEM. ***p<0.001; t test. (f) Representative STORM images showing switching events (green dots) in 10 µm x 10 µm nuclear areas excited under optimized (top) or unoptimized (bottom) conditions. The green dots indicate the fitted position of each event. Each cluster of green dots indicates multiple events during the whole imaging process, probably contributed by a single dye. The pseudo-color (green) is used to visualize the dots. (g) Cell samples were labeled with Alexa-647-conjugated 10T or 10T controls at 200 pM or 2 nM input concentration and imaged by optimized (gray) or unoptimized (white) STORM (Conditions I or XII in Figure 2b, respectively). Event numbers per unit area (event number/µm2) from Alexa-647-labeled cells were subtracted from controls (data not shown) and are represented as bars. Representative results are shown from three independent experiments. Error bars, SEM. ***p<0.001; t test.
-
Figure 2—source data 1
Source data for 2b, c, d, e and g.
Event number per unit area (event number/µm2) obtained under different STORM imaging conditions in 2b, c, d, e and g.
- https://doi.org/10.7554/eLife.21660.009
Figure 3
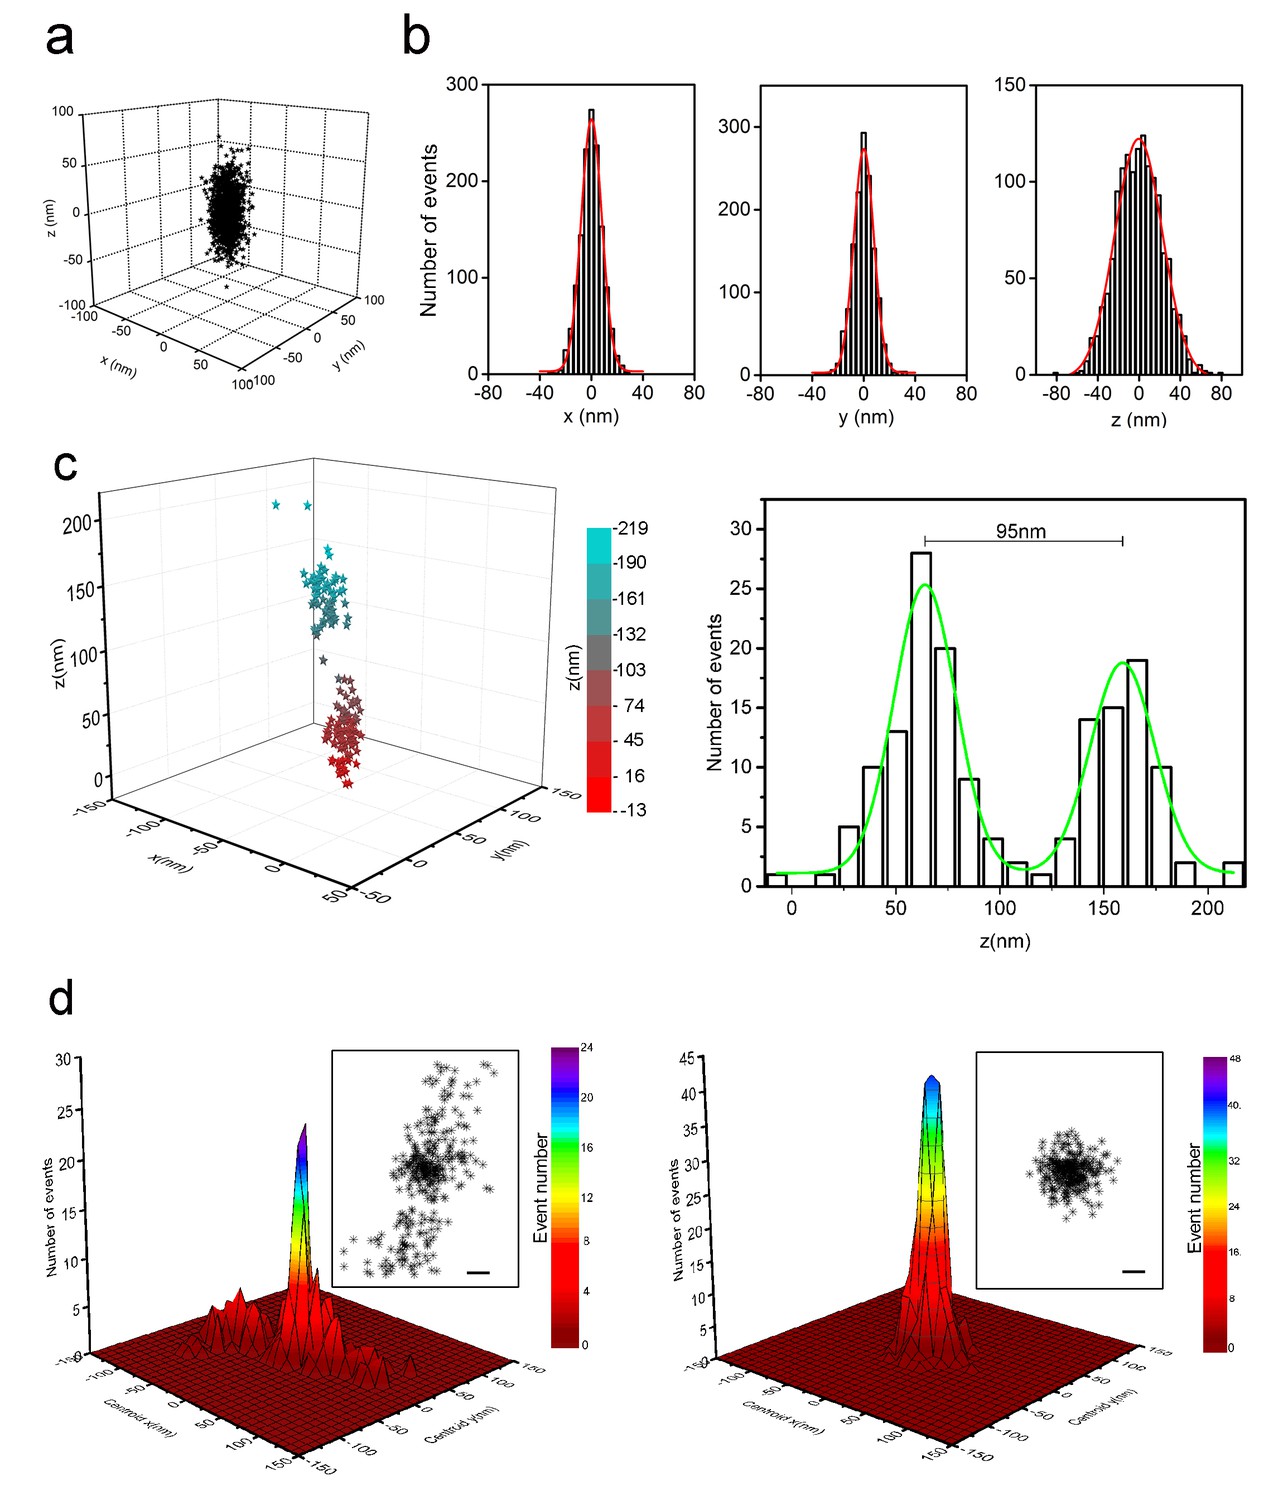
Localization precision of 3D-STORM for sparsely distributed Alexa-647 in cells with refined optical setup.
(a) 3D distribution of localizations from individual Alexa-647 fluorophores in fixed SK-N-SH cells under optimized conditions. Cells were sparsely labeled with Alexa-647 molecules (input concentration of 80–200 pM). Each Alexa-647 fluorophore contributed a cluster of localizations from a series of fluorescent/dark switching cycles. The 1378 localizations from 53 clusters were aligned by their centroid positions to generate the overall 3D presentation of the distribution of localizations. (b) Histograms of the 1378 localizations were fitted to a Gaussian function yielding standard deviations of 9 nm in x, 9 nm in y, and 22 nm in z axes. The corresponding FWHM values were 22 nm in x, 22 nm in y, and 52 nm in z axes. (c) Two neighboring clusters of 160 localizations from cells sparsely labeled with Alexa-647. The 3D distribution of localizations is represented as color-coded z-axis information (left, −13 nm to 219 nm). The histogram shows the z coordinate distribution of these localizations fitted into two Gaussian curves with a separation of 95 nm between the two peaks (green curve, right). (d) Localization precision of the STORM imaging before (left) and after (right) stage drift correction in cells with sparsely distributed Alexa-647, which shows 492 localizations collected from 23 fluorophores that blinked more than 10 times during the entire imaging process. Their lateral positions were realigned so that the average centroid position was at the origin. The main plots show histograms of these centroid positions. The overall distribution of all localizations is shown in the insets. Scale bars are 20 nm. The drift-corrected distribution (right) became significantly narrow compared to the uncorrected distribution (left).
Figure 4
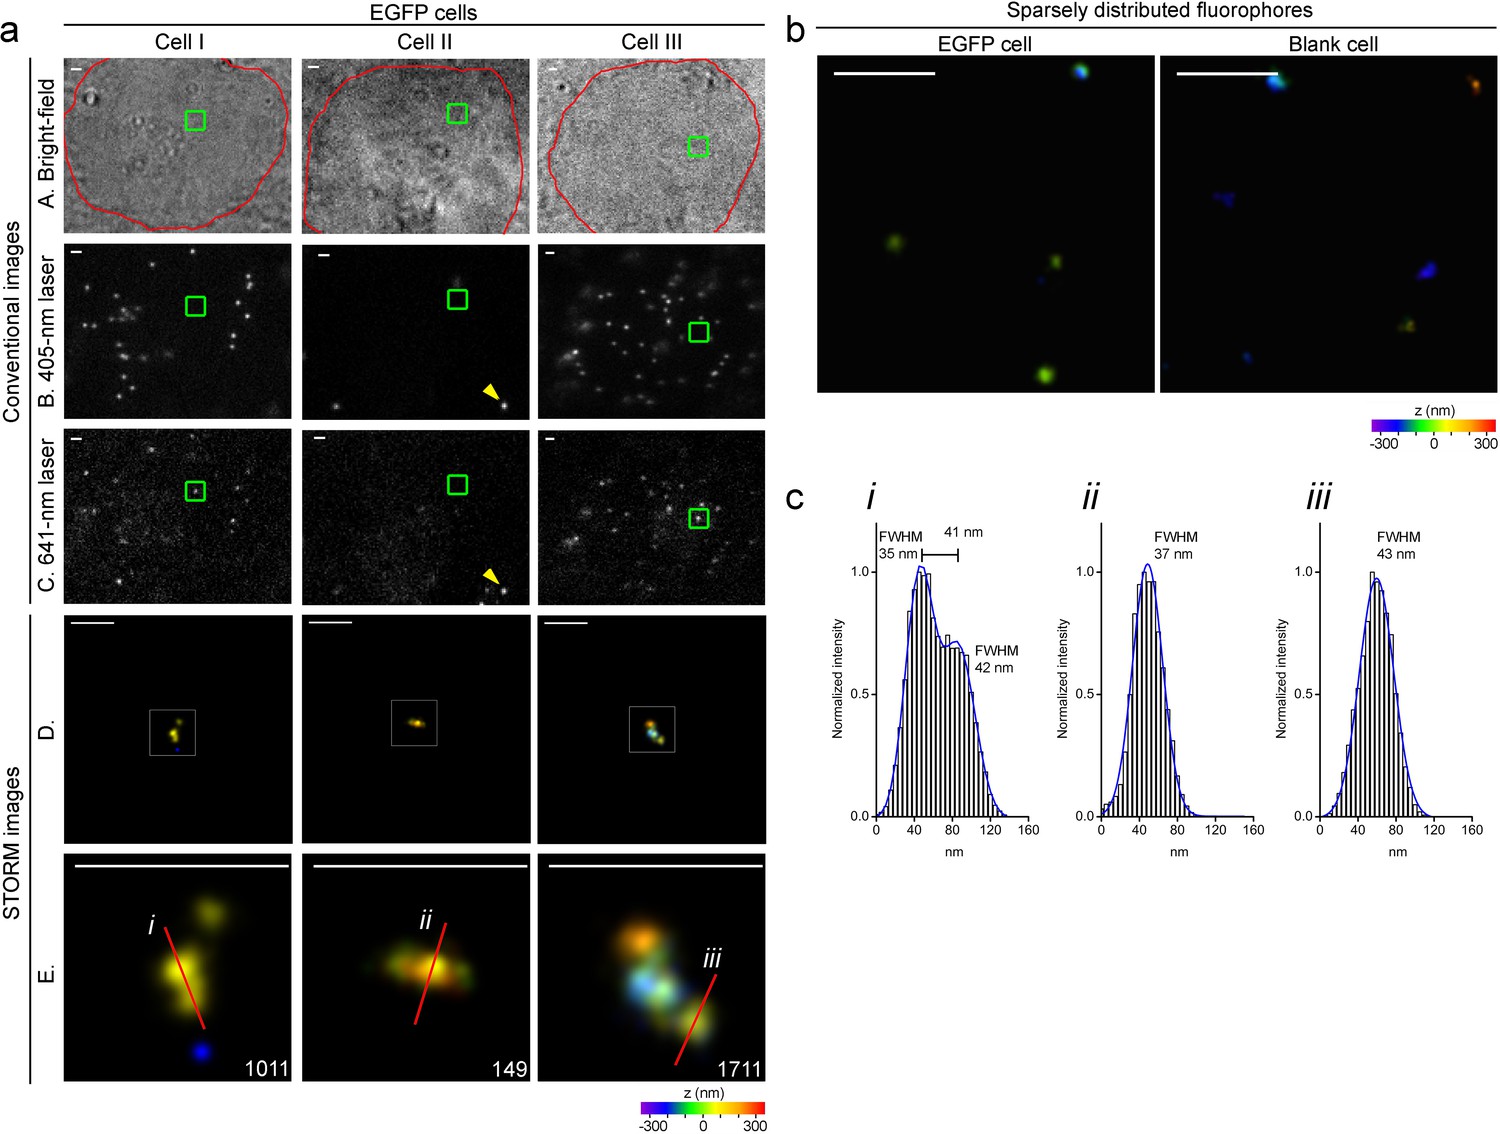
Specific nanostructures of the 2.5 kb integrated DNA labeled with MBs in situ in the human genome.
(a) Representative specific nanostructures of MB-labeled 2.5 kb integrated lentiviral DNA in EGFP cells (Cell I to III). The conventional view of nuclear region in bright field (outlined in red) or excitation by 405 nm or 641 nm laser are shown in top three rows (rows A, B, and C), respectively. The nanostructures were identified from the drift corrected STORM images corresponding to the green box region in conventional images) (row D). Zoomed views of the white boxed regions in row D reveal more detailed morphology of the detected 3D structures (bottom row), and the localization number of each nanostructure is shown in the lower-right corner. Each localization number represents the detected times of the Alexa-647 fluorophores labeled on DNA during the entire imaging process. STORM images are shown as rainbow color-coded z-axis information (color bar at the bottom, −350 to 350 nm). A representative fluorescent bead that emits under both 405 nm and 641 nm laser excitation is highlighted by yellow arrows in panel B and C of Cell II. Scale bars are 1 μm in top three rows and 300 nm in bottom two rows. (b) Representative discrete signals observed in the STORM images of MB-labeled EGFP (left) or blank (right) cell nuclei, possibly from unbound/non-specific probes. The STORM images are shown after drift-correction with rainbow color-coded z-axis information (color bar at the bottom, −350 to 350 nm). Scale bars are 300 nm. (c) Histograms of the normalized number of counts detected (Normalized intensity) along the cross-sections defined by the red lines (i-iii) of the STORM images in (a). Values of FWHM indicate the features above each structure along the transverse positions with 1D Gaussian fit.
Figure 5 with 4 supplements
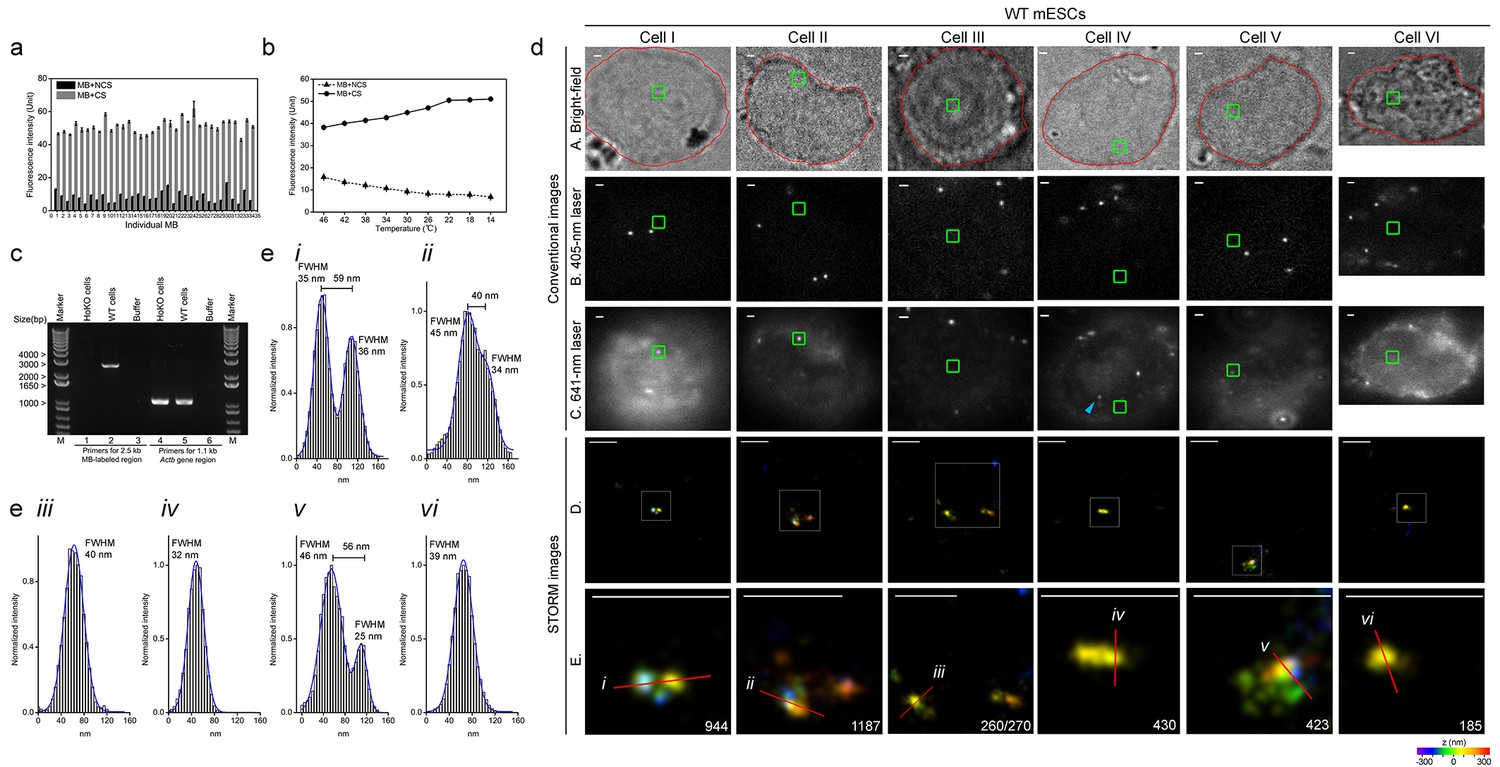
Specific nanostructures of 2.5 kb MB-labeled Nanog enhancer in mESC nuclei.
(a) Fluorescence spectrophotometry measurements of 34 individual Nanog_MB probes (numbered 1–34 in the x-axis) in FISH hybridization buffer with excessive amounts of the corresponding CS (gray bars) or NCSs (black bars) at room temperature. Representative results show the inhibition of non-specific fluorescence was 15.8 ± 5.9% compared to the fluorescence reading in the presence of CS. Error bars, SEM. CS: complementary sequence, NCSs: non-complementary sequences. (b) Fluorescence spectrophotometry measurements of 34 individual Nanog_MB probes in the FISH hybridization buffer with excessive amounts of the corresponding CS (solid line with circles) or NCSs (dashed lines with triangles) at different temperatures. Averaged fluorescence readings of the whole probe set are presented for each temperature decreasing from 46°C to 14°C (x-axis). Representative results are shown from three independent experiments. Error bars, SEM. CS: complementary sequence, NCSs: non-complementary sequences. (c) PCR confirmation of homozygous knockout of MB-labeled Nanog enhancer from both alleles. Using primers targeting the endogenous 2.5 kb Nanog_MBs target region (lanes 1–3), a 2.5 kb electrophoretic band was amplified from genomic DNA of WT mESCs (lane 2) but not from HoKO mESCs (lane 1) or PCR mixture without any template (lane 3). Using primers targeting a 1.1 kb portion of mouse Actb gene (lane 4–6), a 1.1 kb PCR product was amplified from genomic DNA in both cells (lane 4 and 5). Lane Marker: the different sized (bp) DNA ladder bands are shown on the left of gel picture. (d) Representative specific nanostructures of MB-labeled 2.5 kb endogenous enhancer in Nanog locus in CJ9 mESCs (Cell I to VI). The conventional view of a cellular region in bright field (outlined in red) or excited by 405 nm or 641 nm lasers are shown in the top three rows (rows A, B, and C), respectively. The nanostructures were identified from the drift corrected STORM images corresponding to the green box region in conventional images (row D). Zoomed views of the white boxed regions in row D reveal more detailed morphology of the detected 3D structures (bottom row) with the localization number of each nanostructure shown in the lower-right corner. Each localization number represents the detected times of the Alexa-647 fluorophores labeled on DNA during the entire imaging process. STORM images are shown with rainbow color-coded z-axis information (color bar at the bottom, −350 to 350 nm). Three representative fluorescent dots visible under 641 nm laser excitation but not identified as specific nanostructures in STORM reconstruction are highlighted by blue arrows in panel C of Cell III. Scale bars are 1 μm in top three rows and 300 nm in bottom two rows. (e) Histograms of the normalized number of counts detected (Normalized intensity) along the cross-sections defined by the red lines (i–vi) in the STORM images in (d). Values of FWHM indicate the features above each structure along the transverse positions with 1D Gaussian fit.
-
Figure 5—source data 1
Design of 34 specific MBs (Nanog_MBs) for labeling the 2.5 kb Nanog enhancer in Nanog locus in mESC nuclei.
Design of 34 Nanog_MBs is shown in the table. Each Nanog_MB was a 56-nt oligonucleotide composed of a 42-nt hybridizing region (upper-cased) and two 7-nt flanking arms (lower-cased). The hybridizing region melting temperature (hybridizing region Tm) was the temperature at which the hybridizing region dissociated from the complementary target sequence in the genome (denoted as sense/antisense stand as +/-). The arm melting temperature (arm Tm) was the temperature at which the two flanking arms dissociated from each other. The melting temperature (Tm) values were obtained from DINAMelt’s online ‘Quickfold Prediction’ tool. All MB sequences were BLASTed against the mouse genome and transcripts, and the maximum identical sequence was restrained to 25 nt.
- https://doi.org/10.7554/eLife.21660.013
-
Figure 5—source data 2
Source data for 5a and b.
Fluorescence spectrophotometry measurements of 34 individual Nanog_MB probes in FISH hybridization buffer with excessive amounts of the corresponding CS or NCSs at room temperature or averaged reading of the whole probe set at different temperature (46°C to 14°C).
- https://doi.org/10.7554/eLife.21660.014
Figure 5—figure supplement 1
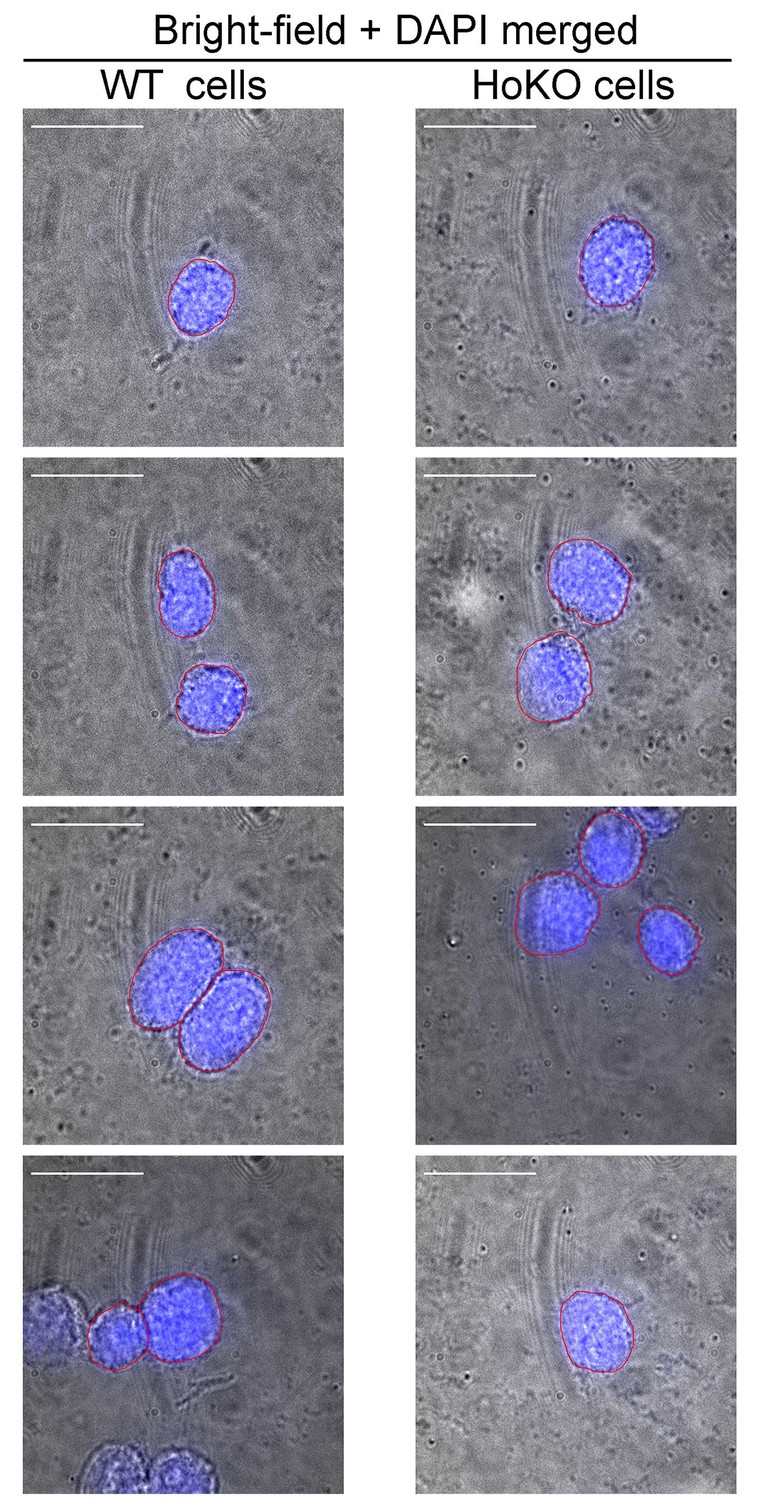
Identification of nuclear periphery of mESCs by conventional co-imaging using bright field and DAPI staining.
WT and HoKO ESC samples, similarly prepared to those used in the STORM imaging, were mounted in medium containing DAPI and imaged under bright field and 405 nm laser excitation. Representative merged images of bright field and DAPI in the same field of WT (left panel) or HoKO (right panel) cells show the nuclear peripheries visualized from DAPI staining were very close to cell surface (outlined in red). Scale bars are 20 μm.
Figure 5—figure supplement 2
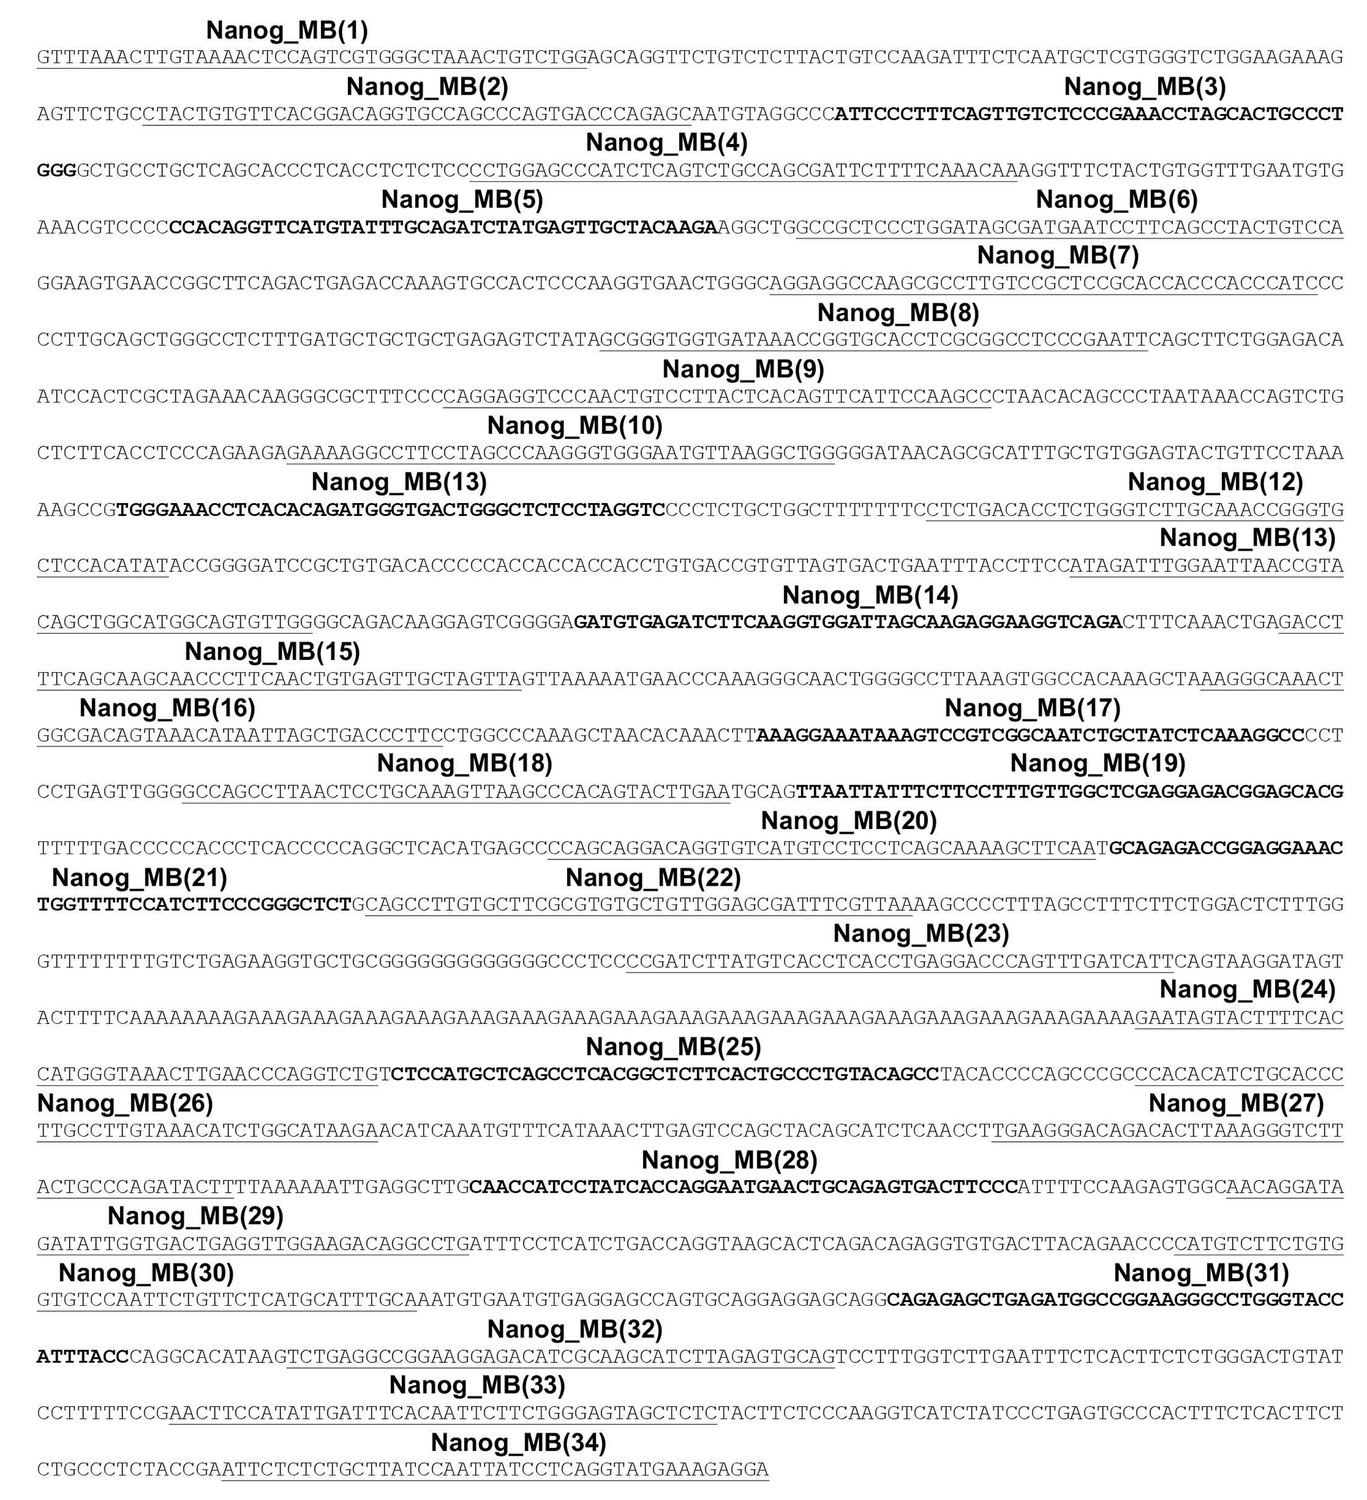
Sequence of endogenous DNA with 34 sites for specific MB probes (Nanog_MBs) within the 2.5 kb target region.
Sense strand sequence of the 2.5 kb endogenous DNA in Nanog locus (Chr6: 122612623–122615179, mm9) are shown as 100 bp per line. The 24 underlined sequences represented the hybridizing region sequences for 24 specific Nanog_MBs, which were designed to bind to the antisense strand of the genome. The 10 bolded sequences represent the specific binding sites for 10 specific Nanog_MBs.
Figure 5—figure supplement 3
Sequence information of allele identified in homozygous knockout (HoKO) ESC clone.
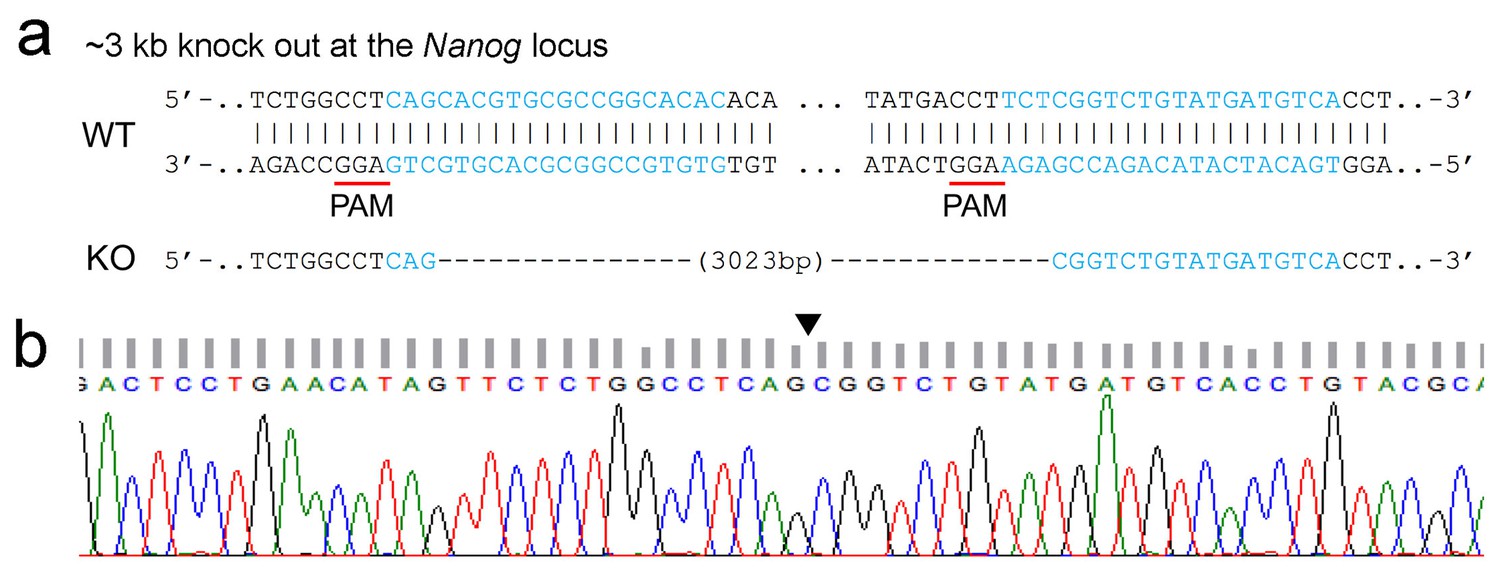
(a) The genomic sequences of wild-type (WT) and the expected Nanog enhancer knockout (KO) ESCs are displayed at the upper panel. Targeting sites of the sgRNA pair are highlighted in blue and the corresponding PAM sites are underlined. The target deletion of Nanog enhancer (Chr6: 122612568–122615591, 3023 bp, mm9) was shown as dashes. (b) The chromatogram data of genome region flanking the target deletion is shown at the bottom panel with the blank triangle pointing out the precise target excision in the genome of HoKO ESCs.
Figure 5—figure supplement 4
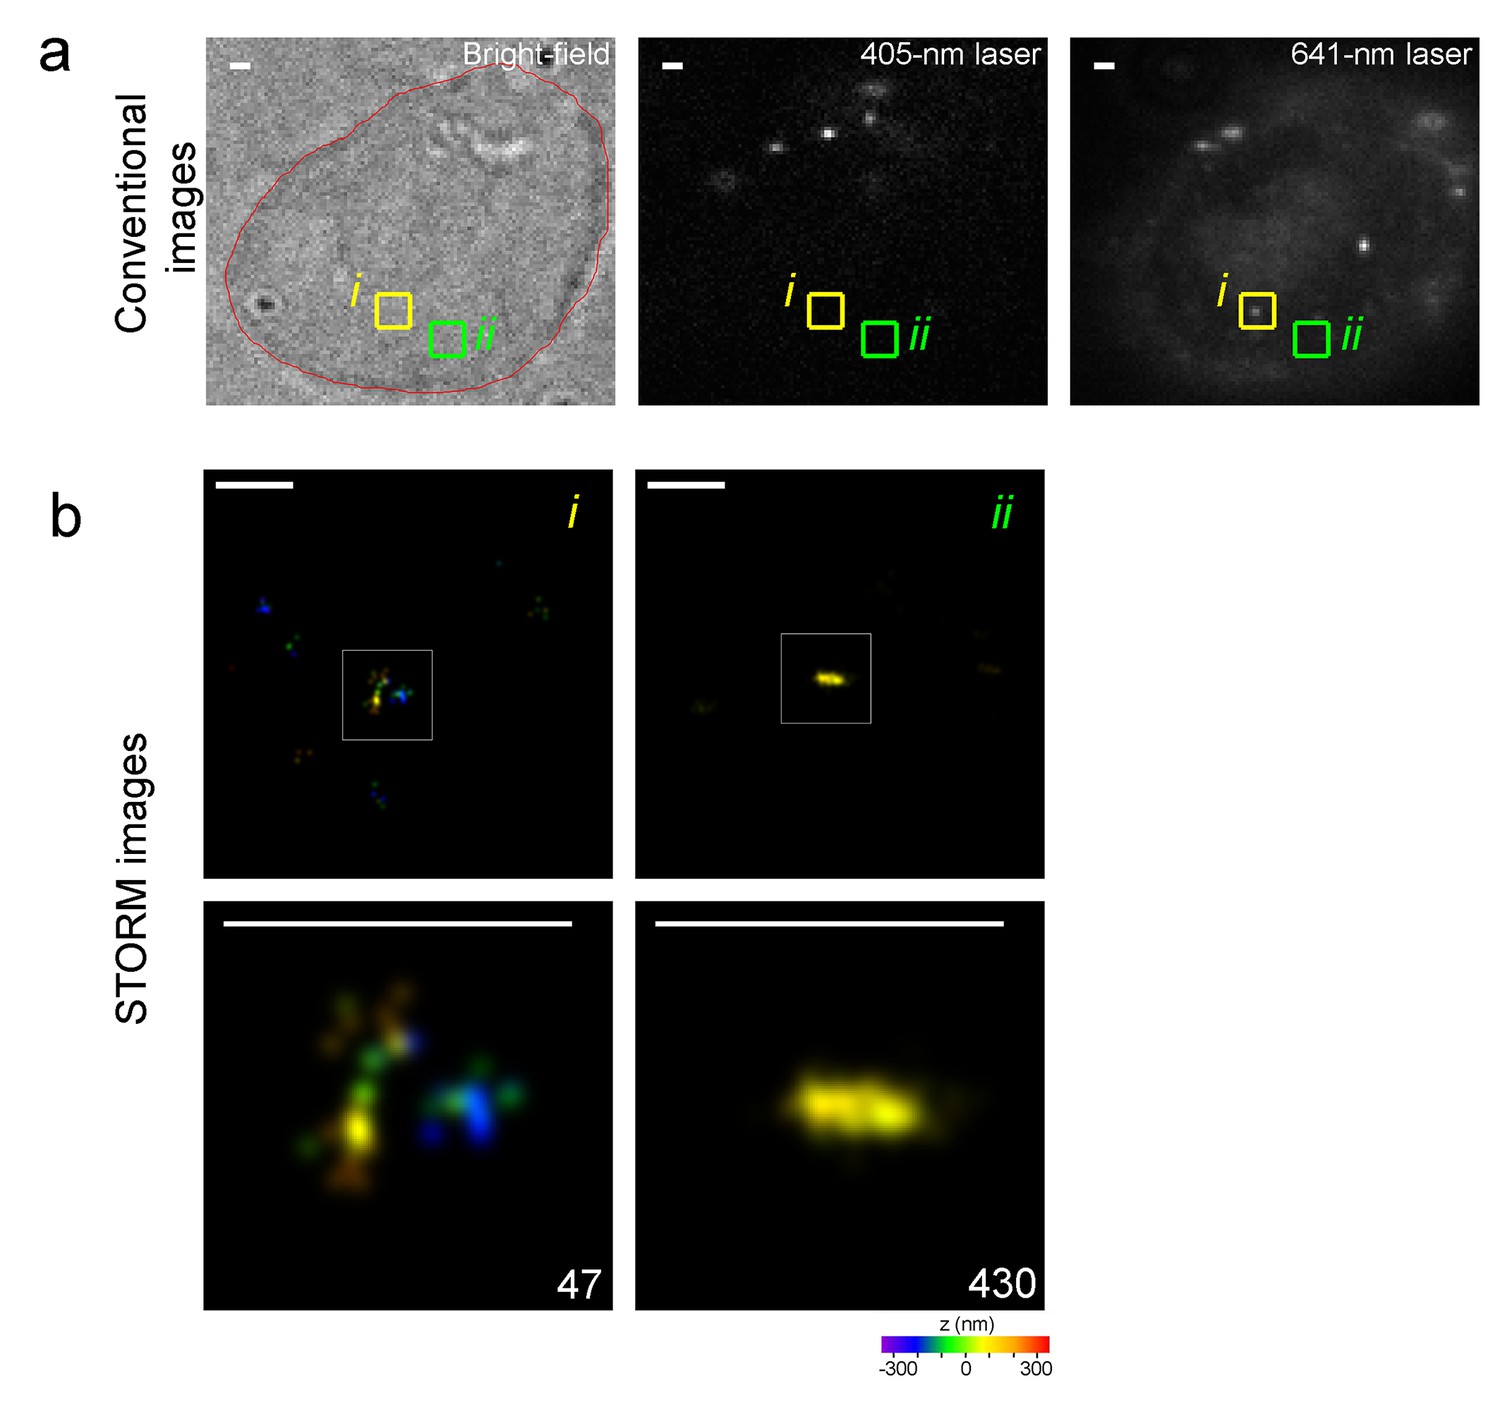
A representative of identified nanostructure or excluded fluorescence noise and their corresponding appearances in 641 nm conventional imaging.
(a) Cellular views of bright-field or 405 nm or 641 nm conventional imaging are presented from left to right, respectively. It is the 4th cell from Figure 5d with red line indicating cellular outline. The boxes showed two different regions with dotted (i) or no obviously recognizable (ii) structure in 641-conventional imaging. (b) Reconstructed STORM images of regions corresponding to yellow (i) or green (ii) box in (a) are shown as upper row, and zoomed-in views present in lower row with localization number shown in the lower-right corner. Discontinuous clusters with extremely low number of localizations is observed in the yellow box(i) whereas continuous fine-scale nanostructure is identified in the green box (ii). STORM images are presented as rainbow color-coded z-axis information (color bar at the bottom, −350 to 350 nm). Scale bars in (a) and (b) are 1 μm and 300 nm, respectively.
Download links
A two-part list of links to download the article, or parts of the article, in various formats.
Downloads (link to download the article as PDF)
Open citations (links to open the citations from this article in various online reference manager services)
Cite this article (links to download the citations from this article in formats compatible with various reference manager tools)
Super-resolution imaging of a 2.5 kb non-repetitive DNA in situ in the nuclear genome using molecular beacon probes
eLife 6:e21660.
https://doi.org/10.7554/eLife.21660


