AMPK and vacuole-associated Atg14p orchestrate μ-lipophagy for energy production and long-term survival under glucose starvation
- Howard Hughes Medical Institute, United States
- National Institutes of Health, United States
- University of California, San Francisco, United States
- Lawrence Berkeley National Laboratory, United States
Figures
Figure 1 with 2 supplements
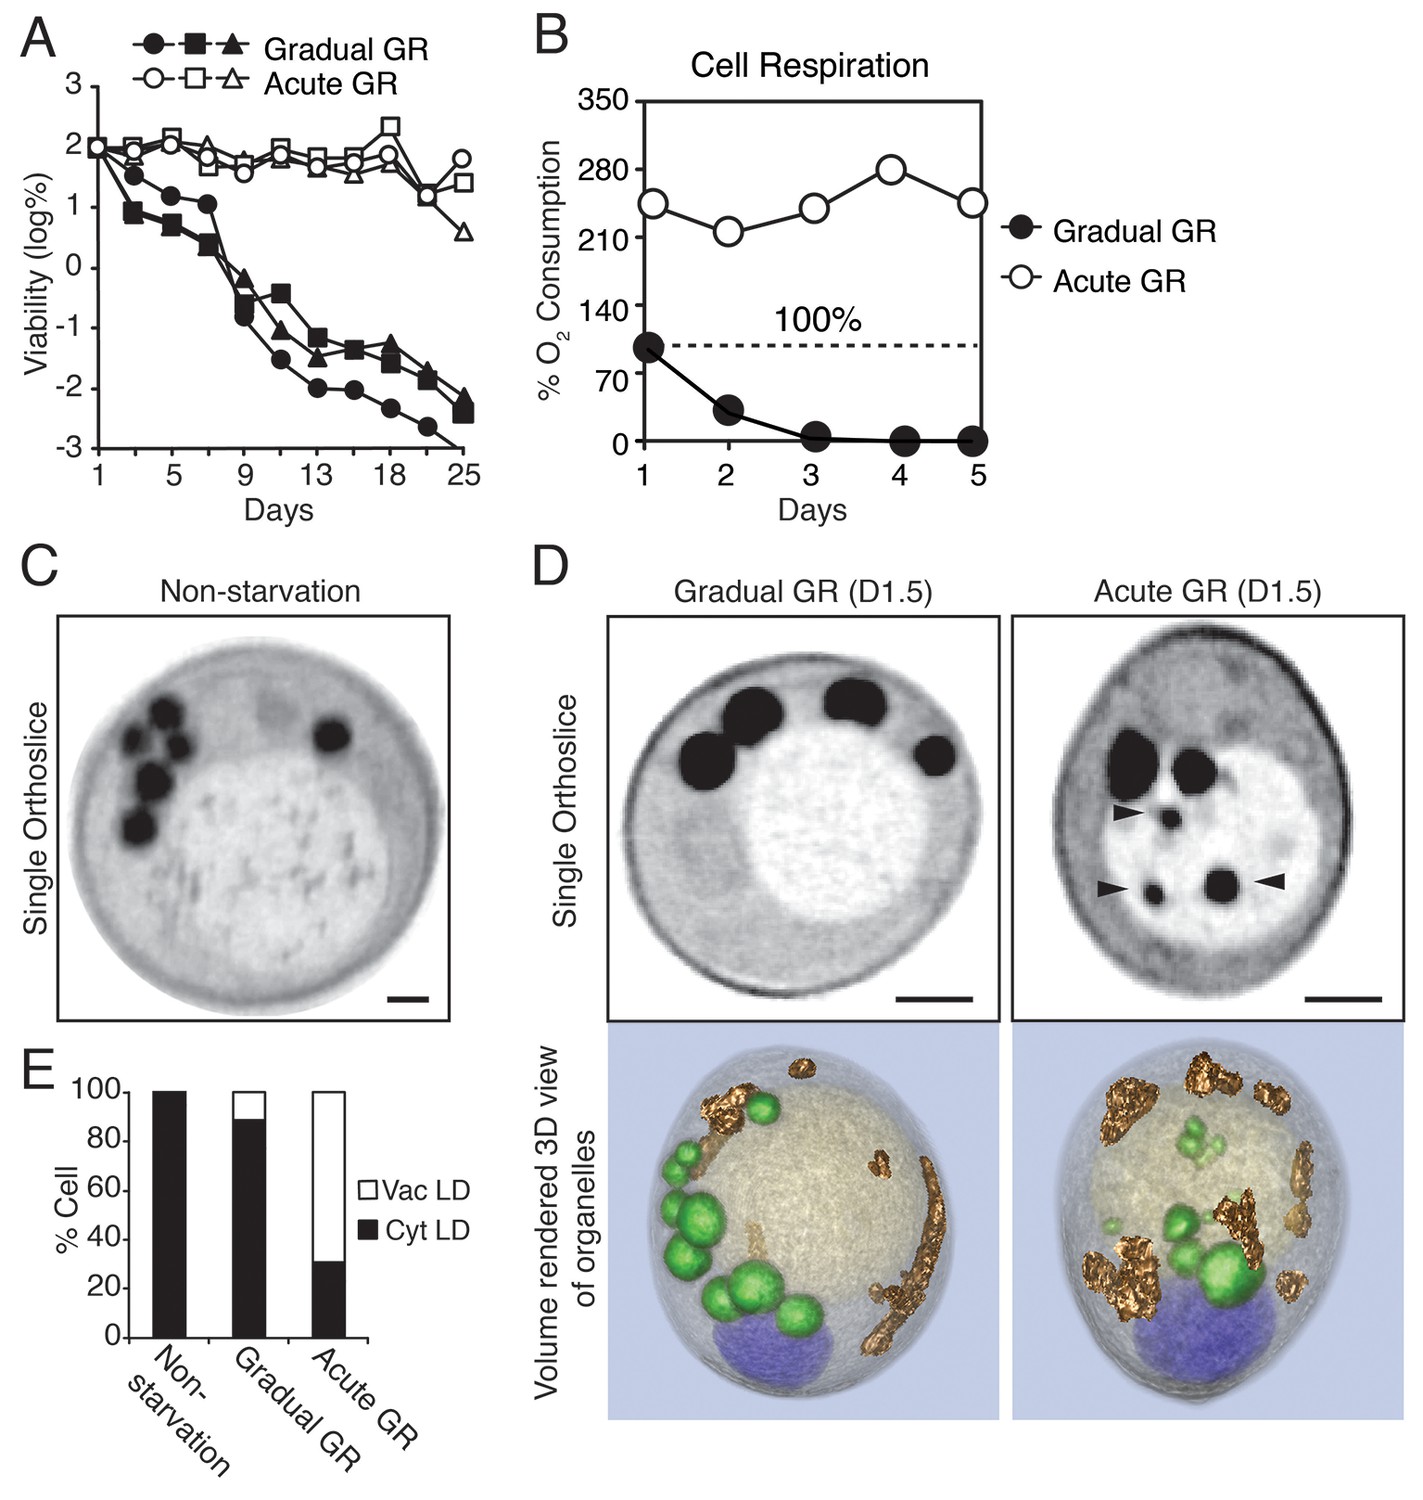
Starvation by acute GR increases cell survival and induces vacuolar LD delivery.
(A) Long-term survival of cells undergoing gradual or acute GR was measured as described in the Materials and methods. Cell survival is plotted as the log of a percentage viable cell number at day 1 (which was set at 100%). Three biologically independent experiments are shown together. (B) Cell respiration was determined during a cell survival experiment described in the Materials and methods. O2 consumption rate is plotted as a percentage of that seen in cells under gradual GR at day 1 (which was set at 100%). (C) Representative SXT orthoslice image of a yeast cell under non-starvation is shown. (D) Representative SXT orthoslice images of yeast cells under day 1.5 (D1.5) of gradual or acute GR are shown. Arrowheads indicate LDs inside the vacuole. Scale bar represents 0.5 μm. Lower panels show full 3D SXT images (LD: green; nucleus: purple; vacuole: pale yellow; mitochondria: gold). (E) Percentage of cells having only cytoplasmic LDs (Cyt LD) or having both Cyt LD and vacuole associated LDs (Vac LD) are shown. Data were analyzed from full 3D tomograms of the SXT images. Approximately 50 cells per each condition were analyzed.
Figure 1—figure supplement 1
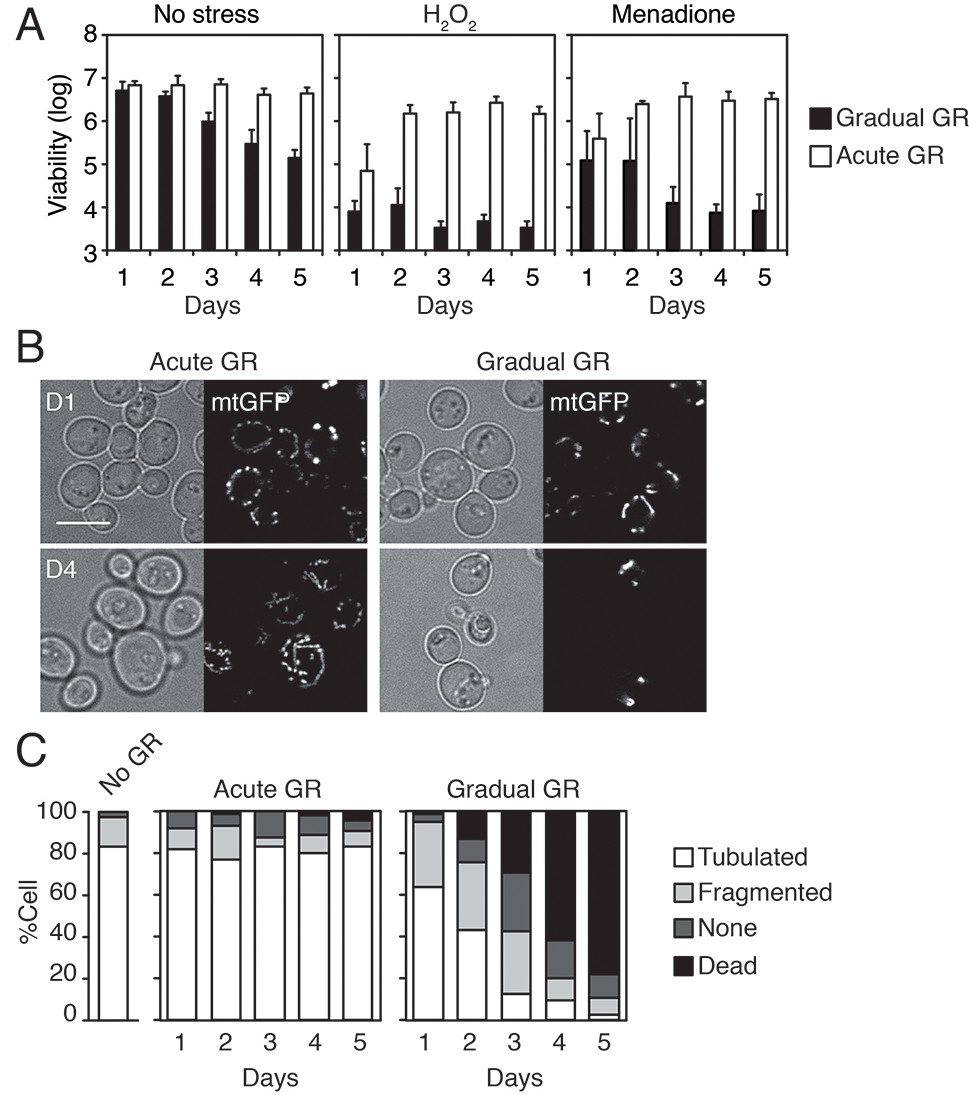
Starvation by acute GR enhances cellular oxidative stress resistance and induces mitochondrial tubulation.
(A) Cells grown under gradual or acute GR were subject to oxidative stress (2.5 mM H2O2 or 30 μM menadione). Cell viability is plotted as a log of viable cell number at the indicated days. Data are expressed as mean ± SD (n = 3). n indicates the number of experimental repetitions. (B) WT cells harboring mitochondrial matrix targeting GFP (mtGFP) grown under acute or gradual GR conditions are shown at day 1 (D1) and day 4 (D4). Scale bar represents 5 μm. (C) Morphologies of mitochondria under no GR, acute GR or gradual GR from D1 to D5 were scored as ‘Tubulated’, ‘Fragmented’, ‘None’ or ‘Dead’ and represented as percentages. Approximately 150 cells per each condition were analyzed.
Figure 1—figure supplement 2
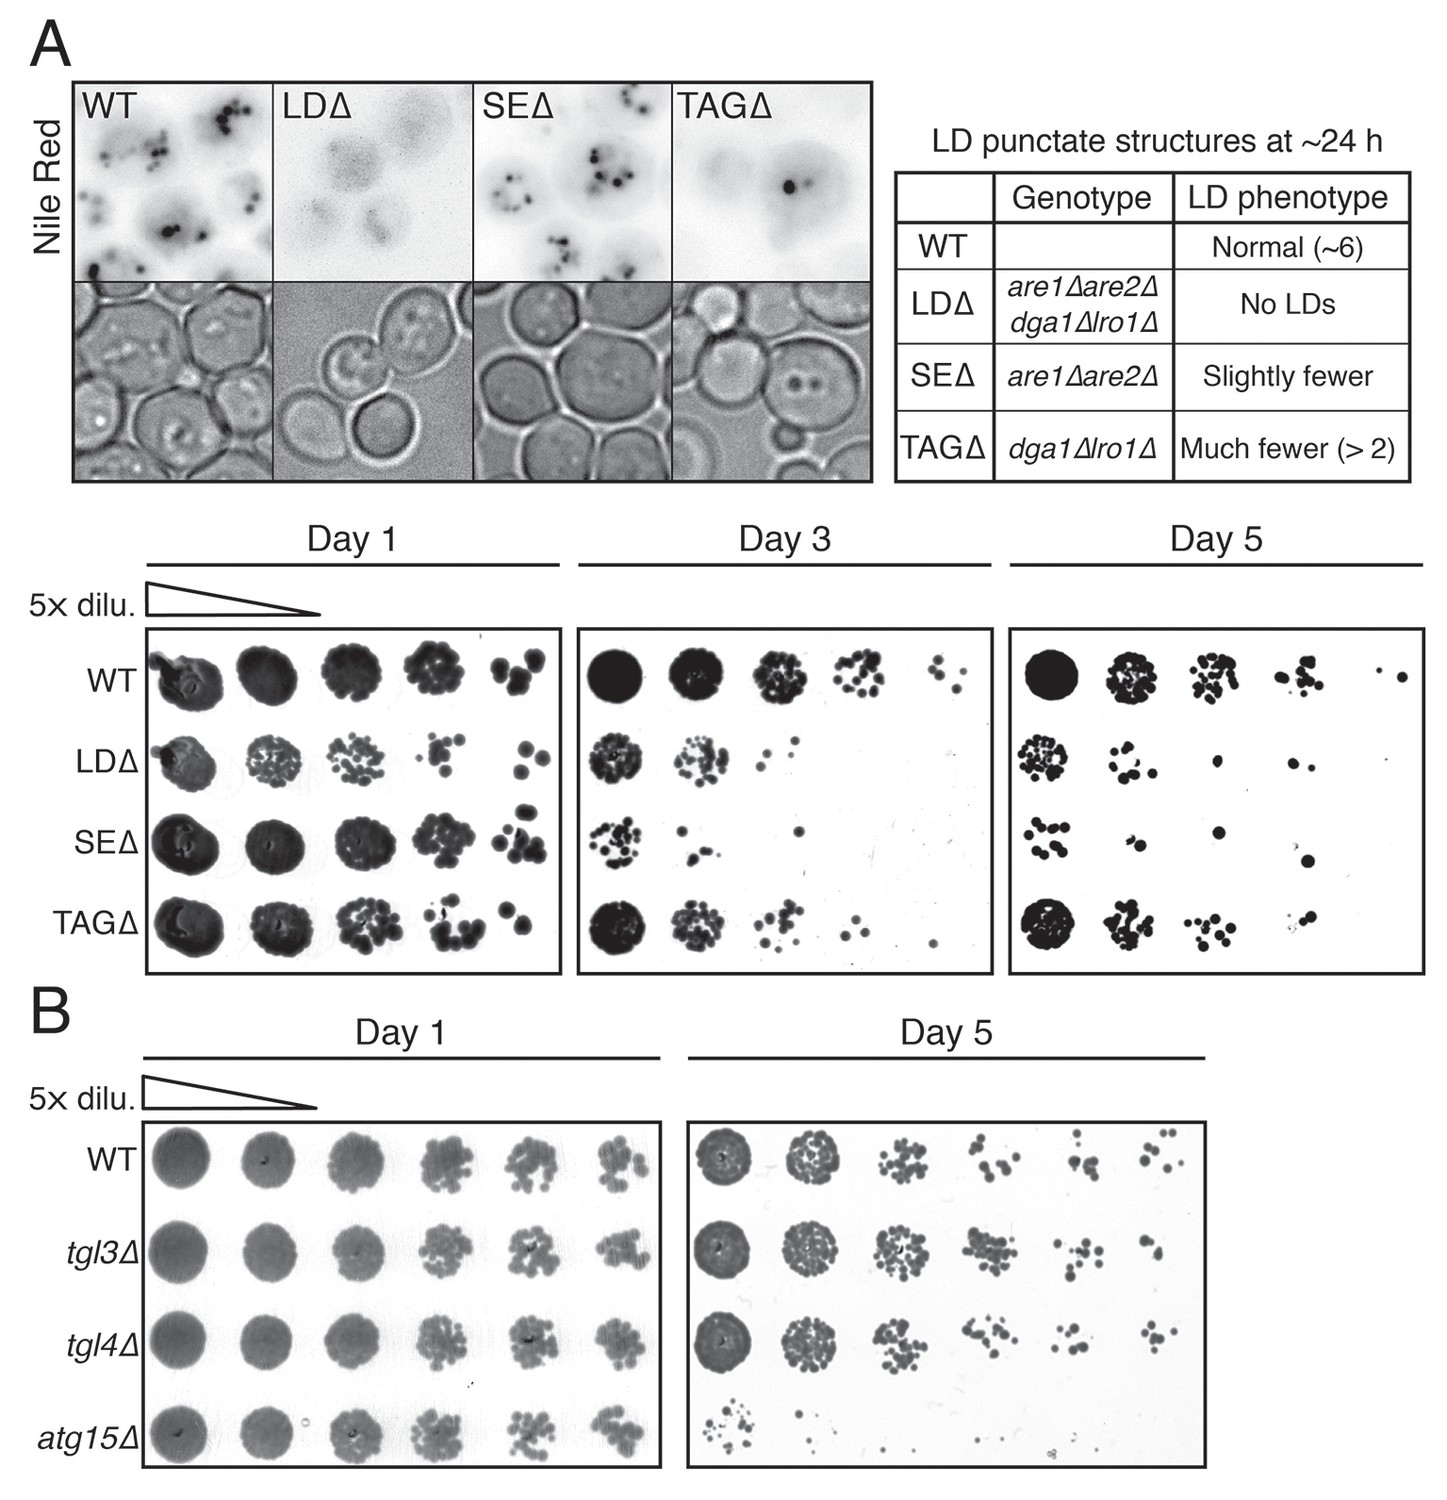
LDs and vacuolar lipase Atg15p are necessary for cell survival during starvation.
(A) Representative LD (Nile red positive structure) images from WT, LD-deficient (LDΔ), steryl ester deficient (SEΔ), and triacylglycerol-deficient (TAGΔ) cells under gradual GR for ~24 hr are shown. Genotype and LD phenotype of the aforementioned cells are summarized in the right panel. In the lower panel, cell survival of the aforementioned cells was determined as described in the Materials and methods. Representative colony images at the indicated days are shown. (B) Cell survival of WT, tgl3Δ, tgl4Δ, and atg15Δ cells under gradual GR was measured as described in the Materials and methods. Representative colony images at day 1 and day 5 are shown.
Figure 2

Under acute GR, cytosolic LDs are engulfed by the vacuole and digested via μ-lipophagy.
(A) Representative SXT orthoslice images of WT, atg1Δ, and atg8Δ cells undergoing acute or gradual GR for day 1.5 (D1.5) are shown. Black arrowheads point to LDs inside the vacuole. Scale bar represents 0.5 μm. (B) Percentage of cells having only cytoplasmic LDs (Cyt LD) or having both Cyt LD and vacuole associated LDs (Vac LD) are shown. Data were analyzed from full 3D tomograms of the SXT images in (A). Approximately 20 cells per each condition were analyzed. (C) LD volume analyzed from full 3D SXT images of WT and atg1Δ cells in (A) is shown as a percentage of that seen in cells undergoing gradual GR (which was set at 100%). Data are expressed as mean ± SD (n = 7 ~ 10). (D) WT and atg1Δ cells expressing Erg6-DsRed (LD marker) were grown under similar conditions in (A) and Erg6p degradation was measured by Western blot analysis. Quantification of Erg6p degradation is shown in the lower panel as ratio of free DsRed to total DsRed (free DsRed + Erg6-DsRed) signals. (E) Representative confocal images of cells in (D) are shown. White arrowheads point to vacuolar localized LD signals. Scale bar represents 5 μm. (F) WT and atg1Δ cells expressing GFP-Atg8 (autophagosome marker) were grown under similar conditions in (A) and Atg8p degradation was measured by Western blot analysis. Quantification of Atg8p degradation is shown in the lower panel as ratio of free GFP to total GFP (free GFP + GFP-Atg8) signals. Data are expressed as mean ± SD (n = 3). n indicates the number of experimental repetitions.
Figure 3 with 1 supplement
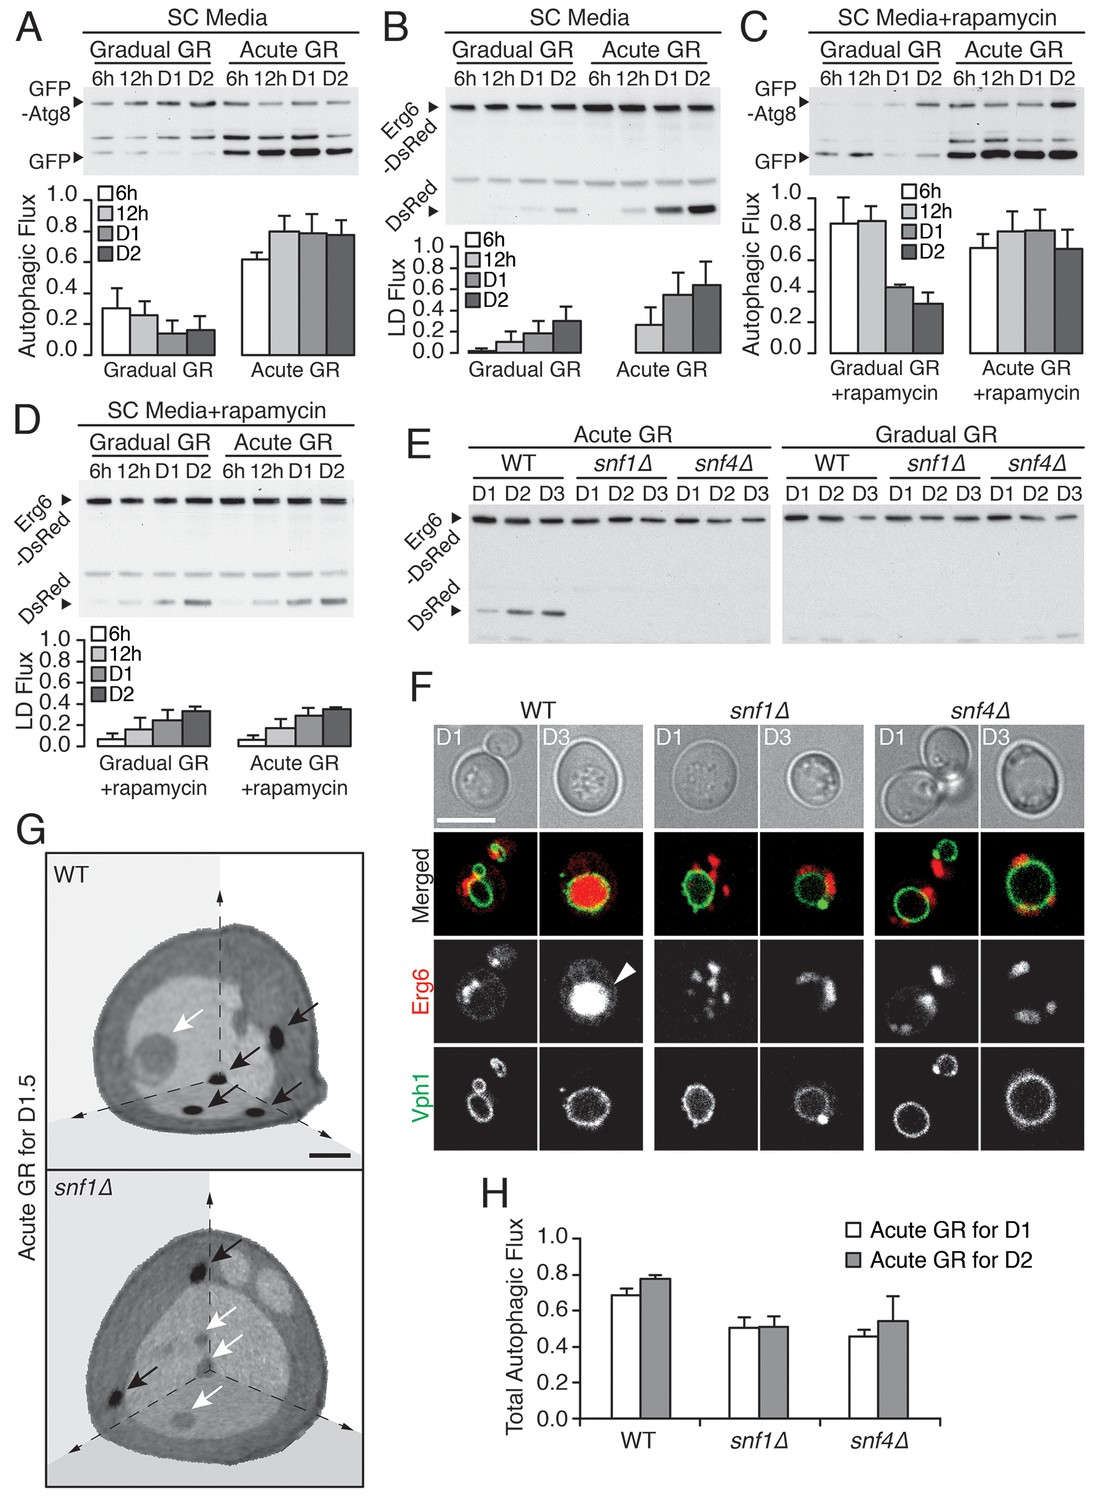
Vacuolar LD consumption is dependent on AMPK and is not induced by rapamycin treatment.
(A) WT cells expressing GFP-Atg8 were placed in synthetic complete (SC) media containing 2% glucose (Gradual GR) or 0.4% glucose (Acute GR). Autophagic flux assay was performed as described in Figure 2F. (B) LD flux assay as described in Figure 2D was performed under similar conditions as in (A). (C) Autophagic flux assay was performed with 50 nM rapamycin under similar conditions as described in (A). (D) LD flux assay was performed with 50 nM rapamycin under similar conditions as described in (B). (E) LD flux assay was performed in WT, snf1Δ, and snf4Δ cells as described in Figure 2D. (F) Representative confocal images of cells in (E) with both Erg6-DsRed and Vph1-GFP (vacuole membrane marker) are shown. White arrowhead points to LD signal localized within the vacuole. Scale bar represents 5 μm. (G) Representative SXT images of WT and snf1Δ cells undergoing acute GR for day 1.5 (D1.5) are shown. Black arrows and white arrows point to LDs and autophagic bodies, respectively. Scale bar represents 1 μm. (H) Quantification of autophagic flux in WT, snf1Δ, and snf4Δ cells is shown as described in Figure 2F. Data are expressed as mean ± SD (n = 3). n indicates the number of experimental repetitions.
Figure 3—figure supplement 1
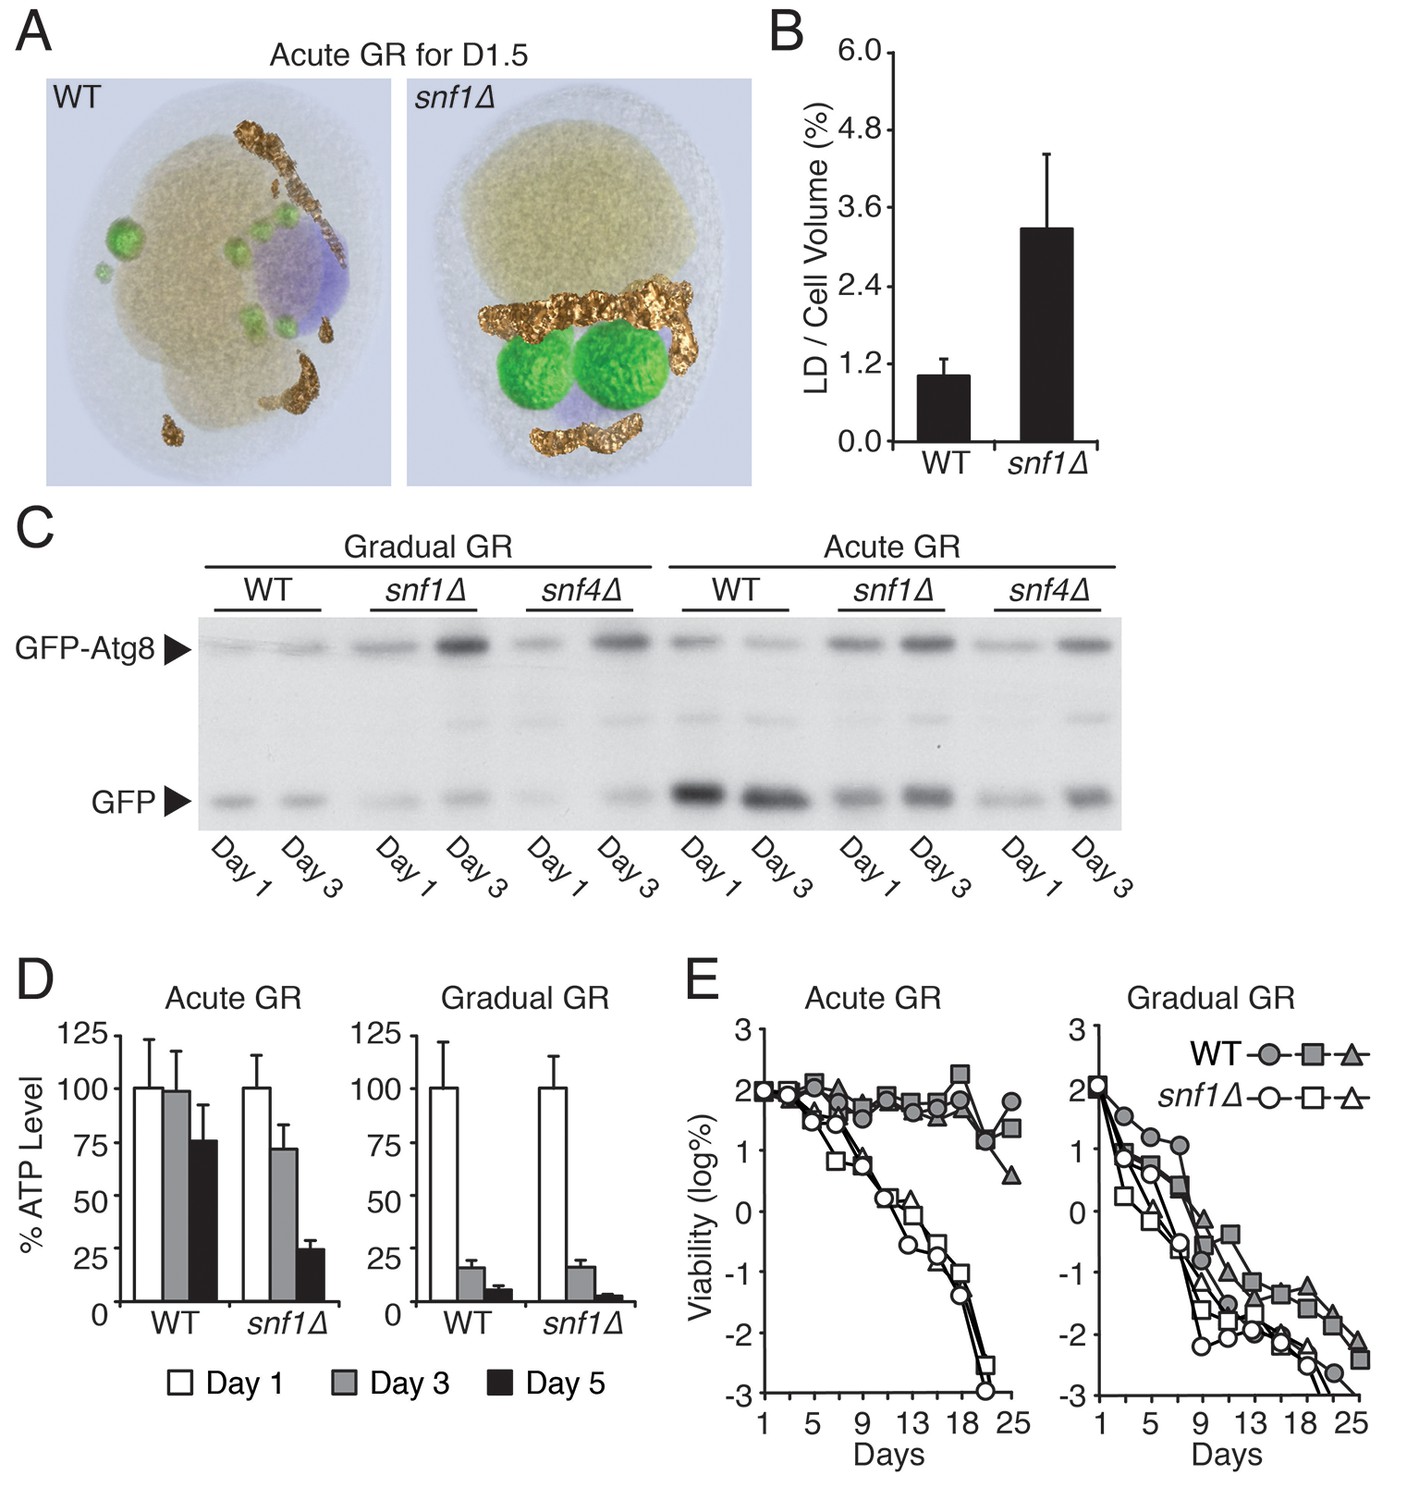
Snf1p is required for vacuolar LD consumption, cellular energy metabolism, and long-term survival during acute GR.
(A) SXT images of WT and snf1Δ cells grown under acute GR for day 1.5 (D1.5) were processed to show individual organelles (LDs: green; nucleus: purple; vacuole: pale yellow; mitochondria: gold). (B) Percentage of total LD volume per cell volume was measured from cells in (A). Data are expressed as mean ± SD (n = 7). (C) Autophagic flux assay was performed in WT, snf1Δ, and snf4Δ cells as described in Figure 2F. Representative blot images are shown. (D) ATP levels of WT and snf1Δ cells undergoing acute or gradual GR were measured as described in the Materials and methods. Cellular ATP levels at day 1 (D1) were set at 100% and presented as percentage at the indicated days. Data are expressed as mean ± SD (n = 3). n indicates the number of experimental repetitions. (E) Cell viability of cells in (A) was determined and presented as described in Figure 1A. Three biologically independent experiments are shown together.
Figure 4 with 2 supplements
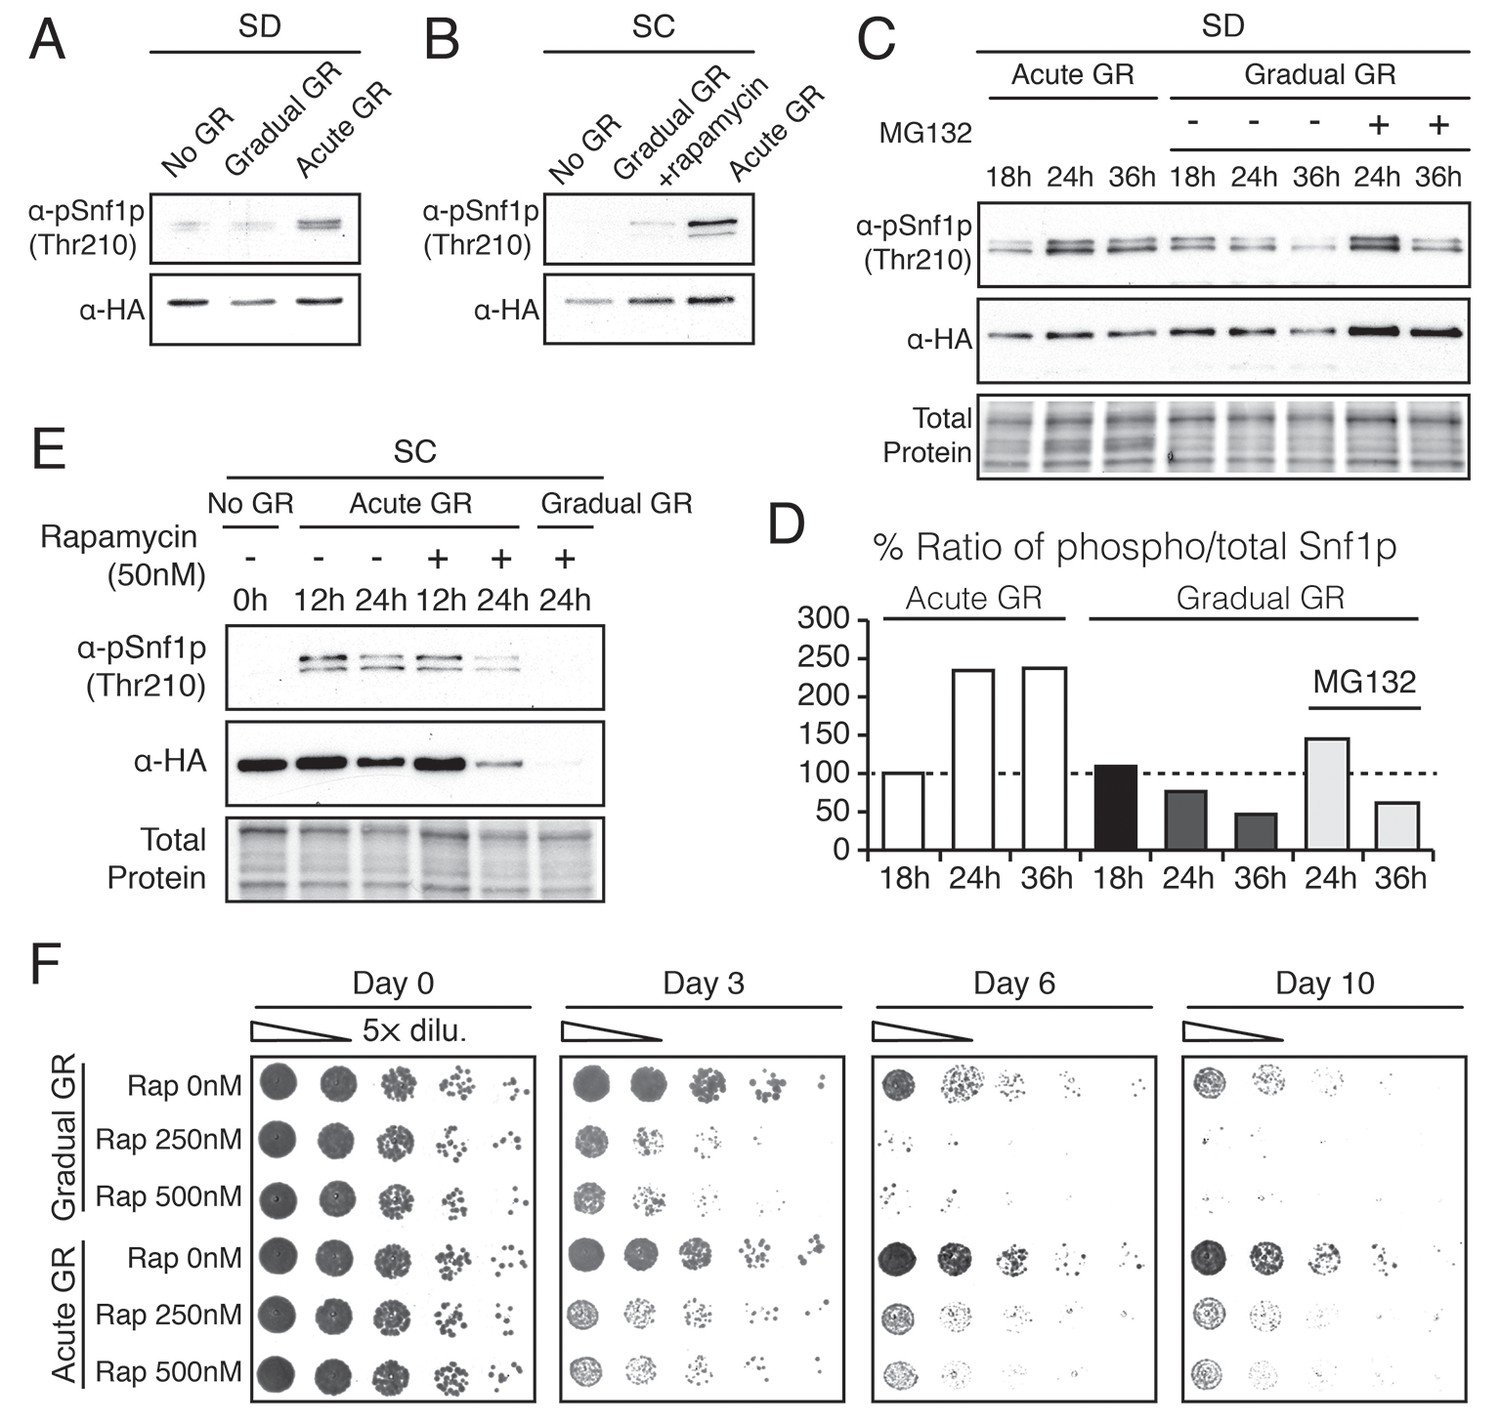
Acute GR, but not gradual GR or rapamycin treatment, enhances AMPK activity to promote cell survival.
(A) Phosphorylated or total Snf1p levels were determined in cells expressing Snf1-HA under no GR and gradual or acute GR for 4 hr using α-phospho AMPK (top band: HA-tagged Snf1p; lower band: endogenous Snf1p) and α-HA antibodies, respectively. (B) Cells harboring Snf1-HA were placed in synthetic complete (SC) media containing 2% glucose with 50 nM rapamycin (Gradual GR +rapamycin) or 0.4% glucose (Acute GR) for 4 hr. Phosphorylated or total Snf1p levels were measured as described in (A). (C) MG132 (10 μM at final concentration) was added to cells in (A) and the levels of phosphorylated or total Snf1p were determined as described in (A) at the indicated times. (D) The ratio of phosphorylated to total Snf1p levels was determined using data in (C) and was plotted as a percentage of that seen in cells undergoing acute GR at 18 hr (which was set at 100%). (E) Cells harboring Snf1-HA were grown under SC media with no GR, acute GR, or gradual GR with/without rapamycin treatment. The levels of phosphorylated or total Snf1p were measured as described in (A) at the indicated times. (F) Cell survival assay was performed in WT cells undergoing gradual or acute GR in the presence of rapamycin (0, 250, and 500 nM at final concentration) in SC media. Equal numbers of cells from each condition were plated onto YPEG agar media to visualize viable cells at the indicated days. Representative colony images are shown.
Figure 4—figure supplement 1
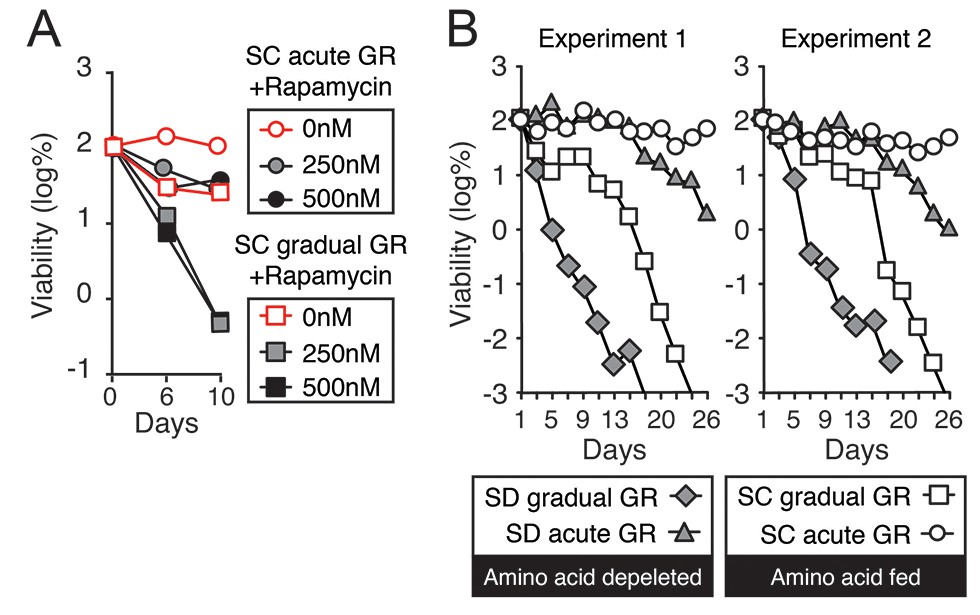
TOR inhibition by rapamycin treatment or amino acid depletion obstructs cell survival during glucose starvation.
(A) Lifespan of cells in Figure 4F was determined as described in Figure 1A. (B) Lifespan of cells undergoing gradual or acute GR without excessive amino acids (Amino acid depleted) or with excessive amino acids (Amino acid fed) was determined as described in Figure 1A. Data from two independent experiments are shown.
Figure 4—figure supplement 2
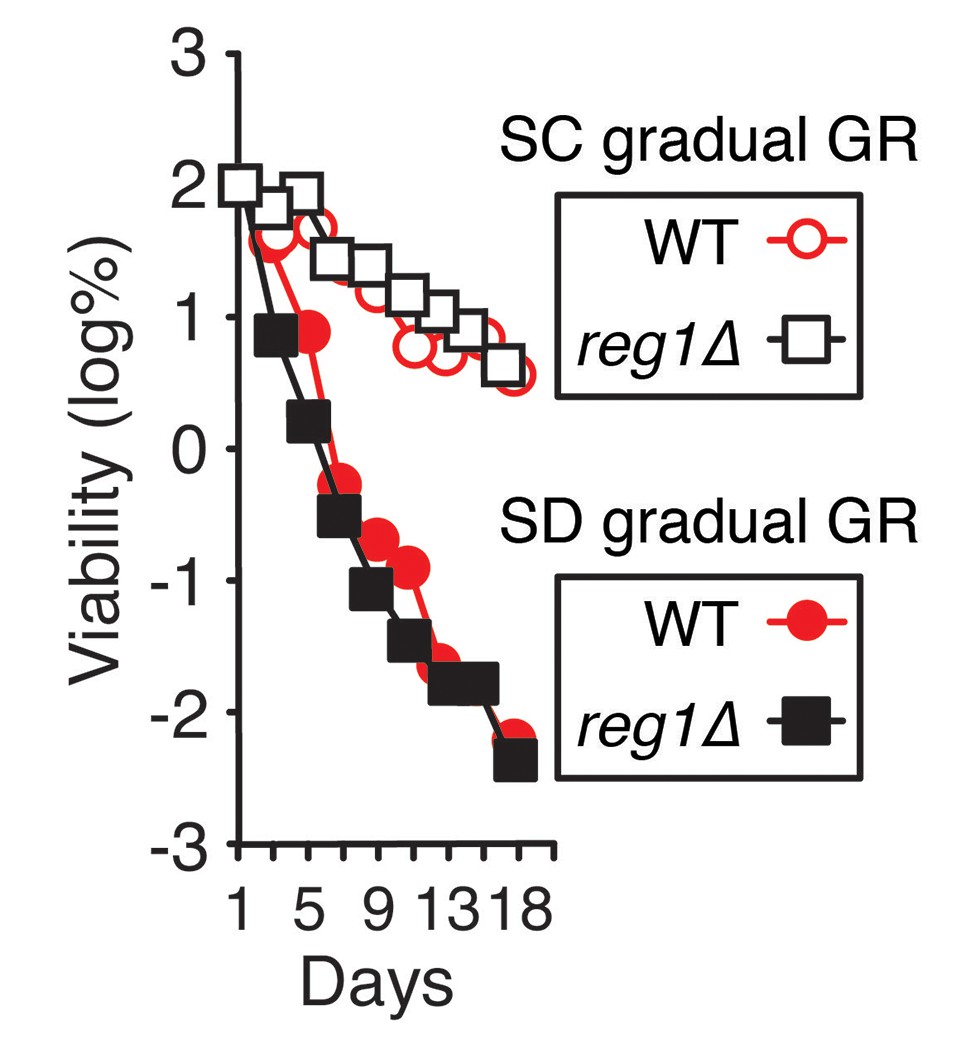
Constitutively-active AMPK does not extend lifespan of cells undergoing gradual GR.
Lifespan of WT and reg1Δ cells undergoing gradual GR with and without excessive amino acids (SC gradual GR and SD gradual GR, respectively) was determined as described in Figure 1A.
Figure 5 with 3 supplements
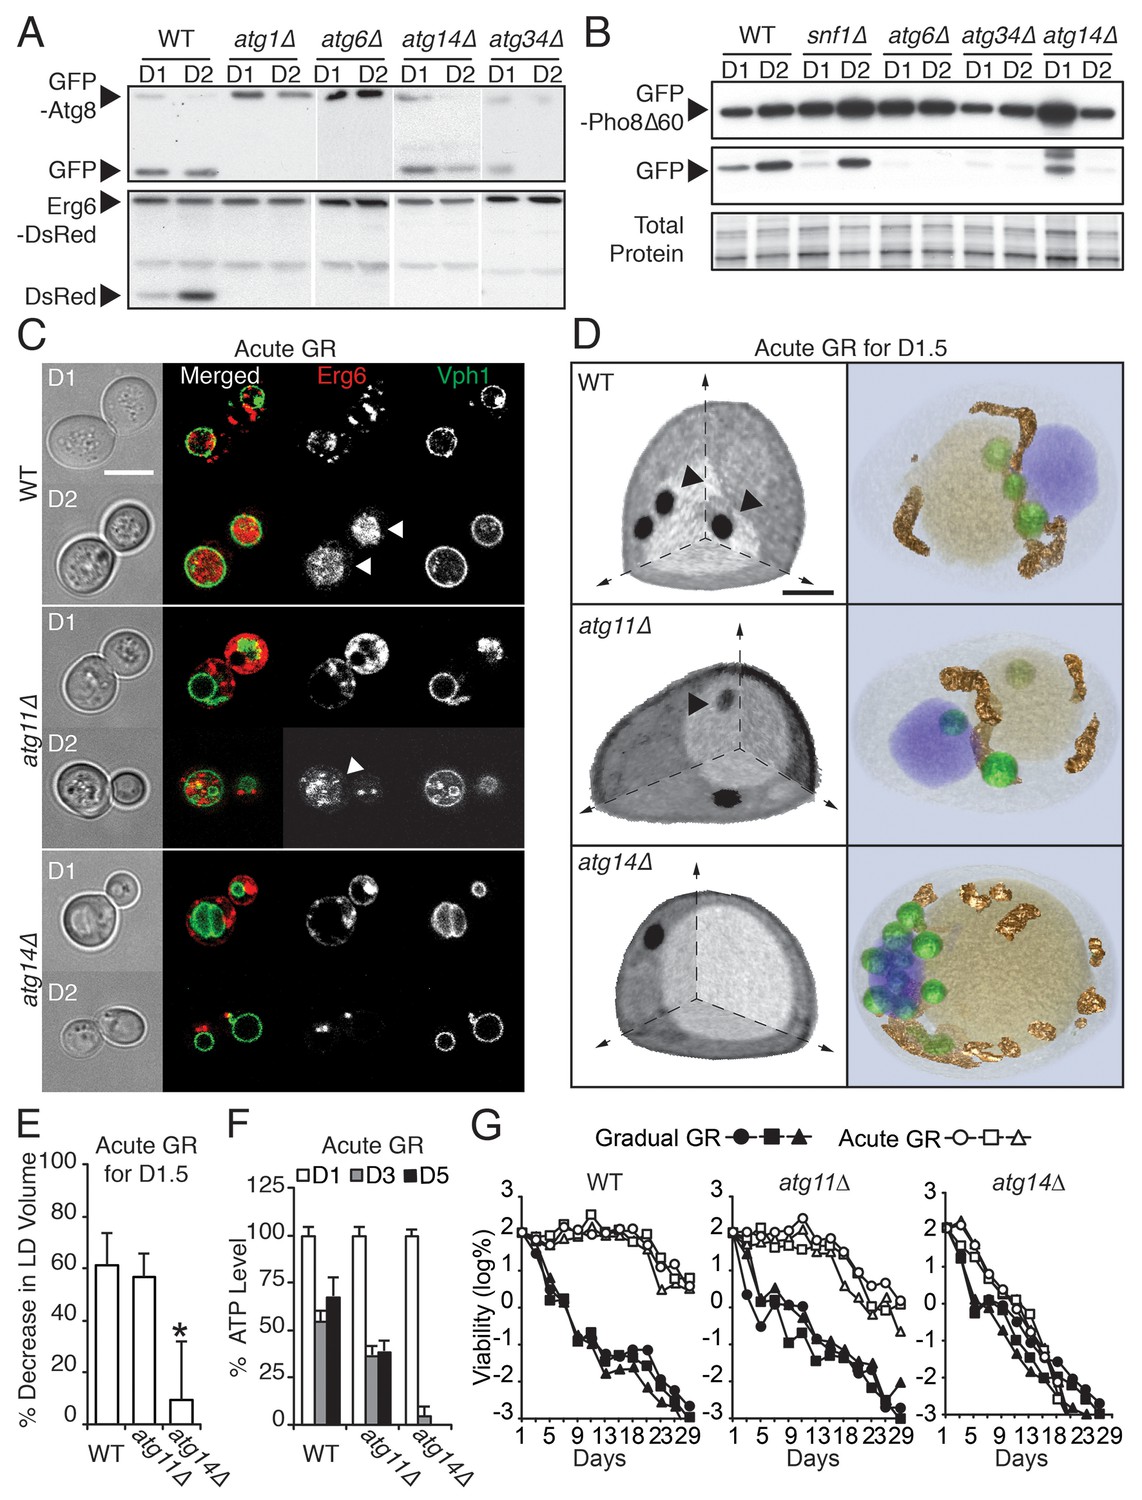
ATG14 is required for μ-lipophagy, ATP maintenance, and lifespan extension during acute GR.
(A) Autophagic and LD flux assays were performed as described in Figure 2F and D, respectively. Western blot images of WT, atg1Δ, atg6Δ, atg14Δ, and atg34Δ cells grown under acute GR are shown. (B) Pho8Δ60 (a cytoplasmic autophagic substrate) degradation assay was performed in WT, snf1Δ, atg6Δ, atg14Δ, and atg34Δ cells harboring GFP-Pho8Δ60 during acute GR. (C) Representative confocal images of WT, atg11Δ, and atg14Δ cells expressing Erg6-DsRed and Vph1-GFP under acute GR are shown. White arrowheads point to vacuolar localized LD signals. Scale bar represents 5 μm. (D) Representative SXT images of WT, atg11Δ, and atg14Δ cells are shown. Black arrowheads point to LDs localized within the vacuole. Scale bar represents 1 μm. Right panels show full 3D SXT images (LD: green; nucleus: purple; vacuole: pale yellow; mitochondria: gold). (E) Percentage decrease of LD volume in acute GR compared to gradual GR was determined using full 3D SXT images of cells in (D). Data are expressed as mean ± SD (n = 7 ~ 10). *p<0.05 versus WT. (F) ATP levels of cells in (E) were determined as described in the Materials and methods. Data are expressed as mean ± SD (n = 3). n indicates the number of experimental repetitions. (G) Lifespan of cells in (E) undergoing acute or gradual GR is shown as described in Figure 1A. Three biologically independent experiments are shown together.
Figure 5—figure supplement 1
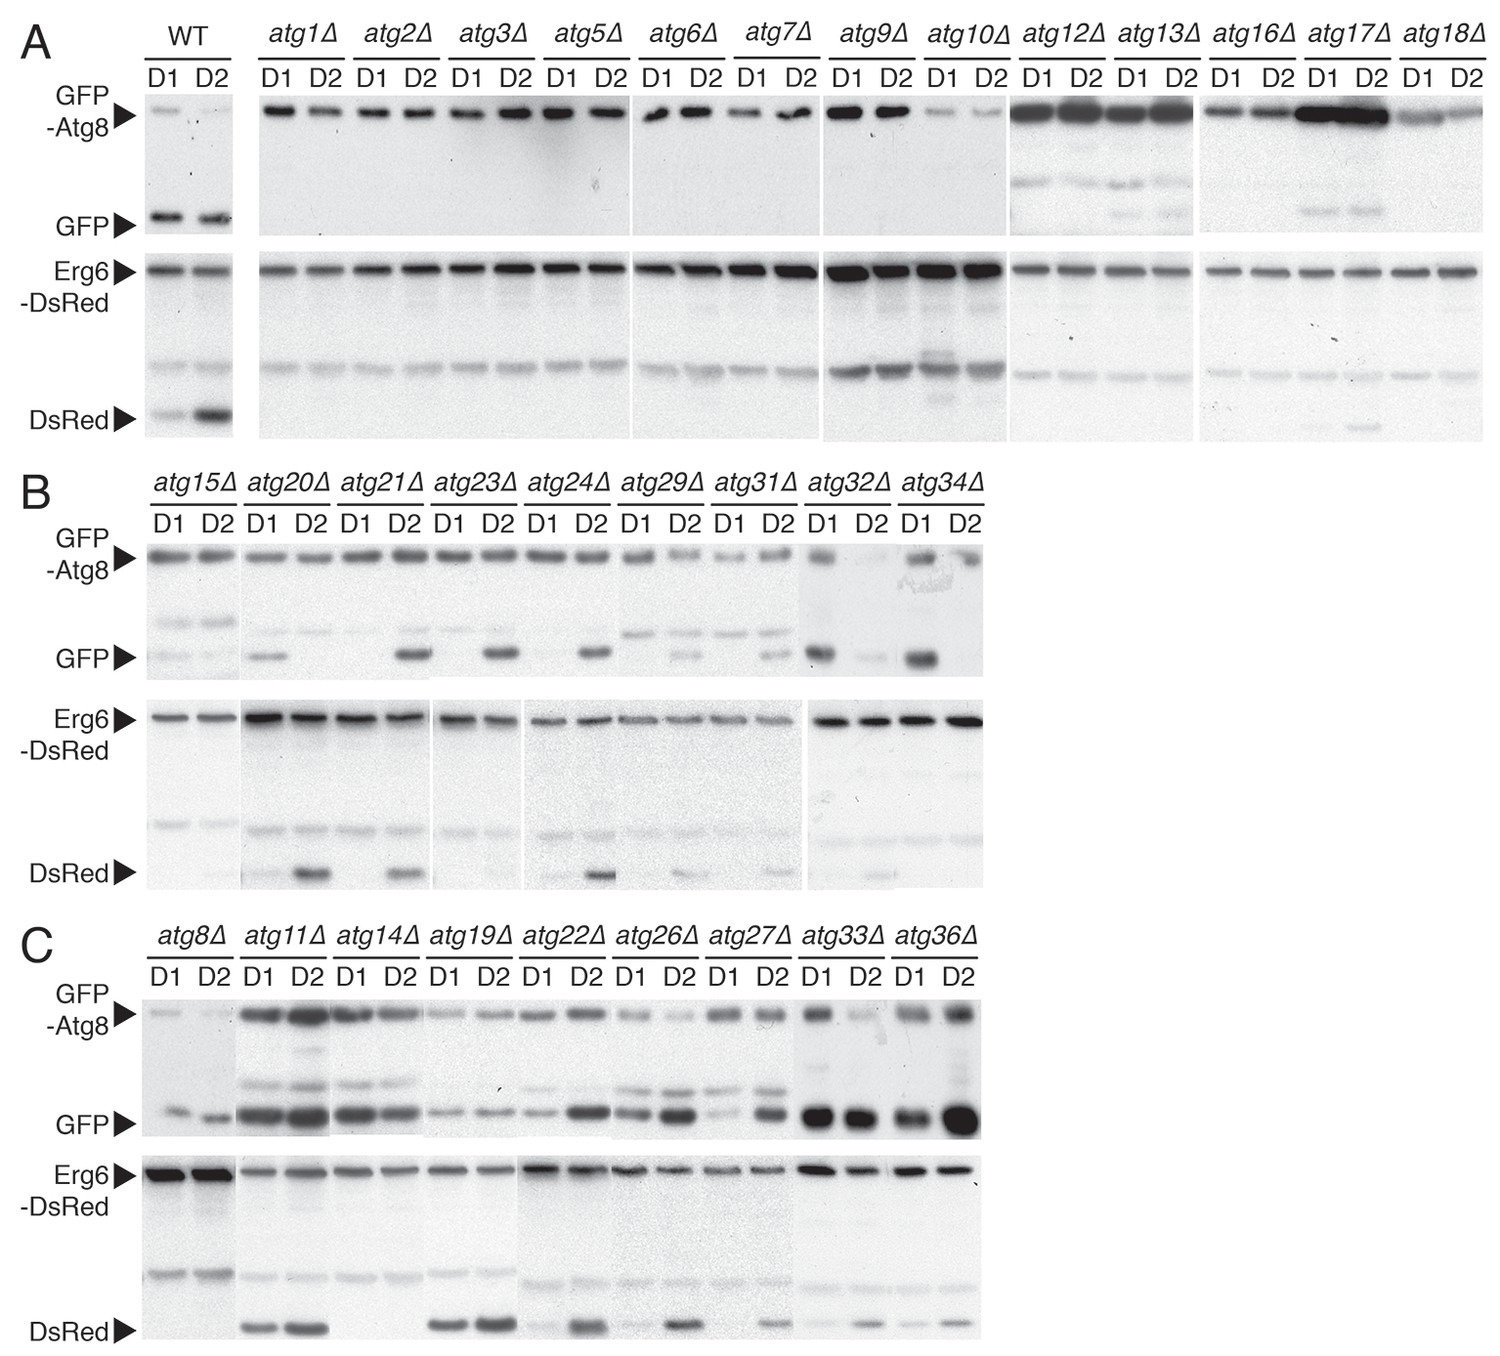
Biochemical screening reveals differential roles of autophagy-related (ATG) genes in μ-lipophagy.
Each indicated yeast strain containing GFP-Atg8 or Erg6-DsRed was grown under acute GR. Experiments measuring flux ratio of Atg8p or Erg6p were performed using antibodies against GFP or RFP at day 1 (D1) and day 2 (D2). (A) ATG genes that were indispensible for both Atg8p and Erg6p processing are shown. (B) ATG genes that were partially required for the Atg8p processing are shown. (C) ATG genes that were not necessary for the Atg8p processing are shown.
Figure 5—figure supplement 2
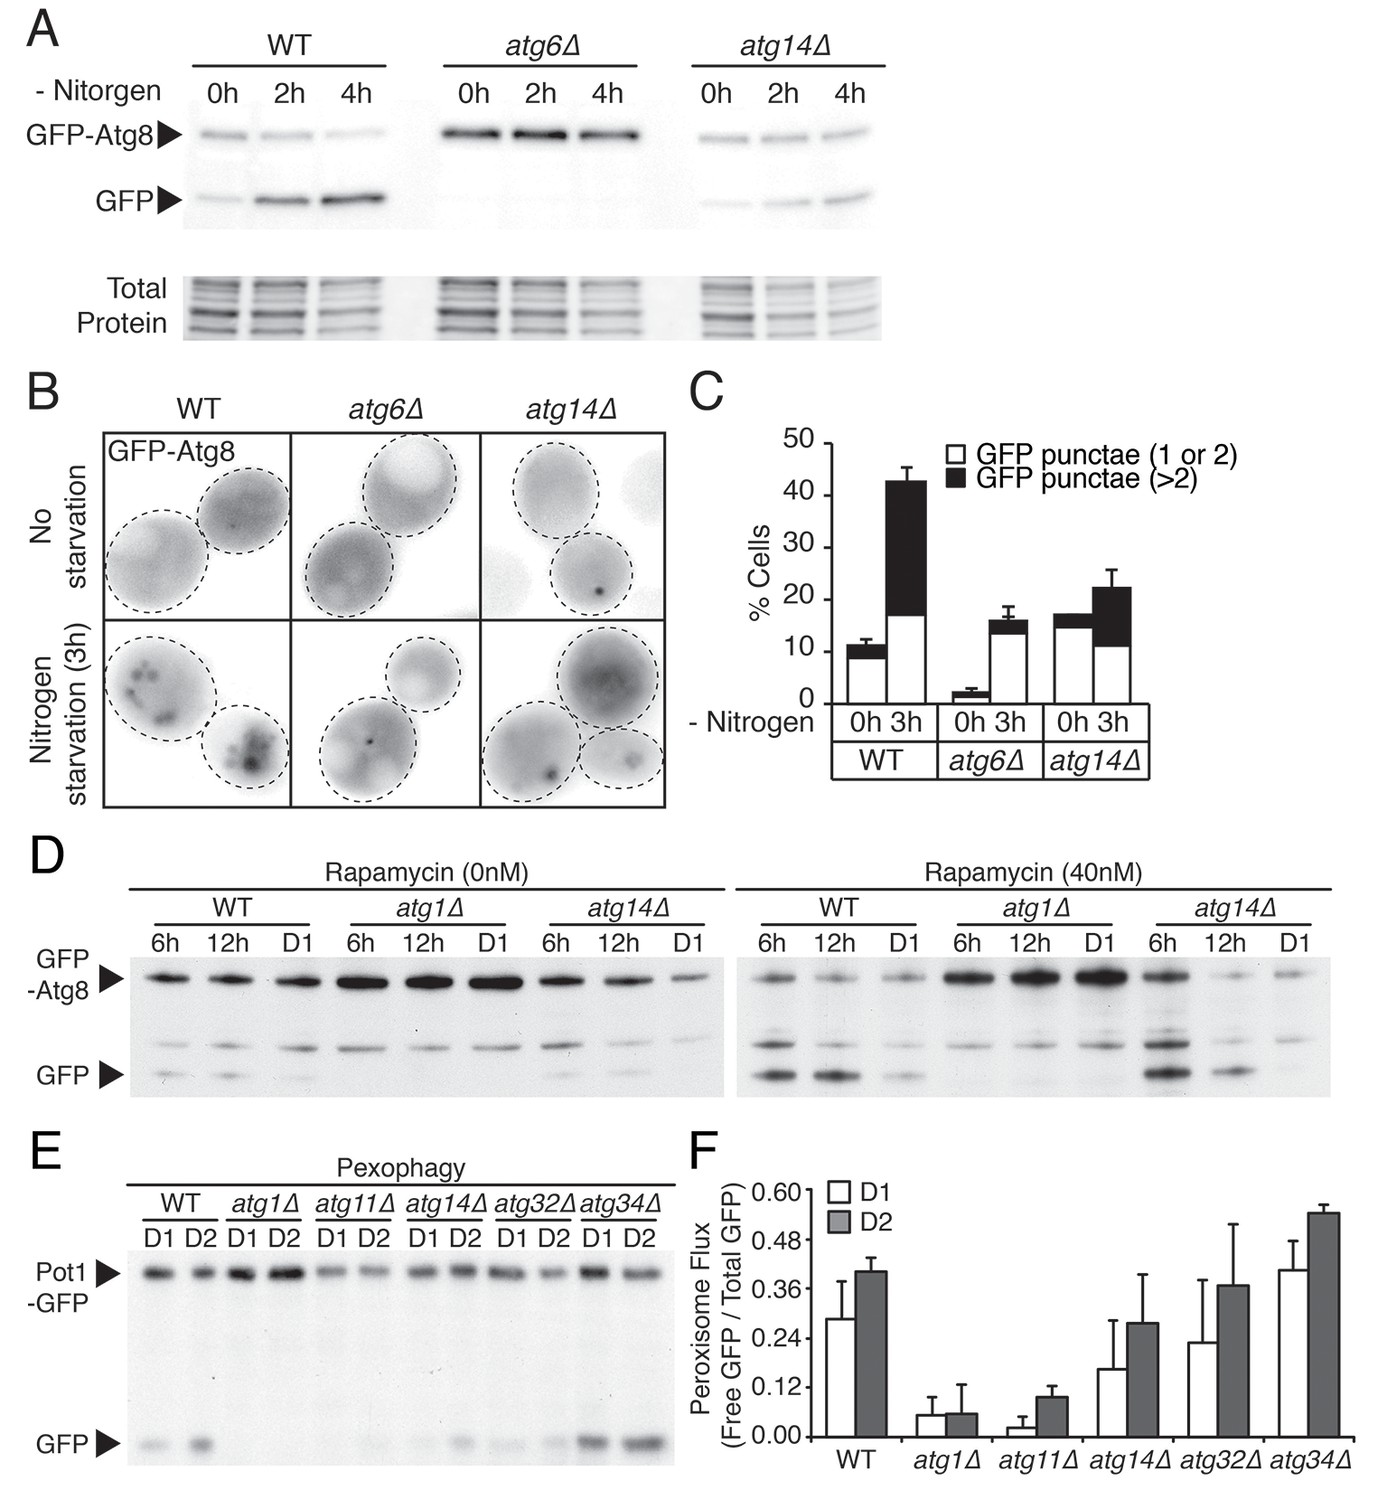
ATG14 is required for autophagy induction, while its deficiency does not block degradation of autophagosome or peroxisome during glucose starvation.
(A) WT, atg6Δ, and atg14Δ cells harboring GFP-Atg8 were grown in YPD and placed in nitrogen starvation media for the indicated times. Autophagic flux assay was performed as described in Figure 2F. Representative western blot image is shown. (B) Representative images of cells in (A) are shown. (C) Percentage of cells containing less than three or more of Atg8 punctate structures was determined in cells from (B). Approximately 150 cells per each condition were scored. Data are expressed as mean ± SD (n = 3). n indicates the number of experimental repetitions. (D) Autophagic flux assay was performed in WT, atg1Δ, and atg14Δ cells harboring GFP-Atg8 during gradual GR with excessive amino acids with/without rapamycin at the indicated times. (E) Pot1p degradation flux assay was performed in WT, atg1Δ, atg11Δ, atg14Δ, atg32Δ, and atg34Δ cells harboring Pot1-GFP (peroxisome marker) at the indicated days under gradual GR. (F) Quantification of Pot1p degradation in (E) is shown. Data are expressed as mean ± SD (n = 3). n indicates the number of experimental repetitions.
Figure 5—figure supplement 3
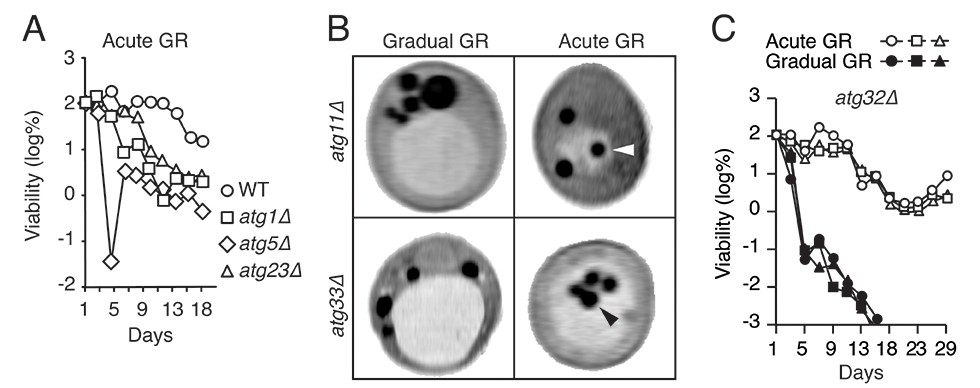
Genes required for μ-lipophagy, but not for pexophagy or mitophagy, are necessary for cell longevity during acute GR.
(A) Long-term viability of WT, atg1Δ, atg5Δ, and atg23Δ cells undergoing acute GR was measured as described in Figure 1A. (B) Representative SXT images of atg11Δ and atg33Δ cells under gradual or acute GR for 1.5 days are shown. Arrowheads point LDs within the vacuoles. (C) Long-term viability of atg32Δ cells was measured as described in Figure 1A. Three biologically independent experiments are shown together.
Figure 6 with 3 supplements
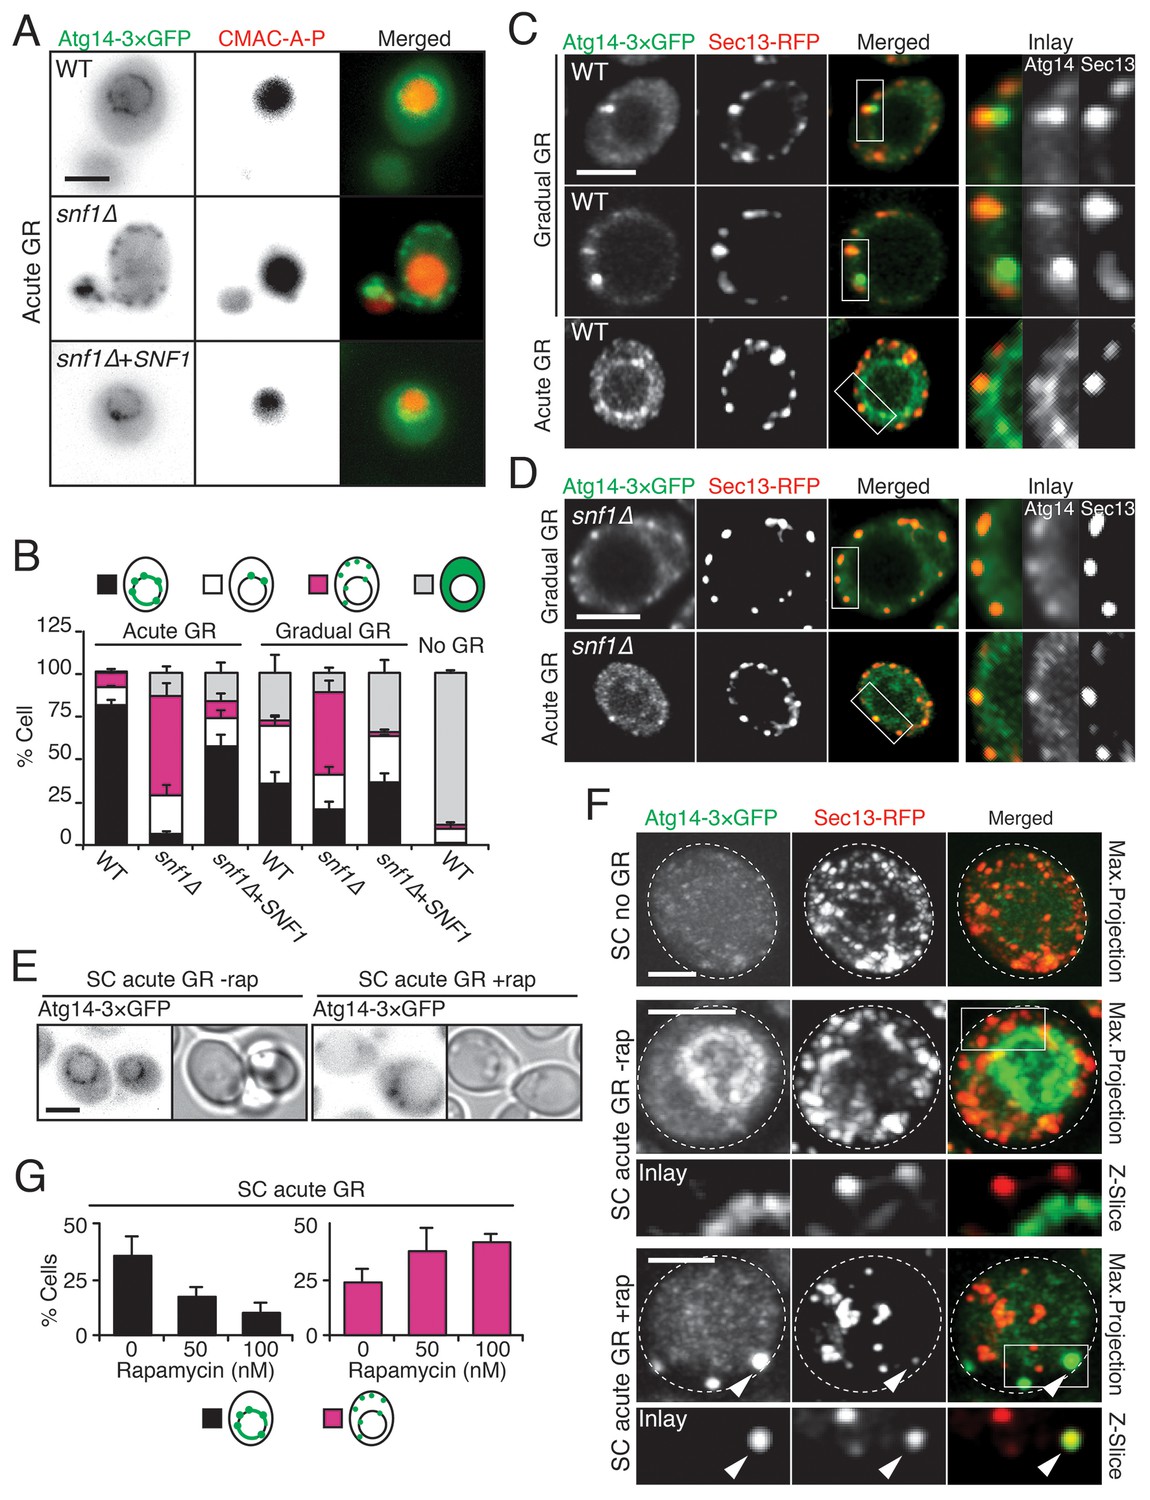
Atg14p is enriched on the vacuole surface upon AMPK activation during acute GR.
(A) WT and snf1Δ cells harboring Atg14-3×GFP were grown under no GR, gradual GR, or acute GR for ~24 hr with or without Snf1p-HA. Representative images of Atg14p and the vacuole marker CMAC-A-P are shown. (B) Percentage of cells in (A) displaying indicated Atg14p localization patterns was determined. Approximately 100 cells per each condition were analyzed. (C) Cells harboring Atg14-3×GFP and Sec13-RFP were grown under gradual or acute GR for ~24 hr. Representative images of Atg14p and Sec13p are shown. (D) snf1Δ cells harboring Atg14-3×GFP and Sec13-RFP were grown under gradual or acute GR for ~24 hr. Representative images of Atg14p and Sec13p are shown. (E) Representative images of Atg14p in cells undergoing acute GR with excessive amino acids (i.e. SC acute GR) with/without 50 nM rapamycin (rap) for ~24 hr are shown. (F) Representative images of Atg14p and Sec13p in cells growing under excessive amino acids with no GR (i.e. SC no GR) or acute GR (i.e. SC acute GR) with/without 50 nM rap for ~24 hr are shown. Dashed lines and arrowheads indicate cell membrane and Atg14p signals that are co-localized with Sec13p, respectively. (G) Percentage of cells in (E) displaying indicated Atg14p localization patterns is shown. Approximately 100 cells per each condition were analyzed. Unless indicated otherwise, data from five independent measurements are shown as mean ± SD. Scale bar represents 2.5 μm.
Figure 6—figure supplement 1
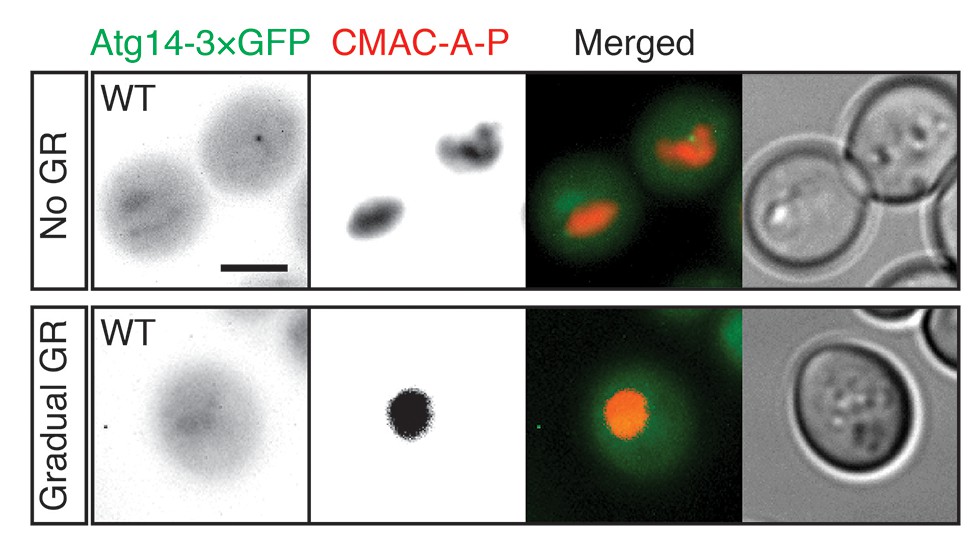
Atg14p is localized within the cytoplasm in dispersed or punctate pattern under no GR or gradual GR.
WT cells harboring Atg14-3×GFP were grown under no GR or gradual GR for ~24 hr. Representative images of Atg14p and the vacuole marker CMAC-A-P are shown. Scale bar represents 2.5 μm.
Figure 6—figure supplement 2
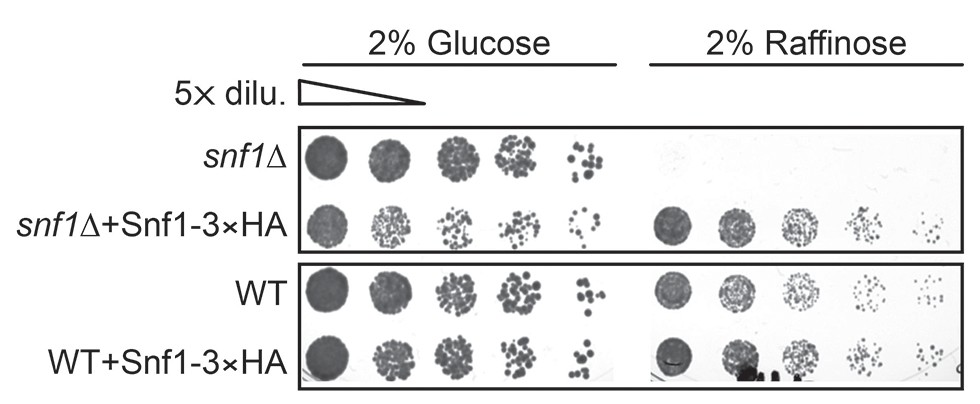
Reintroducing SNF1-3×HA rescues growth defects of snf1Δ cells under glucose starvation.
WT and snf1Δ cells were transformed with endogenous promoter containing SNF1-3×HA construct and were grown under gradual GR for ~24 hr. Cells were serially diluted and plated onto YP-agar plates containing 2% glucose or 2% raffinose. Representative colony images taken after 36 hr at 30°C are shown.
Figure 6—figure supplement 3
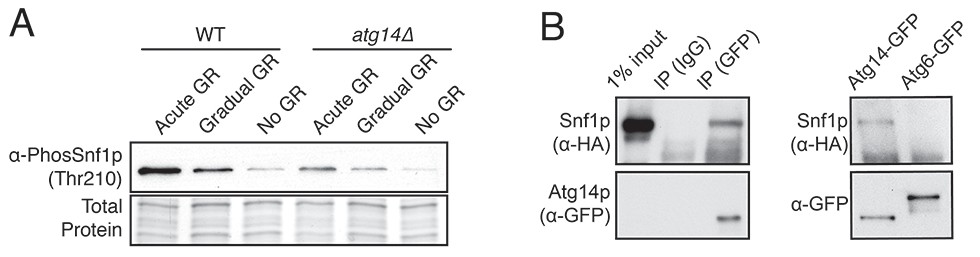
Atg14p forms a complex with Snf1p and is not required for Snf1p phosphorylation during acute GR.
(A) Snf1p phosphorylation was measured in WT and atg14Δ cells growing under acute, gradual, or no GR for 4 hr using α-phospho AMPK antibody as described in the Materials and methods. (B) Immunoprecipitation analysis was performed in cells harboring Snf1-HA and Atg14-3×GFP, or Atg6-3×GFP after ~24 hr of acute GR as described in the Materials and methods. Equal amounts of Atg proteins were loaded for Western-blotting of Snf1p. Representative blot images are shown.
Figure 7
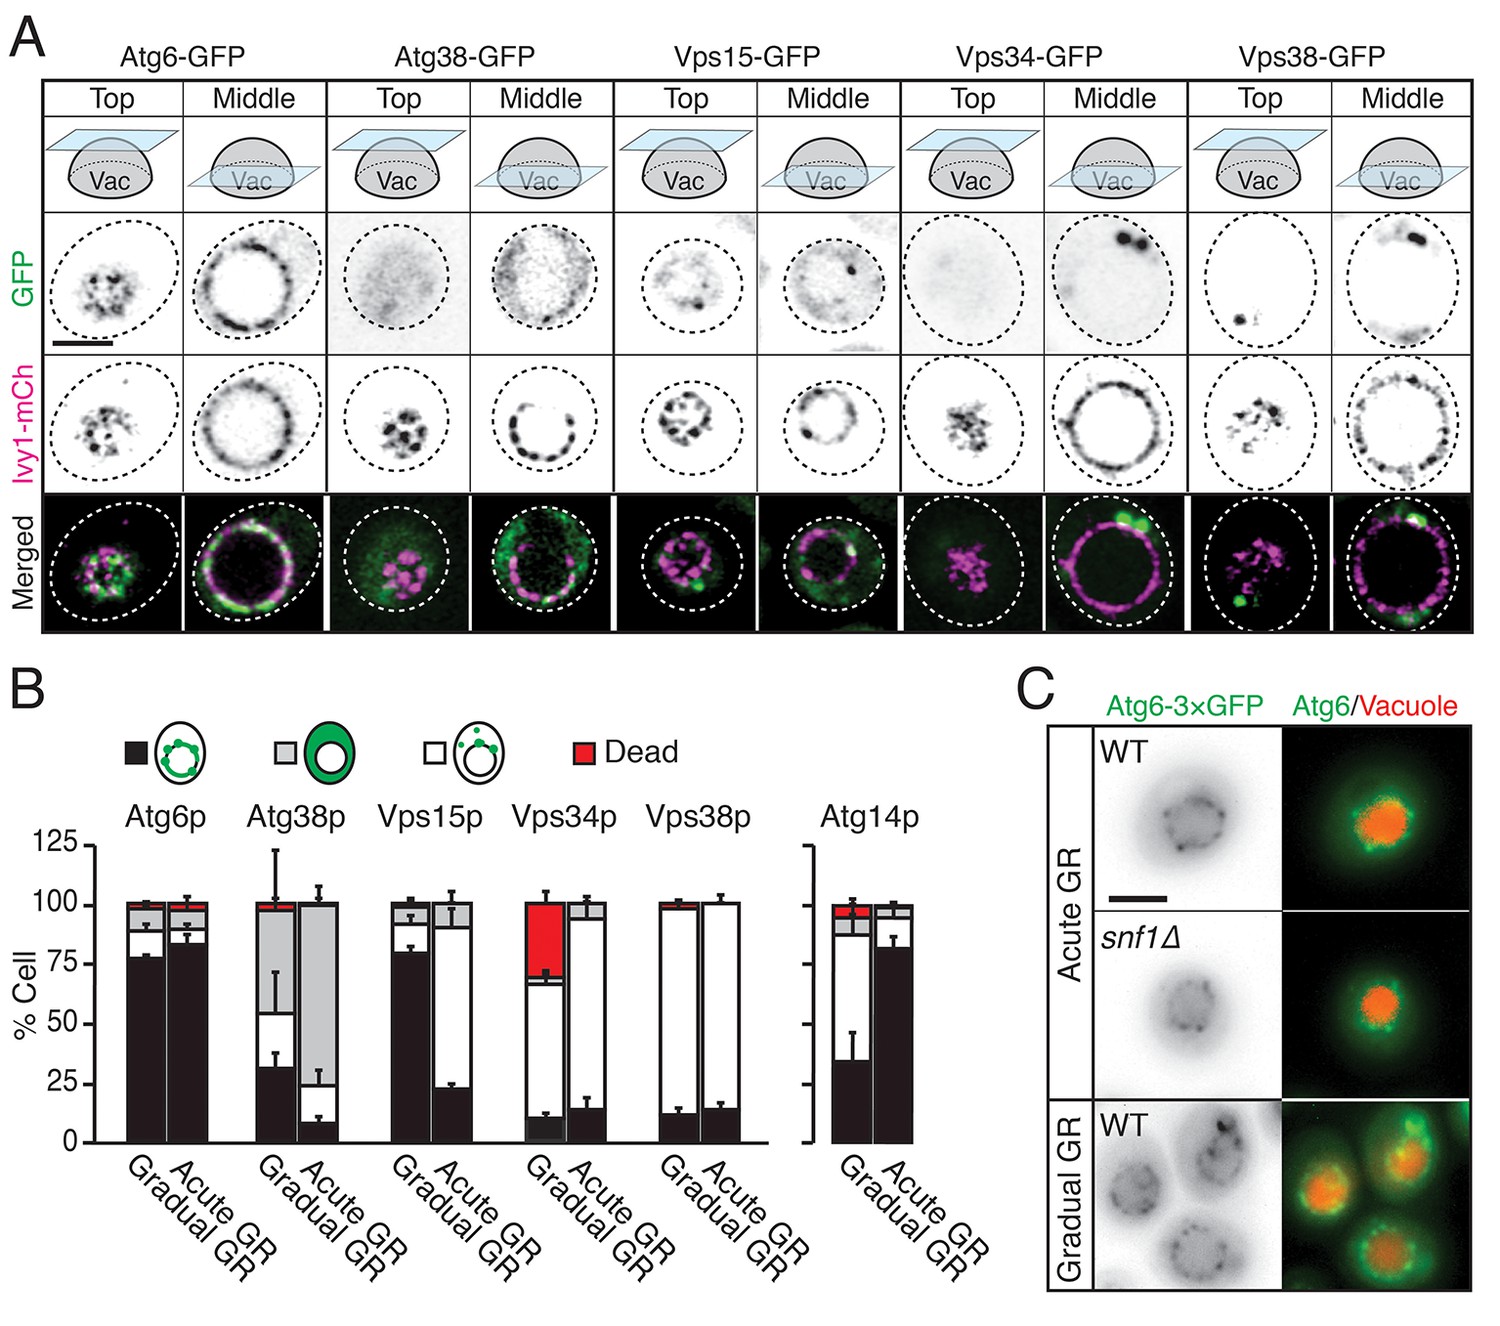
Atg6p and Atg14p, but not other PI3K complex I components, enrich on the vacuole surface upon acute GR.
(A) Cells harboring GFP-tagged Atg6p, Atg38p, Vps15p, Vps34p, or Vps38p and containing lvy1-mCherry (lvy1-mCh, vacuole membrane marker) were grown under acute or gradual GR. Representative images of each indicated GFP-tagged protein and Ivy1p in cells under acute GR for ~24 hr are shown. (B) Cells in (A) or containing Atg14-3×GFP were grown under gradual or acute GR for ~24 hr. Percentage of cells displaying indicated GFP localization patterns was determined. Approximately 100 cells per each condition were analyzed. Data are expressed as mean ± SD (n = 3). n indicates the number of experimental repetitions. (C) WT and snf1Δ cells harboring Atg6-3×GFP were grown under acute or gradual GR for ~24 hr. Representative images of Atg6p and the vacuole marker CMAC-A-P are shown. Scale bar represents 2.5 μm.
Figure 8 with 1 supplement
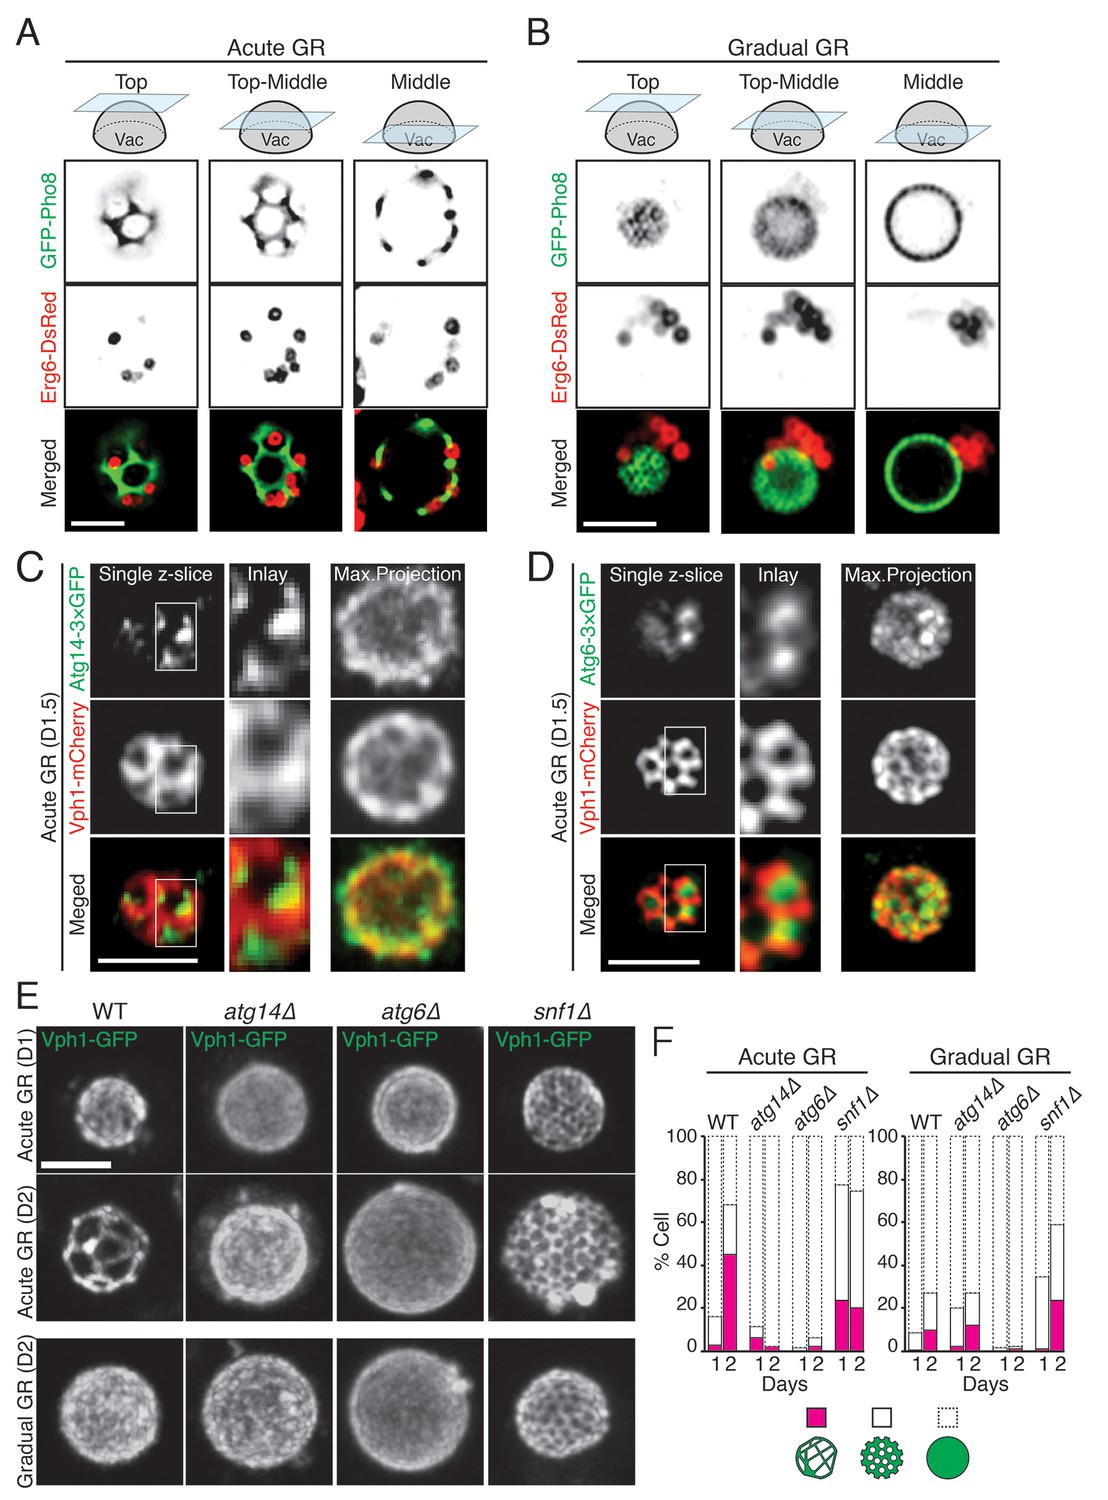
Atg14p is required for the formation of vacuolar liquid-ordered membrane domains and LD recruitment to the vacuole surface during acute GR.
(A, B) Cells harboring GFP-Pho8 (a vacuole membrane marker) and Erg6-DsRed were grown under acute or gradual GR for day 1.5 (D1.5). Representative AIRY-scan images of Pho8p and Erg6p associated with different vacuole z-position are shown. (C) Cells harboring Atg14-3×GFP and Vph1-mCherry (a liquid disordered membrane maker that is excluded from liquid-ordered domains [Toulmay and Prinz, 2013]) were grown under acute GR for D1.5. Representative z-slice and maximum projection images of Atg14p and Vph1p are shown. (D) Cells harboring Atg6-3×GFP and Vph1-mCherry were grown under acute GR for D1.5. Representative images of Atg6p and Vph1p are shown. (E) WT, atg14Δ, atg6Δ, and snf1Δ cells harboring Vph1-GFP were grown under acute or gradual GR. Representative images of Vph1p at different days are shown. (F) Percentage of cells displaying indicated GFP localization patterns on the vacuole was scored. Approximately 150 cells per each condition were analyzed. Scale bar represents 2.5 μm.
Figure 8—figure supplement 1
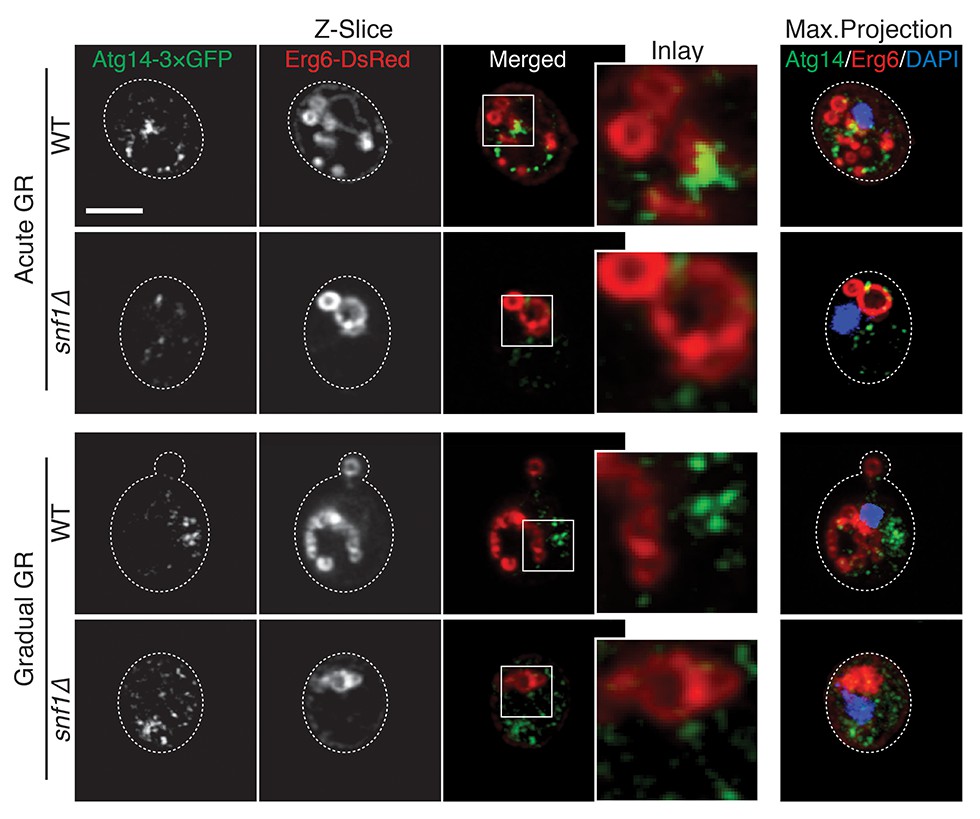
Atg14p and LDs possibly interact on the vacuole liquid-ordered membrane domains upon acute GR in a Snf1p-dependent manner.
WT and snf1Δ cells harboring Atg14-3×GFP and Erg6-DsRed were grown under acute or gradual GR for day 1.5. Representative AIRY-scan images of Atg14p, Erg6p, and DAPI are shown. Scale bar represents 2.5 μm.
Figure 9
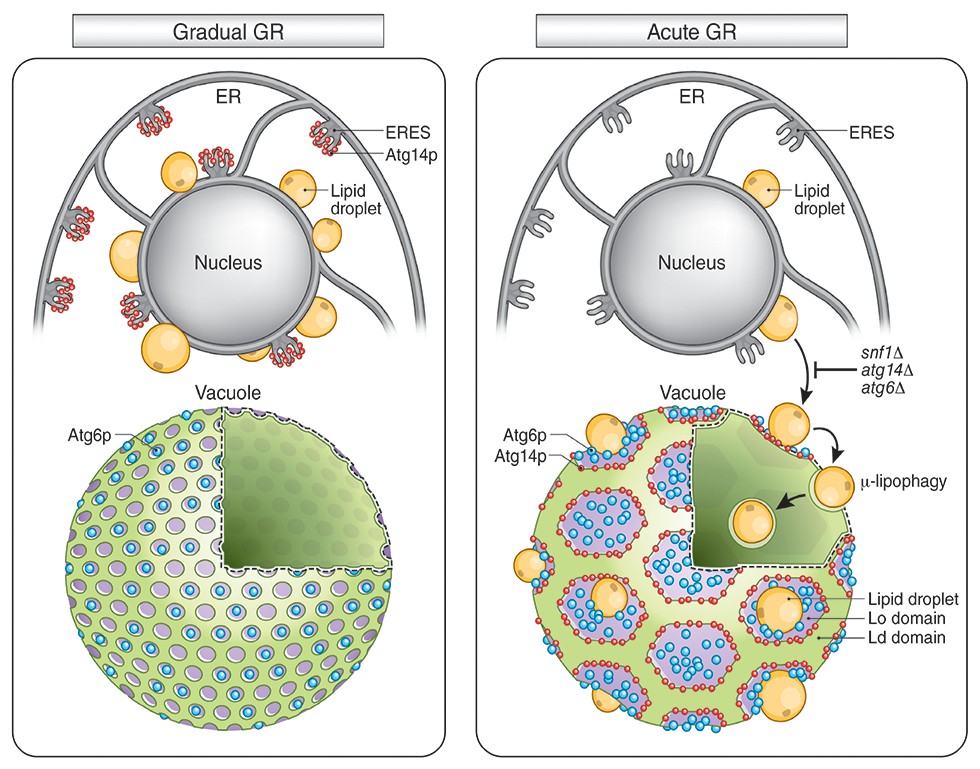
Model for AMPK-Atg14p-dependent Lo domain formation on the vacuole and its role in μ-lipophagy during acute GR.
In cells undergoing acute GR, LDs and the vacuole coordinate to mediate μ-lipophagy. This response involves AMPK/Snf1p activation and Atg14p redistribution to liquid-ordered membrane (Lo) domains on the vacuole surface. Atg14p in cells starved by gradual GR, where AMPK is inactive, does not associate with the vacuole, and instead resides at ER exit sites (ERES). Under acute GR, vacuole-associated Atg14p preferentially resides on the edges of Lo domains and drives large-scale Lo domain formation in concert with Atg6p. The enlarged Lo domains now serve as LD recruitment sites, with LDs moving to the vacuole from the perinuclear ER area. LDs on the Lo domain then bud into the vacuolar lumen and undergo degradation to recycle stored fat molecules, resulting in the extension of lifespan of starved cells during acute GR.
Videos
Video 1
A representative SXT movie of yeast cells under gradual GR.
SXT images of cells grown under gradual GR for 1.5 days were processed and segmented to show individual organelle morphologies (LDs: green; nucleus: purple; vacuole: pale yellow; mitochondria: gold).
Video 2
A representative SXT movie of yeast cells under acute GR.
SXT images of cells grown under acute GR for 1.5 days were processed and segmented to show individual organelle morphologies (LDs: green; nucleus: purple; vacuole: pale yellow; mitochondria: gold).
Video 3
Vacuolar organization of Atg14p and Vph1p during acute GR.
Movie of a cell from Figure 8C showing 3D organization of Atg14p (green) and Vph1p (red) is shown.
Tables
Table 1
List of yeast strains.
| Strain | Genotype | Source |
|---|---|---|
| BY4742 | MATα, his3∆1, leu2∆0, lys2∆0, ura3∆0 | (Brachmann et al., 1998) |
| WT | BY4742 ho∆::KanMX4 | (Winzeler et al., 1999) |
| snf1∆ | BY4742 snf1∆::KanMX4 | EUROSCARF |
| snf4∆ | BY4742 snf4∆::KanMX4 | “ |
| atg1∆ | BY4742 atg1∆::KanMX4 | “ |
| atg2∆ | BY4742 atg2∆::KanMX4 | “ |
| atg3∆ | BY4742 atg3∆::KanMX4 | “ |
| atg5∆ | BY4742 atg5∆::KanMX4 | “ |
| atg6∆ | BY4742 atg6∆::KanMX4 | “ |
| atg7∆ | BY4742 atg7∆::KanMX4 | “ |
| atg8∆ | BY4742 atg8∆::KanMX4 | “ |
| atg9∆ | BY4742 atg9∆::KanMX4 | “ |
| atg10∆ | BY4742 atg10∆::KanMX4 | “ |
| atg11∆ | BY4742 atg11∆::KanMX4 | “ |
| atg12∆ | BY4742 atg12∆::KanMX4 | “ |
| atg13∆ | BY4742 atg13∆::KanMX4 | “ |
| atg14∆ | BY4742 atg14∆::KanMX4 | “ |
| atg15∆ | BY4742 atg15∆::KanMX4 | “ |
| atg16∆ | BY4742 atg16∆::KanMX4 | “ |
| atg17∆ | BY4742 atg17∆::KanMX4 | “ |
| atg18∆ | BY4742 atg18∆::KanMX4 | “ |
| atg19∆ | BY4742 atg19∆::KanMX4 | “ |
| atg20∆ | BY4742 atg20∆::KanMX4 | “ |
| atg21∆ | BY4742 atg21∆::KanMX4 | “ |
| atg22∆ | BY4742 atg22∆::KanMX4 | “ |
| atg23∆ | BY4742 atg23∆::KanMX4 | “ |
| atg24∆ | BY4742 atg24∆::KanMX4 | “ |
| atg26∆ | BY4742 atg26∆::KanMX4 | “ |
| atg27∆ | BY4742 atg27∆::KanMX4 | “ |
| atg29∆ | BY4742 atg29∆::KanMX4 | “ |
| atg31∆ | BY4742 atg31∆::KanMX4 | “ |
| atg32∆ | BY4742 atg32∆::KanMX4 | “ |
| atg33∆ | BY4742 atg33∆::KanMX4 | “ |
| atg34∆ | BY4742 atg34∆::KanMX4 | “ |
| atg36∆ | BY4742 atg36∆::KanMX4 | “ |
| tgl3∆ | BY4742 tgl3∆::KanMX4 | “ |
| tgl4∆ | BY4742 tgl4∆::KanMX4 | “ |
| AYS1501 | ATG14-3xGFP::HIS WT | This study |
| AYS1503 | ATG14-3xGFP::HIS snf1∆ | “ |
| AYS1506 | ATG6-3xGFP::HIS WT | “ |
| AYS1508 | ATG6-3xGFP::HIS snf1∆ | “ |
| AYS1601 | ATG14-3xGFP::HIS SEC13-yemRFP::URA3 WT | “ |
| AYS1602 | ATG14-3xGFP::HIS SEC13-yemRFP::URA3 snf1∆ | “ |
| CWY7183 | ATG6-3xGFP::HIS VPH1-mCherry:LEU BY4742 | (Wang et al., 2014) |
| CWY7226 | ATG14-3xGFP::HIS VPH1-mCherry:LEU BY4742 | “ |
| YPJ1075 | BY4742 dga1∆ lro1∆::KanMX4 | (Petschnigg et al., 2009) |
| YPJ1076 | BY4742 are1∆ are2∆::KanMX4 | “ |
| YPJ1078 | BY4742 dga1∆ lro1∆ are1∆ are2∆::KanMX4 | “ |
| BY4741 | MATa, his3∆1, leu2∆0, met15∆0, ura3∆0 | (Brachmann et al., 1998) |
| AYS1701 | ATG6-3xGFP::HIS p416-Ivy1-mCherry WT | This study |
| AYS1703 | BY4741 ATG38-GFP::HIS p416-Ivy1-mCherry | “ |
| AYS1704 | BY4741 VPS15-GFP::HIS p416-Ivy1-mCherry | “ |
| AYS1705 | BY4741 VPS34-GFP::HIS p416-Ivy1-mCherry | “ |
| AYS1706 | BY4741 VPS38-GFP::HIS p416-Ivy1-mCherry | “ |
-
EUROSCARF, European Saccharomyces cerevisiae Archive for Functional Analysis, Institute for Molecular Biosciences, Johann Wolfgang Goethe-University Frankfurt, Frankfurt, Germany.
Table 2
List of plasmids.
| Plasmid | Organelles | Reference |
|---|---|---|
| pCuGFP-AUT7 | Autophagosome | (Kim et al., 2001) |
| pRS316-PGK-POT-GFP | Peroxisome | (Binns et al., 2006) |
| pERG6-mDsRed | Lipid droplet | “ |
| pRS416 Vph1-GFP | Vacuole | (Dawaliby and Mayer, 2010) |
| pRS426 GFP-Pho8 | Vacuole | “ |
| p416-Ivy1-mCherry | Vacuole | (Toulmay and Prinz, 2013) |
| pVT100U-mtGFP | Mitochondria | (Westermann and Neupert, 2000) |
| pBS-ATG6-3xGFP-His3 | Autophagosome | (Wang et al., 2014) |
| pBS-ATG14-3xGFP-His3 | Autophagosome | “ |
| pRS416-PGPD-GFP-Pho8∆60-Tcyc1 | “ | |
| pRS315-SNF1-3xHA | (McCartney and Schmidt, 2001) | |
| pUC19-URA3-3’SEC13-yemRFP | ER exit site | This study |
Download links
A two-part list of links to download the article, or parts of the article, in various formats.
Downloads (link to download the article as PDF)
Open citations (links to open the citations from this article in various online reference manager services)
Cite this article (links to download the citations from this article in formats compatible with various reference manager tools)
AMPK and vacuole-associated Atg14p orchestrate μ-lipophagy for energy production and long-term survival under glucose starvation
eLife 6:e21690.
https://doi.org/10.7554/eLife.21690


