Lack of IL-1R8 in neurons causes hyperactivation of IL-1 receptor pathway and induces MECP2-dependent synaptic defects
- IRCCS Humanitas, Italy
- Instituto de Neurociencias (Universidad Miguel Hernández-Consejo Superior de Investigaciones Científicas), Spain
- IN-CNR, Italy
- Hunimed University, Italy
Figures
Figure 1
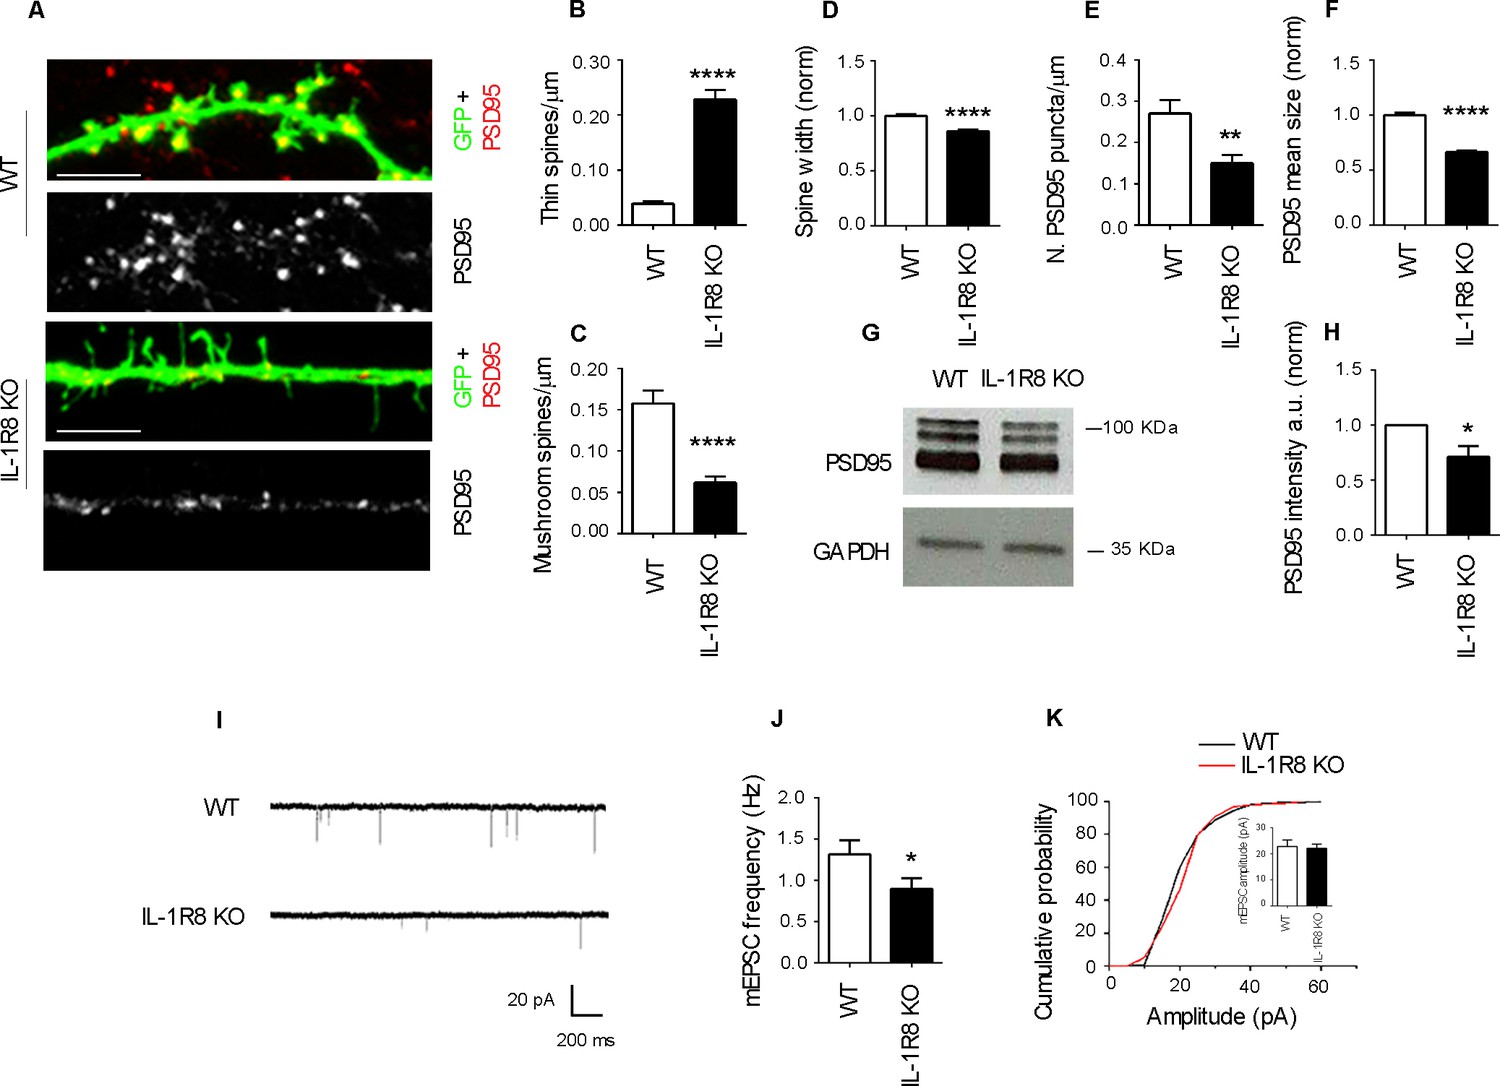
IL-1R8 silencing affects spine morphology and function.
(A) PSD-95 immunocytochemical staining of GFP-transfected, 16 DIV hippocampal cultures from WT or IL-1R8 KO mice. Scale bar 5 mm. (B-F) Quantitative analysis of the following parameters: thin and mushroom spine density (B and C); spine width (D); PSD-95 puncta density (E) and mean size of PSD-95 puncta (F). Number of analyzed neurons: B-D: 32 (WT), 44 (IL-1R8 KO); E-F: 32 (WT), 29 (IL-1R8 KO); Student t test. (G, H) Western blotting analysis of PSD-95 levels in primary hippocampal cultures, 3 independent experiments, Mann Whitney test. (I) Representative mEPSC traces recorded from WT and IL-1R8 KO neurons. (J) mEPSC frequency quantitation (WT: n = 12; IL-1R8 KO: n = 18; Mann Whitney Test). (K) Cumulative distributions and bar graph of mEPSC amplitude (WT: 22,82 ± 2, n = 12; IL-1R8 KO: 22,11 ± 1,5, n = 18; Mann Whitney test. * indicates significance compared to WT, # indicates, significance compared to IL-1R8 KO.
Figure 2
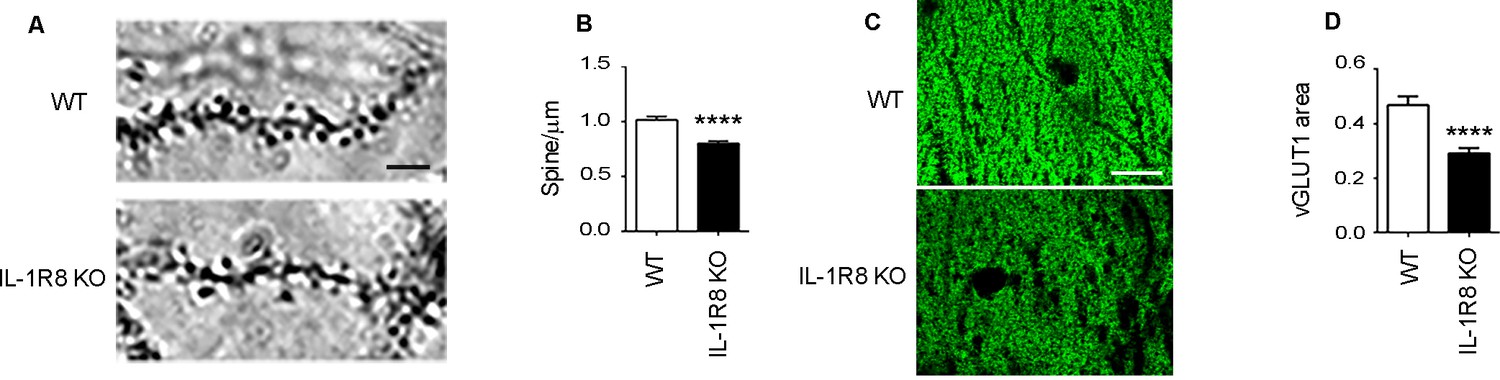
IL1R8 deficient mice show altered spines and synapses in hippocampal sections.
(A) Representative images of secondary branches of apical dendrites of WT and IL-1R8 KO mice (3 months old) stained by the Golgi-Cox method and relative quantitation (B). A significant reduction of spine density in IL-1R8 KO mice was evident with respect to WT mice (number of spines per micron: WT = 1,02 ± 0,03; number of mice analyzed: 3, number of examined dendrites: 75; IL-1R8 KO = 0,80 ± 0,02; number of mice analyzed: 3, number of examined dendrites: 84; Mann-Whitney test). Scale bar, 5 µm. (C) Representative fields of the CA1 hippocampal region (stratum radiatum) of a WT and IL-1R8 KO mouse brain (1 month old mice), stained for the vesicular glutamate transporter, vGLUT1. Scale bar, 15 µm. (D) A significant reduction in vGLUT1 area was found in the stratum radiatum of CA1 field of IL-1R8 KO mice (total area of vGLUT1 positive puncta WT = 0,4644 ± 0,03420; number of examined fields: 35; IL-1R8 KO = 0,2910 ± 0,01984; number of examined fields: 47; Mann-Whitney test).
Figure 3
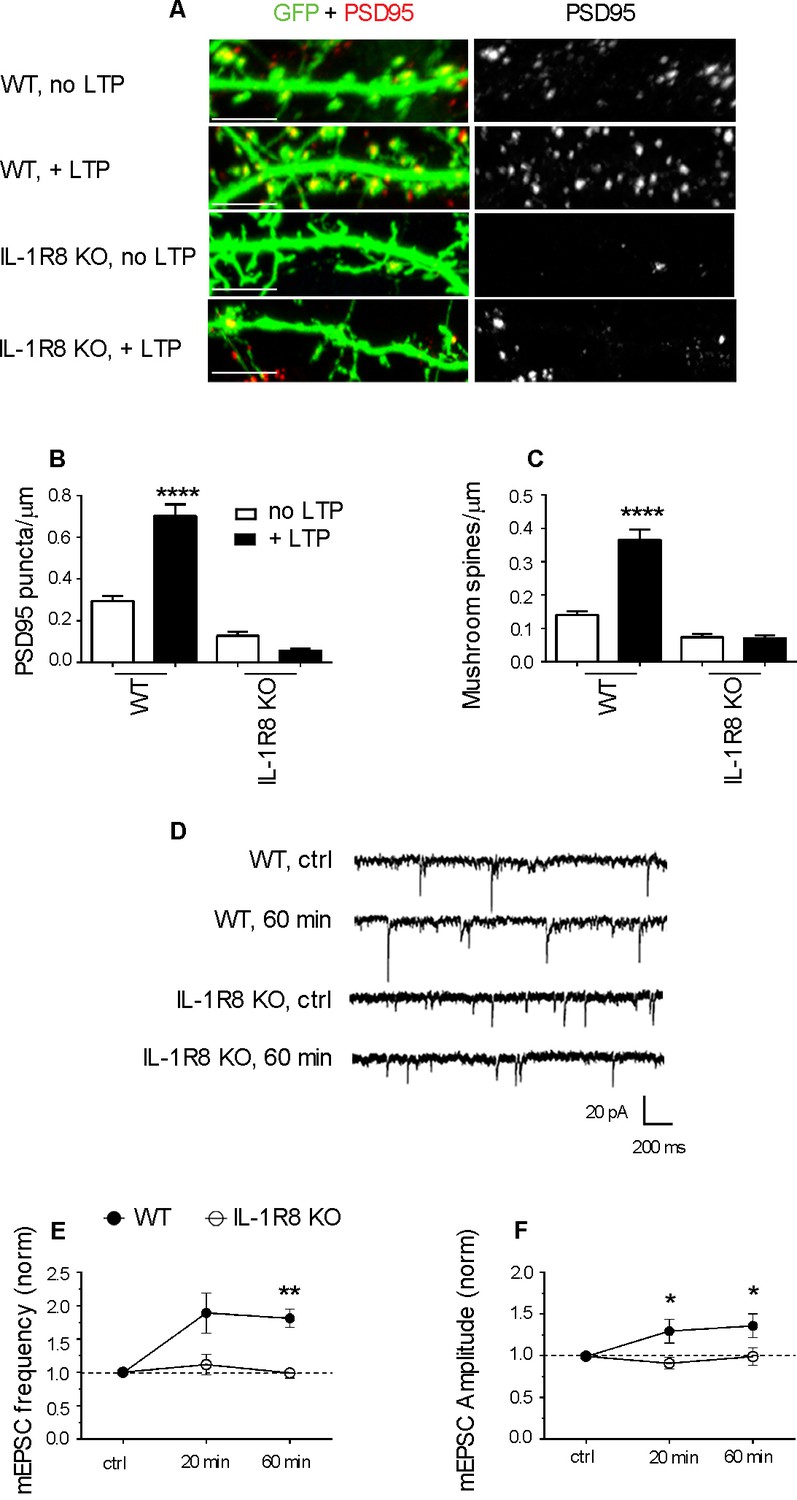
IL-1R8 KO neurons do not undergo LTP.
(A) PSD-95 immunocytochemical staining of GFP-transfected, DIV 16 hippocampal cultures from WT or IL-1R8 KO mice, subjected or not to the LTP protocol. Scale bar 5 μm. (B and C) Quantitative analysis of PSD-95 and mushroom spine density of neurons treated as above. Number of analyzed neurons, B: 15 (WT, no LTP), 13 (WT, + LTP), 28 (IL-1R8 KO, no LTP), 18 (IL-1R8 KO, + LTP); C: 16 (WT, no LTP), 33 (WT, + LTP), 24 (IL-1R8 KO, no LTP), 34 (IL-1R8 KO, + LTP); one-way ANOVA analysis of variance followed by post hoc Tukey test). (D) Representative traces of mEPSCs recorded from neurons of WT or IL-1R8 KO mice before and 60 min after LTP induction. (E and F) Averaged mEPSC frequency and amplitude of WT and IL-1R8 KO neurons over different recording time points after LTP induction. Normalized mEPSC frequency: WT 0 min: 0,99 ± 0,06, n = 11; 20 min 1,84 ± 0,3, n = 12; 60 min 1,81 ± 0,14, n = 9; IL-1R8 KO 0 min 1,0 ± 0,07, n = 10; 20 min 1,11 ± 0,15, n = 11; 60 min 0,94 ± 0,07, n = 5. Normalized mEPSC amplitude: WT 0 min: 0,99 ± 0,03, n = 11; 20 min 1,29 ± 0,14, n = 12; 60 min 1,36 ± 0,14, n = 9; IL-1R8 KO 0 min 0,96 ± 0,05, n = 10; 20 min 0,91 ± 0,07, n = 11; 60 min 0,99 ± 0,1, n = 5. Mann Whitney test.
Figure 4
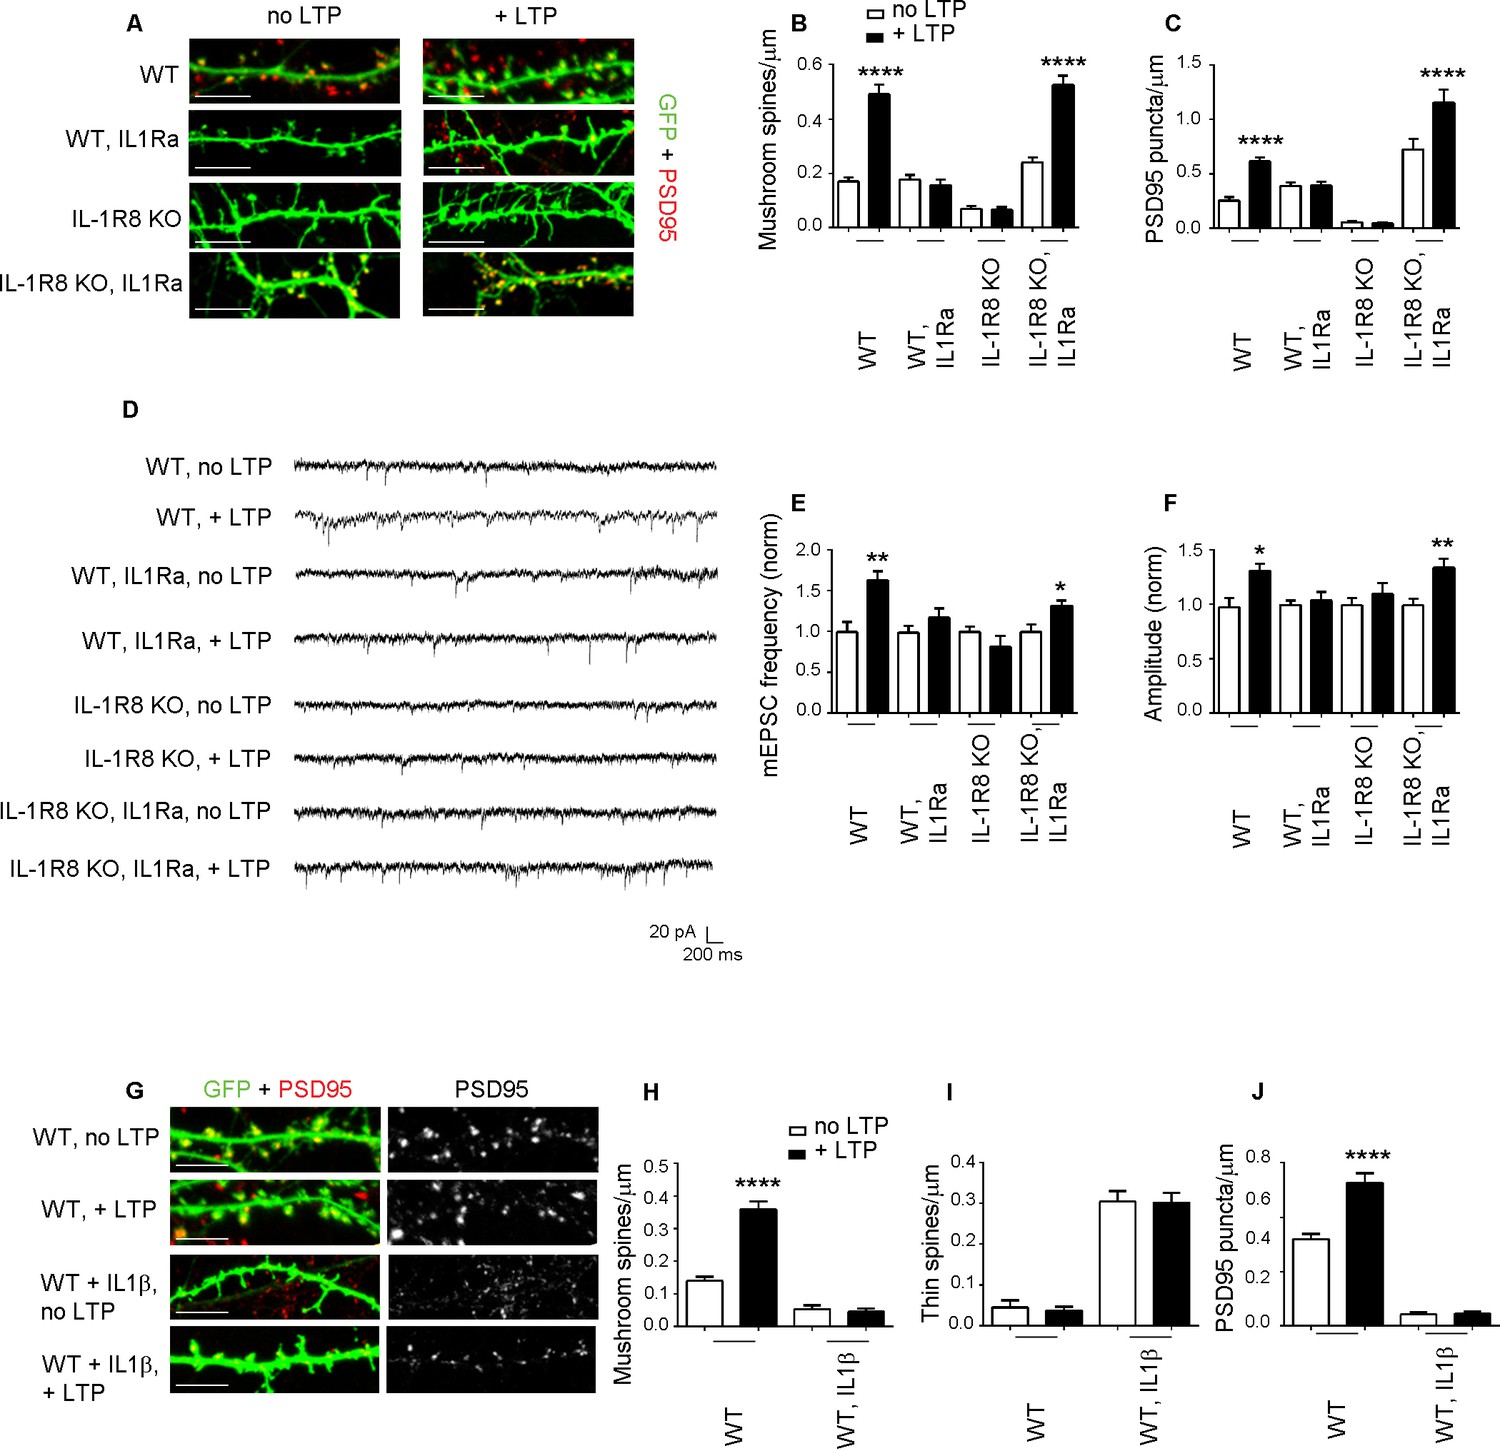
Inhibition of IL-1R signalling restores LTP in IL-1R8 KO neurons.
(A) PSD-95 immunocytochemical staining of 16 DIV hippocampal cultures from GFP transfected WT or IL-1R8 KO mice, treated or not, at DIV 15 with IL1Ra (20 ng/ml) overnight (14 hr). Scale bar 5 μm. (B) Quantitative analysis of mushroom spine density in control or upon LTP protocol application. Similar results were obtained with IL1Ra at 100 ng/ml. Number of analyzed neurons: 14 (WT, no LTP), 16 (WT, + LTP), 10 (WT, IL1Ra, no LTP), 10 (WT, IL1Ra, + LTP), 26 (IL-1R8 KO, no LTP), 29 (IL-1R8 KO, + LTP), 23 (IL-1R8 KO, IL1Ra, no LTP), 32 (IL-1R8 KO, IL1Ra, + LTP); one-way ANOVA analysis of variance followed by post hoc Tukey test). (C) Quantitative analysis of PSD-95 immunoreactivity. Number of analyzed neurons: 9 (WT, no LTP), 26 (WT, + LTP), 27 (WT, IL1Ra, no LTP), 24 (WT, IL1Ra, + LTP), 24 (IL-1R8 KO, no LTP), 62 (IL-1R8 KO, + LTP), 13 (IL-1R8 KO, IL1Ra, no LTP), 12 (IL-1R8 KO, IL1Ra, + LTP). One-way ANOVA analysis of variance followed by post hoc Tukey test. (D) Representative traces of WT and IL-1R8 KO neurons treated with vehicle or IL1Ra (100 ng/ml). (E and F) Quantitation of mEPSC frequency and amplitude recorded 60 min after LTP protocol in WT or IL-1R8 KO neurons, treated as above. Analysis of normalized mEPSC frequency and amplitude reveals that only WT neurons and IL1-Ra-treated IL-1R8 KO neurons undergo LTP. Number of recorded neurons: 6 (WT, no LTP), 6 (WT, + LTP), 8 (WT, IL1Ra, no LTP), 8 (WT, IL1Ra, + LTP), 9 (IL-1R8 KO, no LTP), 6 (IL-1R8 KO, + LTP), 8 (IL-1R8 KO, IL1Ra, no LTP), 12 (IL-1R8 KO, IL1Ra, + LTP), Mann-Whitney test. (G) Immunocytochemical staining for PSD-95 in GFP-transfected WT neurons treated or not with IL-1β (40 ng/ml, overnight) and subjected or not to LTP stimulation. Scale bar 5 μm. (H and I) Quantitative analysis of mushroom and thin spine density. Number of analyzed neurons: 14 (WT, no LTP), 16 (WT, + LTP), 28 (WT, IL-1β, no LTP), 27 (WT, IL-1β, + LTP), one-way ANOVA analysis of variance followed by post hoc Tukey test. (J) Quantitative analysis of PSD-95 density. Number of analyzed neurons: 9 (WT, no LTP), 13 (WT, + LTP), 15 (WT, IL-1β, no LTP), 15 (WT, IL-1β, + LTP), one-way ANOVA analysis of variance followed by post hoc Tukey test. Data indicate that application of IL-1β prevents synaptic potentiation.
Figure 5 with 1 supplement
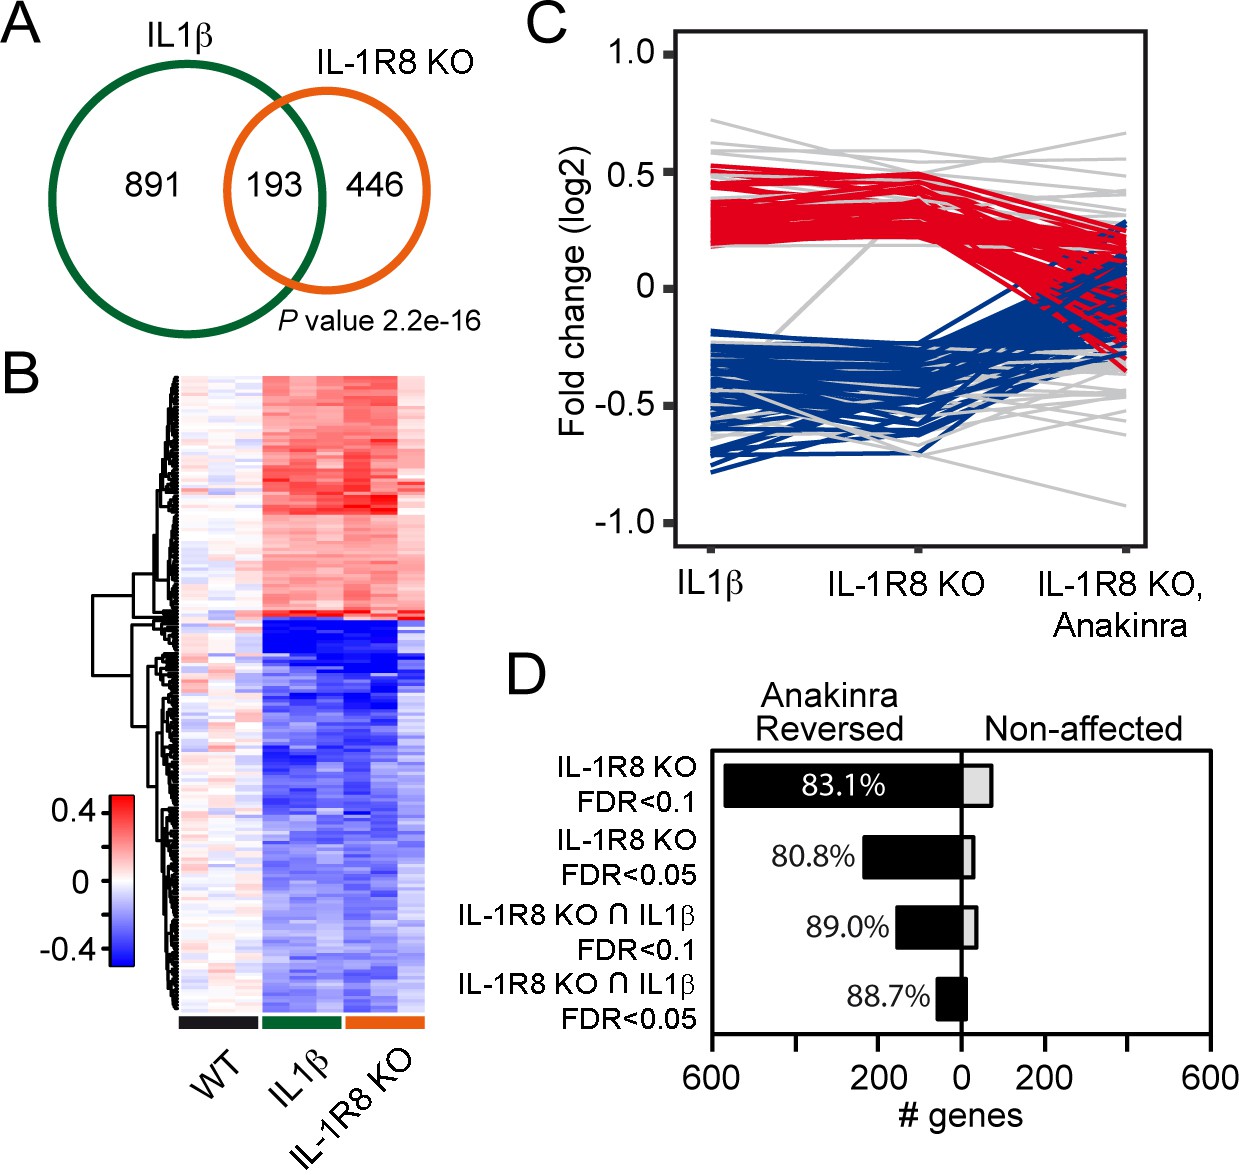
Transcriptomic analysis of cortices from WT mice treated with IL-1β and IL-1R8 KO mice reveals common genes with altered regulation, and reversal of altered expression upon treatment of IL-1R8 KO mice with the IL-1β antagonist Anakinra.
(A) Venn diagram showing significant overlap in the number of Differentially Expressed (DE) genes between conditions (P value = 2.2e-16, Fischer’s exact test). IL1β labels DE genes after IL1β administration and IL-1R8 KO show DE genes in IL-1R8 KO mice. (B) Heatmap showing a hierarchical clustering of the genes (rows) based on fold changes of expression in each sample versus the average level in the WT condition. Color sidebar for the samples is indicative of the condition: WT (black), treatment with IL-1β (green), or IL-1R8 KO (orange). The inset key shows the color scale of the fold change matrix (log2 values), from blue (downregulated genes) to red (upregulated genes), and white for non-regulated genes. (C) Line chart showing fold change (log2 values) against condition (IL1β, IL-1R8 KO, IL-1R8 KO + Anakinra) for DE genes in IL-1R8 KO mice (FDR < 0.1) and also upon IL1β administration to WT mice (FDR < 0.1, 193 genes). Genes that were reversed upon treatment of IL-1R8 KO mice with Anakinra are shown in red (96 upregulated genes) or blue (60 downregulated genes). Genes that were not reversed by Anakinra are shown in light grey (37 genes). (D) Bar graph showing the absolute number of genes that were either reversed or non-affected by treatment of IL-1R8 KO mice with Anakinra. Percentage of reversed genes over the total of DE genes in each gene list is also shown. DE gene lists are as follows: IL-1R8 KO FDR < 0.1 (639 genes); IL-1R8 KO FDR < 0.05 (264 genes); IL-1R8 KO ∩ IL1β FDR < 0.1 (193 genes); IL-1R8 KO ∩ IL1β FDR < 0.05 (71 genes). Reversed genes are defined as not found to be DE using the indicated significance threshold in each group, in the comparison of IL-1R8 KO + Anakinra versus WT mice, and those that were differentially expressed in this comparison but in the opposite direction found in IL1β and IL-1R8 KO conditions.
Figure 5—figure supplement 1
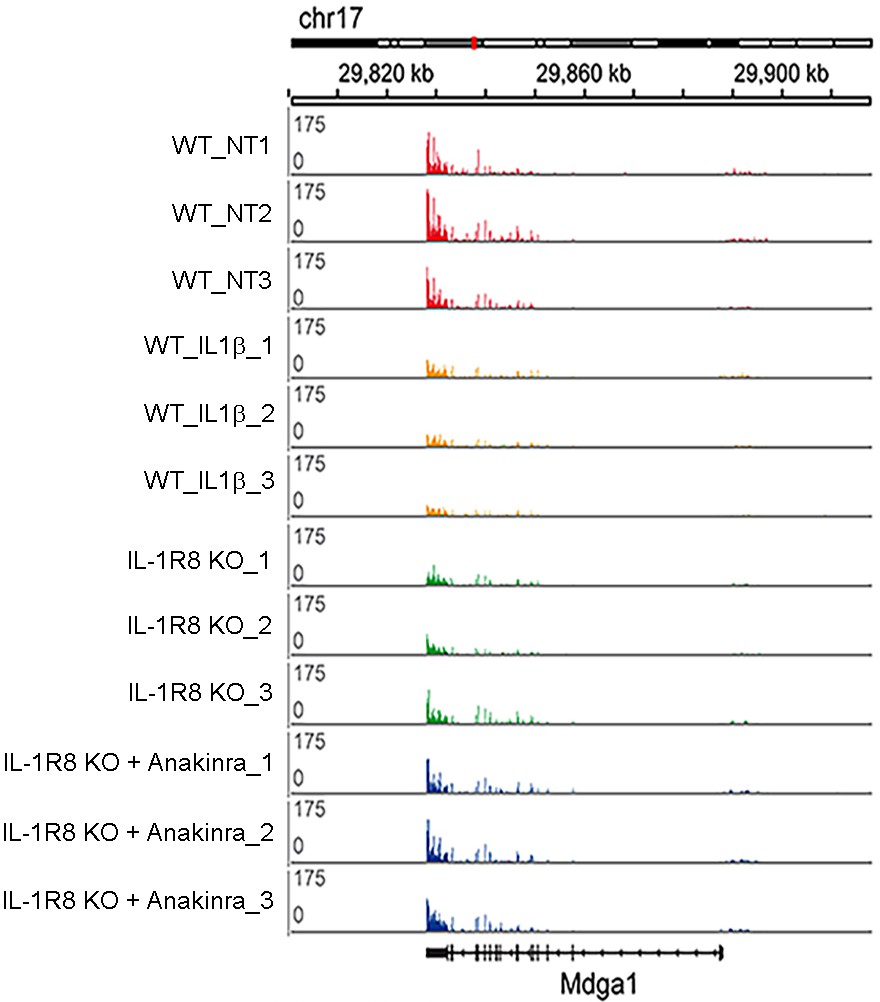
RNA-seq profiles in the cortex of WT, WT treated with IL-1β, IL-1R8 KO mice, and IL-1R8 KO mice treated with Anakinra.
RNA-seq profiles at the Mdga1 locus presenting downregulation of transcript levels in WT mice in response to IL-1β treatment. Transcript levels for Mdga1 are also reduced in the cortex of IL-1R8 KO mice. Administration of Anakinra to IL-1R8 KO mice restored Mdga1 transcript levels to that of WT ones. Note the very high reproducibility of the profiles between samples. Mdga1 is involved in maintaining the proper balance between excitatory and inhibitory synapses (Pettem et al., 2013).
Figure 6
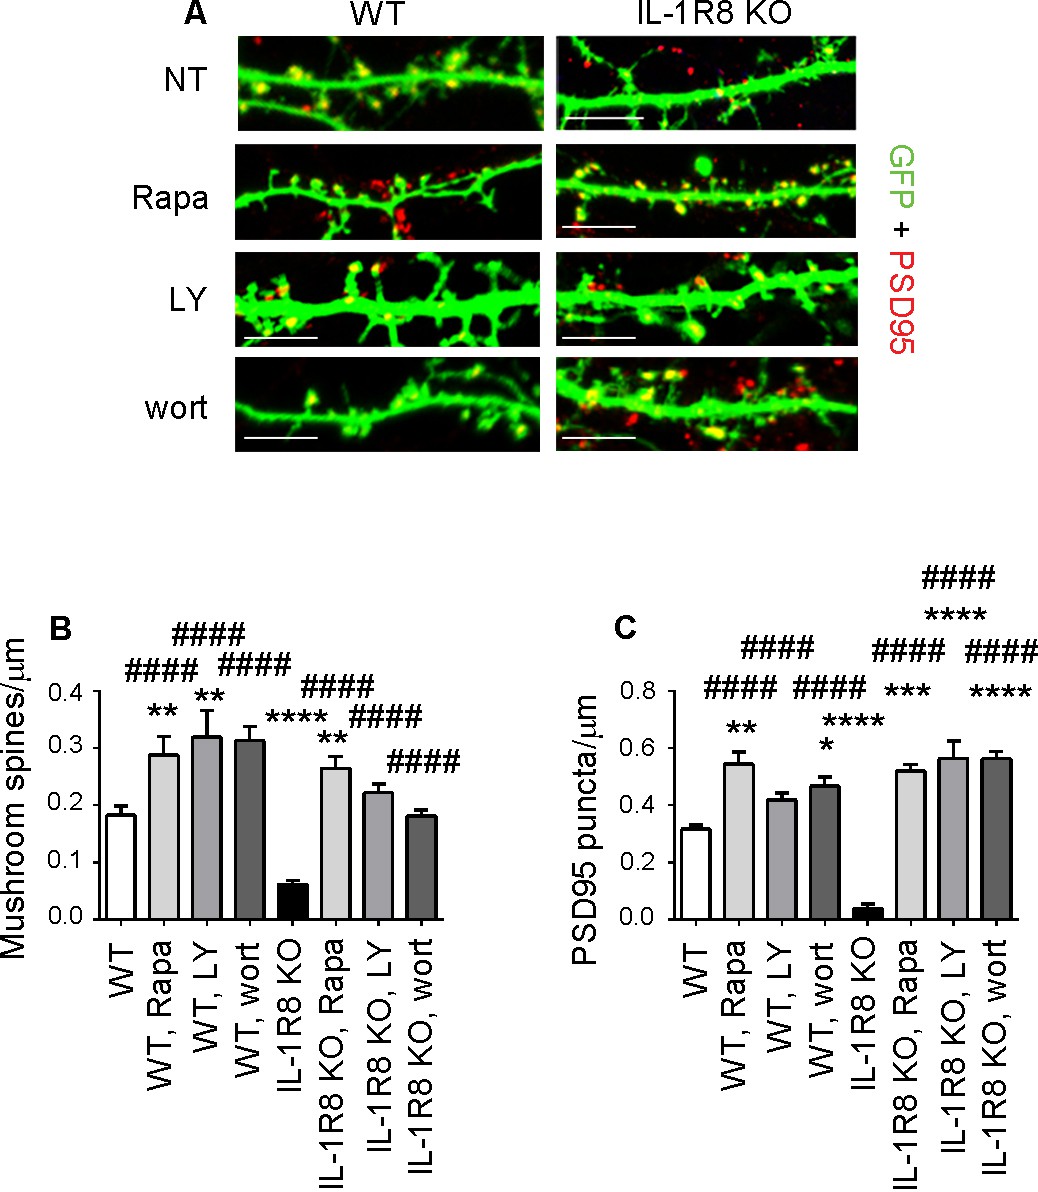
Inhibition of mTOR signalling restores LTP in IL-1R8 KO neurons.
(A) PSD-95 immunocytochemical staining of GFP-transfected 16 DIV hippocampal cultures from WT or IL-1R8 KO mice. At DIV 15 neurons were treated with rapamycin (Rapa, 20 nM), LY294002 (LY, 30 μM) or wortmannin (wort, 20 nM) overnight (14 hr). Scale bar, 5 μm. (B) Quantitative analysis of mushroom spine density. Number of analyzed neurons: 36 (WT), 17 (WT, Rapa), 10 (WT, LY), 5 (WT, Wort), 42 (IL-1R8 KO), 35 (IL-1R8 KO, Rapa), 28 (IL-1R8 KO, LY), 30 (IL-1R8 KO, Wort); one-way ANOVA analysis of variance followed by post hoc Tukey test. (C) Quantitative analysis of PSD-95 puncta density. Number of analyzed neurons: 17 (WT), 7 (WT, Rapa), 9 (WT, LY), 11 (WT, Wort), 9 (IL-1R8 KO), 15 (IL-1R8 KO, Rapa), 15 (IL-1R8 KO, LY), 18 (IL-1R8 KO, Wort); one-way ANOVA analysis of variance followed by post hoc Tukey test. Data indicate that inhibitors of the mTOR pathway restore synaptic potentiation. * indicates significance compared to WT, # indicates significance compared to IL-1R8 KO.
Figure 7
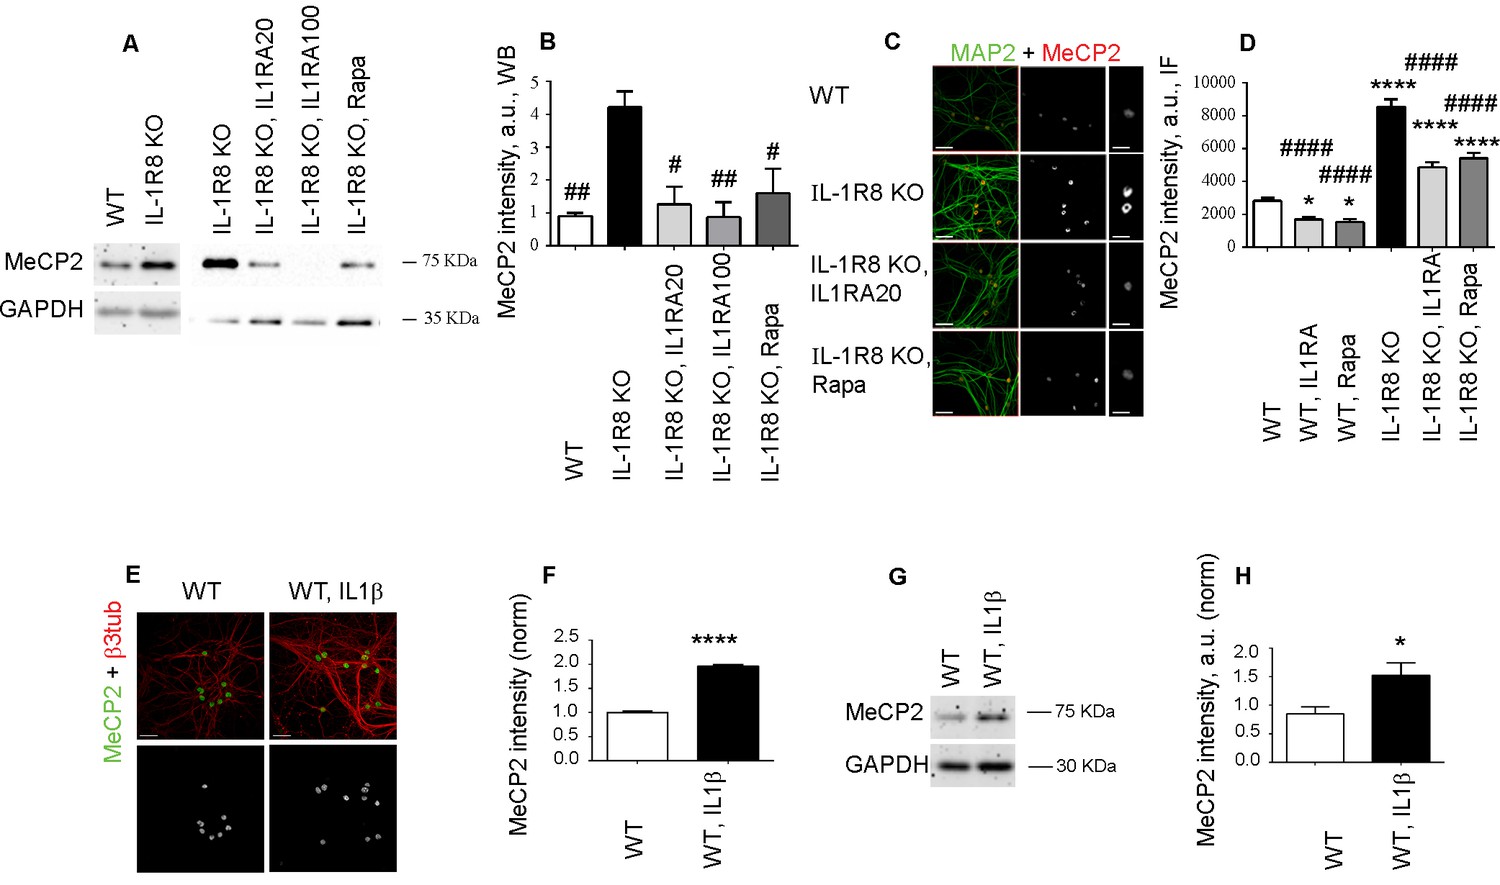
IL-1R8 KO neurons display higher MeCP2 levels that are responsible for LTP defects in IL-1R8 KO neurons.
(A) MeCP2 expression analyzed by western blotting in cultured neurons from WT or IL-1R8 KO neurons treated or not with IL-1Ra (20 ng/ml), IL-1Ra (100 ng/ml) or Rapa (20 nM). A higher MeCP2 expression is detectable in IL-1R8 KO neurons, which is reduced by IL-1Ra or Rapa. (B) Quantitative analysis of MeCP2 expression. Number of replicates: 3 (WT), 3 (IL-1R8 KO), 3 (IL-1R8 KO, IL1Ra 20), 3 (IL-1R8 KO, IL1Ra 100), 3 (IL-1R8 KO, Rapa); one-way ANOVA analysis of variance followed by post hoc Tukey test. (C) MeCP2 and MAP2 immunocytochemical staining of 16 DIV hippocampal WT or IL-1R8 KO neurons treated overnight (14 hr) with vehicle, IL1Ra (20 ng/ml) or Rapa (20 nM). Scale bar, 40 μm (low magnification image), 20 μm (insert). (D) Quantitative analysis of MeCP2 immunoreactivity in neurons treated as above. Number of analyzed neurons: 88 (WT), 60 (WT, IL1Ra), 55 (WT, Rapa), 52 (IL-1R8 KO), 66 (IL-1R8 KO, IL1Ra), 81 (IL-1R8 KO, Rapa); one-way ANOVA analysis of variance followed by post hoc Tukey test. (E) Immunocytochemical staining for MeCP2 and β3-tubulin of 16 DIV WT hippocampal neurons, exposed or not to IL1β (40 ng/ml) overnight. Scale bar, 40 μm. (F) Quantitative analysis of MeCP2 immunoreactivity reveals higher MeCP2 levels in IL1β treated neurons. Number of analyzed neurons: 288 (WT), 227 (WT, IL1β); Student t test. (G and H) Representative western blotting (G) and quantitative analysis (H) of MeCP2 expression in WT neurons treated with IL-1β (40 ng/ml). Number of replicates, WT: n = 5; WT + IL1β 40: n = 5 independent experiments. Mann Whitney test. * indicates significance compared to WT, # indicates significance compared to IL-1R8 KO.
Figure 8
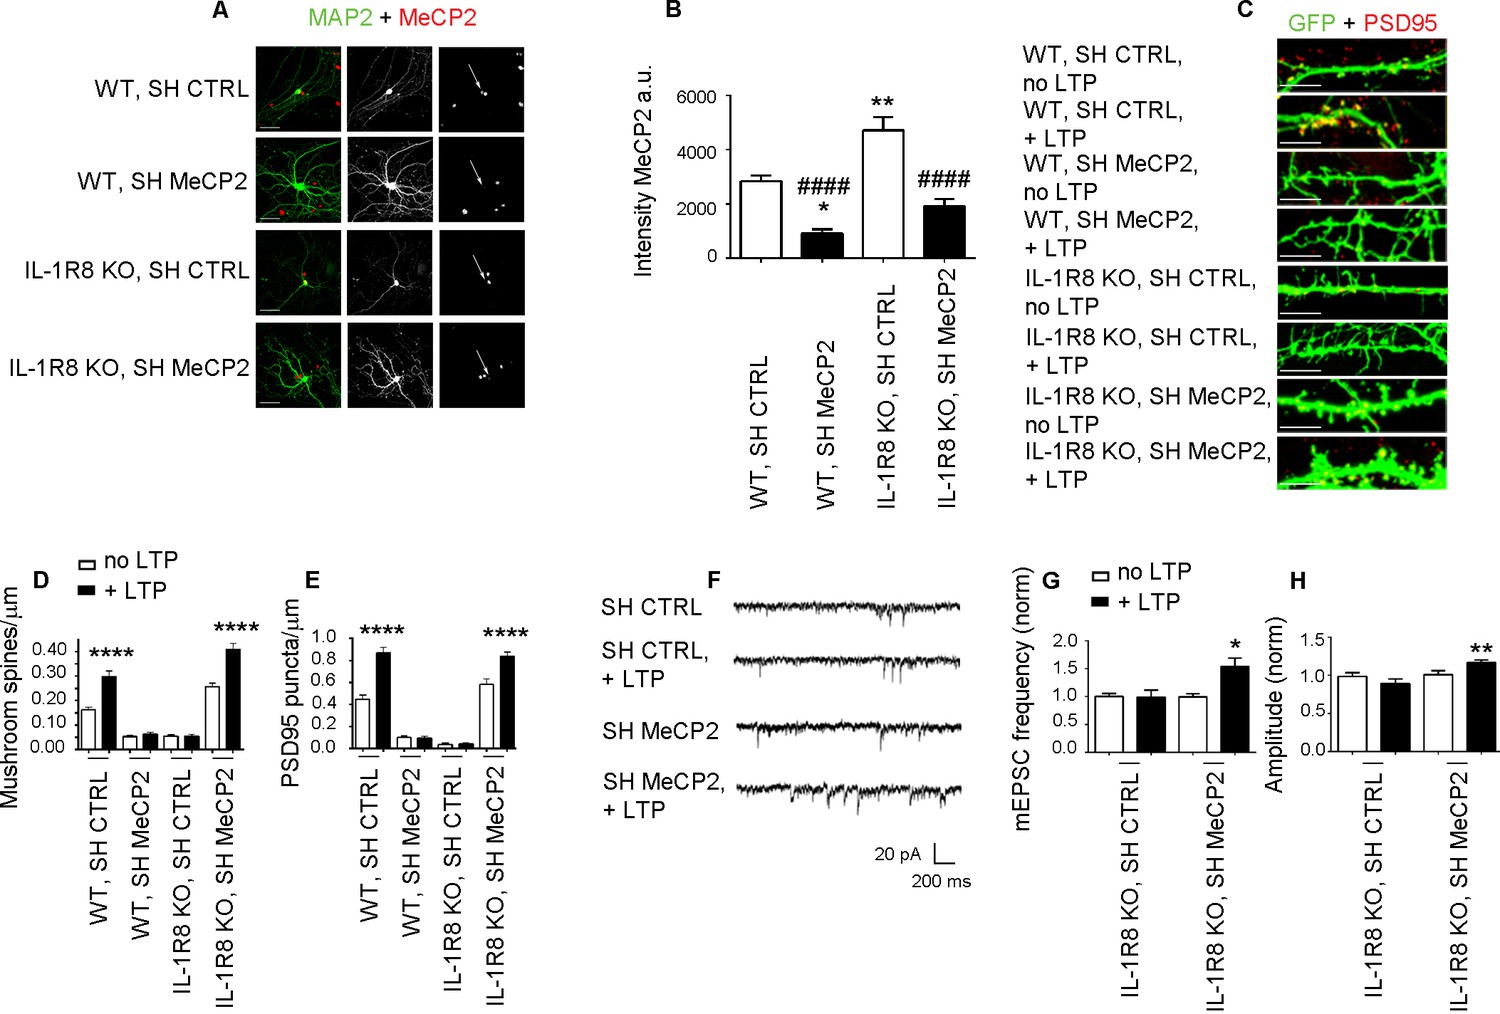
Higher MeCP2 levels are responsible for LTP defects in IL-1R8 KO neurons.
(A) MeCP2 and MAP2 immunocytochemical staining and (B) quantitative analysis of MeCP2 immunoreactivity in 16 DIV WT and IL-1R8 KO neurons transfected with SH CTRL or SH MeCP2. Scale bar 40 μm. Number of analyzed neurons: 23 (WT, SH CTRL), 28 (WT, SH MeCP2), 46 (IL-1R8 KO, SH CTRL), 40 (IL-1R8 KO, SH MeCP2); one-way ANOVA analysis of variance followed by post hoc Tukey test. * indicates significance compared to WT + SH CTRL, # indicates significance compared to IL-1R8 KO + SH CTRL. (C) PSD-95 immunocytochemical staining of SH CTRL- or SH MeCP2-transfected, DIV 16 hippocampal cultures from WT or IL-1R8 KO mice. Neurons were transfected at DIV 12 and the LTP protocol was applied at DIV 16. Scale bar, 5 μm. (D) Quantitative analysis of mushroom spine density in WT and IL-1R8 KO neurons treated as above. Number of analyzed neurons: 30 (WT, SH CTRL, no LTP), 29 (WT, SH CTRL, + LTP), 30 (WT, SH MeCP2, no LTP), 29 (WT, SH MeCP2, + LTP), 59 (IL-1R8 KO, SH CTRL, no LPT), 60 (IL-1R8 KO, SH CTRL, + LTP), 54 (IL-1R8 KO, SH MeCP2, no LTP), 58 (IL-1R8 KO, SH MeCP2, + LTP); one-way ANOVA analysis of variance followed by post hoc Tukey test. (E) Quantitative analysis of PSD-95 density. Number of analyzed neurons: 17 (WT, SH CTRL, no LTP), 15 (WT, SH CTRL, + LTP), 16 (WT, SH MeCP2, no LTP), 15 (WT, SH MeCP2, + LTP), 15 (IL-1R8 KO, SH CTRL, no LTP), 15 (IL-1R8 KO, SH CTRL, + LTP), 15 (IL-1R8 KO, SH MeCP2, no LTP), 17 (IL-1R8 KO, SH MeCP2, + LTP); one-way ANOVA analysis of variance followed by post hoc Tukey test. Data indicate that reduction of MeCP2 expression restores synaptic potentiation. (F) Representative traces of mEPSC recorded from IL-1R8 KO neurons transfected with SH CTRL or SHMeCP2 before and after LTP induction. (G and H) Quantitation of mEPSC frequency and amplitude of neurons treated as above. Analysis of normalized mEPSC frequency and amplitude reveals that only neurons transfected with SH MeCP2 undergo LTP. Number of recorded neurons: 14 (IL-1R8 KO, SH CTRL, no LTP), 7 (IL-1R8 KO, SH CTRL, + LTP), 19 (IL-1R8 KO, SH MeCP2, no LTP), 7 (IL-1R8 KO, SH MeCP2, + LTP). Mann Whitney test.
Figure 9
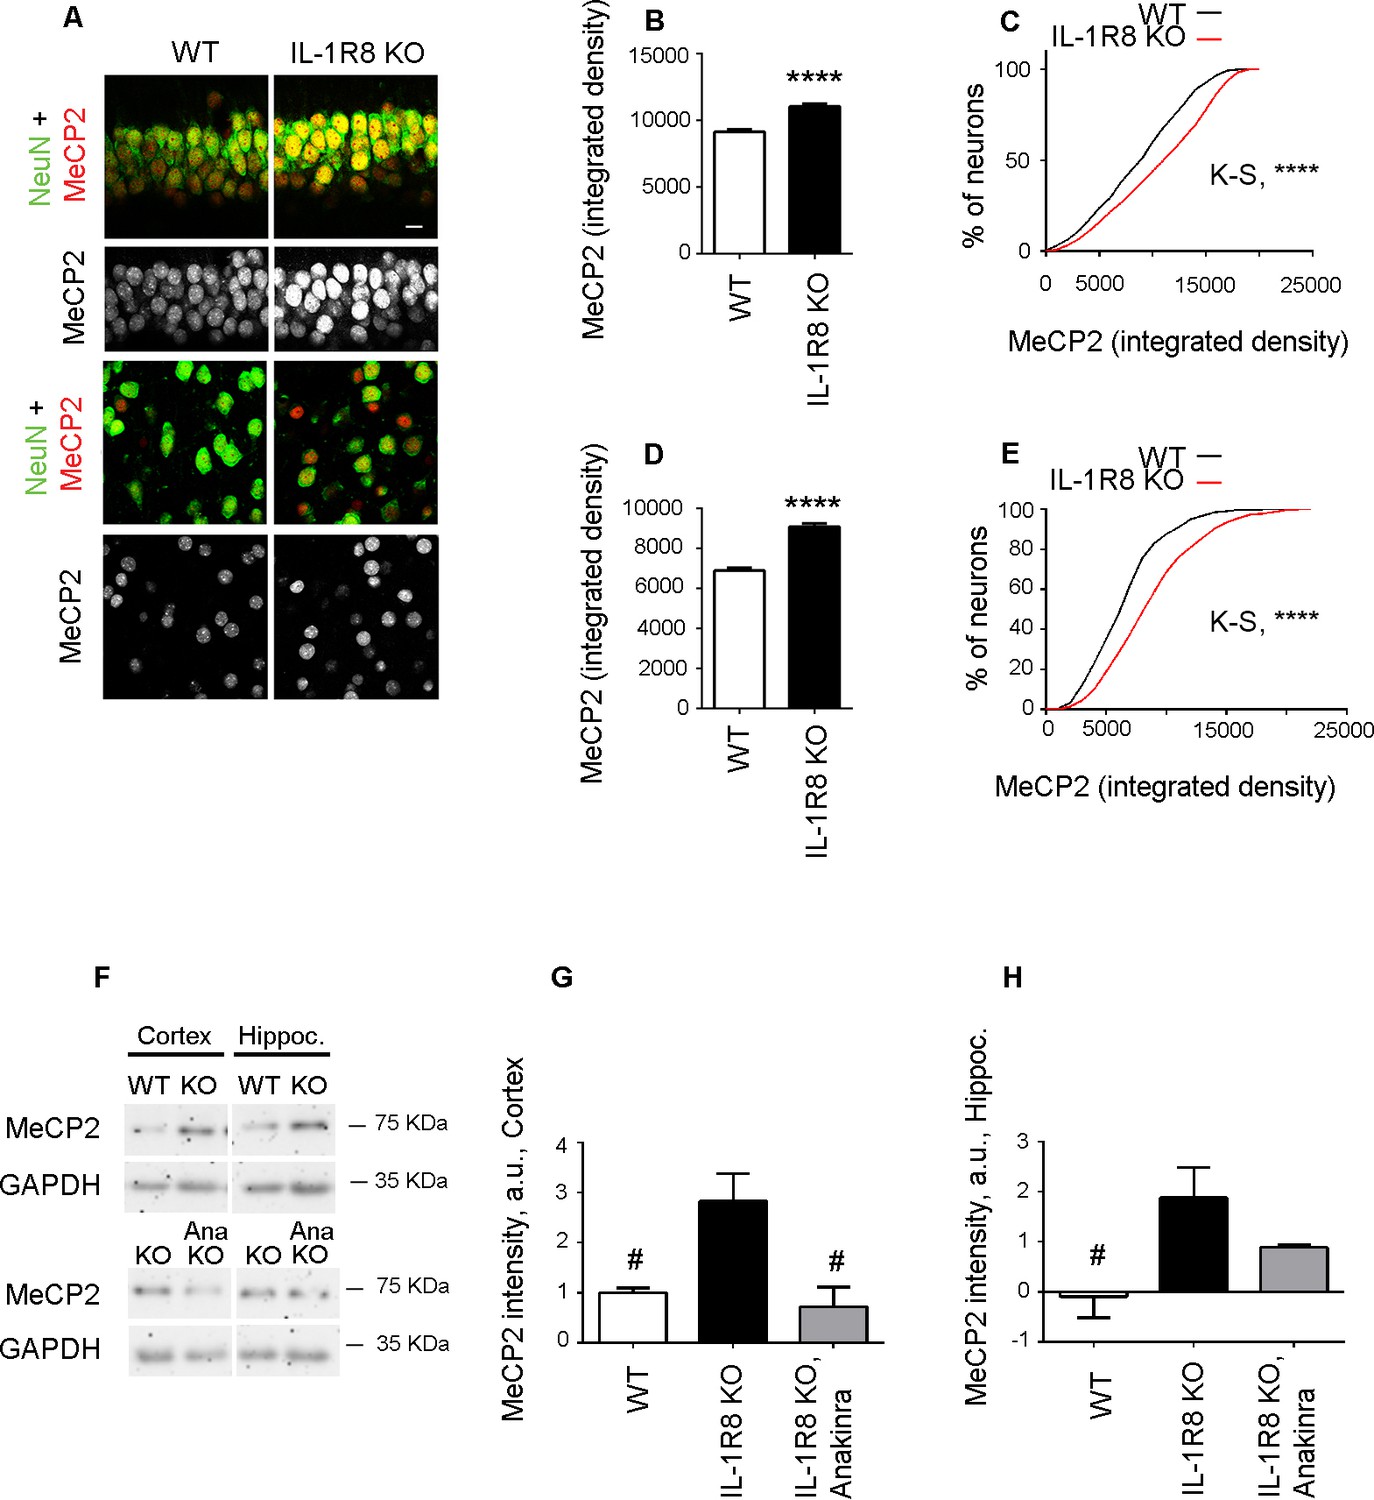
Higher MeCP2 levels in the brain of IL-1R8 KO mice.
(A) Representative images of brain sections (CA1 hippocampus, upper panels and cortex, lower panels) of WT and IL-1R8 KO mice (1 month old) stained for MeCP2 and NeuN, as indicated. (B-E) Graphs show quantitation of MeCP2 mean integrated density values and the cumulative distributions of neuronal MeCP2 integrated density values in CA1 hippocampal neurons (B and C) and cortical neurons (D and E). Number of analyzed mice and neurons: WT: n = 3 mice, hippocampal neurons = 572, cortical neurons = 481. IL-1R8 KO: n = 3 mice, hippocampal neurons = 559, cortical neurons = 471. Statistical comparison: Mann-Whitney Test for B and D; KolmogorovSmirnov Comparison (http://www.physics.csbsju.edu/stats/KS-test.html), D values are: 0,2084 with a corresponding p<0.0001 (panel C) and 0,1396 with a corresponding p=0.0005 (panel E). (F-H) Western blotting (F) and quantitative analysis (G and H) of MeCP2 expression in cortices and hippocampi of 3 months old WT and IL-1R8 KO mice or in IL-1R8 KO mice treated with Anakinra (30 mg/kg) for 3 days. Number of analyzed mice: 6 WT, 5 IL-1R8 KO and 5 IL-1R8 KO + Anakinra (G); 6 WT, 6 IL-1R8 KO and 4 IL-1R8 KO + Anakinra (H). Statistical test: one-way ANOVA analysis of variance followed by post hoc Tukey test.
Figure 10
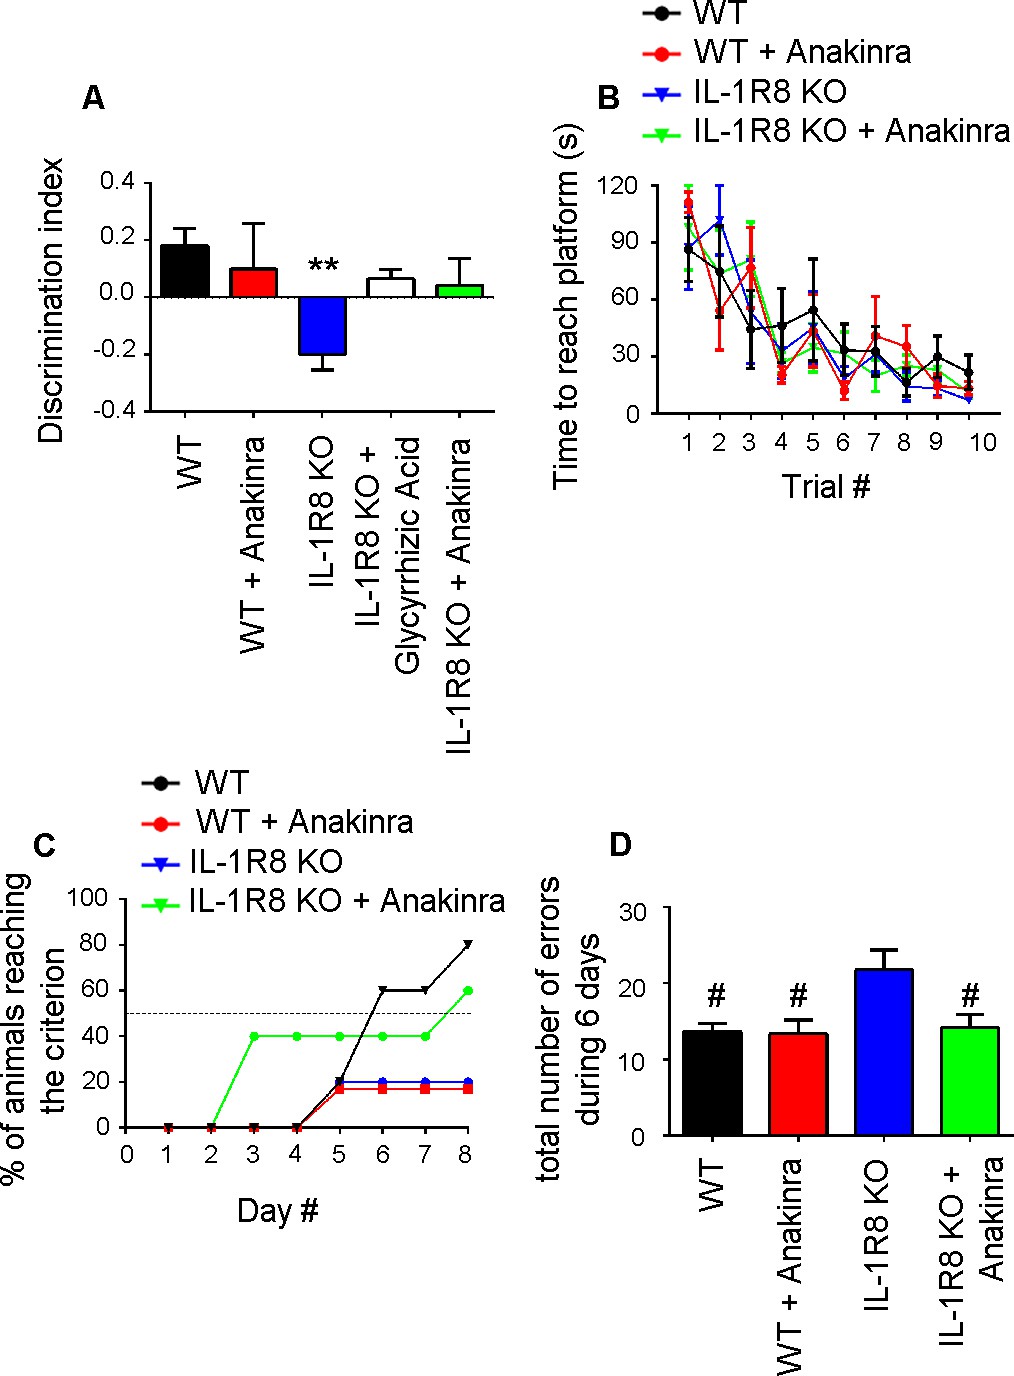
Anakinra rescues behavioral defects in IL-1R8 KO mice.
(A) Analysis of novel-place object recognition task in WT and IL-1R8 KO mice shows a defect in spatial learning in IL-1R8 KO mice (one-way ANOVA followed by Bonferroni multiple comparison test). 3 days i.p. treatment with 50 mg/kg glycyrrhizic acid or 30 mg/kg Anakinra ameliorates IL-1R8 KO mice performance. Number of analyzed mice: 15 (WT), 6 (WT+Anakinra), 18 (IL1-R8 KO), 3 (IL1-R8 KO+glycyrrhizic acid) and 10 (IL1-R8 KO+Anakinra). (B) IL-1R8 deficiency or treatment with Anakinra did not affect the learning performance in the Water Maze navigation task. Number of analyzed mice: 5 (WT), 5 (WT+Anakinra), 5 (IL1-R8 KO), and 5 (IL1-R8 KO+Anakinra). (C) IL1-R8 KO mice displayed impaired spatial memory in the rewarded T-maze task, as indicated by the low percentage of animals reaching the criterion. Treatment with Anakinra ameliorated the performance of IL1-R8 KO mice, while worsening the learning ability of WT. Number of analyzed mice: 5 (WT), 3 (WT+Anakinra), 6 (IL1-R8 KO) and 5 (IL1-R8 KO+Anakinra). (D) IL1-R8 KO mice showed a significant increase in the total number of errors during the acquisition phase as compared to the WT, which was significantly reduced by treatment with Anakinra. One-way ANOVA followed by Tukey’s multiple comparison test. Number of analyzed mice: 6 (WT), 5 (WT+Anakinra), 5 (IL1-R8 KO) and 5 (IL1-R8 KO+Anakinra). All the mice were 3–6 months old.
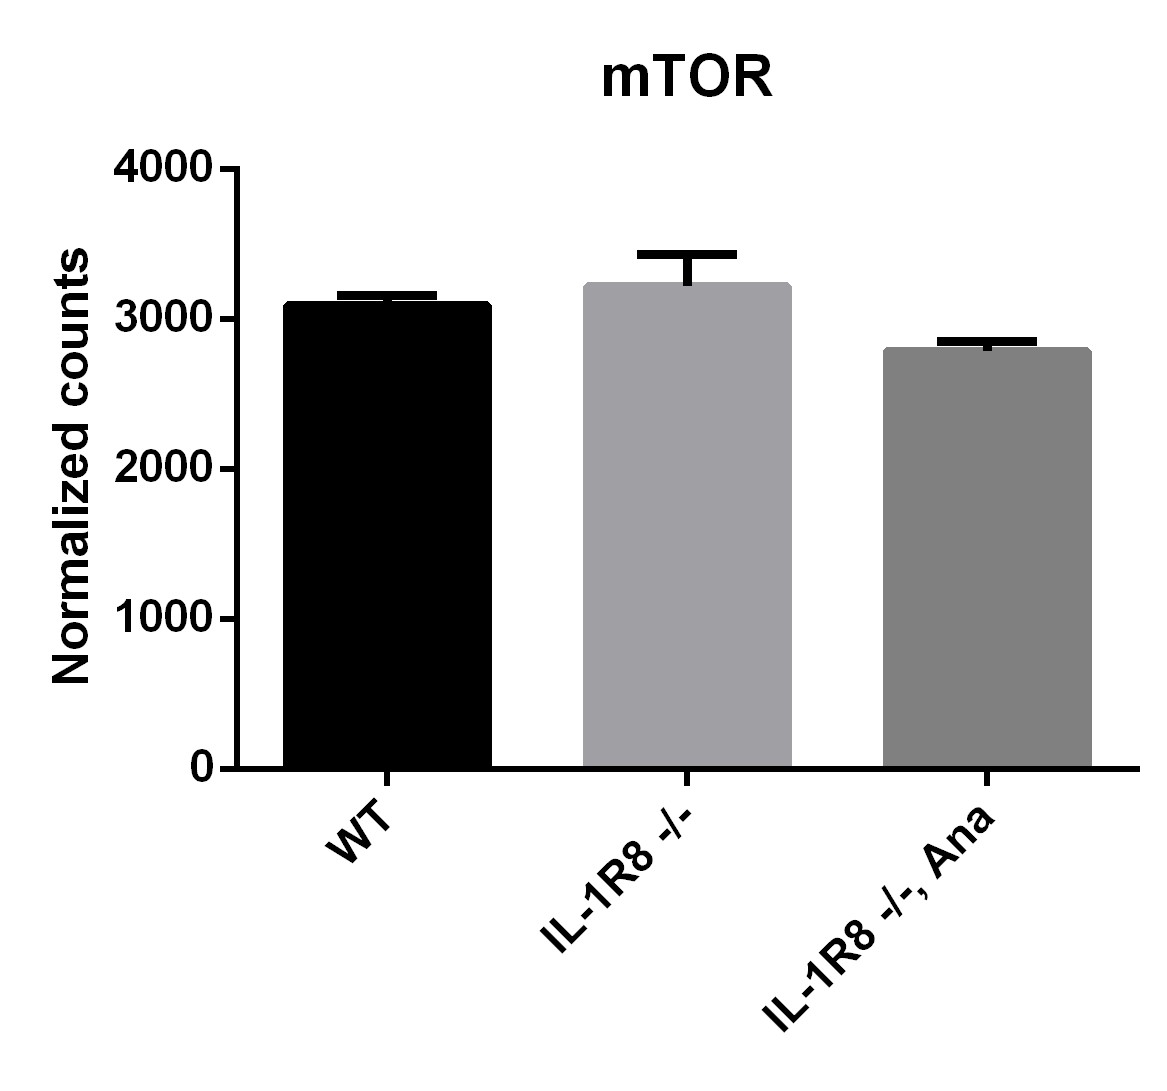
Author response image 1

Author response image 2
Additional files
-
Supplementary file 1
Differentially expressed mRNAs in the hippocampus of IL-1β treated mice
- https://doi.org/10.7554/eLife.21735.014
-
Supplementary file 2
Differentially expressed mRNAs in the hippocampus of IL-1R8 (aka TIR8) KO mice
- https://doi.org/10.7554/eLife.21735.015
-
Supplementary file 3
Genes differentially expressed in the hippocampus of both IL-1β treated mice and IL-1R8 (aka TIR8) KO.
- https://doi.org/10.7554/eLife.21735.016
-
Supplementary file 4
(A) Webgestalt GO-Biological process enrichment analysis for genes differentially expressed after treatment with IL-1β (see Supplementary file 1). (B) Webgestalt GO-Biological process enrichment analysis for genes differentially expressed in IL-1R8 KO mice (see Supplementary file 2). (C) Full Webgestalt GO enrichment analysis (BP, MF and CC) for genes differentially expressed both in IL-1R8 KO mice and in IL-1β treated mice (see Supplementary file 3).
- https://doi.org/10.7554/eLife.21735.017
-
Supplementary file 5
Raw data of all the values used for graphics in the different panels.
- https://doi.org/10.7554/eLife.21735.018
-
Supplementary file 6
Statistic analysis of the graphics in the different panels.
- https://doi.org/10.7554/eLife.21735.019
Download links
A two-part list of links to download the article, or parts of the article, in various formats.
Downloads (link to download the article as PDF)
Open citations (links to open the citations from this article in various online reference manager services)
Cite this article (links to download the citations from this article in formats compatible with various reference manager tools)
Lack of IL-1R8 in neurons causes hyperactivation of IL-1 receptor pathway and induces MECP2-dependent synaptic defects
eLife 6:e21735.
https://doi.org/10.7554/eLife.21735


