Frequent exchange of the DNA polymerase during bacterial chromosome replication
- McGill University, Canada
- University of Oxford, United Kingdom
- University of York, United Kingdom
Figures
Figure 1 with 3 supplements

Most replisome subunits exchange frequently with the diffusing pool.
(A) Model illustrating the architecture of a replisome at the E. coli replication fork. (B) Representative fluorescence images of FRAP experiments for the Pol III α subunit and the DnaB helicase. Cell boundaries shown as white lines, red circle shows the location of the bleached focus. (C) Representative examples of the FRAP curves for Pol III α subunit (N = 48) and DnaB (N = 96). Red line shows a reaction-diffusion model fit to the data, dashed grey lines show SE for the model. Dashed blue line represents the estimated maximum possible fluorescence recovery after correcting for photobleaching. (D) Analysis summary of the replisome by FRAP. Bars represent average bound-times. Red squares represent level of recovery normalised to the intensity before bleaching. Dashed blue line represents maximum possible fluorescence recovery. It was not possible to estimate the bound-time for DnaB. Error bars represent SE.
Figure 1—figure supplement 1
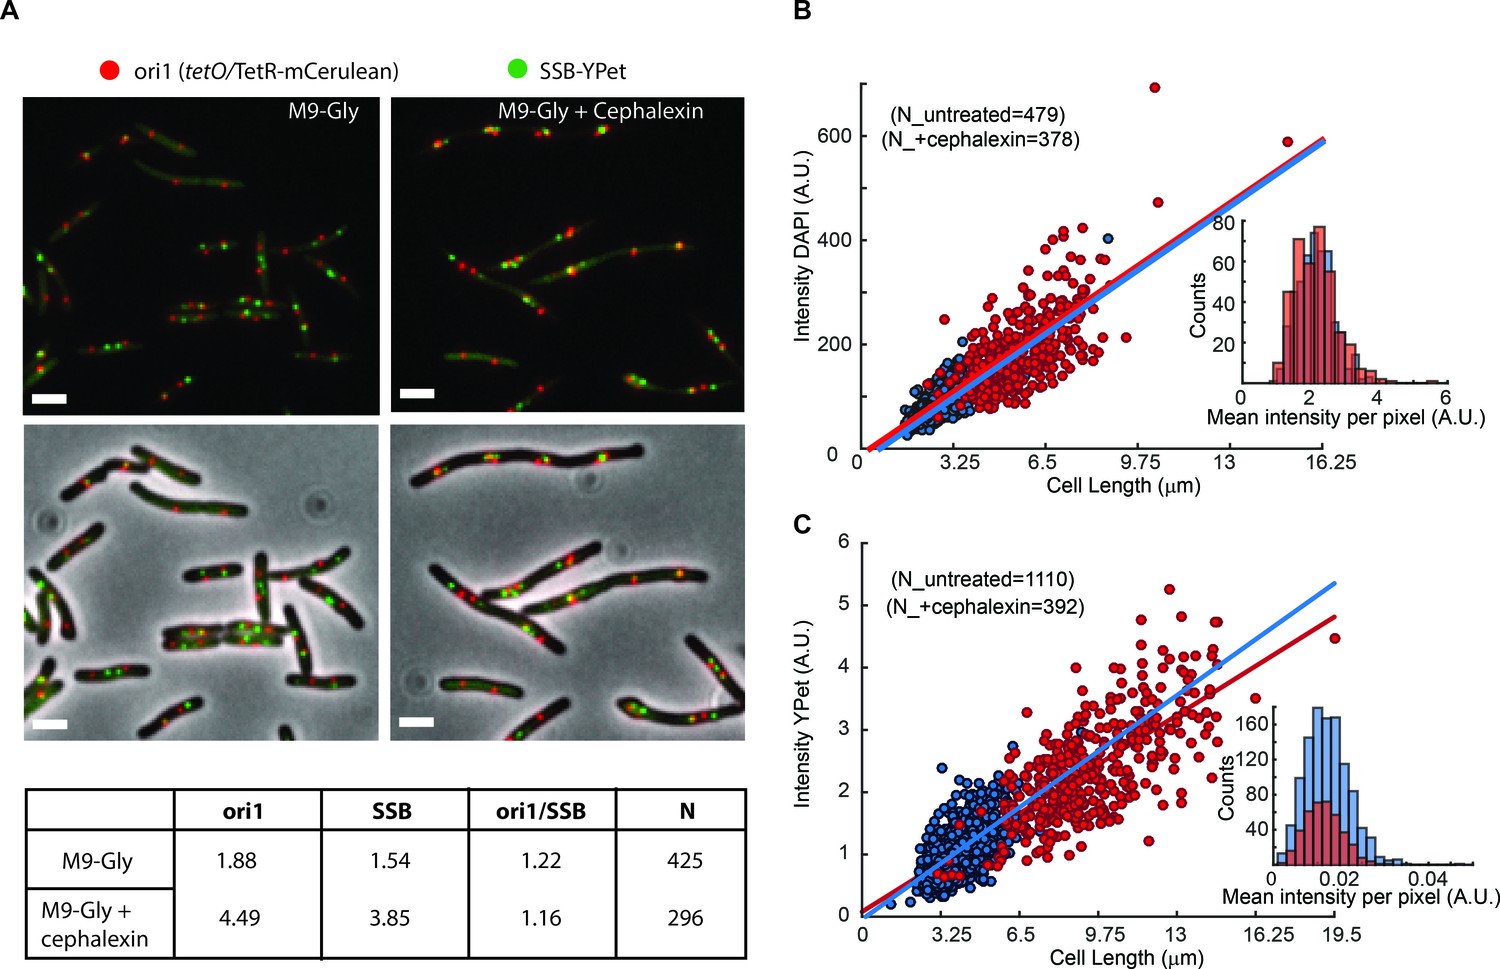
Artificial elongation of cells by cephalexin treatment does not interfere with DNA replication or protein expression.
(A) Representative images of non-treated (M9-Gly) or cells treated with 40 µg/ml of cephalexin (M9 Gly + Cephalexin) are shown. The position of the ori1 locus (mapped at 3908 kb in the chromosome), labelled by TetR-mCerulean bound to a tetO array, is shown in red, while the position of the replisome component SSB labelled with YPet is shown in green. Top panels do not show the phase contrast. Scale bar represents 2 µm. A table summarizes analysis of this data, showing the number of ori1 and SSB foci per cell, and the ratio between them. (B) Distribution of the total intensity of DAPI signal against cell length in cells untreated (blue dots) and treated with cephalexin for one hour (red dots). Ethanol fixation was used to ensure homogenous permeability to the dye. Fitting to a linear model is shown in the respective colours. The inset shows the distribution of mean intensities per pixel for both conditions. (C) Distribution of the total intensity of ε-YPet signal against cell length in cells untreated (blue dots) and treated with cephalexin for one hour (red dots). Fitting to a linear model is shown in the respective colours. The inset shows the distribution of mean intensities per pixel for both conditions.
Figure 1—figure supplement 2
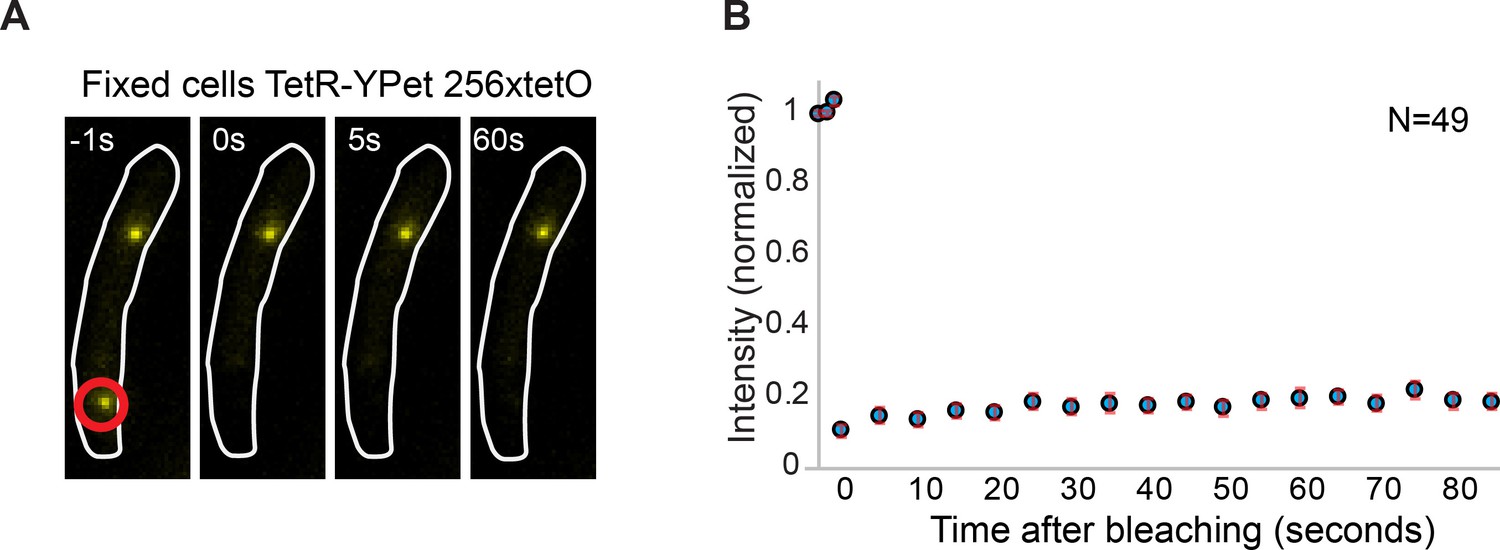
Minimal contribution of YPet photoblinking during FRAP.
(A) Representative fluorescence images of a cell carrying a tetO operator array and expressing TetR-YPet. Cells were fixed with formaldehyde to avoid protein exchange. Cell boundaries are represented with a white line. The point of localized bleaching is shown with a red circle. (B) Average distribution of fluorescence recovery after photobleaching of 49 cells. Note that intensity increase after bleaching is minimal (<5% of the total intensity), consistent with stochastic fluctuations and experimental measurement error. Error bars represent SE.
Figure 1—figure supplement 3
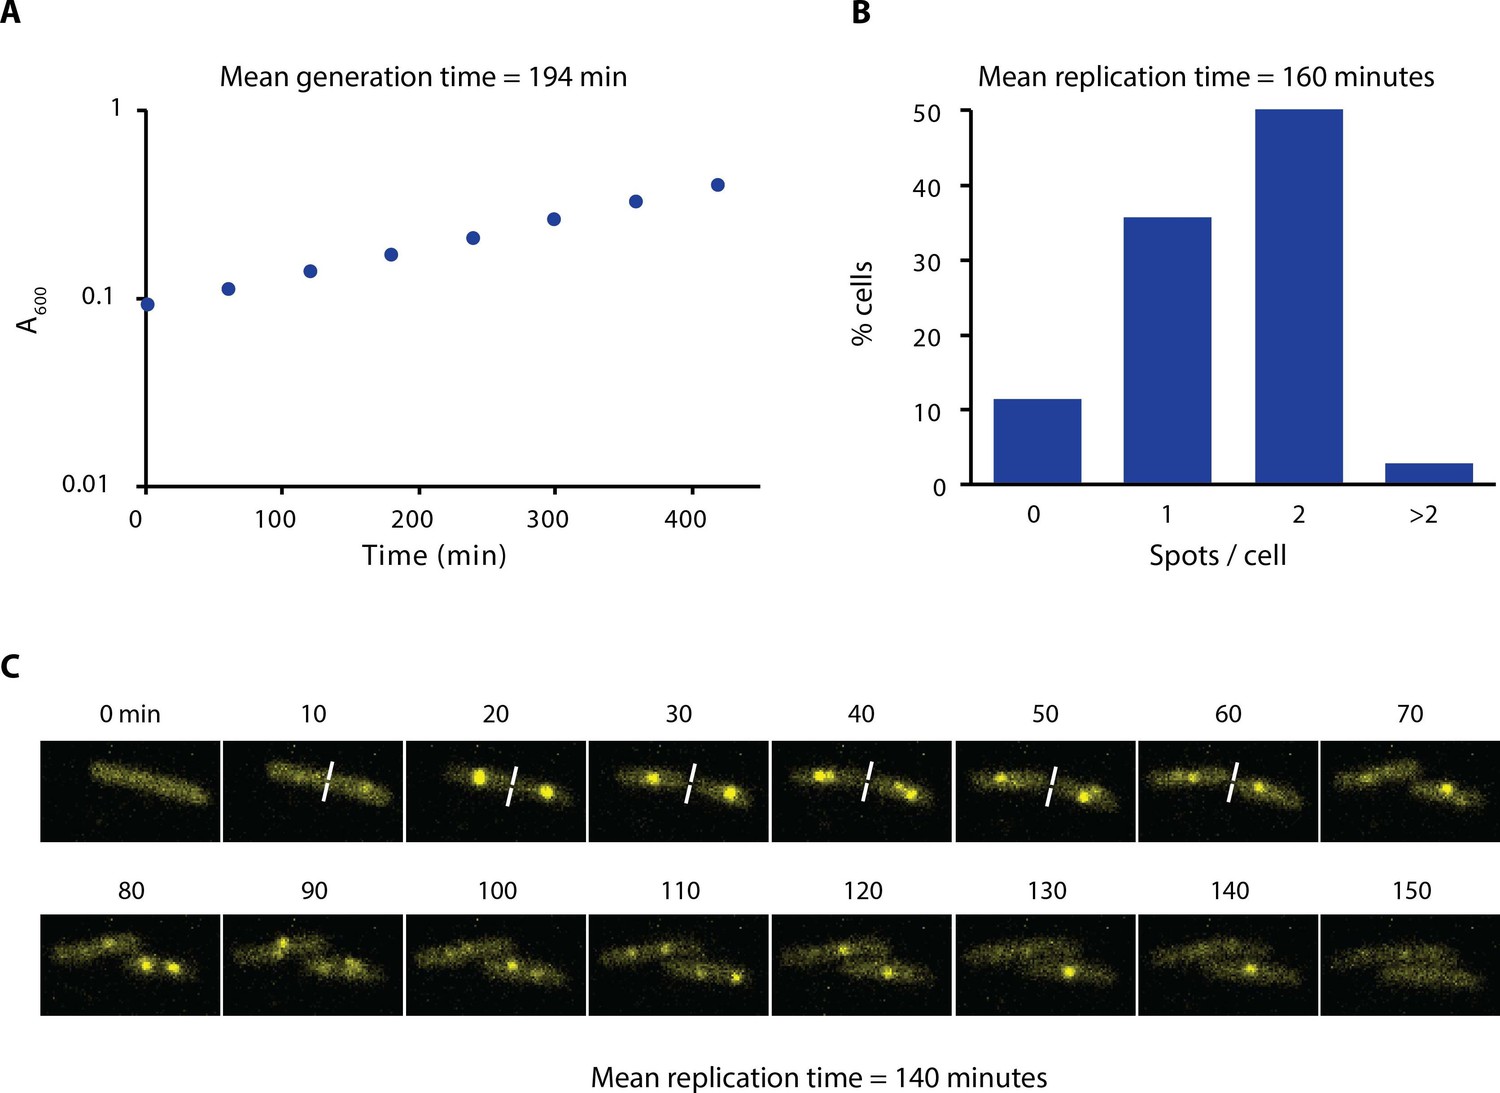
Growth rate and replication time of E. coli in our experimental conditions.
(A) Growth curve of AB1157 in M9-Glycerol at 22°C is shown. Samples were taken every hour for 7 hr. (B) Distribution of the number of spots per cell of a strain carrying ε-YPet grown in M9-Glycerol at 22°C (N = 1403 cells). We estimated the replication time by taking into account the generation time and the number of cells with spots. We made the assumption that initiation of DNA replication occurs at cell birth to account for the uneven distribution of cell ages in the population. (C) Representative images obtained from a time-lapse experiment of a strain carrying SSB-YPet grown on a 1% agarose pad in M9-Glycerol at 22°C. Pictures were taken at 10 min intervals. Replication time was determined from the time point of first appearance of SSB-YPet spot to its subsequent disappearance (N = 56 cells). The average of the two methods (150 min) is reported in the main text.
Figure 2 with 4 supplements
Exchange of Pol III* subassembly and DnaB occur on different timescales.
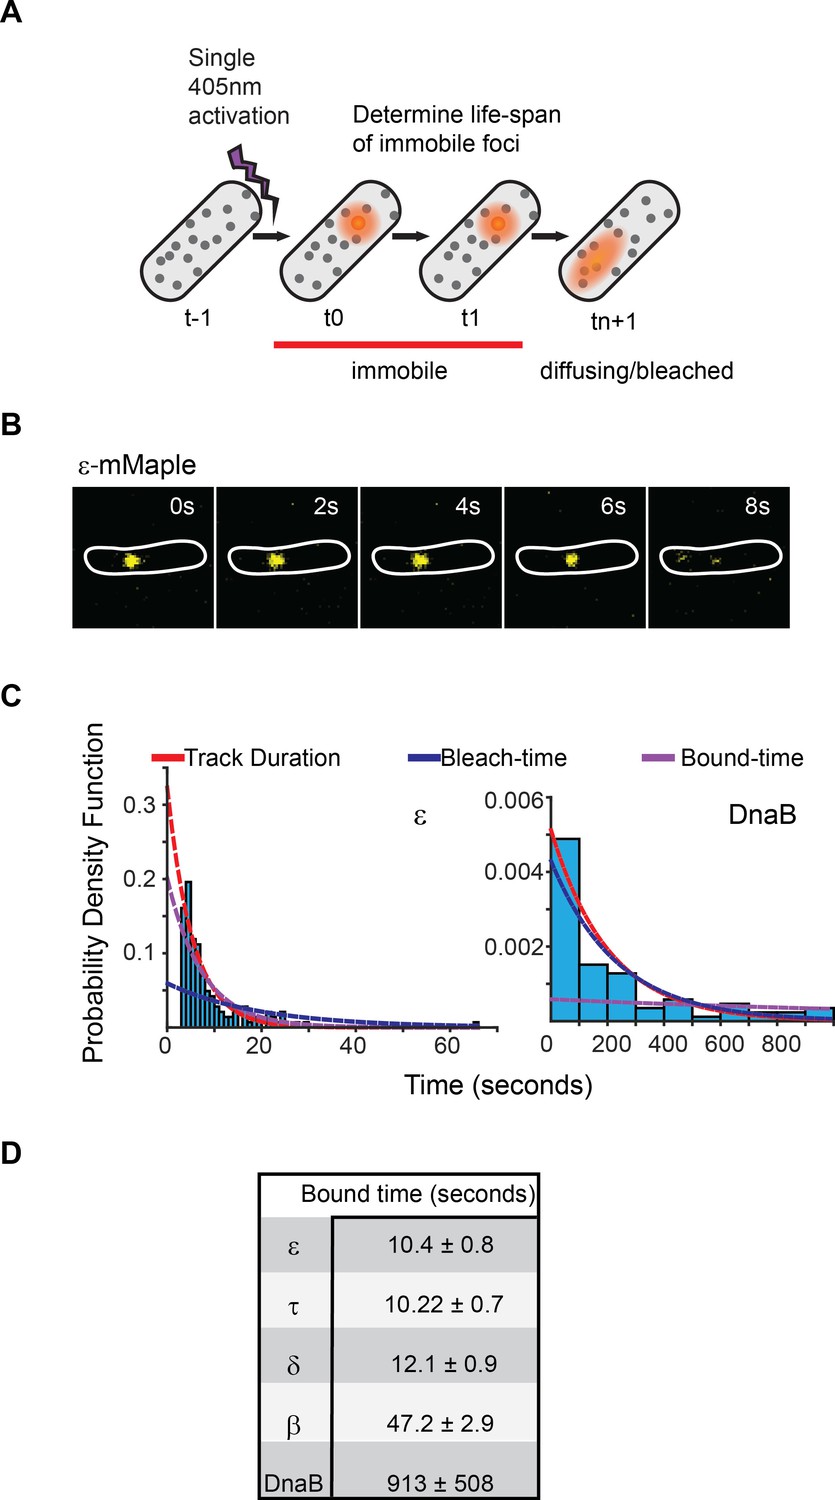
(A) Diagram illustrating the sptPALM experimental design used to measure bound-times. (B) Representative example of the focus life span for the Pol III ε subunit. (C) Representative examples of the distribution of fluorescent foci life-spans (blue bars) for Pol III ε subunit and DnaB, showing fitting of a single-exponential decay model (red line), the estimated bleaching rate in the same conditions (blue line) and the corrected estimated bound-time (purple line). Note that to improve accuracy in single-molecule detection tracks shorter than four localizations were removed in the case of ε but corrected during curve fitting, hence the lower bar near 0 s time point. ε data was collected using 500 ms exposure time and 1 s intervals (N = 143), DnaB data was collected using 2 s exposure time and 10 s intervals (N = 86). The plot for DnaB shows binned data for presentation purposes. (D) Summary of estimated average bound-times. Errors in the table represent SE.
Figure 2—figure supplement 1

Characterisation of mMaple fusions.
(A) Plot showing growth curves of the AB1157 and derivative strains carrying mMaple fusions to replisome components. Experiment was done in M9-Glycerol at 37°C. Average and standard deviation of three experiments are shown. (B) Table that summarizes the results from the growth curve experiments.
Figure 2—figure supplement 2

Minimal exposure to 405 nm activation light allows continuation of cell growth.
(A) Images obtained from an sptPALM experiment of a strain carrying mMaple-DnaB using 2 s exposure times of the 561 nm laser and 2 min intervals (time in minutes). Note the growth of cells despite exposure to a single event of 405 nm wavelength activation and multiple exposures to 561 nm wavelength light. Scale bar = 2 µm. (B) Plot showing lengths of cells over time for eight different cells. The average of doubling-time is similar to the generation time of AB1157 at 22°C.
Figure 2—figure supplement 3
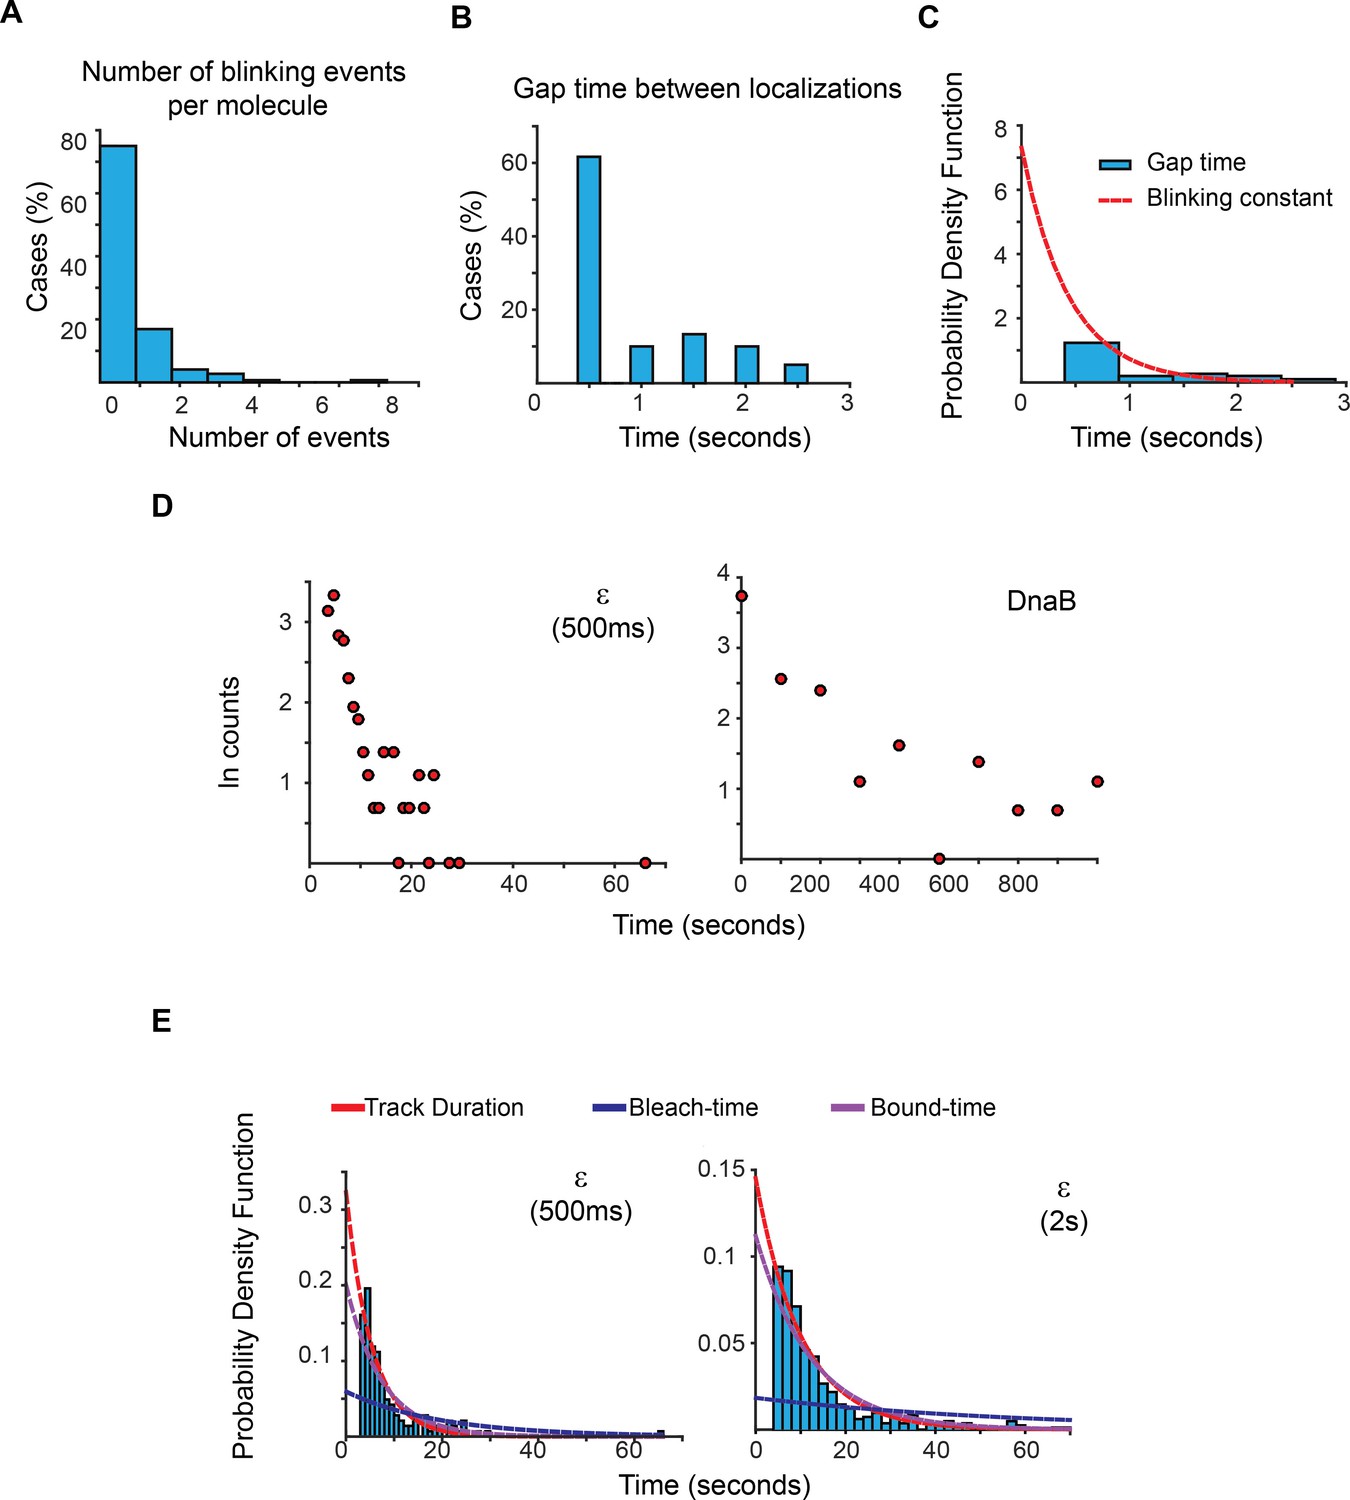
Estimation of photoblinking, test for two binding kinetic regimes and characterisation of the effect of longer 2 s capture rates in our estimation of bound-times.
(A) Frequency of detected short gaps, likely representing photoblinking, during the tracking of a population of LacI-mMaple molecules using 500 ms capture rates. We applied a cut-off threshold at 2.6 s for the maximum duration of photoblinking based on previous characterisation of mMaple (Durisic et al., 2014). More than 75% of the molecules did not show photoblinking (N = 148 molecules). (B) Distribution of gap times between subsequent localizations at the same location of the field of view. Note that most events lasted for only one frame. N = 60 events. (C) We fitted the distribution of gap times to a single exponential function using a truncated form of MLE. This was done to account for the fraction of events shorter than 500 ms, which would be missed in our experiments. Using a 1-frame memory parameter we estimate that our analysis will prematurely terminate less than 7.5%, 3% and 0.0001% of the tracks due to blinking when using a 1 s, 2 s, and 5 s intervals, respectively. (D) Semi-log plots of the data presented in Figure 2C for ε and DnaB. The plots show a relatively linear relation between number of cases and time, which is indicative of a single regime of binding for both subunits. Further support of a single binding behaviour is presented in Supplementary file 1C. (E) Plots showing the PDF curves of bound, bleaching, and tracking times for representative results from a single experiment of ε imaged with 500 ms (left) (N = 143) and 2 s exposure (right) (N = 415). The bound-time was 7.44 s (SE ±1.07 s) and 12.34 s (SE ±1.36 s) for 500 ms and 2 s, respectively. The plot for the 500 ms example is presented to facilitate comparison and is identical to that in Figure 2C.
Figure 2—figure supplement 4
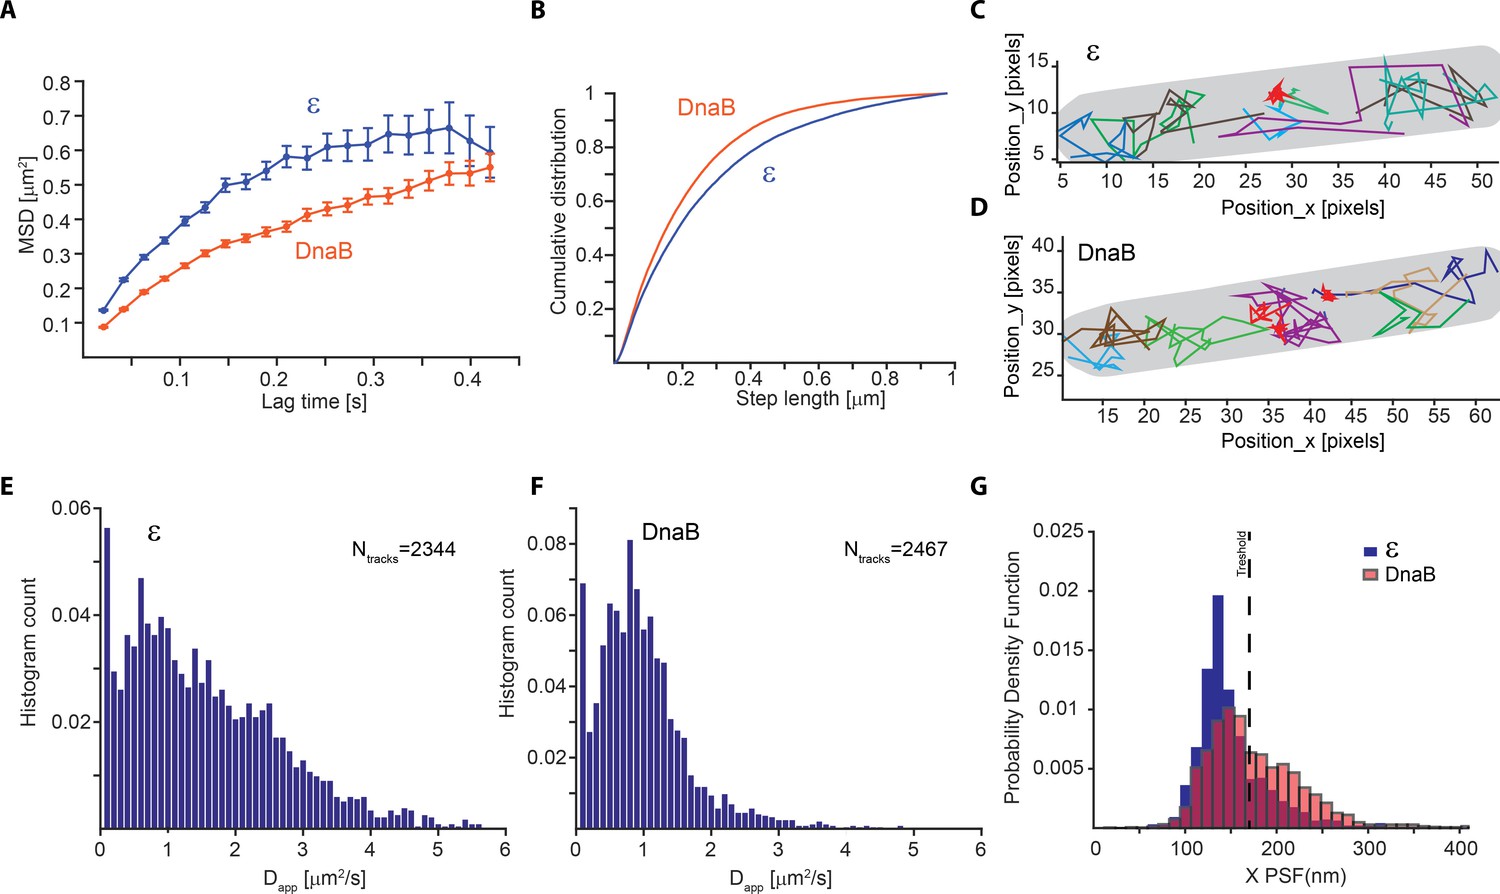
Slow diffusion of DnaB helicase complicates correct assignment of immobile molecules at sub-second capture rates.
(A–F) Analysis from PALM experiments of ε-mMaple and mMaple-DnaB using a 21 ms capture rate. (A) Calculated MSDs for the two proteins. In both cases, curves plateau at around 600 nm in agreement with the dimension of the short axis of the cell. (B) Comparison of step lengths in the tracks of diffusing molecules analysed. (C–D) Examples of detected tracks for ε and DnaB. Lines of different colours are used to facilitate the observation of individual tracks. A red line was only used to show the position of tracks representing immobile tracks where the apparent diffusion coefficient is close to 0. The outline of the cell is shown in grey. (E–F) Distribution of the apparent diffusion coefficients calculated. 2344 tracks obtained from 77 cells and 2467 tracks obtained from 90 cells were used for ε and DnaB, respectively. (G) Distribution of mean PSFs for the x-axis for tracks of ε-mMaple or mMaple-DnaB obtained from experiments done with 500 ms capture rates. In the case of ε, a clear peak close to 100 nm shows the PSF dimensions of immobile molecules, while a second peak close to 200 nm represents diffusing molecules. In contrast, the dimensions of the PSFs from immobile and diffusive molecules is less clear for DnaB. The dashed line shows the threshold used to assign immobile and diffusing molecules in our analysis.
Figure 3 with 1 supplement
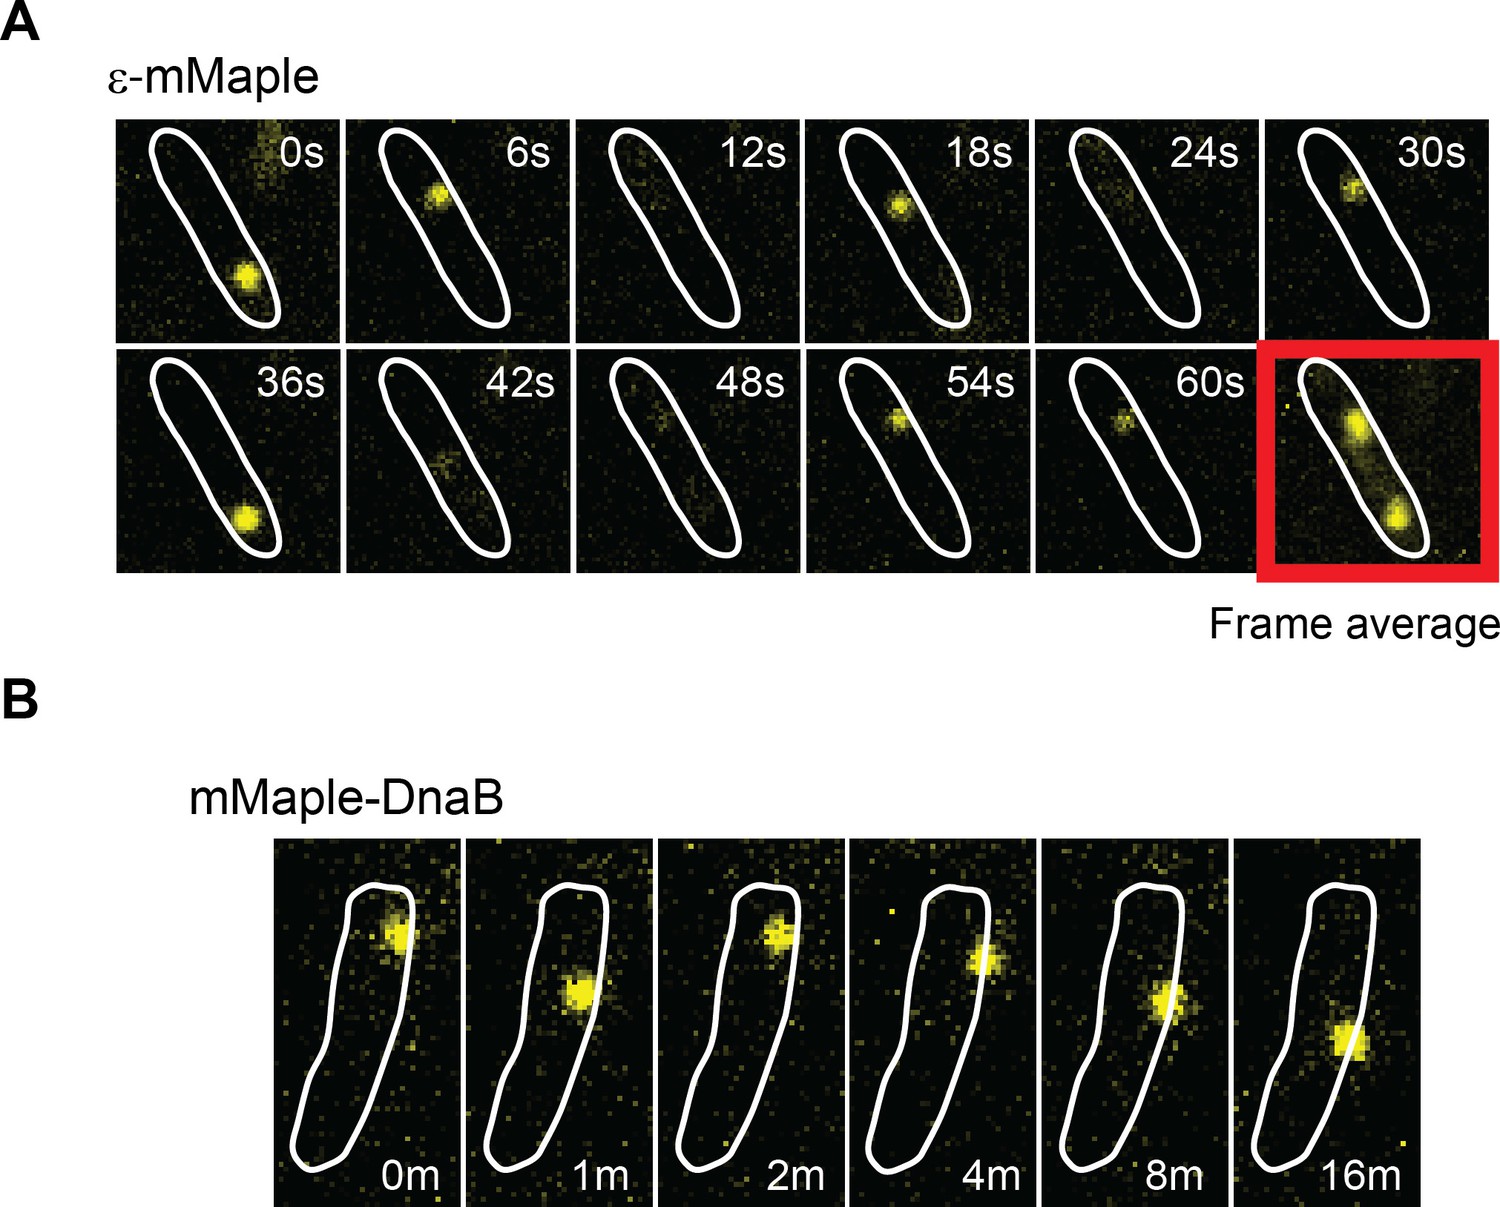
DnaB may serve as a platform for frequent Pol III* subassembly re-binding.
(A) Representative example of a cell where a single activate copy of ε-mMaple shows multiple cycles of binding and unbinding (time in seconds). Obtained from an experiment using 2 s intervals between consecutive images. Frame average shows the cellular location of two replisomes. (B) Example of a cell where a single activated mMaple-DnaB molecule remains localized as a focus for several minutes (time in minutes). Obtained from an experiment using 10 s intervals between consecutive images. Boundaries of the cells at the beginning of the experiment are shown as white outlines.
Figure 3—figure supplement 1
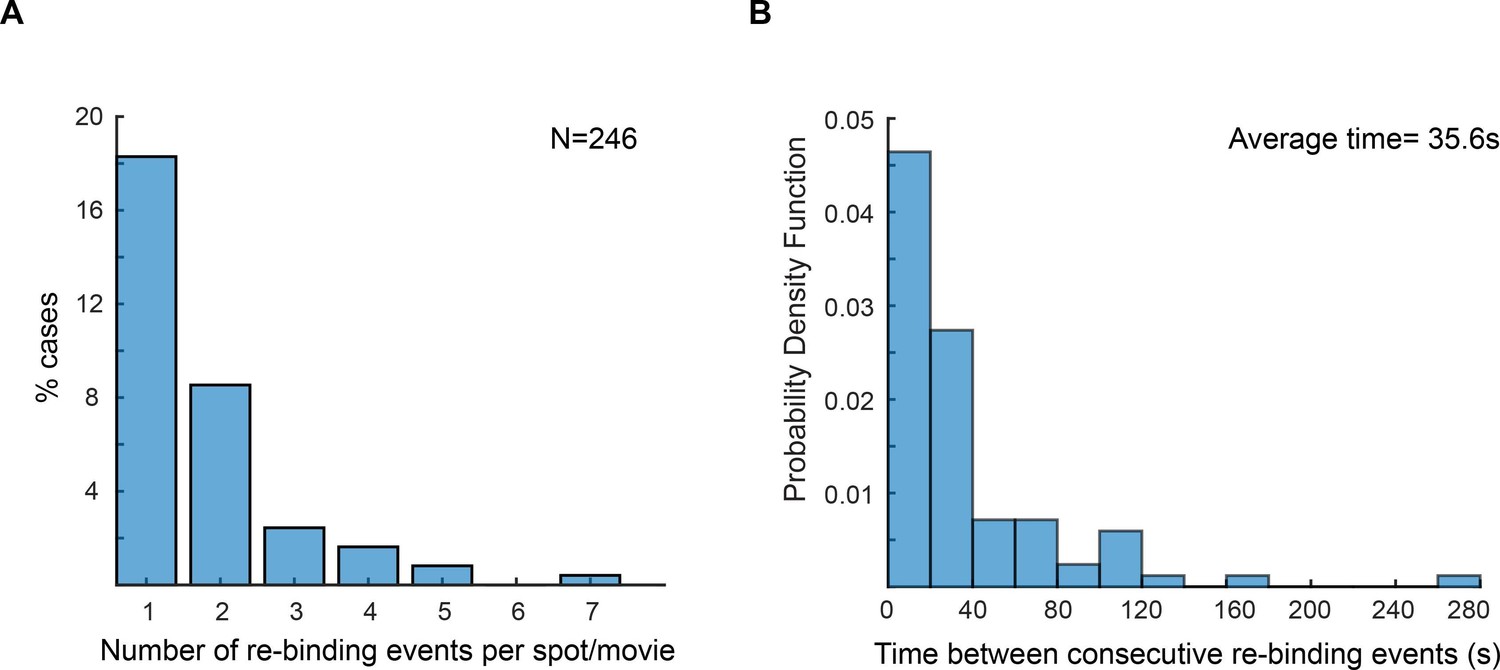
Re-binding of copies of ε at the same position are unexpectedly frequent.
(A) Plot showing the number of rebinding events during a single experiment. (B) Distribution of gap times, calculated from data obtained using 2 s exposure time. Rebinding analysis was done similarly to the track linkage analysis, except no frame threshold was applied. Time between re-binding events was obtained by determining the time interval between the end of a single-molecule track and the beginning of a new track at the same position in the cell. Note that in reality the frequency of binding will likely be higher, since molecules have a similar probability of binding to a different replisome between consecutive events. We manually analysed cells with two replisome spots and estimated that 52% of consecutive spot reappearance events occur at a different position in cells with two replisomes (N = 30 cells; 199 re-binding events).
Figure 4
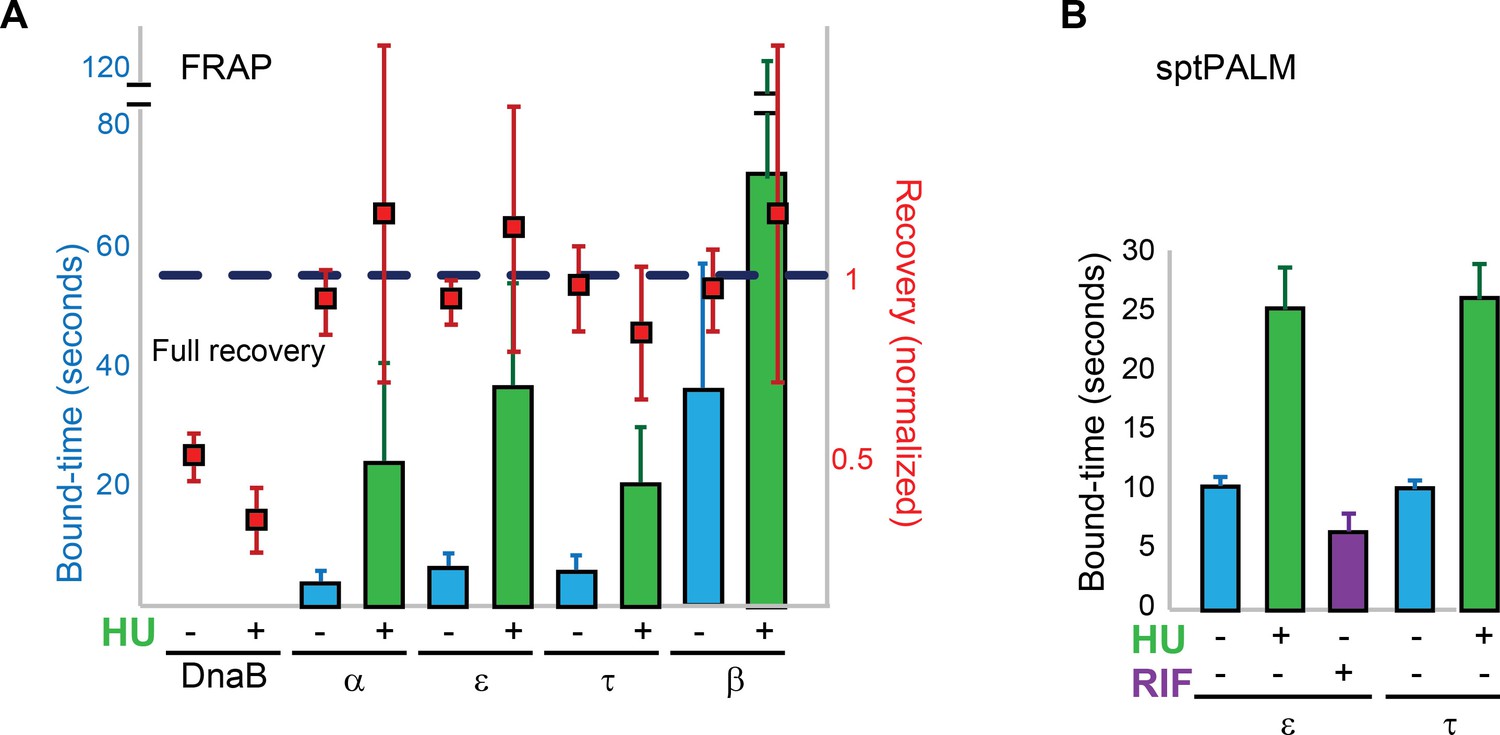
Replisome dynamics are partly dependent on active DNA synthesis.
(A) Summary of the average bound-times in cells treated with HU, estimated by FRAP. The results for untreated (blue bars) and treated cells (green bars) is shown. Data for the untreated condition is presented to facilitate comparison and is identical to that in Figure 1D. Red squares represent the normalised level of fluorescence recovery. Dashed blue line shows estimated maximum possible recovery. It was not possible to estimate the bound-time for DnaB. (B) Summary of bound-times estimated by sptPALM (weighted average). Results for the untreated (blue bars) and treated cells (green bars) is shown. Data obtained using cells treated with the RNA Polymerase inhibitor Rifampicin is also shown for cells carrying ε-mMaple (purple bars). Data for the untreated condition is presented to facilitate comparison and is identical to that in Figure 2D. Error bars represent SE.
Tables
Table 1
Strains used for this study.
| Strain | Relevant genotype | Source |
|---|---|---|
| AB1157 | thr-1, araC14, leuB6(Am), DE(gpt-proA)62, lacY1, tsx-33, qsr'-0, glnV44(AS), galK2(Oc), LAM-, Rac-0, hisG4(Oc), rfbC1, mgl-51, rpoS396(Am), rpsL31(strR), kdgK51, xylA5, mtl-1, argE3(Oc), thi-1 | Dewitt and Adelberg, 1962 |
| RRL27 | holC-ypet kan | Reyes-Lamothe et al. (2008) |
| RRL30 | holE-ypet kan | Reyes-Lamothe et al. (2008) |
| RRL32 | ssb-ypet kan | Reyes-Lamothe et al. (2008) |
| RRL33 | holA-ypet kan | Reyes-Lamothe et al. (2008) |
| RRL34 | holD-ypet kan | Reyes-Lamothe et al. (2008) |
| RRL35 | dnaE-ypet kan | Reyes-Lamothe et al. (2008) |
| RRL36 | dnaQ-ypet kan | Reyes-Lamothe et al. (2008) |
| RRL51 | dnaX-ypet kan | Reyes-Lamothe et al. (2008) |
| RRL196 | frt ypet-dnaN | Reyes-Lamothe et al. (2010) |
| RRL368 | frt-ypet-dnaB | Reyes-Lamothe et al. (2010) |
| RRL537 | dnaQ-mMaple kan | This study |
| RRL538 | holA-mMaple kan | This study |
| RRL541 | tetR-ypet kan, [tetO240-gm]852 | This study |
| RRL553 | dnaX-mMaple kan | This study |
| RRL557 | frt mMaple-dnaB | This study |
| RRL558 | frt mMaple-dnaN | This study |
| TB44 | dnaB-mMaple kan | This study |
| TB54 | lacI-mMaple kan, [lacO240-hyg]2735::ΔpheA | This study |
| Plasmid | Features | Source |
| pKD46 | Expression of lambda red genes | Datsenko and Wanner, 2000 |
| pCP20 | Expression of Flp recombinase | Datsenko and Wanner, 2000 |
| pROD61 | mYPet Kan R6K gamma ori. For C-ter insertions | This study |
| pROD83 | YPet Kan R6K gamma ori. For N-ter insertions | This study |
| pROD93 | mMaple Kan R6K gamma ori. For C-ter insertions | This study |
| pROD160 | mMaple Kan R6K gamma ori. For N-ter insertions | This study |
Additional files
-
Suplementary file 1
Summary of the analysis for FRAP and sptPALM.
(A) Analysis of FRAP data. (B) Analysis of sptPALM data. (C) Results of goodness-of-fit tests for sptPALM.
- https://doi.org/10.7554/eLife.21763.016
Download links
A two-part list of links to download the article, or parts of the article, in various formats.
Downloads (link to download the article as PDF)
Open citations (links to open the citations from this article in various online reference manager services)
Cite this article (links to download the citations from this article in formats compatible with various reference manager tools)
Frequent exchange of the DNA polymerase during bacterial chromosome replication
eLife 6:e21763.
https://doi.org/10.7554/eLife.21763


