Structure of the transporter associated with antigen processing trapped by herpes simplex virus
- Howard Hughes Medical Institute, The Rockefeller University, United States
- Janelia Research Campus, Howard Hughes Medical Institute, United States
Figures
Figure 1

Cryo-EM reconstruction of the TAP/ICP47 complex.
(A) Stereo views of the overall density map (blue mesh), filtered to 4 Å resolution and sharpened with a B-factor of −150 Å2, for two 180° related views. The TAP/ICP47 model is shown in stick model (orange). (B) Resolution of the final cryo-EM density map indicated by a plot of the Fourier Shell Correlation (FSC) between unfiltered reconstructions of two semi-independently refined half datasets. (C) Stereo view of the density map (blue mesh) highlighting the TAP/ICP47 interface. Models of TAP (yellow) and ICP47 (magenta) are also shown. (D) Overall density map colored by local resolution estimation calculated from two semi-independently refined and reconstructed Frealign half maps using the Bsoft program Blocres and a 20 voxel kernel size. (E) Validation of the structure model. FSC calculated between the structure model and the half map used for refinement (working, cyan), the other half map (free, red), and 3) the full map (green).
-
Figure 1—source data 1
Resolution of the final cryo-EM reconstruction.
FSC values from Frealign between unfiltered reconstructions of two independently refined half data sets indicating the resolution of the reconstruction (FSC).
- https://doi.org/10.7554/eLife.21829.004
-
Figure 1—source data 2
Validation of the structure model.
FSC values calculated between the structure model and the half map used for refinement, the other half map, and the full map.
- https://doi.org/10.7554/eLife.21829.005
Figure 2
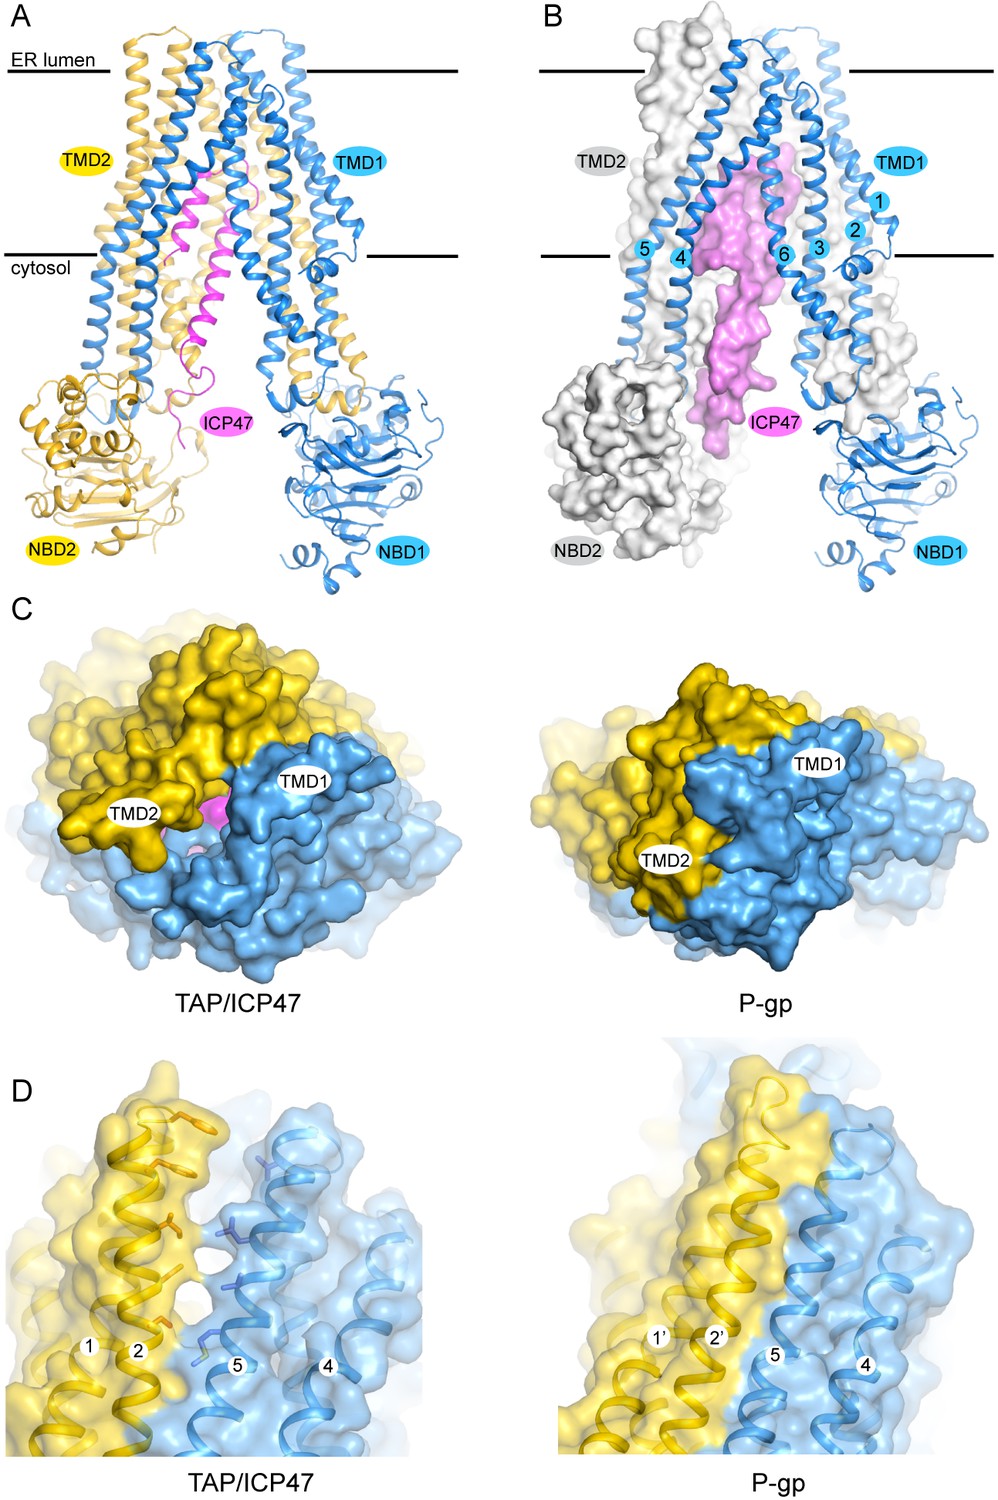
The structure of TAP trapped by ICP47.
(A) Ribbon representation of the TAP/ICP47 complex. Color code: TAP1 (blue), TAP2 (yellow), ICP47 (magenta) (B) The domain-swapped architecture: TAP1 is shown in ribbon representation, TAP2 and ICP47 are shown as surfaces. TAP1 TM helices are labelled. (C) The open ER luminal gate viewed along the membrane normal from the ER side (left). The closed extracellular gate of P-gp is also shown for comparison (right). (D) The lateral opening to the membrane bilayer at the ER luminal side (left). The equivalent region in P-gp is also shown for comparison (right).
Figure 3
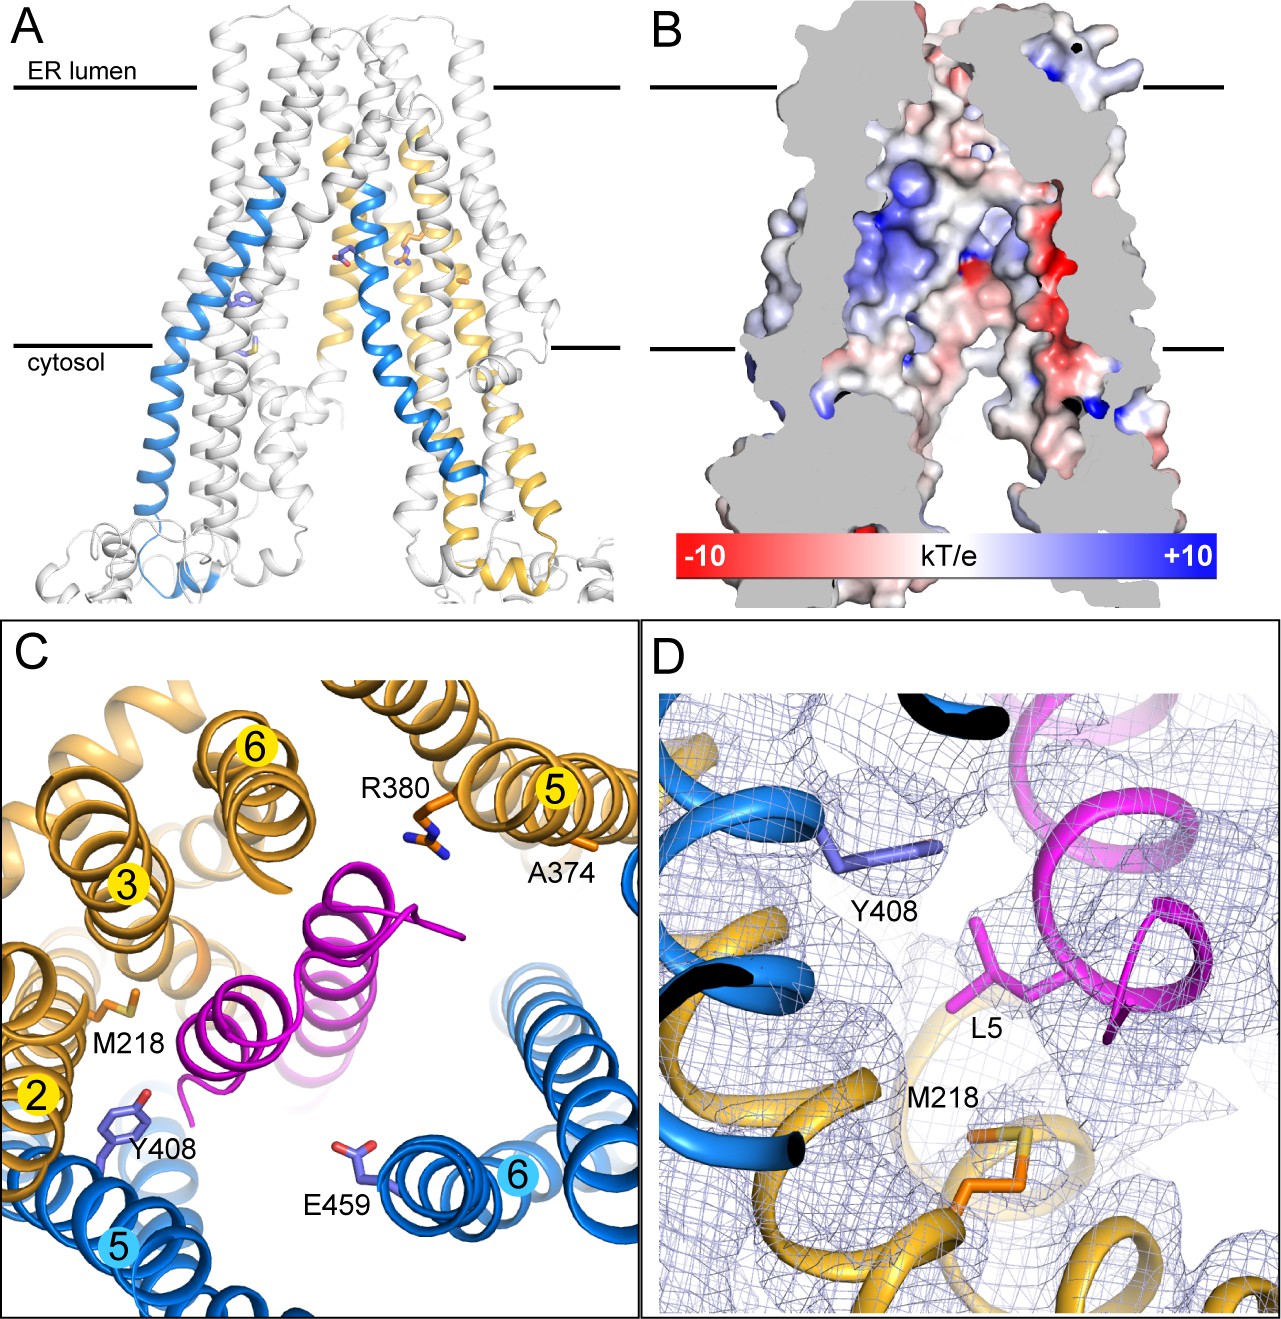
The substrate-binding site.
(A) Biochemically identified substrate-binding regions: TAP1 375–420 and 453–487 (blue), TAP2 301–389 and 414–433 (gold). The five residues previously suggested to interact with the substrate (TAP1 Y408, E459 and TAP2 M218, A374, R380) are shown in stick model. (B) The electrostatic potential surface of the substrate-binding cavity. The electrostatic potential was calculated assuming pH 7 and a 0.15 M concentration of both (+1) and (−1) ions. Isocontour levels ranging from −10 to 10kT/e are colored from red to blue. (C) The helical hairpin of ICP47 (purple) plugs into the substrate-binding site. (D) The N-terminal region of ICP47 packs against Y408 of TAP1 and M218 of TAP2. For clarity, only side chains of TAP1 408, TAP2 M218, and ICP47 L5 are shown. The blue mesh shows the B-factor sharpened cryo-EM reconstruction.
Figure 4
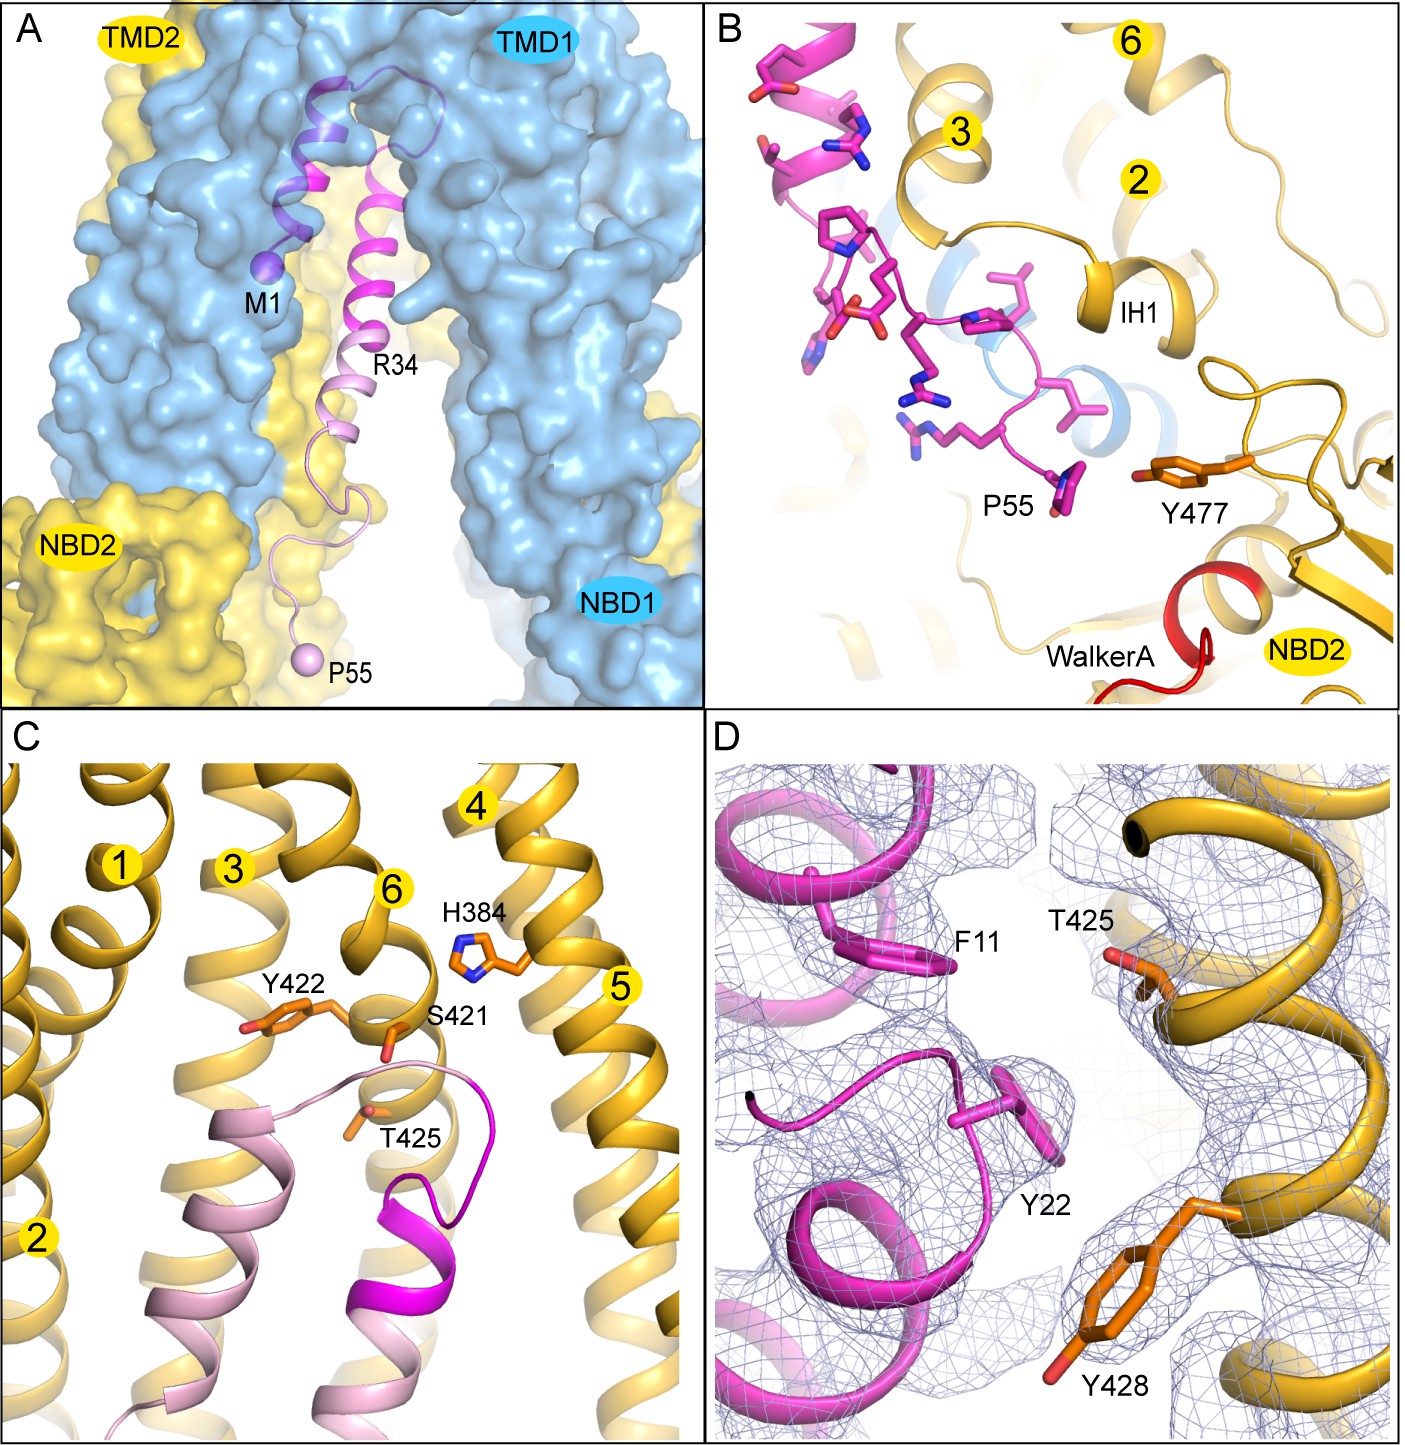
The interface between TAP and ICP47.
(A) The first 34 residues of ICP47, highlighted in darker magenta, insert into the transmembrane pathway. R34, and the first and last residues of ICP47 resolved in the structure (M1, P55) are labeled. (B) ICP47 reaches into the TMD2/NBD2 interface near Y477. (C) Interactions between the ‘hot-spots’ in TAP shown in stick models and those of ICP47 (residues 18–25, highlighted in darker magenta). (D) Interactions between TAP2 T425 and ICP47 F11 and Y22. For clarity, only side chains of TAP2 T425 and Y428 and ICP47 F11 and Y22 are shown. The blue mesh shows the B-factor sharpened cryo-EM reconstruction.
Figure 5
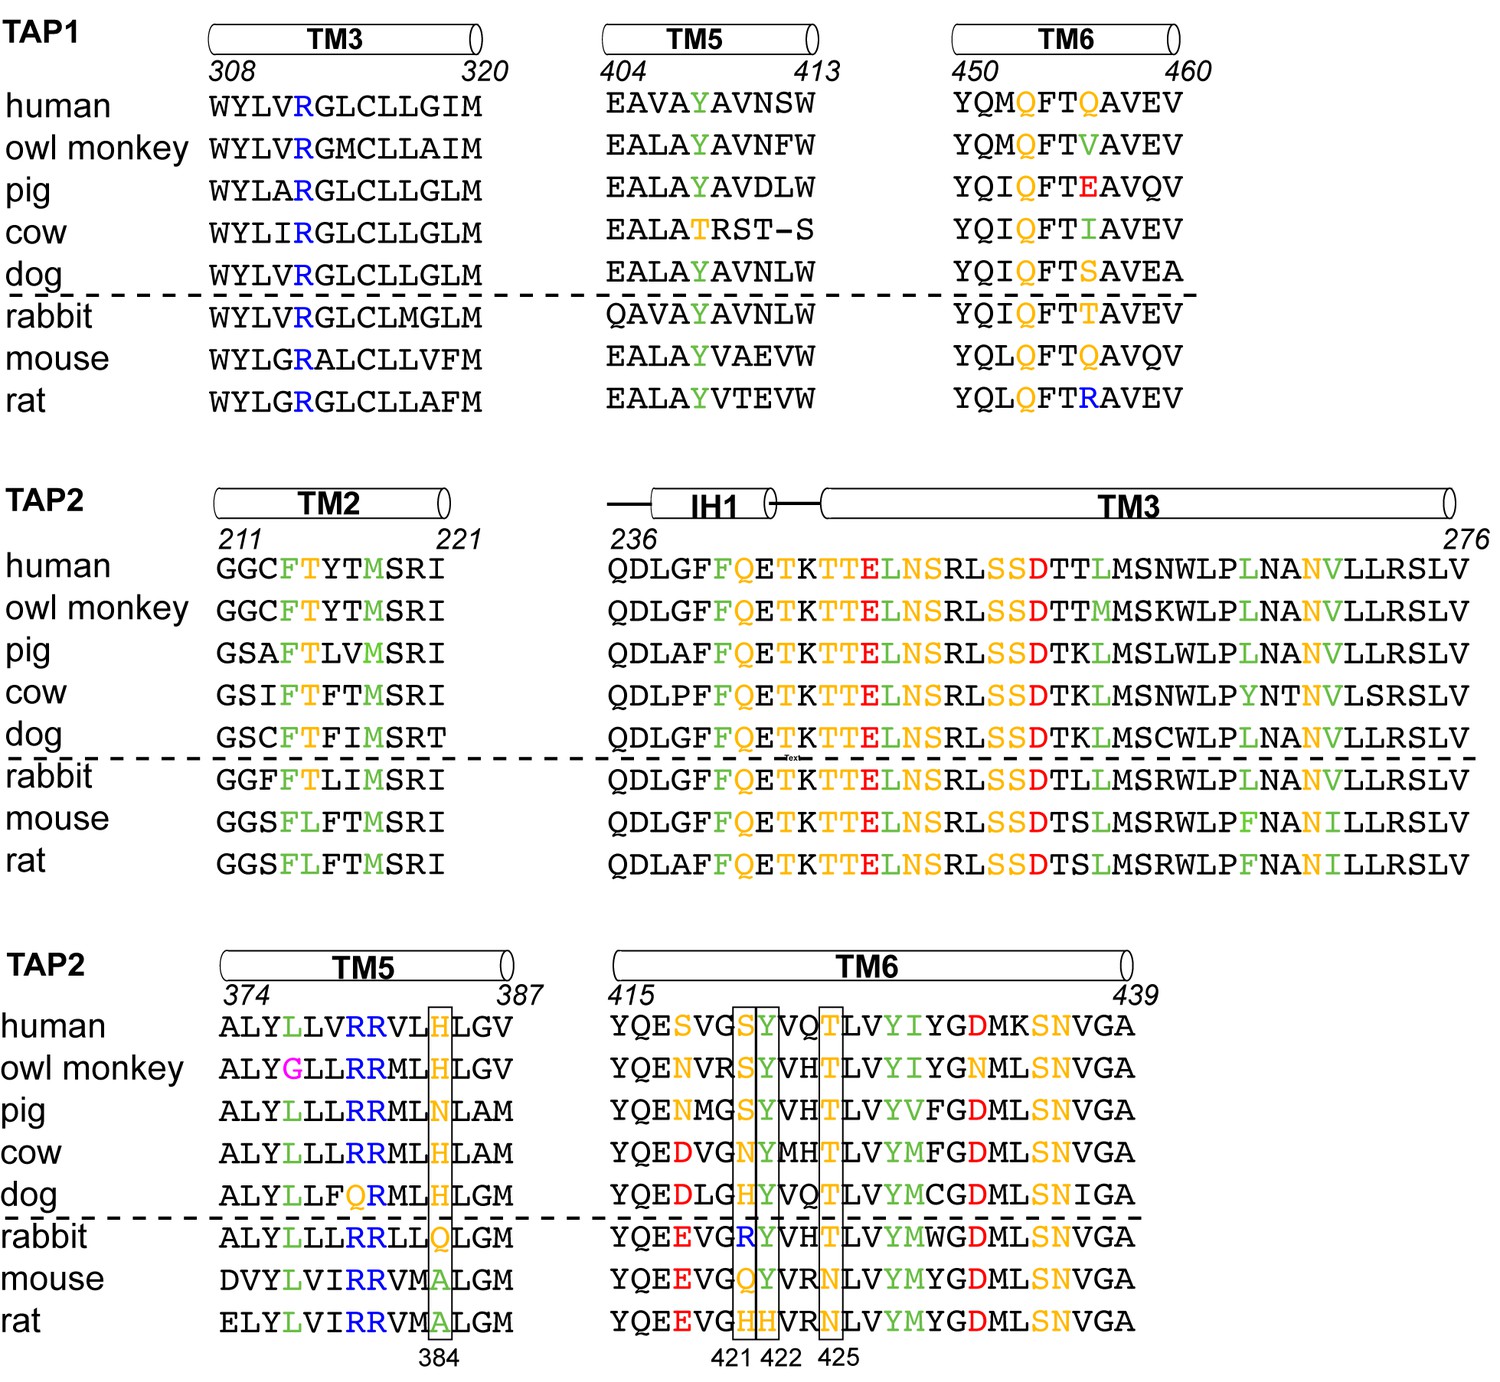
Sequence alignment of the TAP residues that contact ICP47.
ICP47 inhibits TAP from human, owl monkey, pig, cow and dog (the top five sequences), but not that of rabbit, mouse and rat (the bottom three sequences). Residues contacting ICP47 are colored based on amino acid character (positively charged in blue, negatively charged in red, hydrophobic in green, glycine in magenta, and polar in gold). Residues discussed in the text are highlighted in boxes.
Figure 6

Structures of three peptide transporters in the ABC family.
(A) Ribbon representations. The two subunits are shown in blue and gold, respectively. ICP47 is colored in magenta. The peptidase domains of PCAT1 observed in the inward-facing conformation are colored in cyan and light yellow. The nucleotides, ATPγS in PCAT1 and AMPPNP in McjD, are shown in stick model. (B) Structural comparison of the TMDs. Only one TMD is shown for each transporter. The TM helices for TAP1 are shown.
Tables
Table 1
Summary of Cryo-EM data.
| Imaging | |
|---|---|
| Microscope | Titan Krios I, 300keV (FEI) |
| Detector | K2 Summit direct electron detector (Gatan) |
| Energy filter | 10 eV (Gatan) |
| Data collection | |
| Pixel size | 1.04 Å |
| Movies | 3875 |
| Frames | 50 |
| Total exposure time | 10 s |
| Exposure time per frame | 0.2 s |
| Total exposure | 74 electrons/Å2 |
| Exposure per frame | 1.48 electrons/Å2/frame |
| Defocus range | −1.5 to −3.5 μm |
| Final reconstruction | |
| Number of particles | 501,973 |
| B-factor correction | −150 Å2 |
Table 2
Reciprocal space refinement statistics
| Space group | P1 |
|---|---|
| Cell dimensions | |
| a, b, c (Å) | 92.5, 116.0, 116.0 |
| α,β,γ (°) | 90.0, 90.0, 90.0 |
| Resolution (Å) | 100.0 - 3.97 |
| Number of residues | |
| TAP1 | 561 |
| TAP2 | 551 |
| ICP47 | 55 |
| R.m.s deviations | |
| Bond lengths (Å) | 0.0070 |
| Bond angles (°) | 0.881 |
| Ramachandran | |
| Favored (%) | 94.3 |
| Allowed (%) | 5.5 |
| Outliers (%) | 0.2 |
Download links
A two-part list of links to download the article, or parts of the article, in various formats.
Downloads (link to download the article as PDF)
Open citations (links to open the citations from this article in various online reference manager services)
Cite this article (links to download the citations from this article in formats compatible with various reference manager tools)
Structure of the transporter associated with antigen processing trapped by herpes simplex virus
eLife 5:e21829.
https://doi.org/10.7554/eLife.21829


