Flow environment and matrix structure interact to determine spatial competition in Pseudomonas aeruginosa biofilms
- Max Planck Institute for Terrestrial Microbiology, Germany
- Princeton University, United States
- Howard Hughes Medical Institute, United States
Figures
Figure 1 with 1 supplement

Wild-type P. aeruginosa PA14 outcompetes the ΔpelA mutant under simple flow conditions, but the two strains coexist under complex flow conditions.
(A) Wild-type and ∆pelA strains were co-cultured at a range of initial frequencies in the simple planar (black data) or column-containing (blue data) microfluidic chambers. In both cases, fresh minimal M9 medium with 0.5% glucose was introduced at flow rates adjusted to equalize the volume of medium flowing through each chamber per unit time across all experiments. The diagonal gray line denotes the maximum possible increase in wild-type frequency for a given initial condition. Each data point is an independent biological replicate. (B) A maximum intensity projection (top-down view) of a confocal z-stack of wild type (green) and ∆pelA (red) biofilms in simple flow chambers. (C) An epifluorescence micrograph (top-down view) of wild type (green) and ∆pelA (red) biofilms after 72 hr growth in a flow chamber containing column obstacles to simulate a porous environment with irregular flows. Images in (B) and (C) were taken from chambers in which the wild type was inoculated at a frequency of 0.7.
-
Figure 1—source data 1
Change in WT frequency as a function of initial frequency in two flow conditions
- https://doi.org/10.7554/eLife.21855.004
Figure 1—figure supplement 1
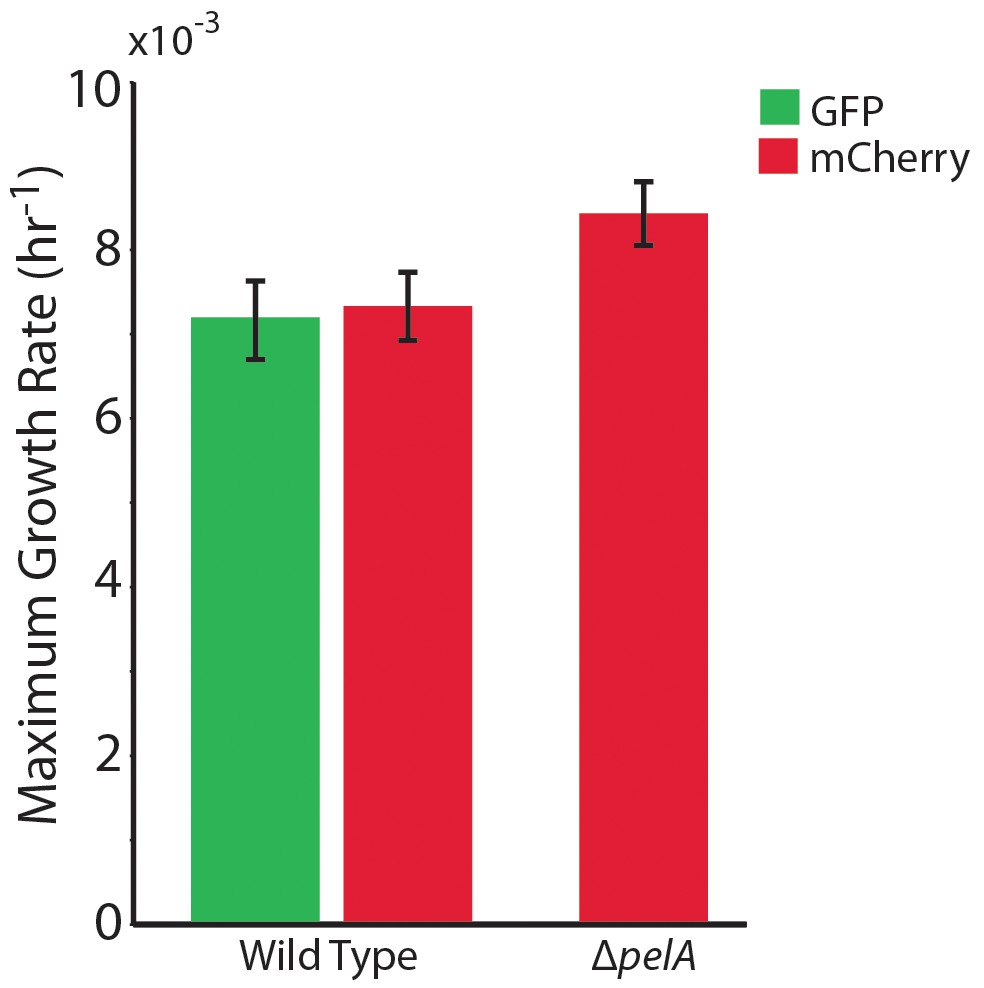
The maximum growth rates of P. aeruginosa PA14 wild type and ∆pelA cells in mixed liquid culture.
n = 4 biological x 6 technical replicates (different overnight cultures and microtiter plate wells, respectively (bars denote means ± S.E.). Growth rates were measured as the maximum slope of growth curves of cultures whose optical density at 600 nm was taken every 30 min until stationary phase. Cultures were grown in minimal M9 medium with 0.5% glucose at ambient room temperature (24°C). The maximum growth rates of wild-type cells expressing GFP and wild-type cells expressing mCherry were not different, indicating that the fluorescent protein constructs did not introduce growth rate bias (two-sample t = 0.235, df = 6, p=0.822). A two-sample t-test comparing the maximum growth rate of the ∆pelA strain against the pooled data for wild type (t = 2.31, df = 10, p=0.0432) suggests a growth rate decrement on the part of wild type relative to ∆pelA, but was not statistically significant at a critical p<0.05 threshold with Bonferroni correction for two pairwise comparisons.
-
Figure 1—figure supplement 1—source data 1
Maximum liquid culture growth rates of study strains.
- https://doi.org/10.7554/eLife.21855.006
Figure 2
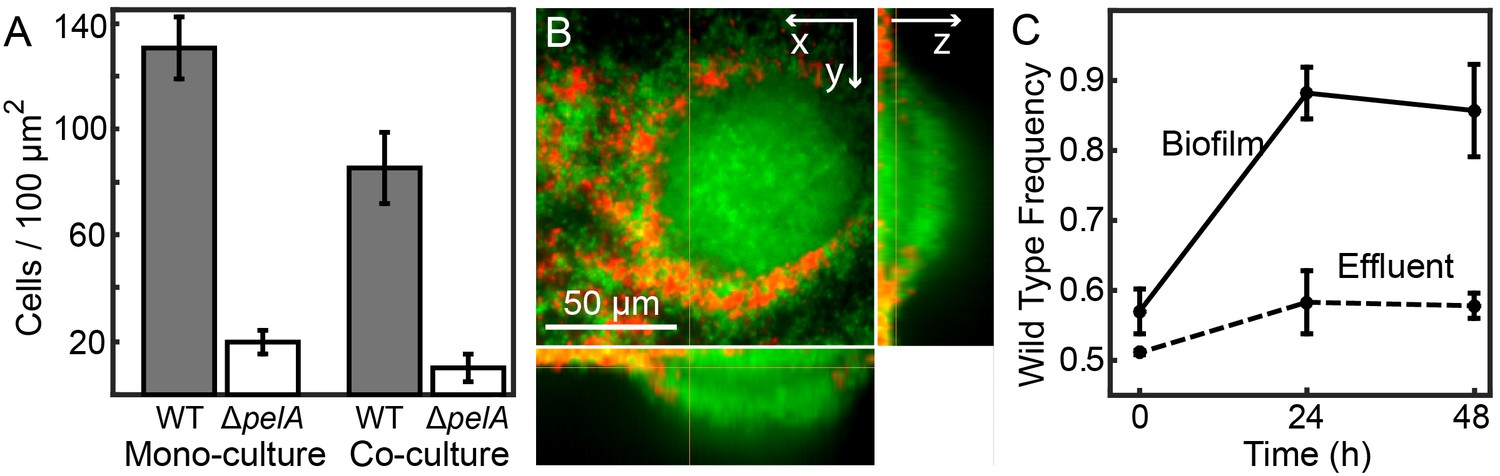
Matrix production confers a competitive advantage to wild-type P. aeruginosa PA14 in biofilms under simple flow conditions.
(A) Absolute abundances of wild-type and ΔpelA strains in monoculture and co-culture in planar microfluidic flow-chambers (bars denote means ± S.D. for n = 3–6). The two strains were inoculated alone (left two bars) or together at a 1:1 ratio (right two bars). (B) Single optical plane 3 μm from the surface, and z-projections at right and bottom respectively, of the wild-type (green) and ΔpelA (red) strains grown in co-culture for 48 hr after inoculation at a 1:1 ratio. (C) Relative abundance of wild-type and ∆pelA strains in the liquid effluent of planar microfluidic devices (points denote means ± S.D. for n = 3). Wild-type and ∆pelA cells were combined at a 1:1 initial ratio and co-inoculated on the glass substratum of simple flow chambers. At 0, 24, and 48 hr, 5 µL of effluent was collected from chamber outlets. Wild-type frequency was calculated within biofilms and within the liquid effluent for each time point.
-
Figure 2—source data 1
Biofilm production of WT and Pel-deficient P. aeruginosa in mono-culture and co-culture; cell counts in chamber effluents.
(A) WT and ΔpelA biomass accumulation. (C) WT and ΔpelA cell counts in effluent.
- https://doi.org/10.7554/eLife.21855.008
Figure 3 with 3 supplements
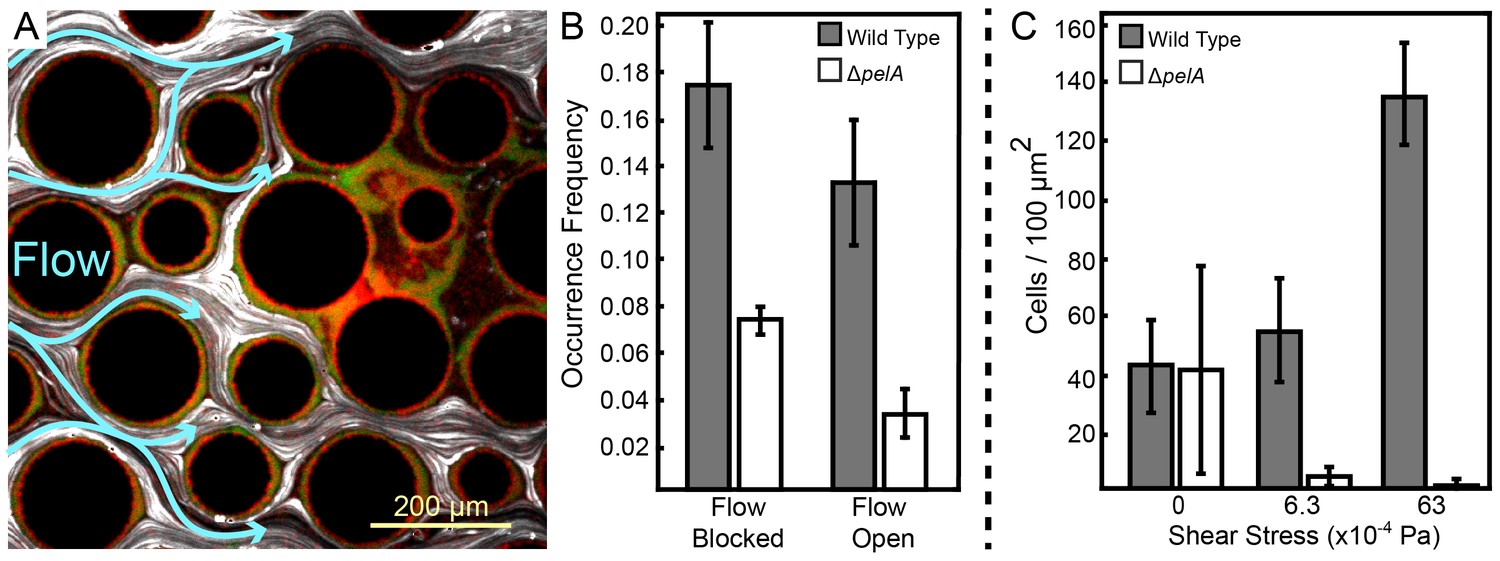
Pel-deficient mutants occupy locations protected from flow due to local clogging by wild-type P. aeruginosa biofilms.
(A) Wild-type (green) and ∆pelA (red) P. aeruginosa strain mixtures were inoculated into complex flow chambers with irregularly-spaced column obstacles. Biofilms were imaged using confocal microscopy, after which fluorescent beads were flowed through the chamber. The presence or absence of flow was monitored through averaging successive exposures of bead tracks (white lines are bead tracks; blue arrows highlight flow trajectories). (B) Analysis of co-occurrence of flow and wild-type or ∆pelA cell growth at the end of 1:1 competition experiments in complex flow chambers with column obstacles, as illustrated by the micrograph in (A). The occurrence of wild-type (gray) and ∆pelA (white) cell clusters are shown as a function of whether local flow has been blocked or remained open after 72 hr of competition (bars denote means ± S.E. for n = 3). These occurrence frequency data are normalized to the total area of blocked versus open flow in the microfluidic devices, as determined by the presence or absence of fluorescent bead tracks. There is no significant difference in wild type occurrence in regions in which flow is unobstructed and in regions in which flow is blocked (two-sample t = 0.995, df = 4, p=0.376), but the ∆pelA strain is significantly more likely to occur in regions in which flow is blocked at a p<0.05 threshold with Bonferroni correction for two pairwise comparisons (two-sample t = 3.60, df = 4, p=0.0227). (C) Biofilm growth of wild-type P. aeruginosa PA14 (gray) and the ΔpelA mutant (white) in monoculture in planar flow chambers under different shear stress exposure treatments (bars denote means ± S.D. for n = 5–10).
-
Figure 3—source data 1
Occurrence of WT and Pel-deficient P. aeruginosa in areas with flow blocked versus areas with flow open.
Biomass accumulation of WT and Pel-deficient P. aeruginosa under different degrees of shear stress.
(B) WT and ΔpelA biomass accumulation. (C) WT and ΔpelA growth under variable shear
- https://doi.org/10.7554/eLife.21855.010
Figure 3—figure supplement 1
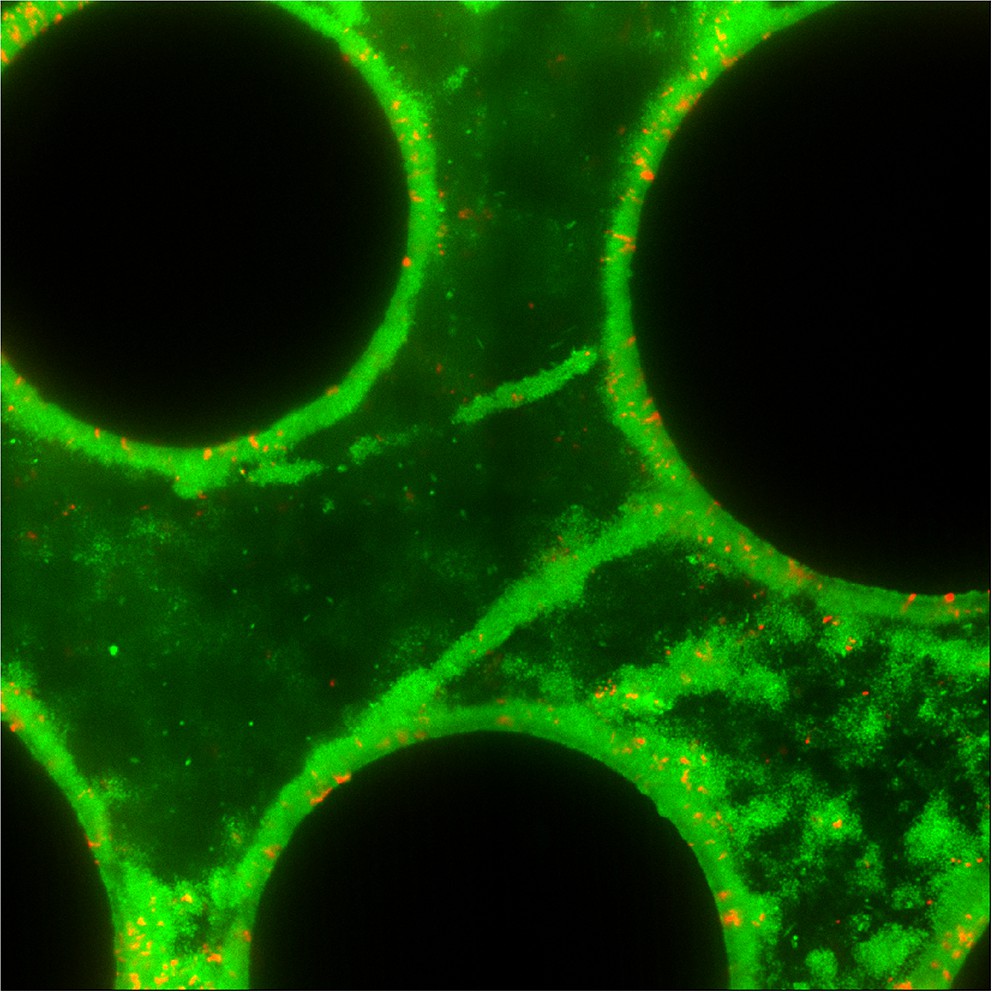
Streamer structures produced by wild-type P. aeruginosa PA14 (green) in microfluidic chambers with complex flow profiles do not capture large numbers of co-cultured ∆pelA mutants (red) over 72 hr of biofilm growth (black circles are column obstacles).
https://doi.org/10.7554/eLife.21855.011
Figure 3—figure supplement 2

Analysis procedure for correlating local flow and accumulation of ∆pelA and wild-type cells.
Liquid enters the chamber on the left and exits on the right. (A) First, the positions of the columns were identified from the fluorescence image. The centers of the columns served as nodes to divide the spaces into triangular regions. Within each region, the area covered by the column was removed. (B) The corresponding image with fluorescent beads (white) to track local flows. Typically, 10 to 15 images were taken and integrated to cover the flow regions sampled by the beads. Overlaid are triangular regions showing ∆pelA cell accumulation (from (C)). (C) Averaged intensity within each sampling region was calculated, and a threshold was set to determine if biofilm accumulation occurred in each region. White triangles correspond to regions identified as containing biofilms using this method. ∆pelA cells accumulated primarily in regions lacking flow due to upstream clogging or in regions immediately downstream of obstructed areas. (D) Wild-type cells accumulated both in areas of high flow and areas of low flow.
Figure 3—figure supplement 3
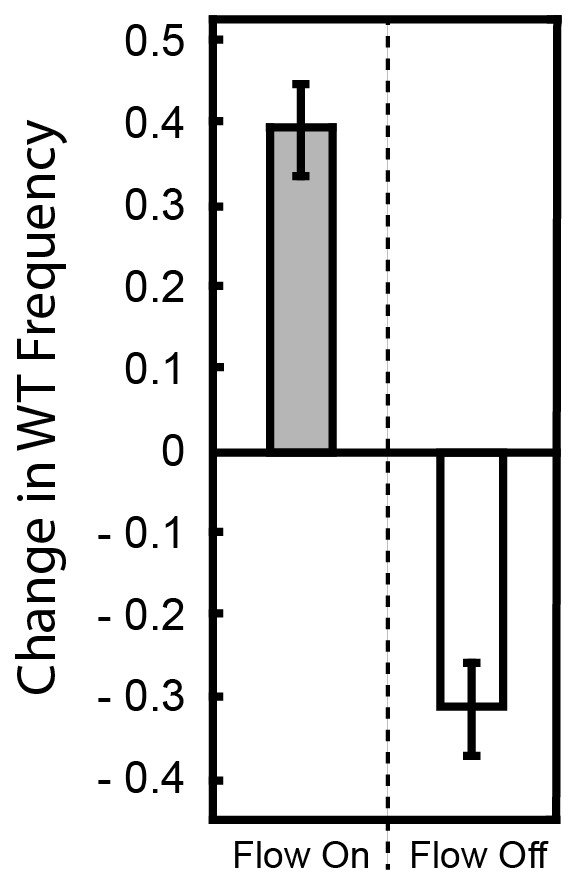
Change in frequency of WT cells from a 1:1 starting population with ∆pelA with and without flow.
P. aeruginosa PA14 and the ∆pelA strain were inoculated at a 1:1 ratio and allowed to form biofilms in planar microfluidic devices with or without flow for 72 hr. At that time, the biofilms were imaged, and the change in relative frequency of the wild-type strain was calculated (as in Figure 1 in the main text). When flow was present, the WT outcompeted the ∆pelA strain, and thus, the WT strain tended to show a positive change in frequency within biofilms (gray). When flow was absent, the WT strain tended to show a negative change in frequency (white). Bars denote means ± S.D. for n = 3–4.
-
Figure 3—figure supplement 3—source data 1
Comparison of competition in simple chambers with or without flow.
- https://doi.org/10.7554/eLife.21855.014
Download links
A two-part list of links to download the article, or parts of the article, in various formats.
Downloads (link to download the article as PDF)
Open citations (links to open the citations from this article in various online reference manager services)
Cite this article (links to download the citations from this article in formats compatible with various reference manager tools)
Flow environment and matrix structure interact to determine spatial competition in Pseudomonas aeruginosa biofilms
eLife 6:e21855.
https://doi.org/10.7554/eLife.21855


