Global reorganisation of cis-regulatory units upon lineage commitment of human embryonic stem cells
- Babraham Institute, United Kingdom
- University of Cambridge, United Kingdom
- King's College London School of Medicine, United Kingdom
Figures
Figure 1 with 4 supplements
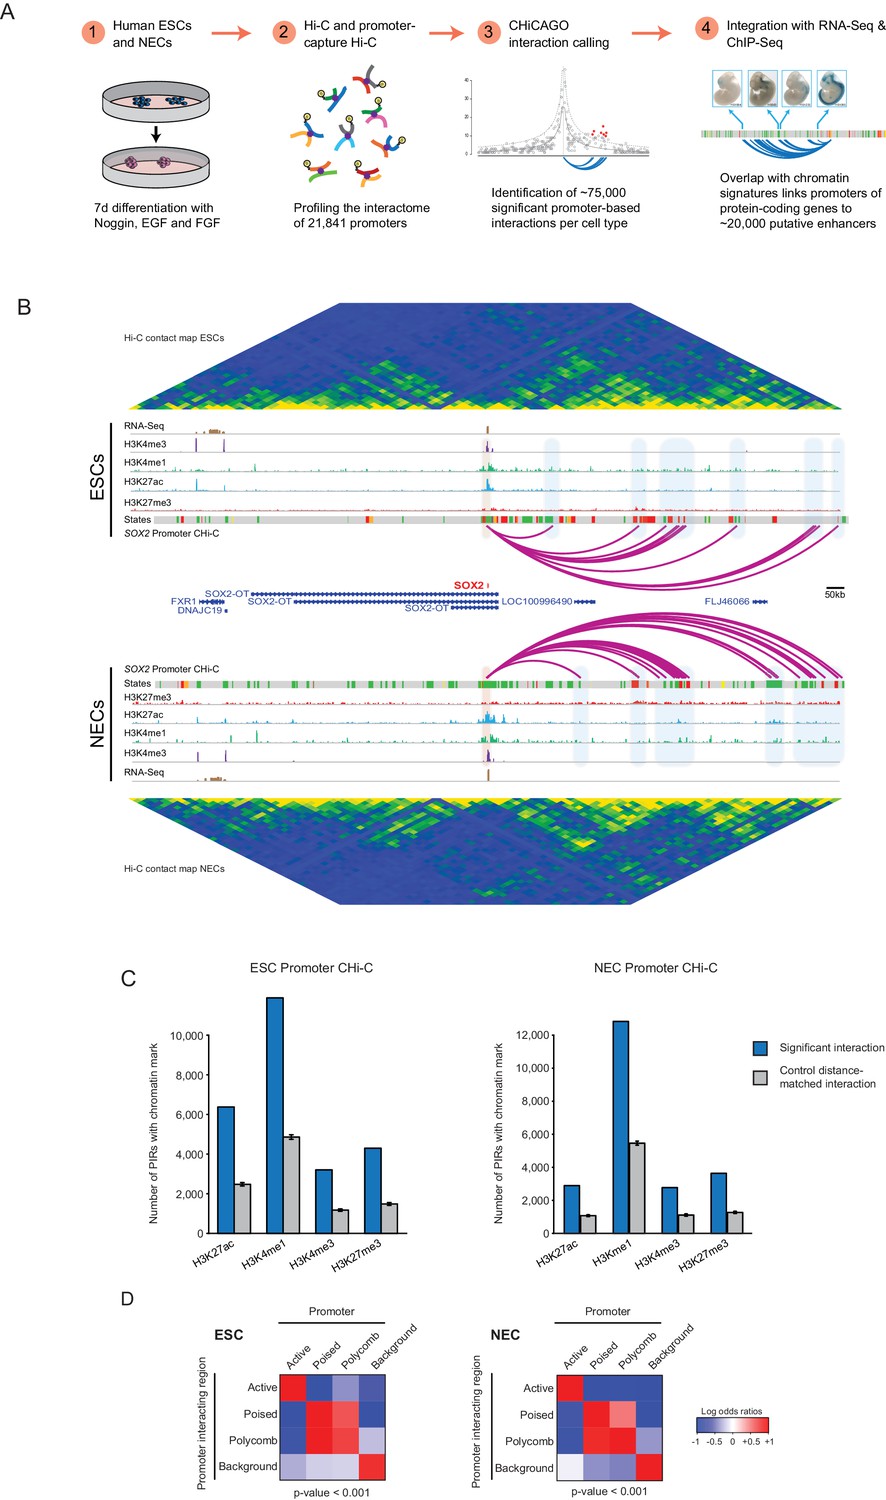
A resource of high-resolution promoter interactions in human embryonic stem cells (ESCs) and ESC-derived neuroectodermal cells (NECs).
(A) Overview of the experimental design. Human embryonic stem cells (ESCs) and ESC-derived neuroectodermal progenitors (1) were analysed with Promoter Capture Hi-C to profile interactions involving 21,841 promoter-containing HindIII fragments (2). Signal detection with the CHiCAGO pipeline revealed ~75,000 high-confidence promoter interactions in each cell type (3). These data were integrated with histone modification and gene expression profiles in the same cells (4) to study chromatin and interaction dynamics during lineage commitment. Characterisation of ESCs and NECs is shown in Figure 1—figure supplement 1. (B) Genome browser representation of the SOX2 promoter interactome in ESCs (upper) and NECs (lower). Significant interactions are shown as purple arcs, with one end of the interaction within the SOX2 promoter and the other end at a promoter-interacting region (PIR). ChIP-seq (H3K27me3, H3K27ac, H3K4me1, H3K4me3; from [Rada-Iglesias et al., 2011]) and mRNA-seq tracks are shown. Chromatin states for each genomic region were defined by ChromHMM (Ernst and Kellis, 2012) using ChIP-seq data (active chromatin, green; poised chromatin, orange; Polycomb-associated chromatin, red; intermediate, yellow; background, grey). Conventional Hi-C heatmaps of contact frequencies reveal chromatin topology over this region. As an additional example, the PAX6 promoter interactome is shown in Figure 1—figure supplement 2. Read count interaction profiles for SOX2 and PAX6 are shown in Figure 1—figure supplement 4. (C) PIRs are significantly enriched in regions that contain histone marks associated with putative regulatory functions, compared with promoter distance-matched control regions (permutation test p-value<0.01 for each mark) (ESCs, left; NECs, right). Blue bars show the number of overlaps observed in detected PIRs, and grey bars show the mean number of overlaps observed in distance-matched random regions over 100 permutations. Error bars show 95% confidence intervals across permutations. (D) Promoters and their associated PIRs show significant concordance in chromatin states. Heatmaps show the log2 odds ratios for the co-occurrence of each combination of promoter and PIR chromatin state compared with that expected at random. p-Values are from Pearson’s χ2 test on the corresponding contingency tables. Clustering of chromatin states and additional examples of promoter interactomes are shown in Figure 1—figure supplement 3.
Figure 1—figure supplement 1
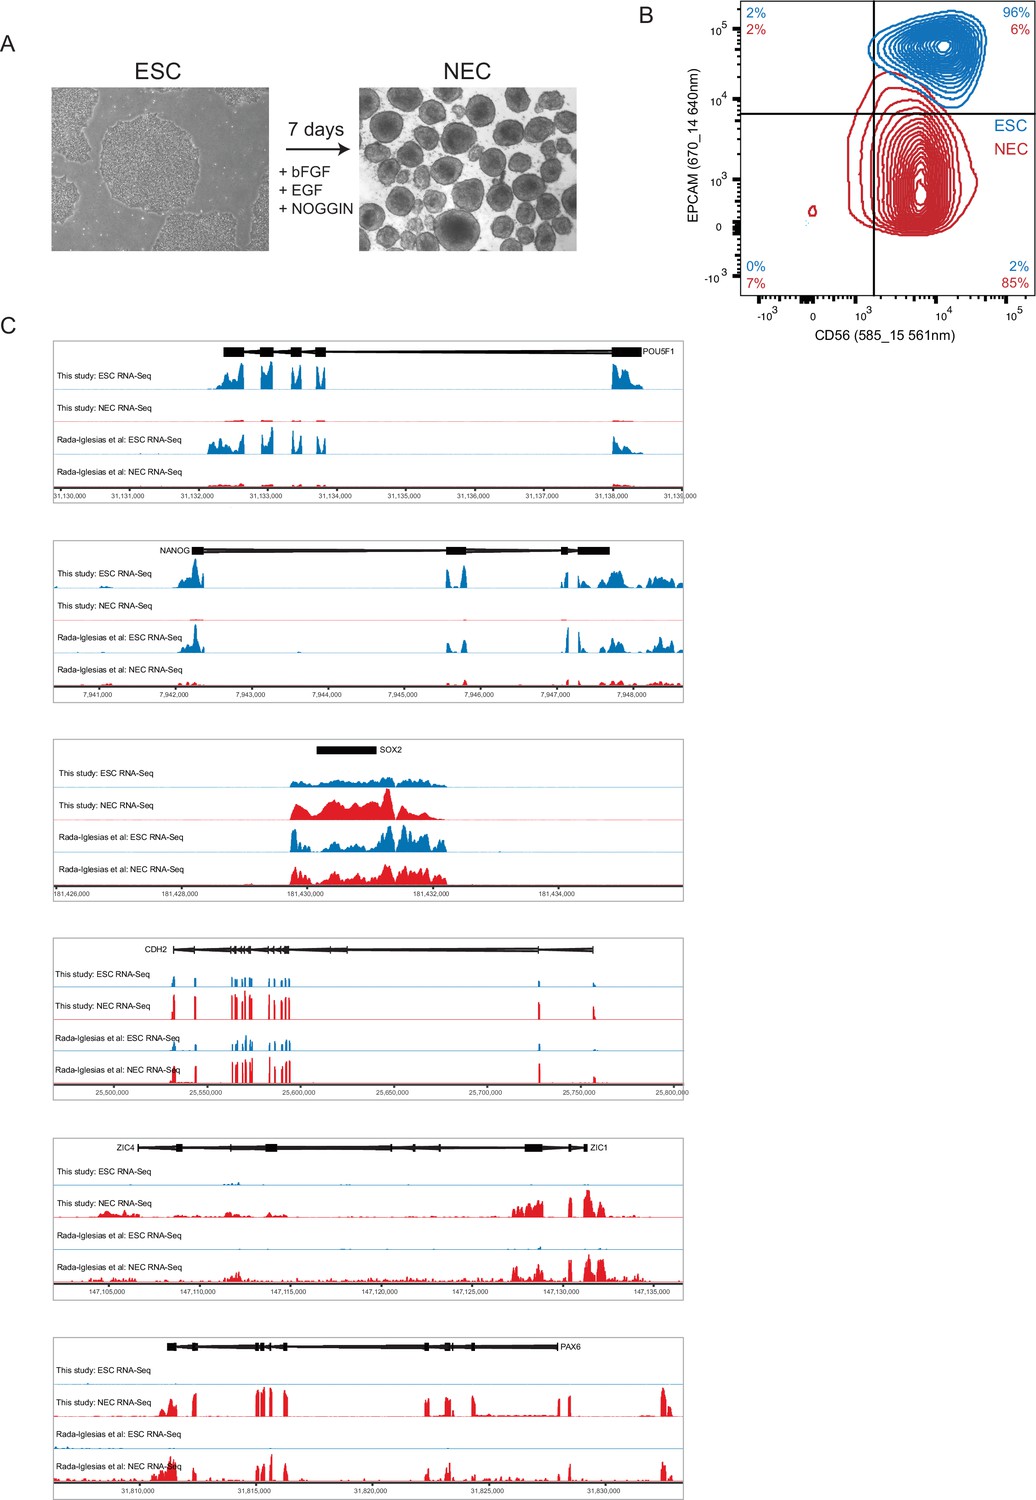
Characterisation of ESCs and NECs.
(A) Phase contrast images of undifferentiated ESC colonies (left) and day 7 NEC spheres (right). (B) Flow cytometry analysis of ESCs (blue) and NECs (red) using lineage-specific cell surface markers. CD56 is expressed by ESCs and NECs; EPCAM (CD326) is expressed by ESCs but not NECs (Gifford et al., 2013). Percent positive cells in each quadrant is shown. (C) Genome browser representations of RNA-seq data from our study and from (Rada-Iglesias et al., 2011) shows expression levels of the ESC-specific genes POU5F1 and NANOG; of SOX2 and CDH2, which are expressed by both ESCs and NECs, and of the NEC-specific genes ZIC4 and PAX6.
Figure 1—figure supplement 2
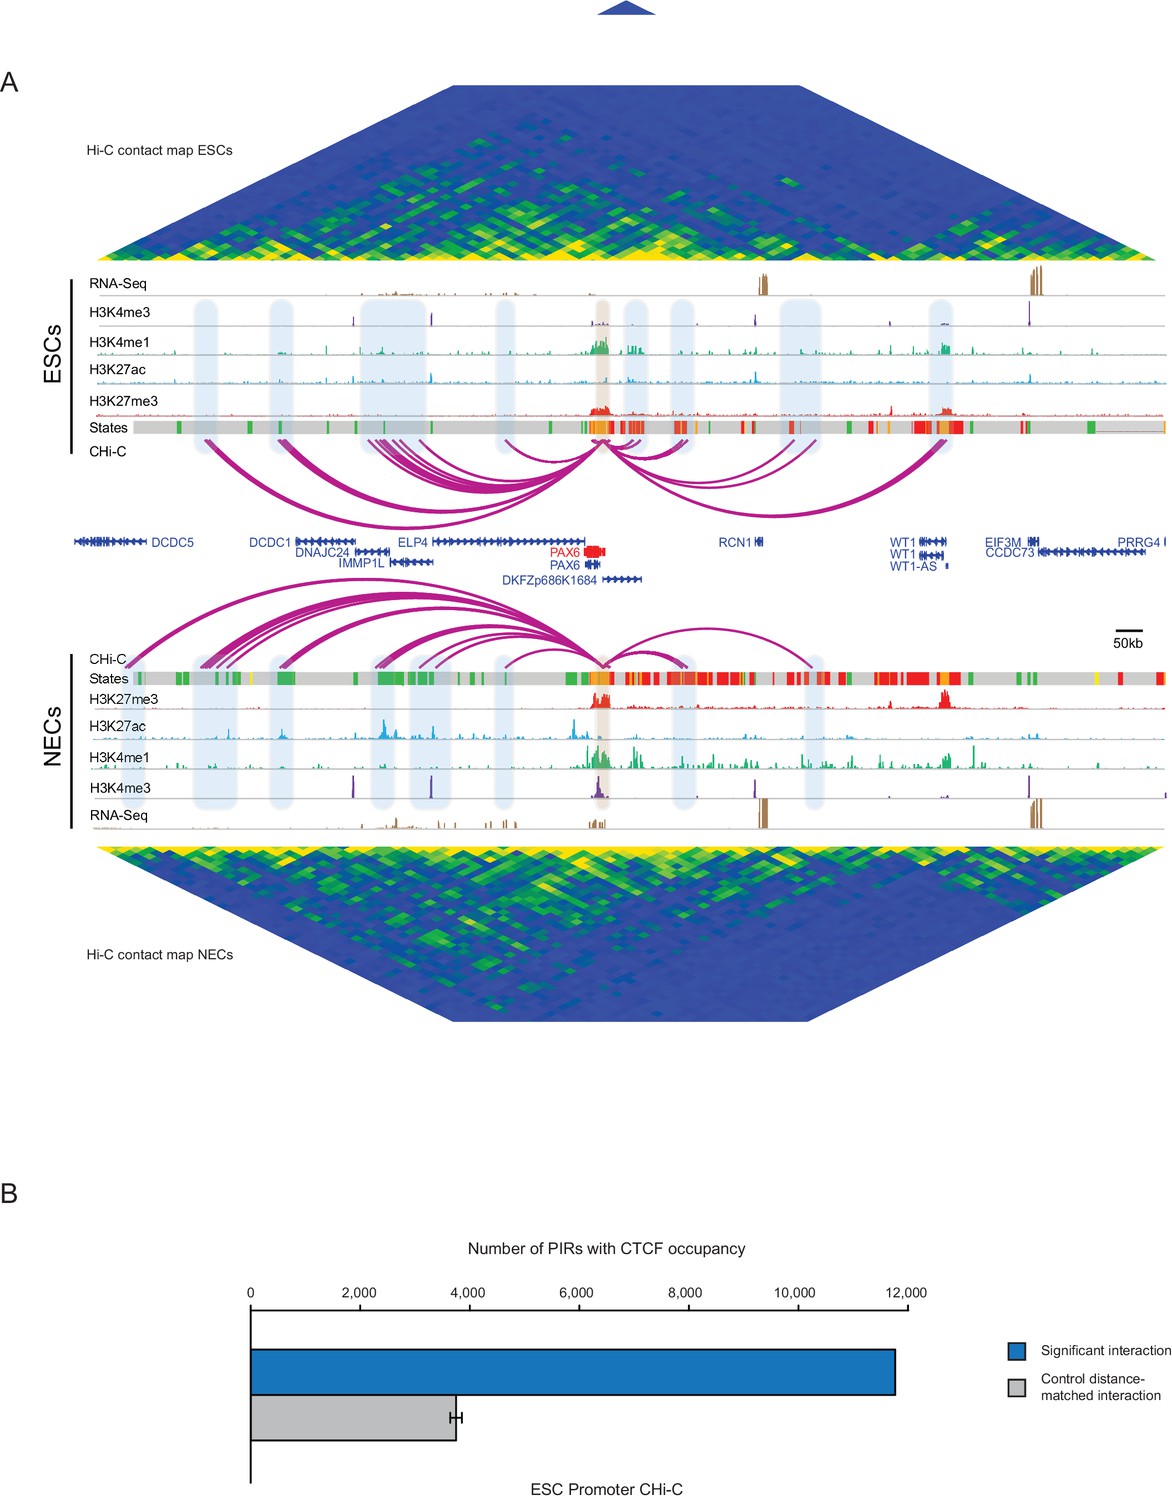
PAX6 promoter interactome and CTCF enrichment at PIRs.
(A) Genome browser representation of the PAX6 promoter interactome in ESCs (upper) and NECs (lower). Significant interactions are shown as purple arcs. ChIP-seq (H3K27me3, H3K27ac, H3K4me1, H3K4me3; from [Rada-Iglesias et al., 2011]) and mRNA-seq tracks are shown. Chromatin states for each genomic region were defined by ChromHMM (Ernst and Kellis, 2012) using ChIP-seq data (active chromatin, green; poised chromatin, orange; Polycomb-associated chromatin, red; intermediate, yellow; background, grey). Conventional Hi-C heatmaps of contact frequencies are shown for ESCs and NECs and reveal chromatin topology over this region. (B) PIRs in ESCs are significantly enriched in regions that contain CTCF binding sites, compared with promoter distance-matched random control regions (permutation test p-value<0.01). The blue bar shows the number of overlaps observed in detected PIRs, and the grey bar shows the mean number of overlaps observed in distance-matched random regions over 100 permutations. Error bars show 95% confidence intervals across permutations.
Figure 1—figure supplement 3

Integrated view of chromatin states and PCHi–C data.
(A) Definition of 16 ChromHMM emission states based on the relative presence or absence of signals from H3K27me3, H3K4me1, H3K27ac and H3K4me3 ChIP-seq data. Similar states were pooled to form six categories defined as active, poised, Polycomb, mixed, intermediate and background (see Materials and methods for details). (B) Integration of promoter interactions with chromatin states in ESCs (upper tracks) and NECs (lower tracks) for six different promoters. Purple arcs indicate significant interactions between the baited promoters and PIRs. Open circles denote background interaction signals and filled circles identify significant interactions (i.e. those exceeding the defined threshold CHiCAGO score, see Materials and methods). Filled circles have been coloured according to the chromatin state of the PIR (active, green; poised, orange; Polycomb-associated, red; intermediate, yellow; background, grey). The arrows correspond to the transcriptional state of the baited gene in ESCs and NECs (sharp end, active; blunt end, inactive).
Figure 1—figure supplement 4
Read-count interaction profiles for baited promoters presented in Figures 1–3.
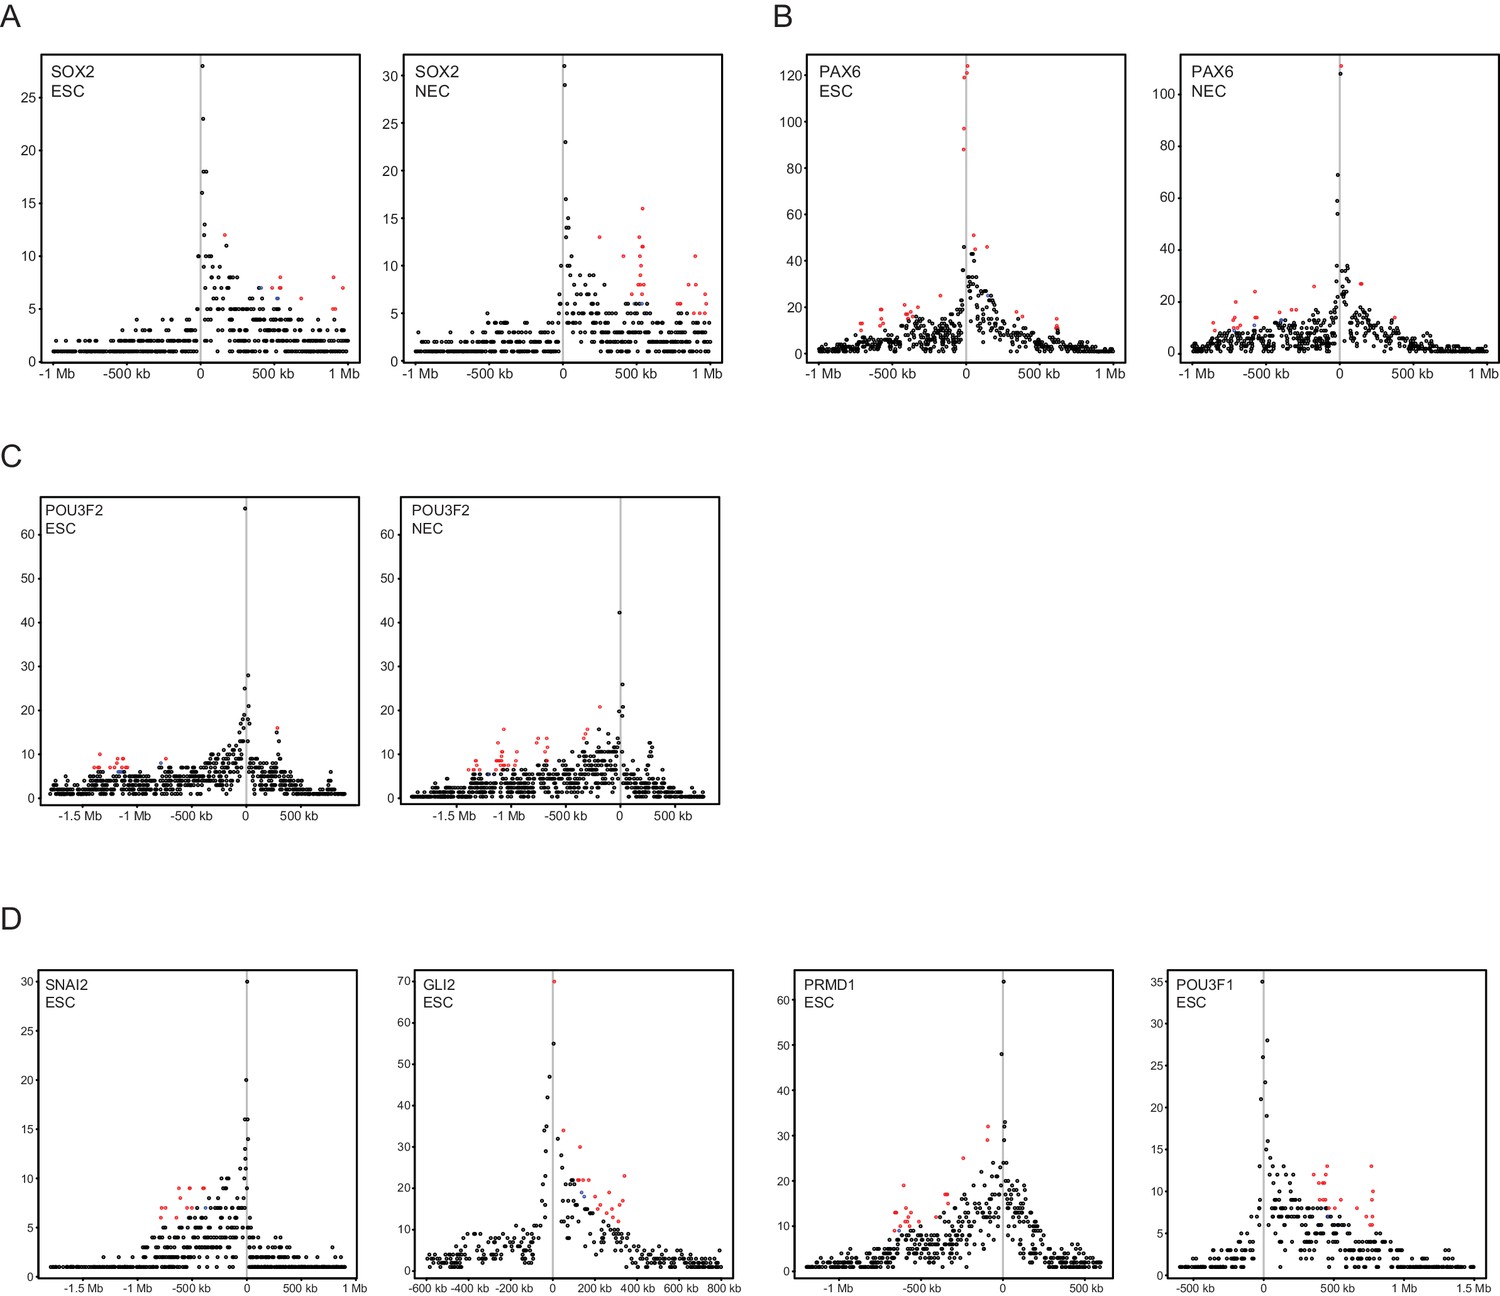
Plots show the read counts corresponding to the interactions of baited promoter fragments (grey line) with other HindIII fragments. Significant interactions detected by CHiCAGO (score ≥12) are shown in red, and sub-threshold interactions (score ≥11 in the cell type shown, and score ≥12 in the other cell type) are shown in blue. (A) SOX2, from Figure 1B. (B) PAX6, from Figure 1—figure supplement 2A. (C) POU3F2, from Figure 2A. (D) SNAI2, GLI2, PRDM1 and POU3F1, from Figure 3E–H.
Figure 2 with 1 supplement
Promoter-interacting regions can function as tissue-restricted developmental enhancers and identify associated target genes.
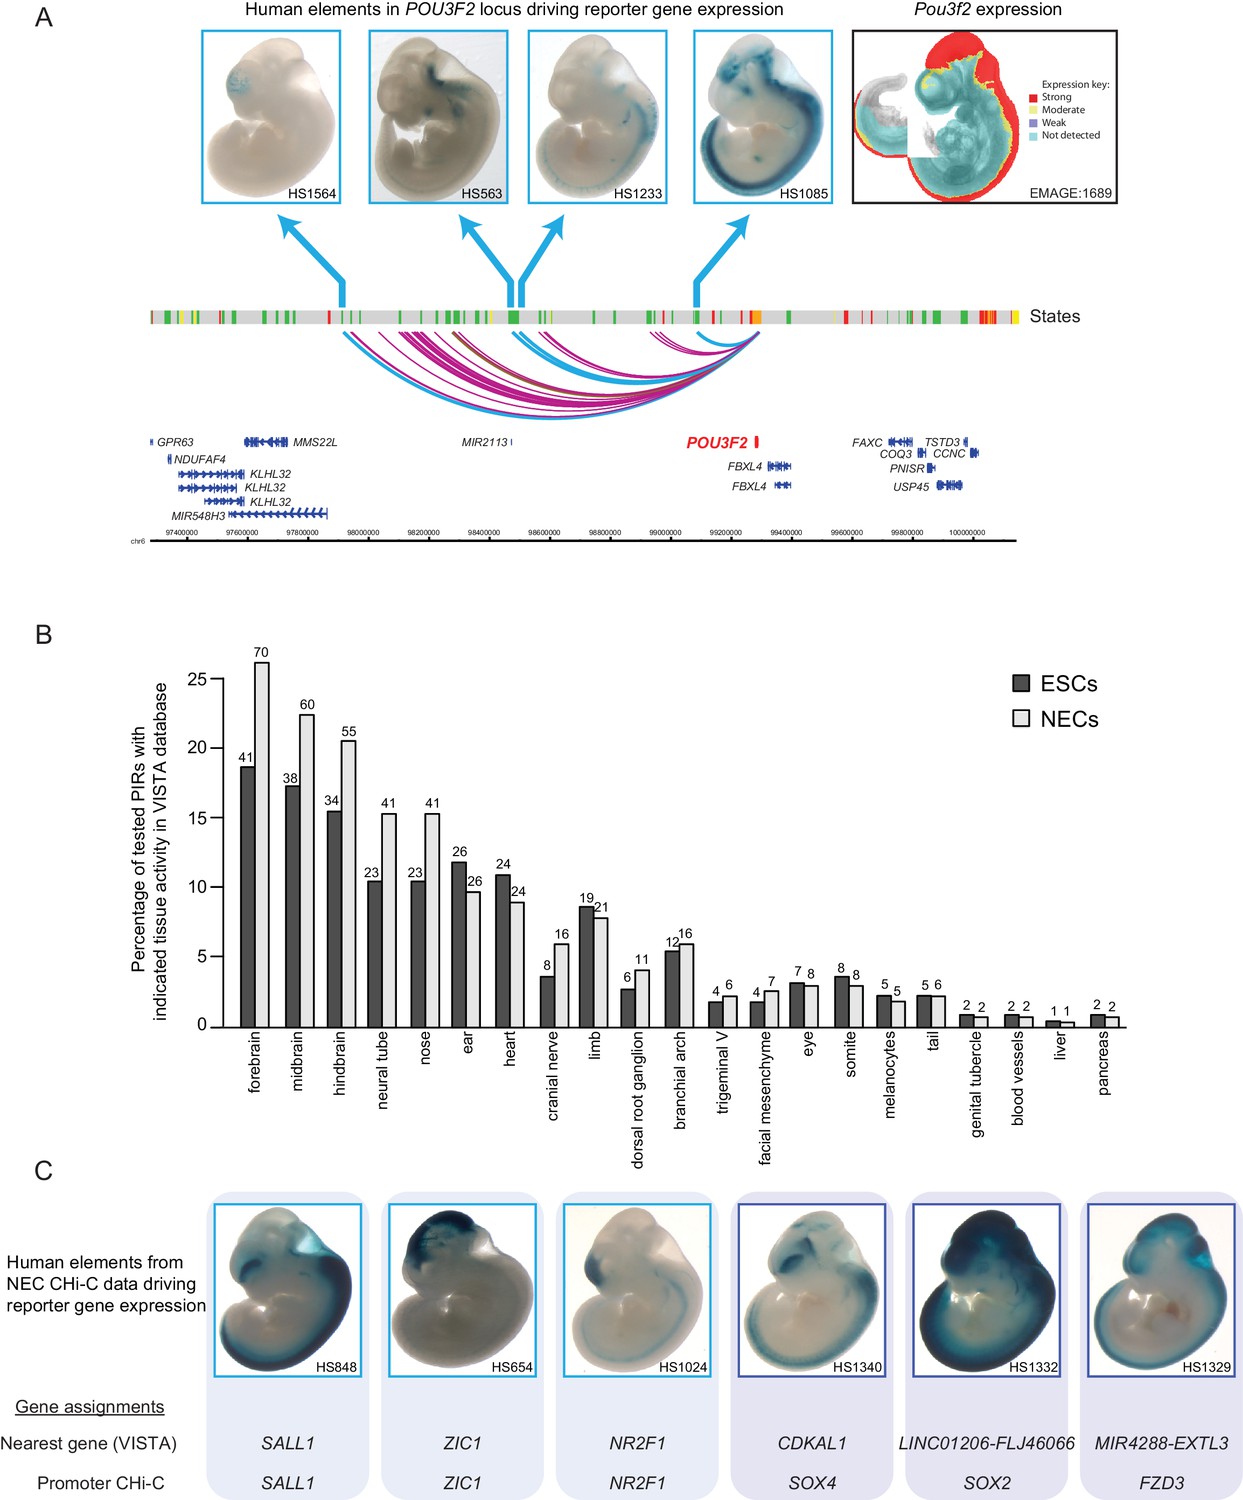
(A) A genome browser representation of the POU3F2 promoter interactome in NECs. Genome coordinates are shown underneath. Chromatin states are indicated (active chromatin, green; poised chromatin, orange; Polycomb-associated chromatin, red; intermediate, yellow; background, grey). Significant interactions are shown as coloured arcs. Five of the identified POU3F2 PIRs have been tested experimentally using a transgenic reporter assay as part of the VISTA Enhancer Browser (Visel et al., 2007). Of those five, four regions (indicated by blue arcs) can drive tissue-restricted LacZ expression in E11.5 mouse embryos. Representative images of X-gal stained mouse embryos are shown for each sequence. These show neural-restricted enhancer activity within the forebrain, midbrain, hindbrain and neural tube, which are tissues derived from NECs. The mRNA expression pattern of Pou3f2 in an E10.5 mouse embryo (EMAGE gene expression database; EMAGE:1689; [Richardson et al., 2014]) broadly matches the combined tissue-restricted pattern of its enhancers. One experimentally tested PIR (indicated by brown arc) is inactive at this developmental stage in mouse embryos. (B) PIRs identified in NECs are enriched for sequences that can drive reporter gene activity in neural tissues and other neuroectodermal derivatives (see also Figure 2—figure supplement 1A). The barplot shows the distribution of tissue-specific reporter expression patterns for all experimentally tested PIRs identified in ESCs (n = 219) and NECs (n = 267). Embryo reporter assays and enhancer activity patterns are from the VISTA Enhancer Browser (Visel et al., 2007). The number of PIRs active within a particular tissue is shown above each bar. PIRs with an active chromatin state in NECs showed an even more pronounced enrichment for enhancer activity in neural tissues (Figure 2—figure supplement 1B). (C) Representative images of X-gal stained mouse embryos from the VISTA Enhancer Browser (Visel et al., 2007) reveal neural-restricted reporter gene activity for six example NEC PIRs. Shown underneath is the gene promoter assignment for the associated enhancer in VISTA and in our PCHi-C dataset.
Figure 2—figure supplement 1
Active PIRs are enriched for enhancers with neural-specific activity.
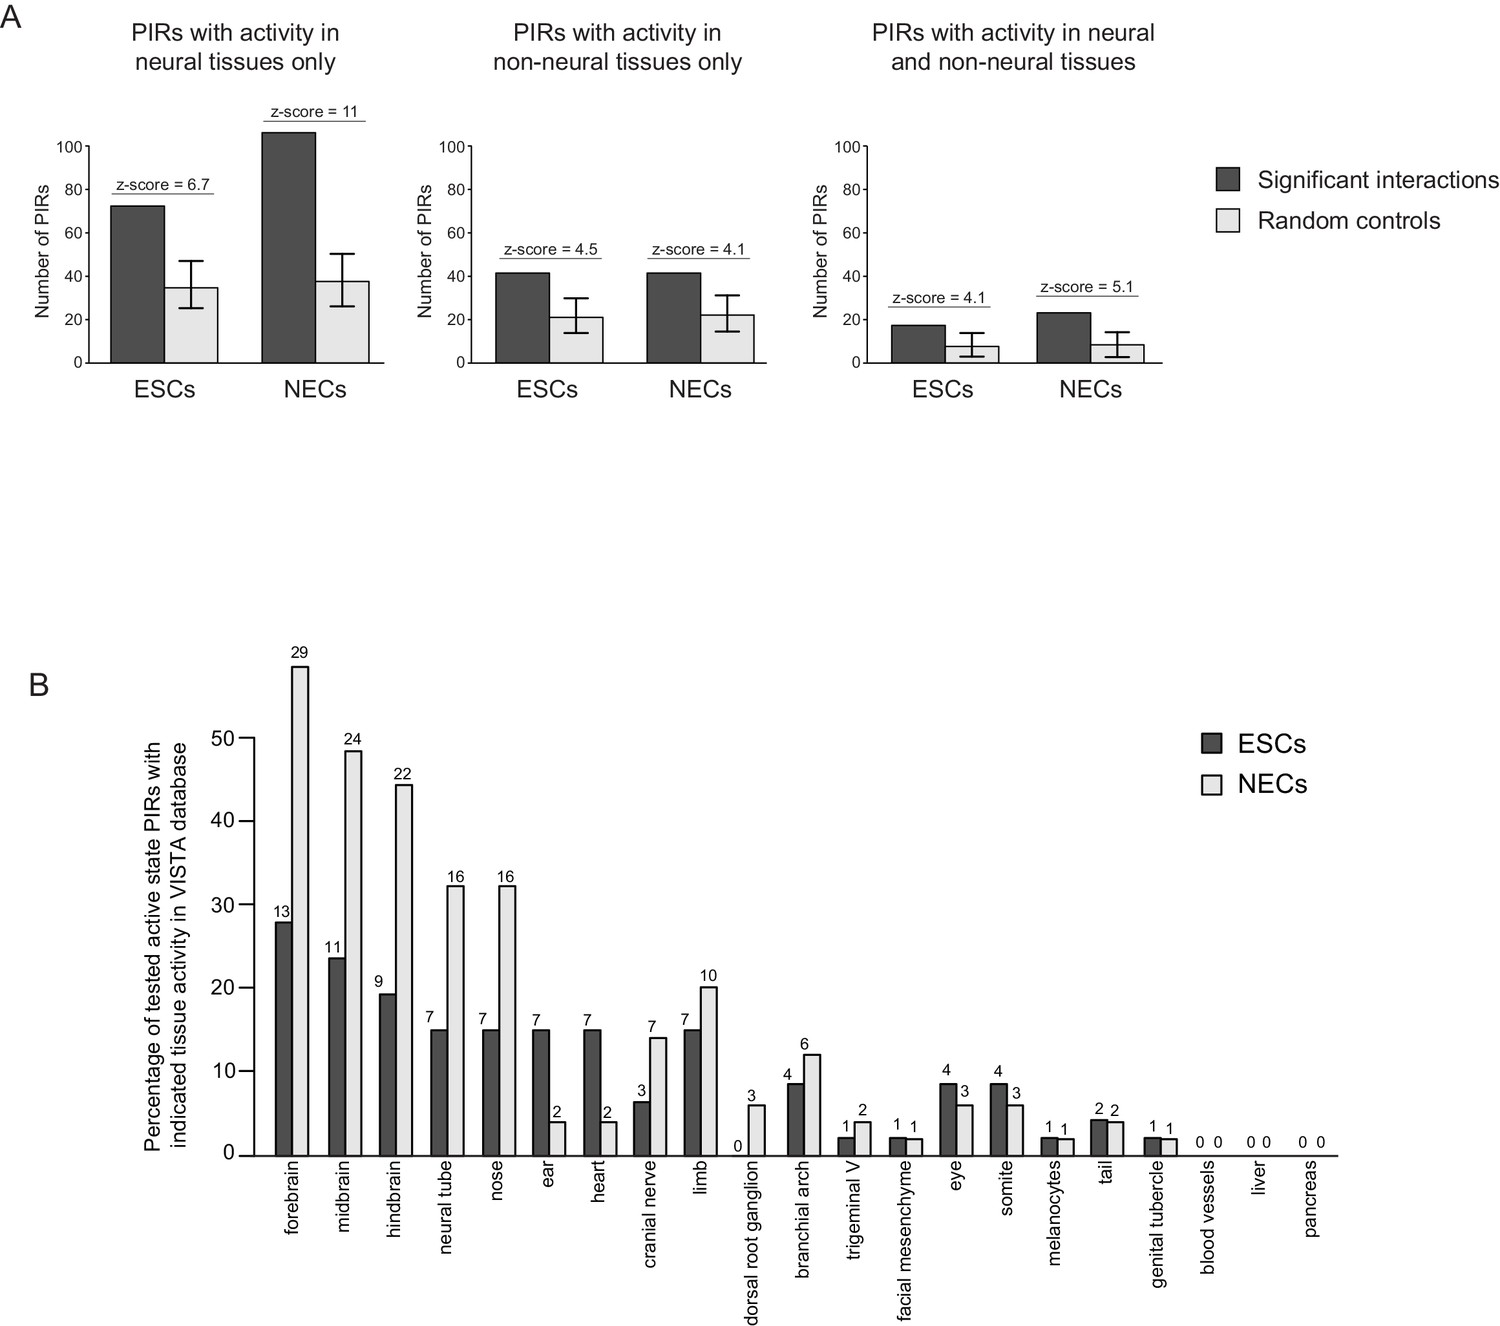
(A) In ESCs and NECs, PIRs are significantly enriched for VISTA-validated enhancer regions, compared to promoter distance-matched regions (p-value<0.001 for all six permutation tests based on 100 permutations). Black bars show the number of overlaps observed in PIRs, and light grey bars show the mean number of overlaps observed across the random samples. Error bars refer to 95% confidence intervals. (B) The barplot shows the distribution of tissue-specific reporter expression patterns for all experimentally tested PIRs with an active chromatin state in ESCs (n = 46) and NECs (n = 49). Embryo reporter assays and tissue expression patterns are from the VISTA Enhancer Browser (Visel et al., 2007). The number of PIRs active within a particular tissue is shown above each bar.
Figure 3 with 1 supplement
Characterisation of cis-regulatory units (CRUs).
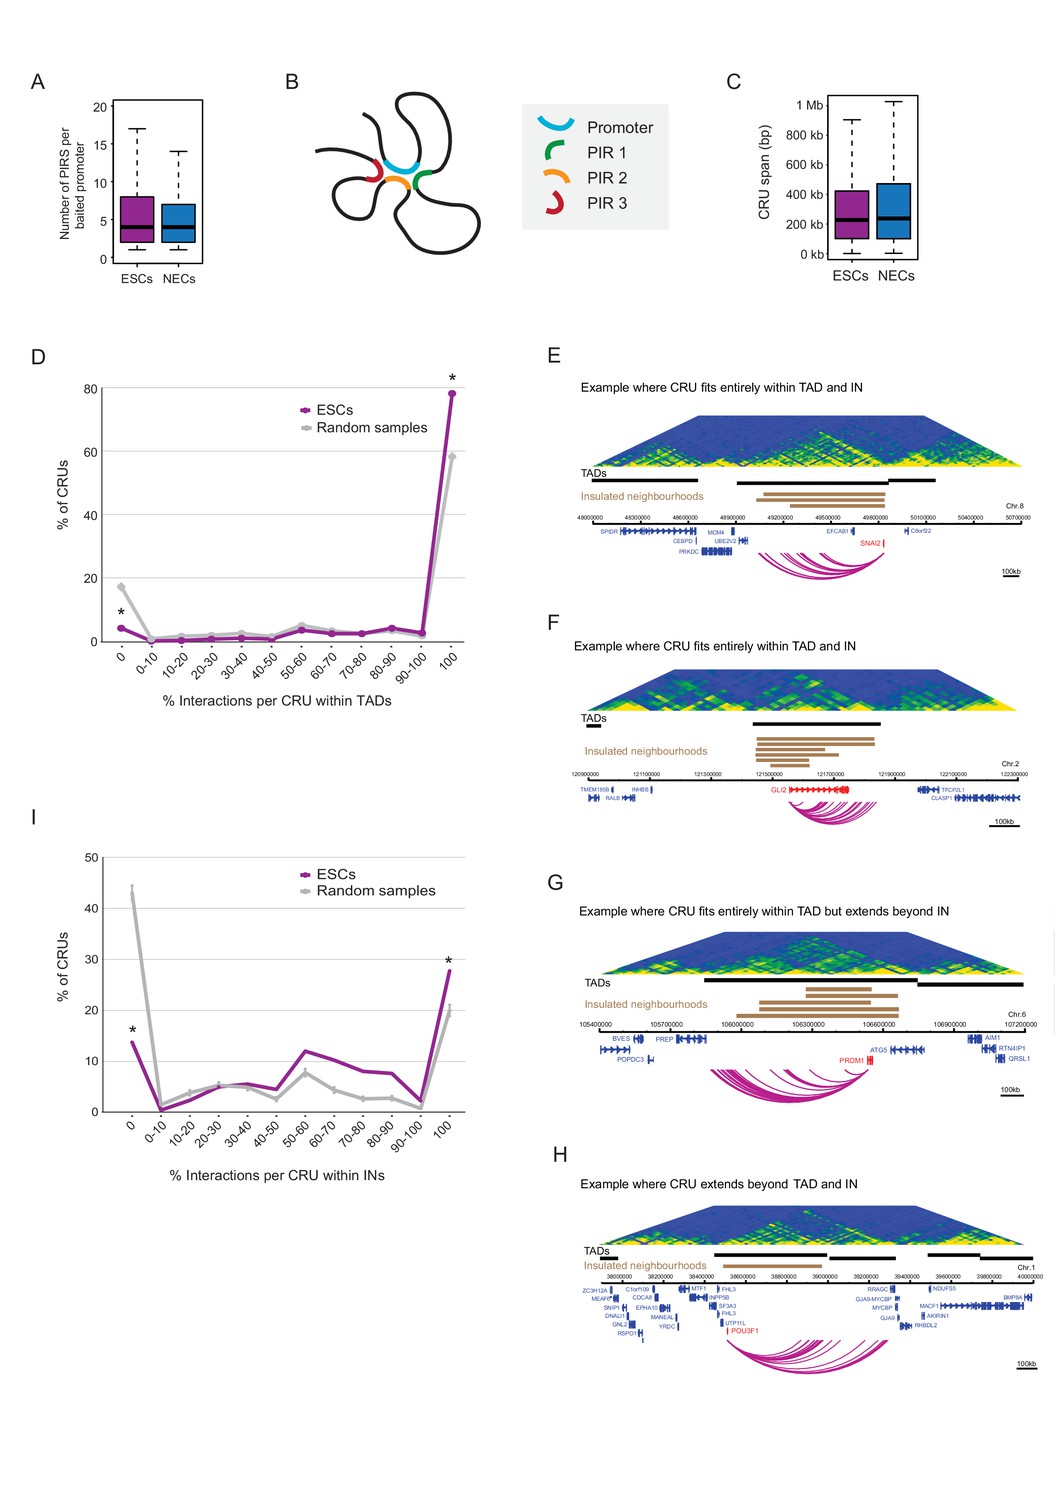
(A) Boxplot shows the distributions of the number of PIRs per interacting promoter in ESCs (n = 17955) and NECs (n = 18146). Promoters with no detected PIRs are not shown (4121 in ESCs; 3930 in NECs). The number of interactions per promoter showed only a minor dependence on transcriptional activity and promoter chromatin state (Figure 3—figure supplement 1A,B). (B) A schematic illustrating the concept of a CRU as a collection of all PIRs together with their associated promoter. Note that it cannot be ruled out that some PIRs may provide alternative rather than concurrent interactions. (C) Boxplot shows the distributions of CRU span in ESCs and NECs. We observed a moderate dependence between the span and the number of PIRs (Figure 3—figure supplement 1C). (D) CRUs are preferentially contained within an individual TAD. Line graph shows the percentage of CRUs with different proportions of interactions that reside within an individual TAD (purple) and the summary statistics (mean and 95% confidence error bars) obtained for 1000 random samples, keeping the same CRU structure (grey). There is a significant tendency for CRUs to be contained entirely within a TAD ( * denotes permutation test p-value<0.001). In addition, fewer CRUs span entirely over a TAD boundary (* denotes permutation test p-value<0.001). The 1000 random samples were generated by permutations of CRUs across all promoter fragments, retaining the same overall CRU structure. Error bars show 95% confidence intervals. Data shown are for ESCs (n = 9008 CRUs); data for NECs are shown in Figure 3—figure supplement 1D. We found that CRUs crossing TAD and IN boundaries generally contained a higher number of PIRs (Figure 3—figure supplement 1F,G). E–H) Genome browser representations of CRUs in ESCs. Examples include the SNAI2 CRU (E) and GLI2 CRU (F), which both fit entirely within a TAD and INs; PRDM1 CRU (G), which fits entirely within a TAD but extends beyond INs, and POU3F1 CRU (H), which extends over a TAD boundary and also beyond an IN. (I) CRUs are preferentially contained within INs, but interactions can extend beyond IN boundaries. The line graph shows the percentage of CRUs with different proportions of interactions that reside within an individual IN in ESCs (coordinates obtained from [Ji et al., 2016]). There is a significant tendency for CRUs (purple) to be contained entirely within an IN, compared to random (grey) (* denotes p-value<0.001 from a permutation test done with 1000 random samples). In addition, fewer CRUs span entirely beyond an IN (* denotes p-value<0.001 from a permutation test done with 1000 random samples). Error bars show 95% confidence intervals. Promoters outside of a defined IN were excluded from the analysis.
Figure 3—figure supplement 1

Additional CRU characterisation.
(A) Boxplots showing the number of PIRs per promoter in ESCs (left) and NECs (right), separated by gene expression quartiles. (B) Number of PIRs per promoter in ESCs (left) and NECs (right), separated by promoter chromatin state. (C) Number of PIRs per CRU in ESCs (left) and NECs (right), separated by CRU span length. These variables are significantly positively correlated in both cell types according to Spearman’s association test (ρ = 0.063, correlation test p<0.001 in ESCs and ρ = 0.111, correlation test p<0.001 in NEC). (D) CRUs are preferentially contained within an individual TAD in NECs (n = 9361 CRUs). Line graph shows the percentage of CRUs with different proportions of interactions that reside within an individual TAD (blue) and the summary statistics (mean and 95% confidence error bars) obtained for 1000 random samples, keeping same CRU structure (grey). There is a significant tendency for CRUs to be contained entirely within a TAD (* denotes permutation test p-value<0.001). In addition, fewer CRUs span entirely over a TAD boundary (* denotes permutation test p-value<0.001). The 1000 random samples were generated by permutations of CRUs across all promoter fragments, retaining the same overall CRU structure. Error bars show 95% confidence intervals. (E) Percentage of CRUs that cross TAD boundaries in ESCs and NECs. Orange bars show results for ESCs and NECs; grey bars show results for 1000 random permutations of CRUs across all promoter fragments, keeping the overall CRU structure. Error bars show 95% confidence intervals. For ESCs, we show the results obtained with TADs called by two different methods (left, Dixon et al., 2012; right, this study). Promoters overlapping TAD boundaries were excluded from this analysis, as were interactions where both ends were not included in any TAD. CRUs in both ESCs and NECs cross TAD boundaries less frequently than expected by random as the difference in height between the orange and grey bars is larger than the 95% confidence interval (permutation test, p-value<0.001). (F) Number of PIRs per CRU in ESCs (left) and NECs (right), separated by whether the CRU crosses a TAD boundary (‘Inter-TAD’) or is contained within an individual TAD (‘Intra-TAD’). In both cell types, CRUs crossing TAD boundaries have significantly more interactions than CRUs fully contained within a TAD (ESCs - p-value<0.001, NECs - p-value<0.001, according to two-sided Wilcoxon rank sum tests). (G) Number of PIRs per CRU in ESCs, separated by whether the CRU crosses an IN boundary or is contained within an IN. CRUs crossing IN boundaries have significantly more interactions than CRUs fully contained within INs (p-value<0.001 according to two-sided Wilcoxon rank sum test). (H) Strength of TAD boundaries, separated by whether they are crossed or not crossed by promoter interactions in ESCs (left) and NECs (right). (I) The line graph shows the percentage of CRUs with different proportions of interactions that reside within the largest span of each overlapping IN set (coordinates calculated from [Ji et al., 2016]). Fewer than 50% of CRUs, but significantly more than expected at random, were fully contained with the extremities of IN boundaries (* denotes permutation test p-value<0.001). In addition, fewer CRUs span entirely over an IN boundary (* denotes permutation test p-value<0.001). The 1000 random samples were generated by permutations of CRUs across all promoter fragments, retaining the same overall CRU structure. Error bars show 95% confidence intervals. Promoters outside of a defined IN were excluded from the analysis.
Figure 4 with 3 supplements
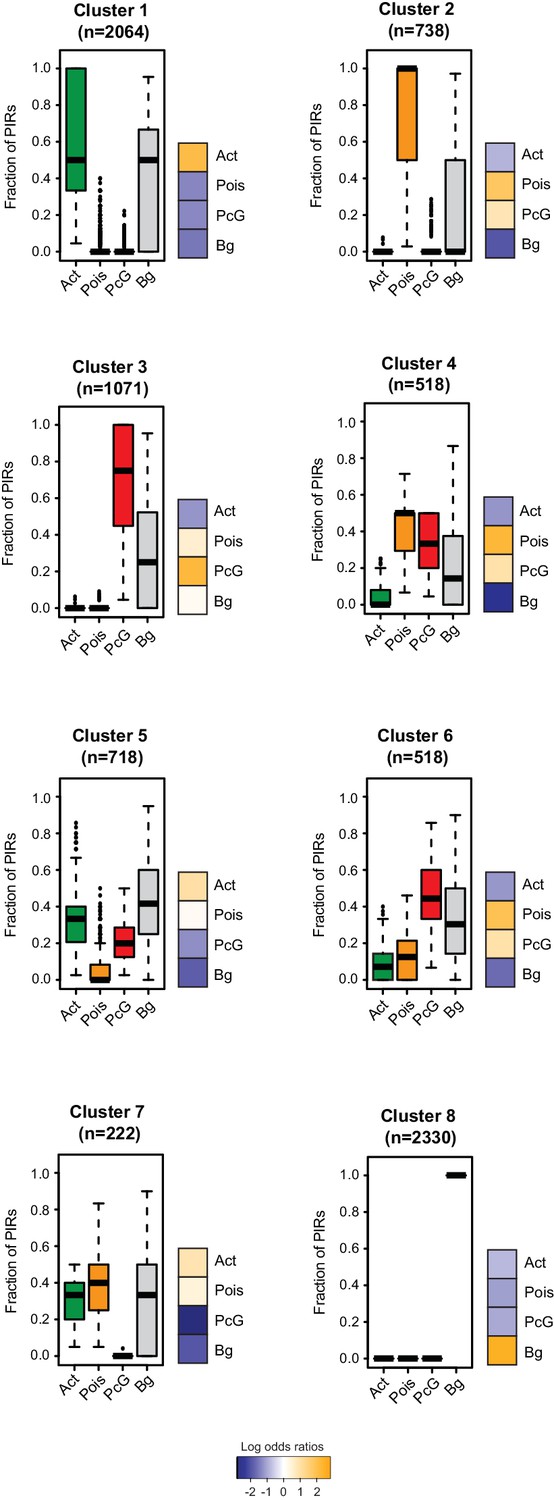
Clustering of CRUs according to chromatin state of each PIR in ESCs.
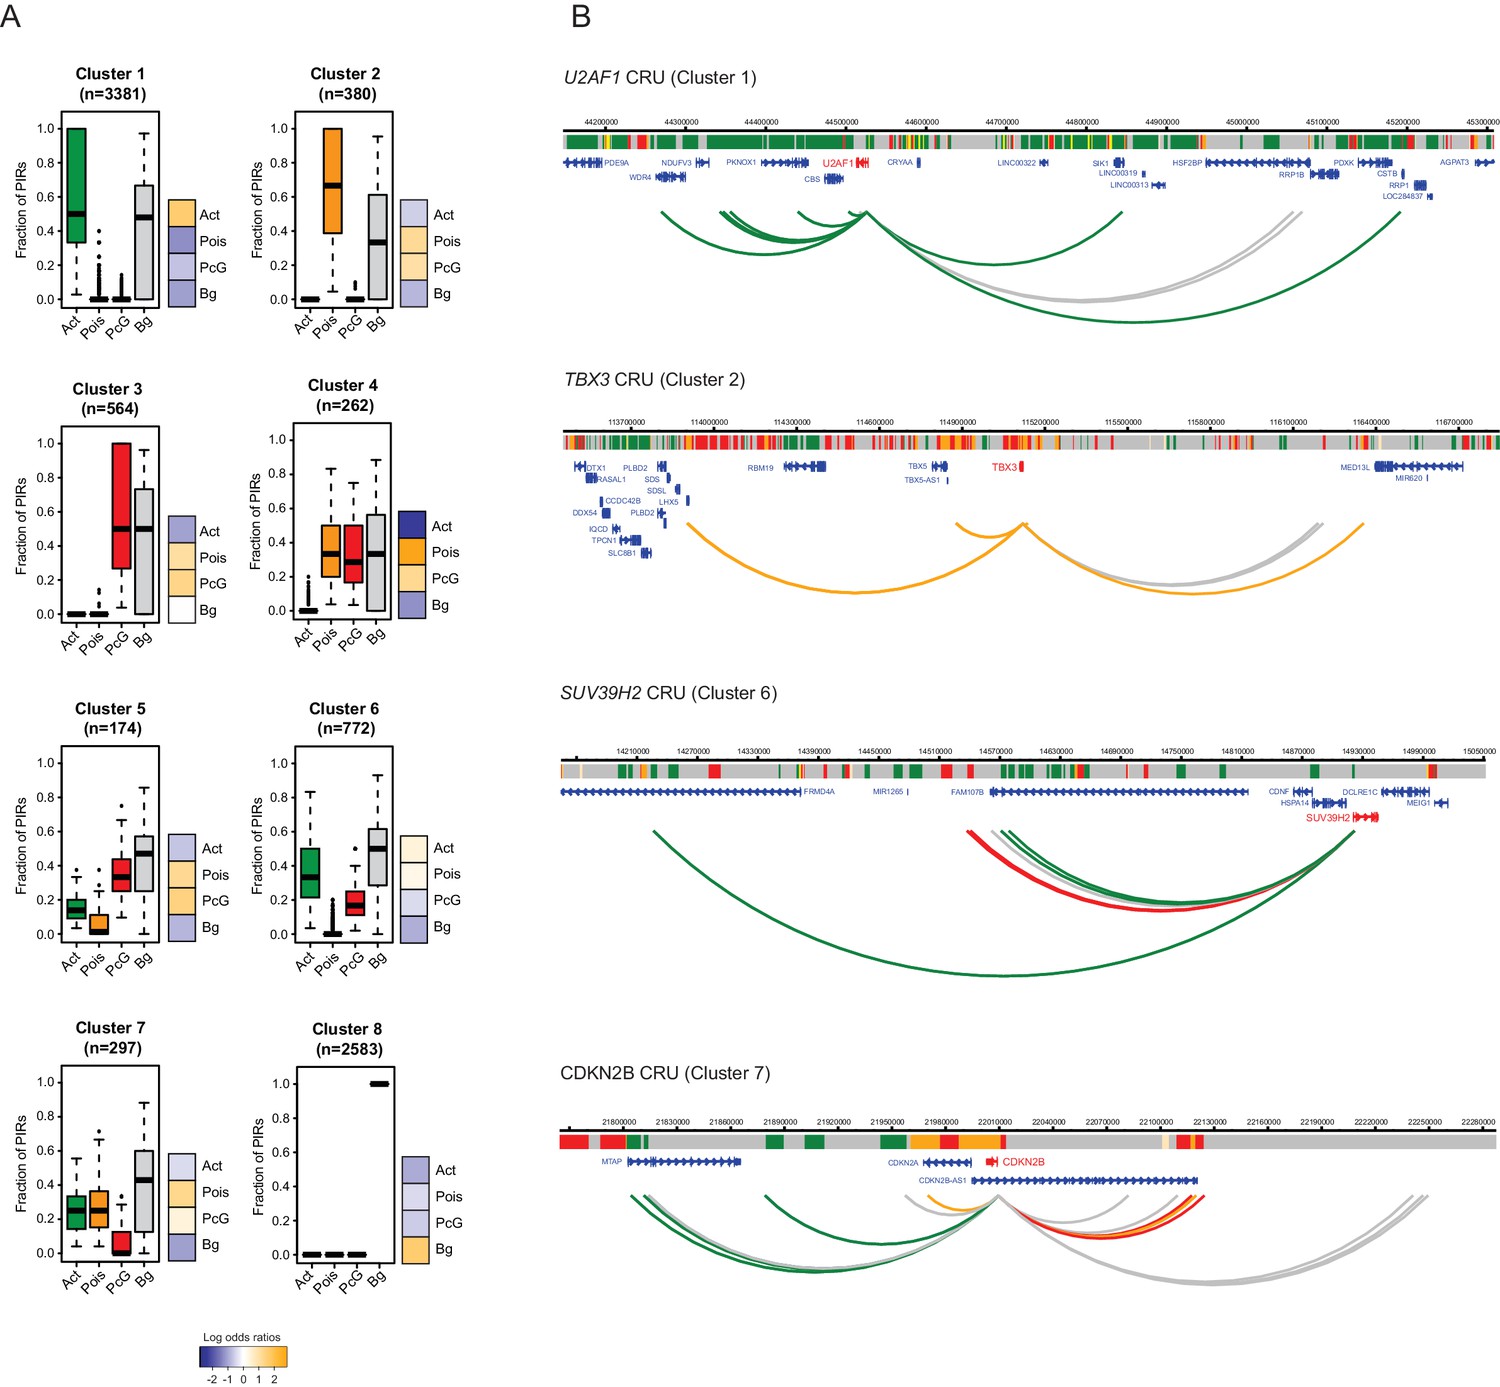
(A) CRUs from ESCs were clustered hierarchically according to the distribution and fractions of their PIRs that correspond to each chromatin state. Boxplots show the distribution of PIR fractions for each chromatin state (Act, active; Pois, poised; PcG, Polycomb-associated; Bg, background). Heatmaps show the log2 odds ratios of observing each promoter state associated with a CRU in each cluster (p<0.001, χ2 test on the contingency table). Data for NECs are shown in Figure 4—figure supplement 1. (B) Genome browser representations of CRUs in ESCs. U2AF1 CRU from cluster 1 and TBX3 CRU from cluster 2, each exemplify cases where non-background PIRs within a CRU are associated with a uniform chromatin state. SUV39H2 CRU from cluster 6 and CDKN2B CRU from cluster 7, each exemplify cases where PIRs within a CRU are associated with multiple chromatin states. Interaction arcs are coloured according to PIR chromatin state (active, green; poised, orange; Polycomb-associated, red; background, grey). See Figure 4—figure supplement 2 for additional examples, and Figure 4—figure supplement 3 for read count interaction profiles.
Figure 4—figure supplement 1
Clustering of CRUs according to chromatin state of each PIR in NECs.
CRUs were hierarchically clustered according to their fractions of PIRs from different chromatin states in NECs. Boxplots depict the distribution of PIR fractions for each chromatin state (Act, active; Pois, poised; PcG, Polycomb-associated; Bg, background). Heatmaps coupled to boxplots show log2 odds-ratios of promoter states (p-value<0.001, χ2 test on the contingency tables).
Figure 4—figure supplement 2
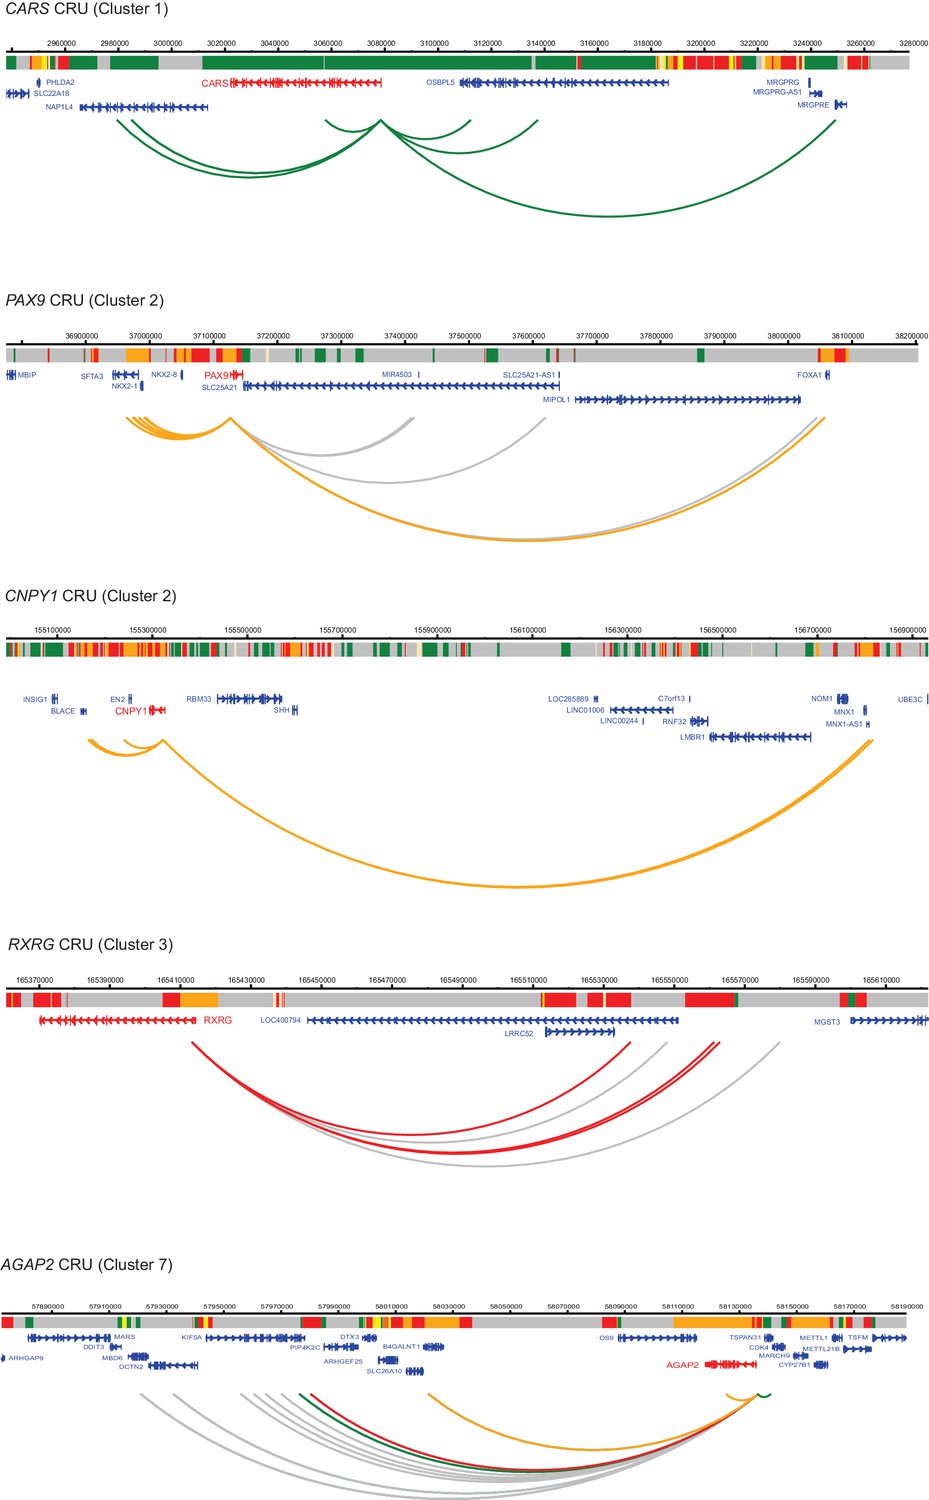
Additional examples of CRUs in ESCs.
Genome browser representations of CRUs in ESCs. Interaction arcs are coloured according to PIR chromatin state (active, green; poised, orange; Polycomb-associated, red; background, grey).
Figure 4—figure supplement 3
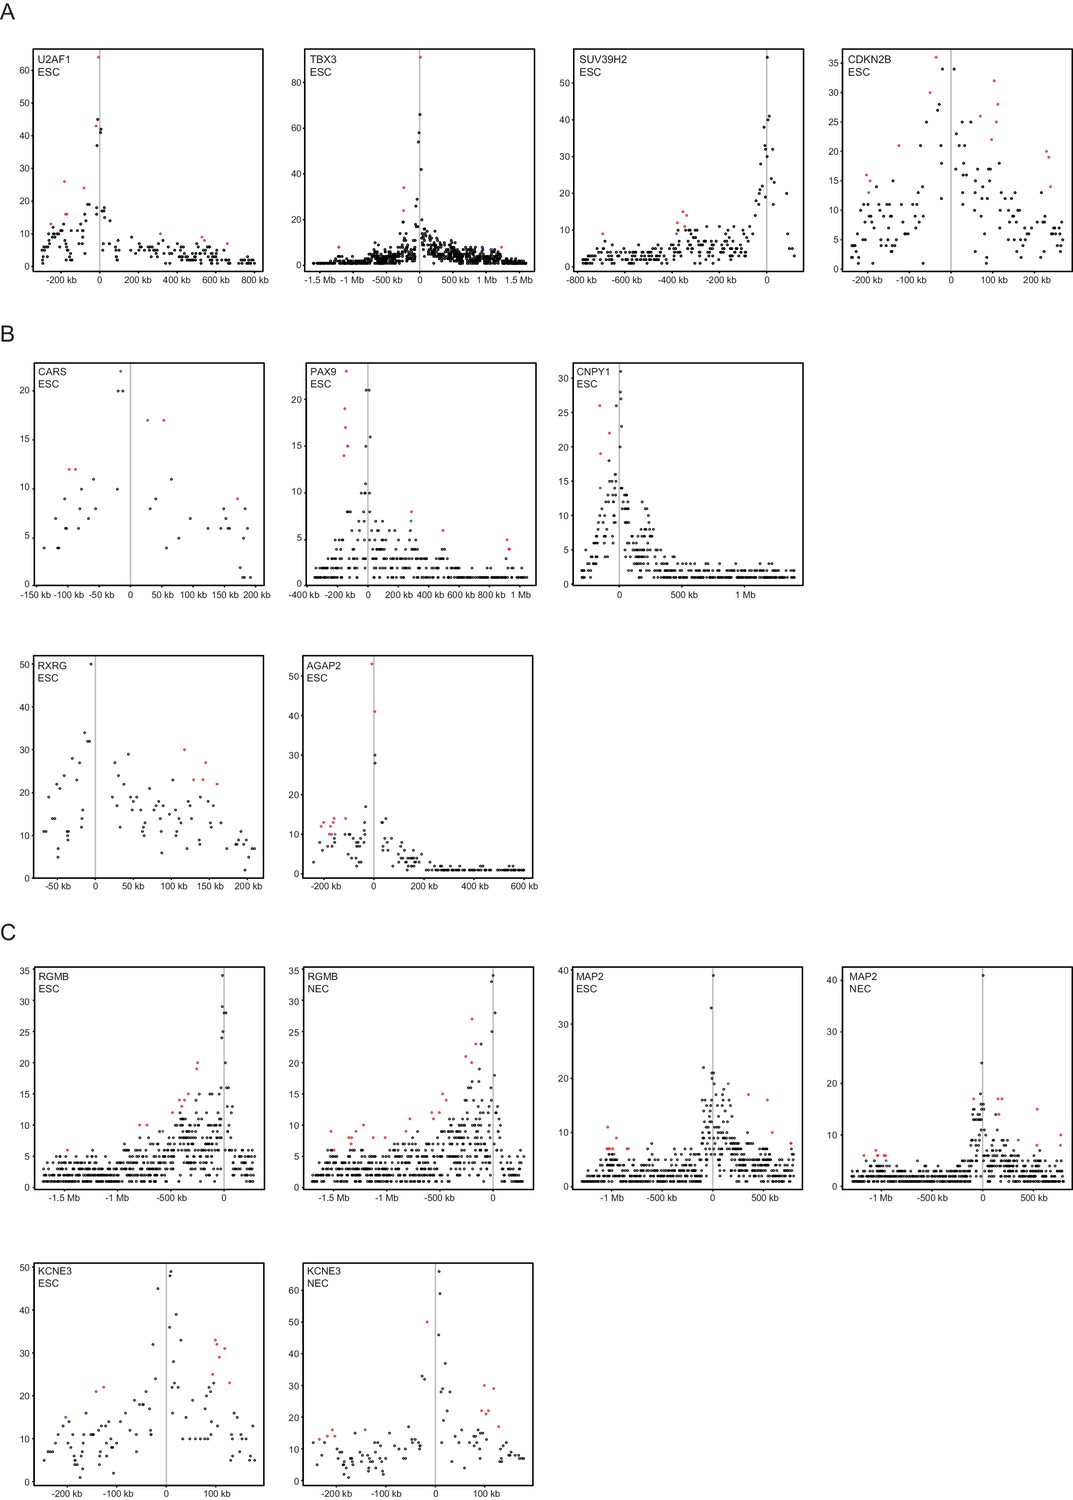
Read-count interaction profiles for baited promoters presented in Figures 4 and 5.
Plots show the read counts corresponding to the interactions of baited promoter fragments (grey line) with other HindIII fragments. Significant interactions detected by CHiCAGO (score ≥12) are shown in red, and sub-threshold interactions (score ≥11 in the cell type shown and score ≥12 in the other cell type) are shown in blue. (A) U2AF1, TBX3, SUV39H2 and CDKN2B from Figure 4B. (B) CARS, PAX9, CNPY1, RXRG and AGAP2 from Figure 4—figure supplement 2. (C) RGMB, MAP2 and KCNE3 from Figure 5D–F.
Figure 5
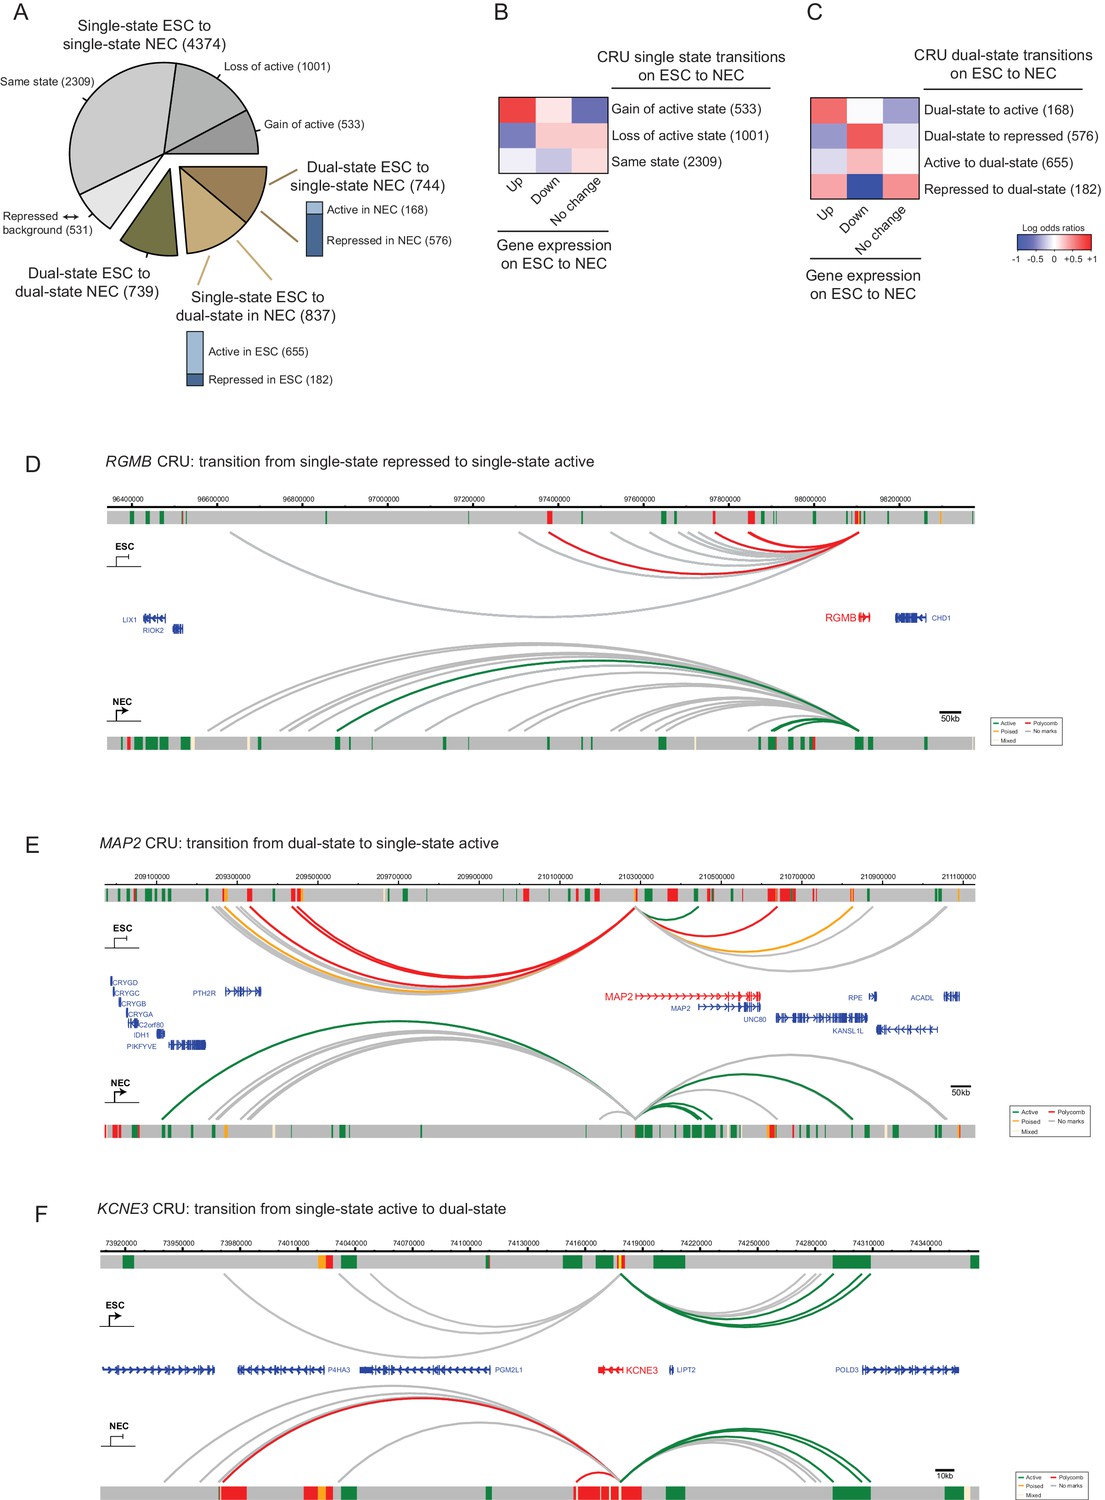
CRU state transitions occur during ESC differentiation and are associated with changes in gene transcription.
(A) Pie chart summarising CRU state transitions that occur upon ESC to NEC differentiation. The number of CRUs within each transition category are shown. Transitions that involve dual-state to single-state, and single-state to dual-state, are further subdivided into whether the single-state is classified as active or repressed (Polycomb-associated or poised). (B–C) Heatmaps show the log2 odds ratios for CRU state transitions and associated changes in gene expression. (B) Single-state transitions showing a non-random segregation withgene expression changes (p-value=0.0031, Fisher’s exact test); (C) dual-state transitions showing a non-random segregation with gene expression changes (p-value=0.0014, Fisher’s exact test). Number of CRUs within each transition category are shown. Genes differentially expressed between ESCs and NECs were identified using DESeq2 (FDR < 0.05 and a log2 fold change of >1.5). Repressed state includes Polycomb-associated and poised states. (D–F) Genome browser representations of CRU state transitions that occur upon the differentiation of ESCs (top image) to NECs (lower image). (D) RGMB provides an example of a CRU transitioning from a single repressed to a single active state and an associated increase in RGMB transcription. (E) MAP2 provides an example of a dual-state to a single active state CRU transition and an associated increase in MAP2 transcription. (F) KCNE3 provides an example of a single active state to a dual-state CRU transition and an associated decrease in KCNE3 transcription. Arcs are coloured according to PIR chromatin state (active, green; poised, orange; Polycomb-associated, red; background, grey).
Figure 6 with 1 supplement
Interaction Dynamics: ‘recolouring’ versus ‘rewiring’.
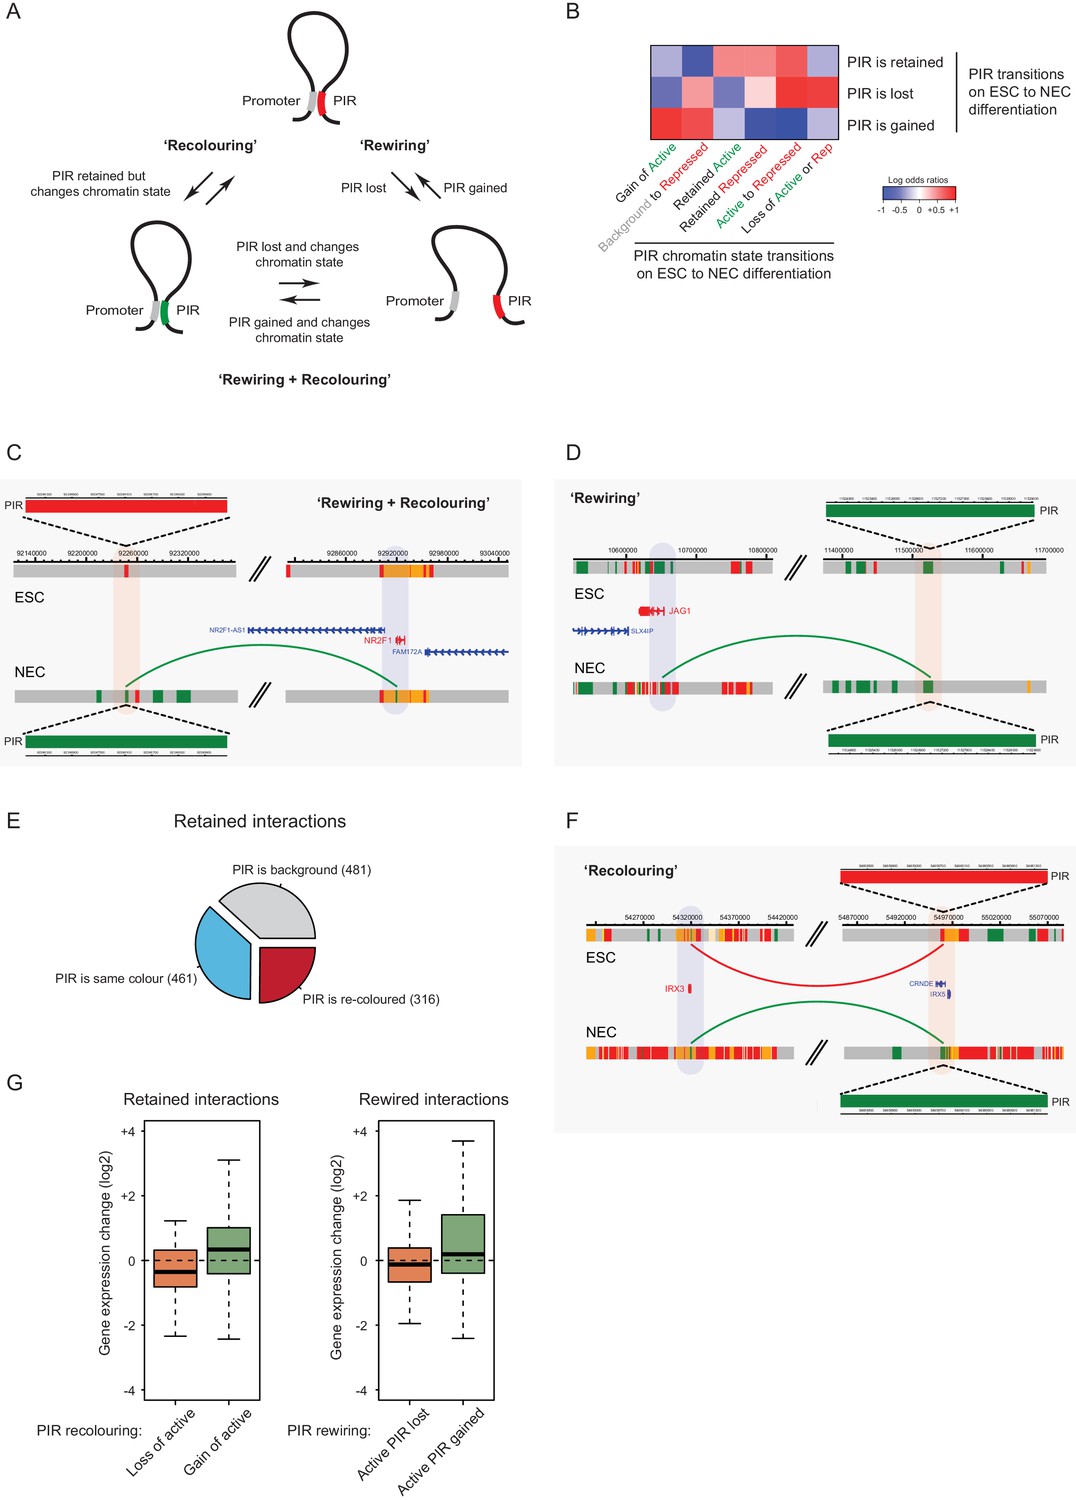
(A) A schematic of interaction dynamics during cell differentiation. In a ‘recolouring’ interaction (left)the PIR undergoes a change in chromatin colour (reflecting a change in chromatin state) between the two cell types. In a ‘rewiring’ interaction (right), an interaction is gained or lost upon cell differentiation. In a 'rewiring + recolouring' interaction, the loss or gain of an interaction is concomitant with changes in chromatin colour at the respective PIR. (B) Heatmap of log2 odds ratios showing the association between different PIR chromatin state transitions (recolouring) and PIR interaction dynamics (rewiring) on ESC to NEC differentiation (p-value<0.001, Fisher’s exact test). (C–D) Genome browser representations of interaction dynamics upon ESC to NEC differentiation. Note that only one interaction is shown for each example. Arcs are coloured according to PIR chromatin state (active, green; Polycomb-associated, red). (C) Rewiring and recolouring: upon differentiation, NR2F1 gains an interaction with a PIR that is active in NECs, but repressed in ESCs. (D) Rewiring: the JAG1 promoter gains an interaction with an active PIR in NECs. Additional examples are shown in Figure 6—figure supplement 1A,B. (E) Pie chart summarising the different scenarios in which an interaction is retained upon ESC to NEC differentiation. (F) Recolouring: the IRX3 promoter retains an interaction, but the PIR changes from repressed (in ESCs) to active (in NECs). (G) Boxplots revealing the transcriptional changes as a function of active PIR dynamics during recolouring (left) and rewiring (right) events. In either scenario, there was a significant association between the acquisition and loss of an active state and changes in gene expression (p-values<0.001 for both recolouring and rewiring according to one-sided Wilcoxon rank sum tests).
Figure 6—figure supplement 1
Interaction dynamics involving recolouring and rewiring.
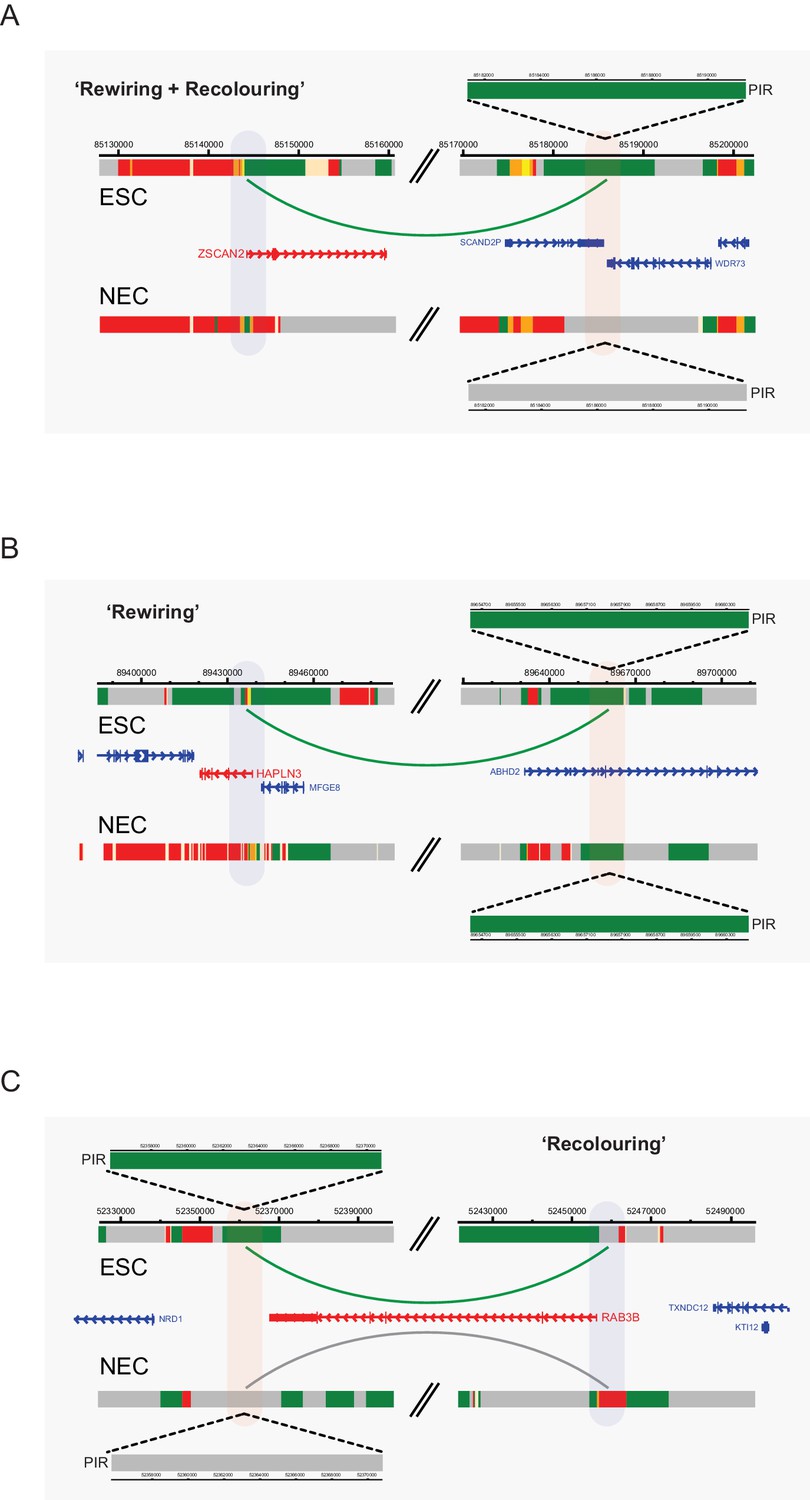
Genome browser representations of interaction dynamics upon ESC to NEC differentiation. Note that only one interaction is shown for each example. Arcs are coloured according to PIR chromatin state (active, green; background, grey). (A) Rewiring and recolouring: ZSCAN2 loses an interaction with a background PIR that was previously classified as active in ESCs. (B) Rewiring: HAPLN3 promoter loses an interaction with an active PIR. (C) Recolouring: RAB3B promoter retains an interaction, but the PIR changes from active to background.
Author response image 1

CHiCAGO detection of cross-TAD and within-TAD interactions.
(A) The effect of TAD boundary crossing on background levels. In line with the CHiCAGO background estimation procedure (see Additional file 1, Cairns et al., 2016), we used 20kb distance bins to tile 3Mb regions centred at each bait. For each bin and bait, we computed a normalized number of reads as the average number of reads linking fragments in this bin with the baited fragment, divided by the baited fragment’s bias factor. These values were then considered separately for bins mapping within the same TAD as the respective bait and for those separated from the bait by at least one TAD boundary. Solid lines show the median log-transformed normalised number of reads and ribbons show the interquartile range. It can be seen that the CHiCAGO background estimate (dashed line) is very close to the background estimate computed for within-TAD interactions separately, suggesting that within-TAD pairs primarily drive CHiCAGO’s background model. In contrast, bins that lie beyond a TAD boundary have lower background levels, consistent with the reviewers’ expectation. Furthermore, stronger TAD boundaries correspond to a larger decrease in background level, though this effect is nonlinear. Since the estimated background is higher than the true background, this increases the stringency of CHiCAGO calls for TAD-crossing interactions. (B) The read counts of significant interactions, stratified by whether they cross a TAD boundary or not, and by distance bin. It can be seen the read count distributions of the CHiCAGO-identified TAD-crossing and within-TAD interactions (CHiCAGO score > 12) show only minor differences.
Author response image 2
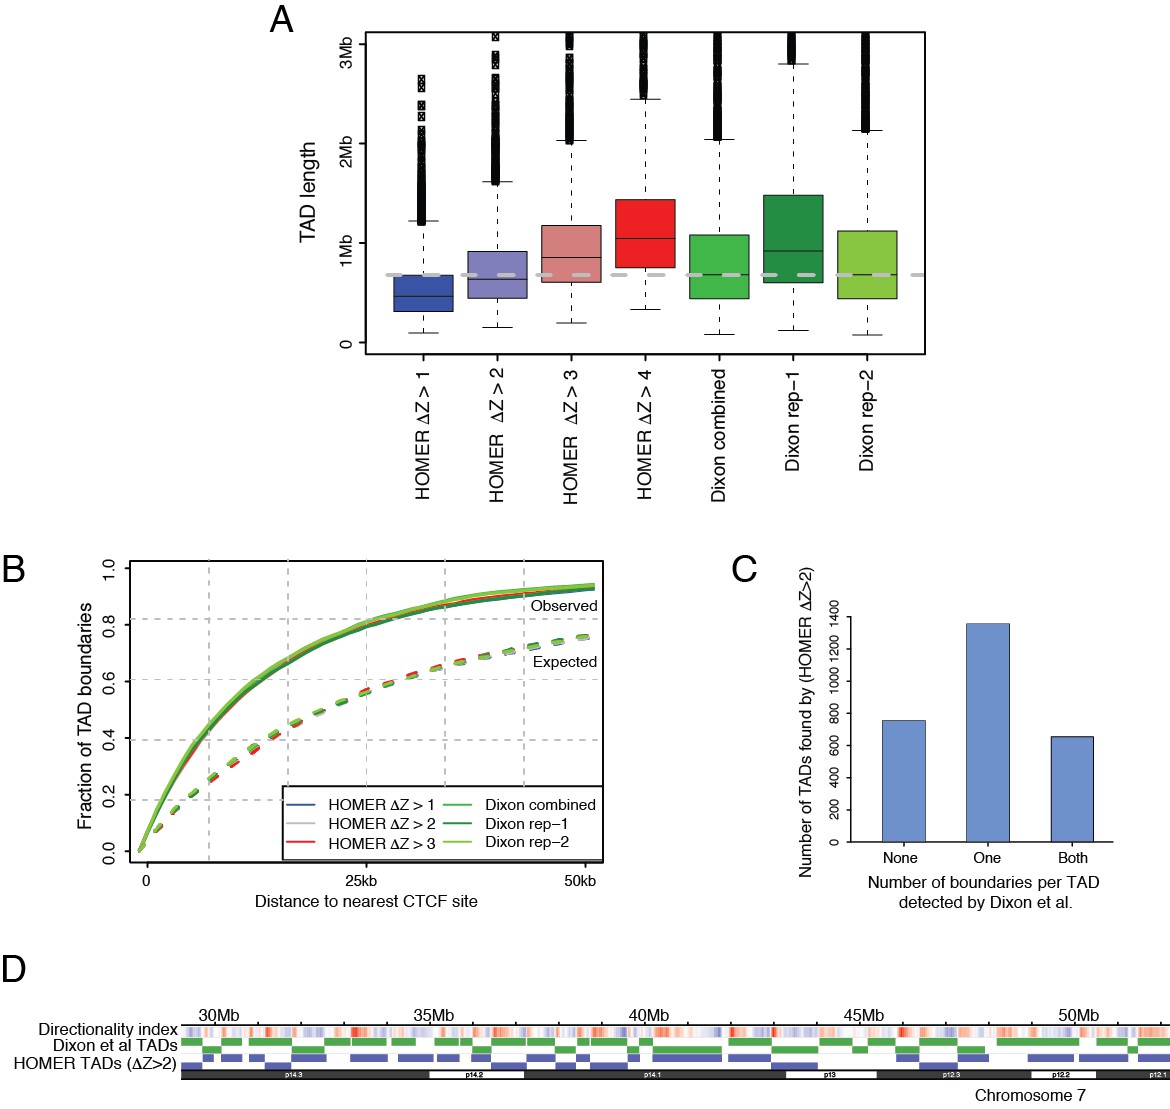
Tuning a signal threshold for TAD detection with HOMER.
(A) Box plots show TAD length distributions for TADs called by HOMER using a range of TAD ∆Z score thresholds (blue to red boxes), as well as for the published TADs from Dixon et al., 2015 detected with individual and combined Hi-C replicates (green boxes). The dashed grey line marks the median TAD length of the combined Dixon et al., 2015 data. (B) Overlap with CTCF sites for TADs called by HOMER using a range of TAD ∆Z score thresholds (blue to red lines), and for the published TADs from Dixon et al., 2015. (green lines). Solid lines show the observed fraction of TAD boundaries mapping within given distances from CTCF sites, and dashed lines show the expected fraction using boundaries shifted by +1 Mb for each set of boundaries. (C) TAD boundary overlap between the TADs called with HOMER at ∆Z > 2.0 and the Dixon et al., 2015 et al. TADs (combined replicates). The bars show the numbers of HOMER TADs with zero, one or two TAD boundaries within 50 kb of a Dixon et al., 2015 TAD boundary, respectively. (D) A WashU browser view of the directionality index profile and the locations of TADs called in an example ~20 Mb region on chromosome 7. Top row: Directionality indices (shades of blue and red represent the negative and positive index ranges, respectively). Middle row (green): Dixon et al., 2015 TADs (combined replicates). Bottom row (blue): HOMER TADs called at TAD ∆Z > 2.0.
Author response image 3
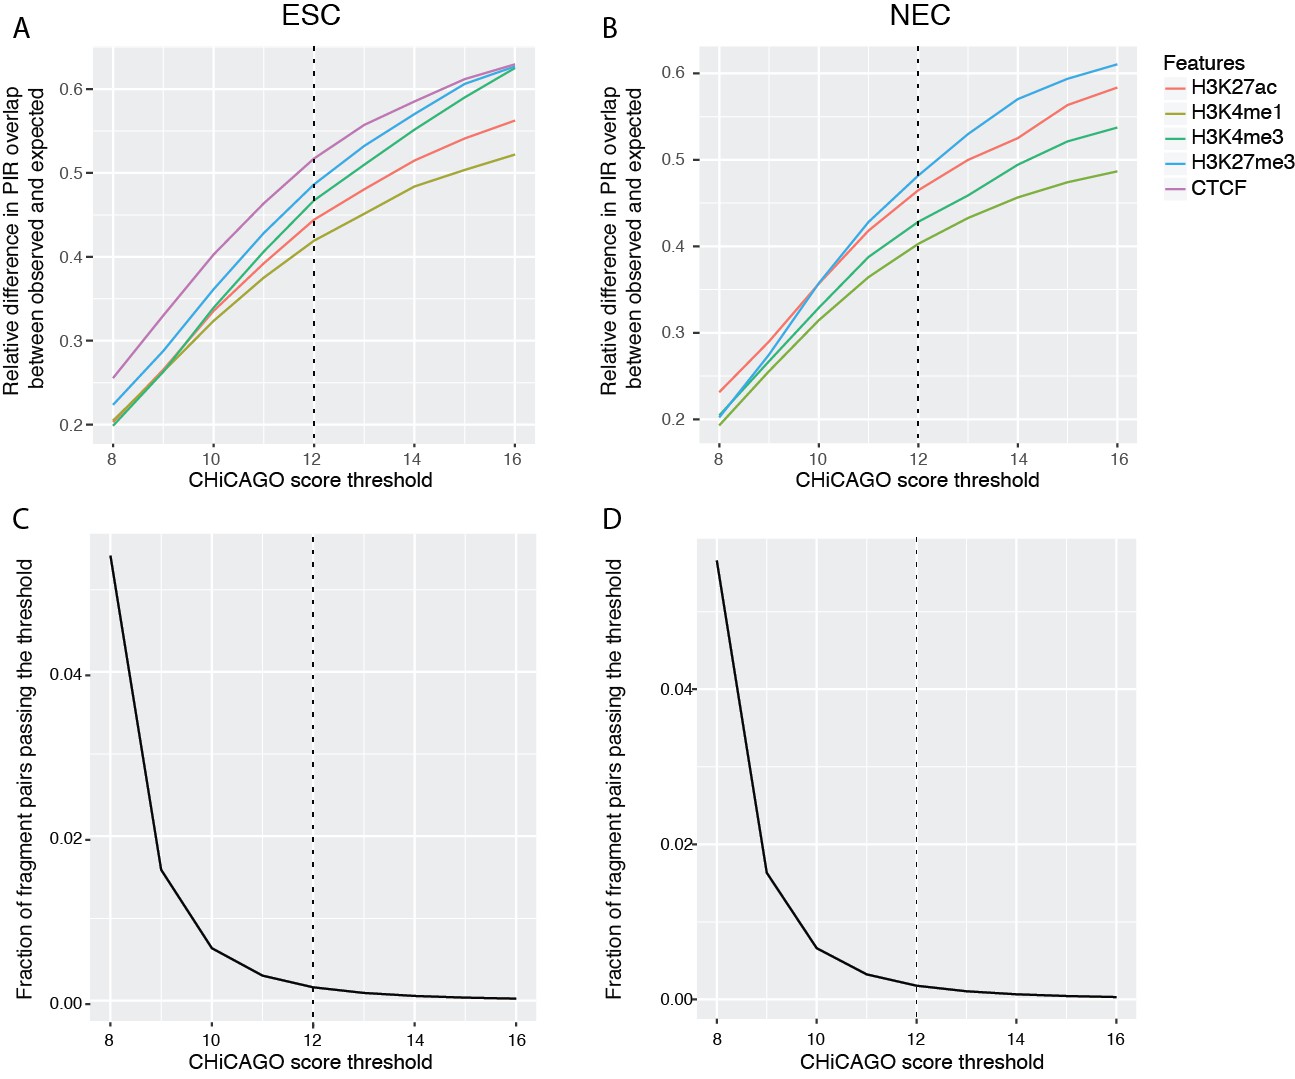
Properties of CHiCAGO interactions called at different score thresholds in ESCs and NECs.
(A and B) The relative difference between observed and expected numbers of PIRs overlapping with the ChIP-seq peaks of histone modifications and CTCF, detected at a range of CHiCAGO score thresholds in ESCs (A) and NECs (B). The expected numbers of PIRs overlapping with ChIP peaks were computed in the same way as in Figure 1C, as the average overlap obtained with 100 draws of promoter distance-matched random regions. (C and D) The fraction of fragment pairs with at least one PCHi-C read mapping to them that have CHiCAGO scores passing a given threshold in ESCs (C) and NECs (D).
Additional files
-
Supplementary file 1
The detected interactions and the chromatin states of the corresponding promoters and PIRs.
The table shows the IDs and genomic coordinates (based on GRCh37 assembly) of the baited promoter fragments (protein-coding genes only) and their respective PIRs for interactions detected in either ESCs (ESConly), NECs (NEConly), or both cell types (Both). The chromatin states of promoters and PIRs in each cell type are listed in the corresponding BaitState and PIRState columns. See Materials and methods for details on the thresholding approach used. CHiCAGO objects containing read-count and score information for all sequenced fragment pairs in ESCs and NECs are available through Open Science Framework (http://osf.io/sdbg4).
- https://doi.org/10.7554/eLife.21926.019
-
Supplementary file 2
PCHi-C candidate genes for enhancer regions annotated in the VISTA Enhancer Browser.
The genomic coordinates (based on GRCh37 assembly) of enhancers annotated in the VISTA Enhancer Browser that map to PIRs detected in either ESCs, NECs, or both (ESConly, NEConly and Both), their reported tissue-specificities, and the associated PCHi-C-identified putative target genes. The columns ActiveESC and ActiveNEC list whether the corresponding VISTA enhancers overlap with active chromatin marks in ESCs and NECs, respectively.
- https://doi.org/10.7554/eLife.21926.020
-
Supplementary file 3
The properties of the identified CRUs in ESCs and NECs.
The table lists the following CRU information: associated gene name, gene expression (processed with DESeq2), number of PIRs, the promoter (bait) chromatin state, single/dual-state annotation, CRU cluster ID and CRU chromatin state transitions between ESCs and NECs. Only CRUs which have been assigned to clusters in both ESC and NEC are listed.
- https://doi.org/10.7554/eLife.21926.021
Download links
A two-part list of links to download the article, or parts of the article, in various formats.
Downloads (link to download the article as PDF)
Open citations (links to open the citations from this article in various online reference manager services)
Cite this article (links to download the citations from this article in formats compatible with various reference manager tools)
Global reorganisation of cis-regulatory units upon lineage commitment of human embryonic stem cells
eLife 6:e21926.
https://doi.org/10.7554/eLife.21926


