Horizontal transfer of whole mitochondria restores tumorigenic potential in mitochondrial DNA-deficient cancer cells
- Griffith University, Australia
- Czech Academy of Sciences, Czech Republic
- University of Coimbra, Portugal
- Charles University, Czech Republic
- Malaghan Institute of Medical Research, New Zealand
- Zittau/Goerlitz University of Applied Sciences, Germany
- CSIR Institute of Genomics and Integrative Biology, India
- TATAA Biocenter, Sweden
Figures
Figure 1
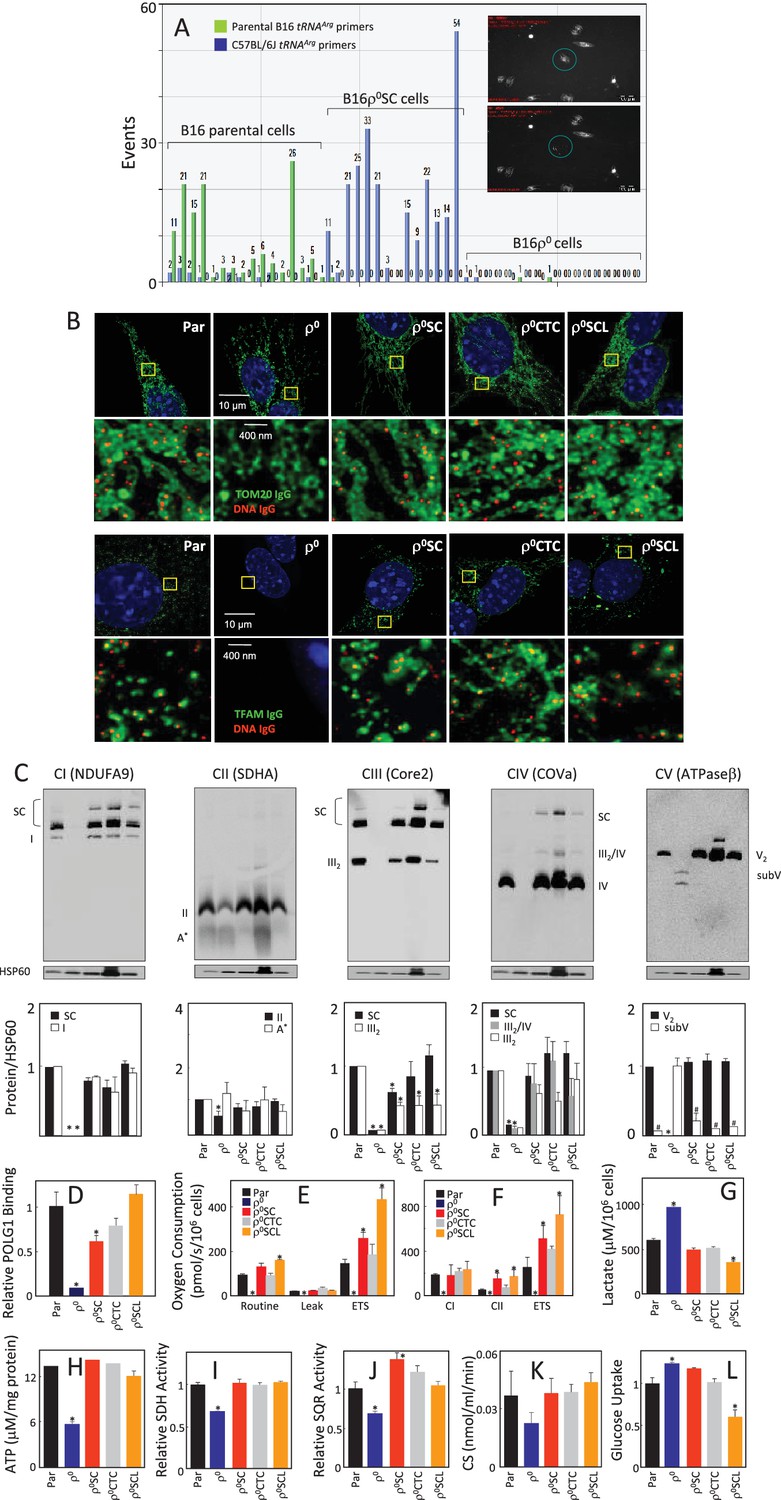
Cells derived from B16ρo cell-grown tumours feature mtDNA with host polymorphism, and recovered mitochondrial complexes and respiration.
(A) B16, B16ρ0 and B16ρ0SC cells were assessed by sc/dd PCR for polymorphism of the tRNAArg locus of mtDNA using specific probes (see Materials and methods). The insert shows a cell (circled) before (upper image) and after (lower image) withdrawn for analysis. (B) B16, B16ρ0, B16ρ0SC, B16ρ0CTC and B16ρ0SCL cells were immunostained for anti-DNA (red) and anti-Tom20 or anti-TFAM IgGs (green). The upper panels represent lower resolution confocal images depicting a major part of a whole cell, the lower panels represent higher magnification STED images of the region of interest indicted by the yellow box. (C) Cells as above were subjected to NBGE followed by WB using antibodies against subunits of individual complexes. Below is a densitographic evaluation of three gels derived from individual experiments with HSP60 as the internal control. The cells were assessed for binding of POLG1 to the D-LOOP region of mtDNA using the mitoChIP assay (D), for routine respiration (E) and for respiration via CI and CII following their permeabilisation (F). The sub-lines were next assessed for lactate generation (G), ATP level (H), SDH (I), SQR (J) and CS activities (K) as well as for glucose uptake (L). The symbol ‘*' indicates statistically significant differences between individual sublines and B16 cells, the symbol ‘#' in panel C indicates statistically significant difference between individual sublines and B16ρ0 cells. The nature of the individual sublines derived from B16ρ0 cells is as follows: B16ρ0SC cells, cells derived from primary tumour grown in B57BL mice grafted with B16ρ0 cells; B16ρ0CTC cells, the corresponding circulating tumour cells; B16ρ0SCL cells, the corresponding cells isolated from lung metastases.
Figure 2
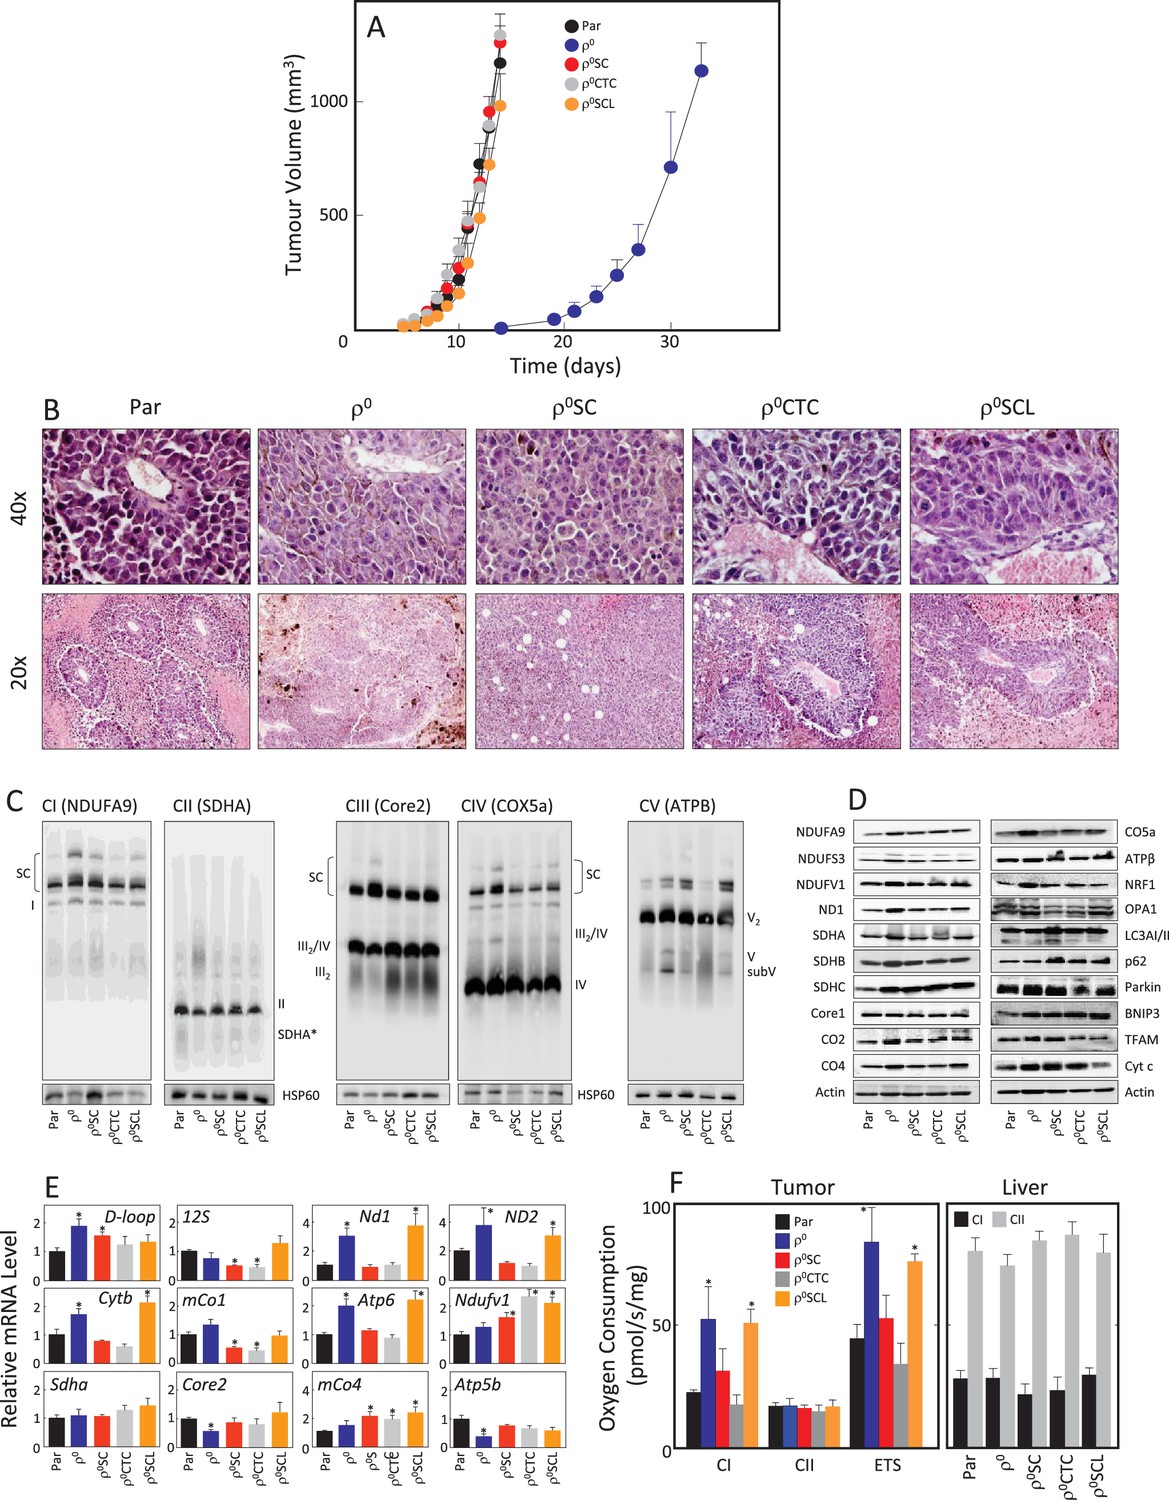
B16ρ0 cells form tumours with a delay and with fully assembled respirasome.
(A) B16, B16ρ0, B16ρ0SC, B16ρ0CTC and B16ρ0SCL cells were grafted in C57BL/6J mice (106 cells per animal; 6 mice per group), and tumor growth was evaluated using USI. (B) Tumours derived from individual sub-lines were fixed and sectioned, and inspected following H and E staining. (C) Individual tumours were subjected to NBGE followed by WB to visualize mitochondrial SCs and RCs. SDS-PAGE followed by WB with antibodies to subunits of mitochondrial RCs and other proteins was used to assess their levels (D), qPCR was used to assess the levels of representative mtDNA- and nDNA-coded mRNAs (E). (F) Tumor (left) and liver tissues (right) from mice grafted with individual B16 sub-lines were assessed for CI- and CII-dependent respiration, and for maximal uncoupled respiration (ETS, tumour only). The symbol ‘*' indicates statistically significant differences between tumours derived from individual sub-lines and tumours derived from B16 cells.
Figure 3

Suppression of respiration deregulates tumour growth.
(A) B16 and B16ρ0 cells were stably knocked down for either NDUFV1 or SDHC, or transfected with non-silencing (NS) shRNA, and the expression of NDUFS3, NDUFV1, SDHA and SDHC was assessed by WB. The sub-lines were next evaluated for proliferation on days 1 (D1), D2, D3 and D4 (B), for routine, leak and ETS respiration (C), and for respiration via CI and CII (D). Balb/-c nude mice were injected s.c. with 5 × 10⁶ B16ρ0 cells as well as cells with NDUFV1 KD or SDHC KD cells (E), or with B16 cells and the derived NDUFV1 KD or SDHC KD cells (F), with six mice per group except for the NDUFV1 group with five animals. Individual mice were assessed for tumor volume using USI. Tumours derived from B16ρ0 and B16 cells were averaged and plotted as mean values, while tumours derived from knock-down cells were plotted individually. Circles on the X-axis represent individual mice in which tumours did not form within the duration of the experiment. (G) Mice with tumours derived from cell lines as shown in the Figure were sacrificed, and tumours fixed, sectioned and stained with H and E. The symbol ‘*' indicates statistically significant differences between B16 cells and NDUFV1 KD or SDHC KD cells.
Figure 4
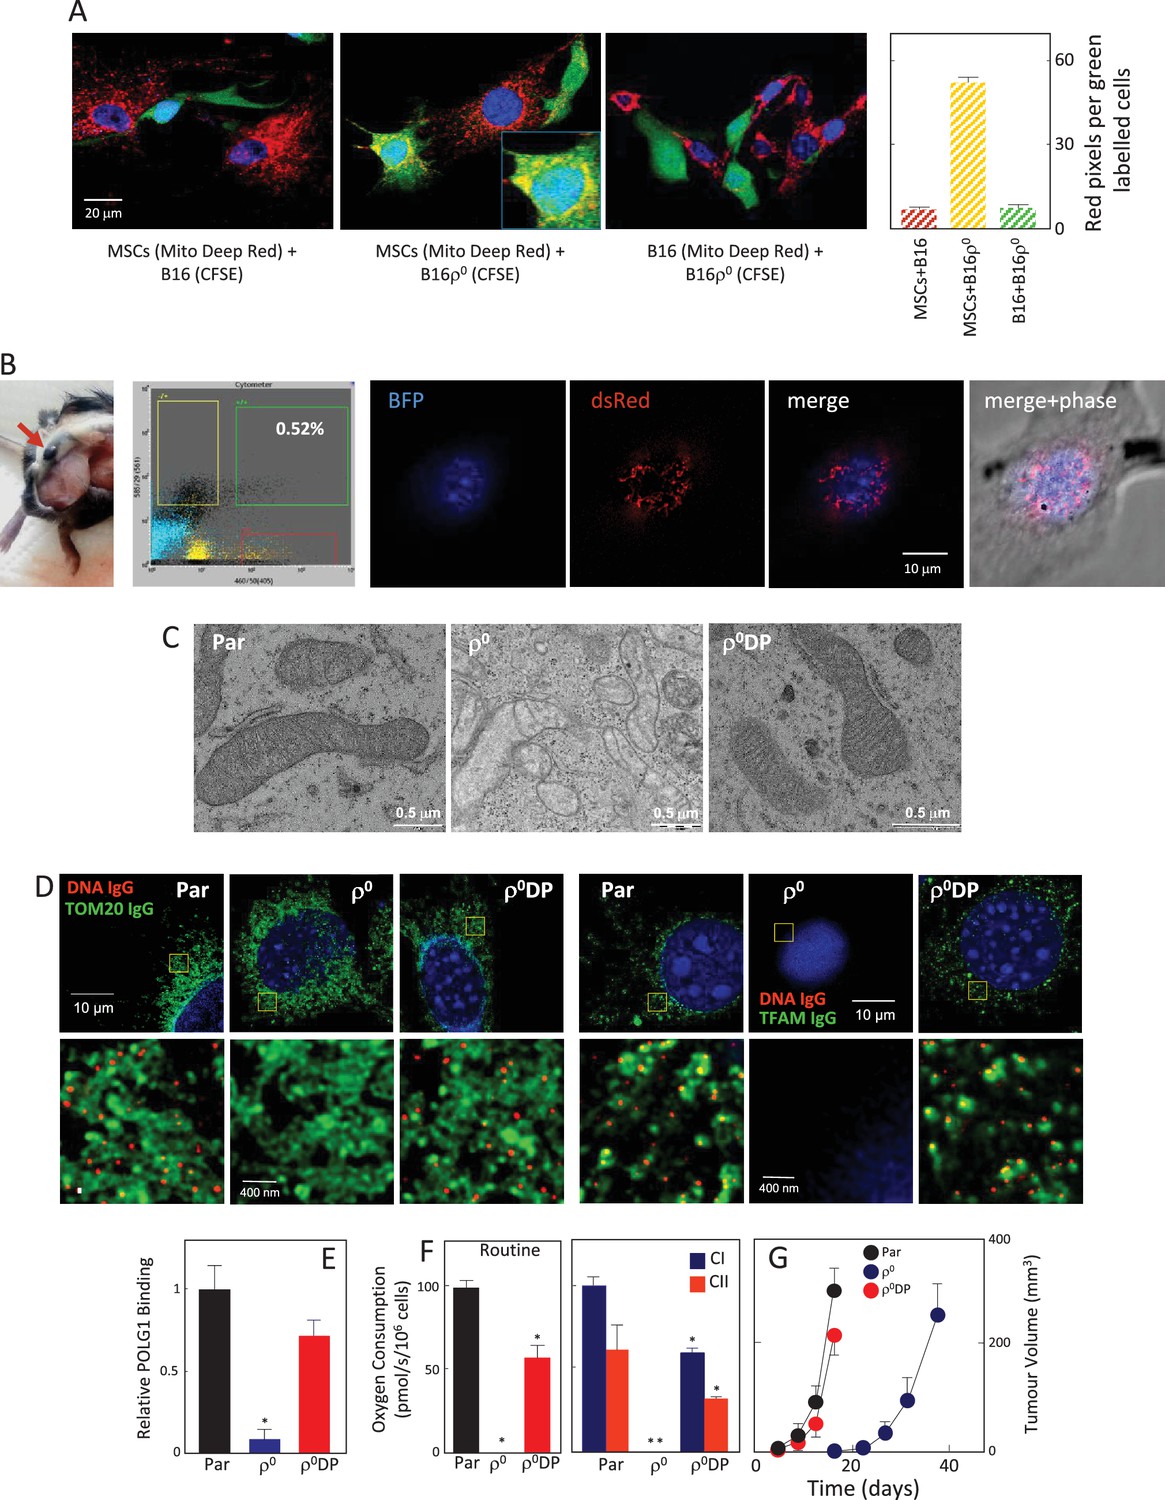
mtDNA transfers from host cells to B16ρ0 cells in whole mitochondria.
(A) MSCs prepared from C57BL/6J mice were labelled with Mito Deep Red (MitoDR) targeted to mitochondria, B16 or B16ρ0 cells were labelled with CFSE. On the left, confocal micrographs are shown for MSCs labelled with MitoDR co-cultured with B16 or B16ρ0 cells, or B16 cells labelled with MitoDR co-cultured with B16ρ0 cells labelled with CFSE for 24 hr. On the right, evaluation of confocal microscopy is shown. (B) C57BL/6Nsu9DsRed2 mice with red fluorescent mitochondria were grafted subcutaneously with 106 B16ρ0 cells stably transfected with nBFP. After 11 days, a mouse was sacrificed and the pre-tumour lesion excised and digested into the single cell population, which was sorted for double positive (DP) (red and blue fluorescent) cells. The cells were then inspected by confocal microscopy for blue nuclei and red mitochondria. The image shows maximum intensity Z-projection of a representative DP cell. (C) Parental B16, ρ0 and ρ0DP cells were evaluated for mitochondrial morphology using transmission electron microscopy. (D) Parental cells and their ρ0 and DP counterparts were imunnostained for DNA, TFAM and Tom20, and inspected by STED microscopy for mitochondrial nucleoids. The upper panels show a confocal image of a major part of a whole cell, the lower images depict higher magnification of the regions of interest indicated above by the yellow box obtained by STED. (E) Parental cells and their ρ0 and DP counterparts were assessed for binding of POLG1 to the mtDNA D-LOOP region using mitoChIP. (F) Parental cells and their ρ0 and DP counterparts were evaluated for routine respiration or respiration via CI and CII. (G) B16 cells and their ρ0 and DP counterparts were grafted s.c. in C57BL/6J mice at 106 per animal and tumour growth evaluated by USI. The symbol ‘*' indicates statistically significant differences between individual B16ρ0 or B16ρ0 DP cells and parental B16 cells.
Appendix 1—figure 1

Validation of the sc/ddPCR assay for the tRNA locus.
Parental mtDNA (about 20,000 copies) was spiked with 1000; 100; 10 and 1 copy of host mtDNA. Respectively, this corresponds to the expected fractions of 5; 0.5; 0.05% and 0.005%. Red diamonds indicate the measured fractions. NTC is non-template control.
Appendix 1—figure 2
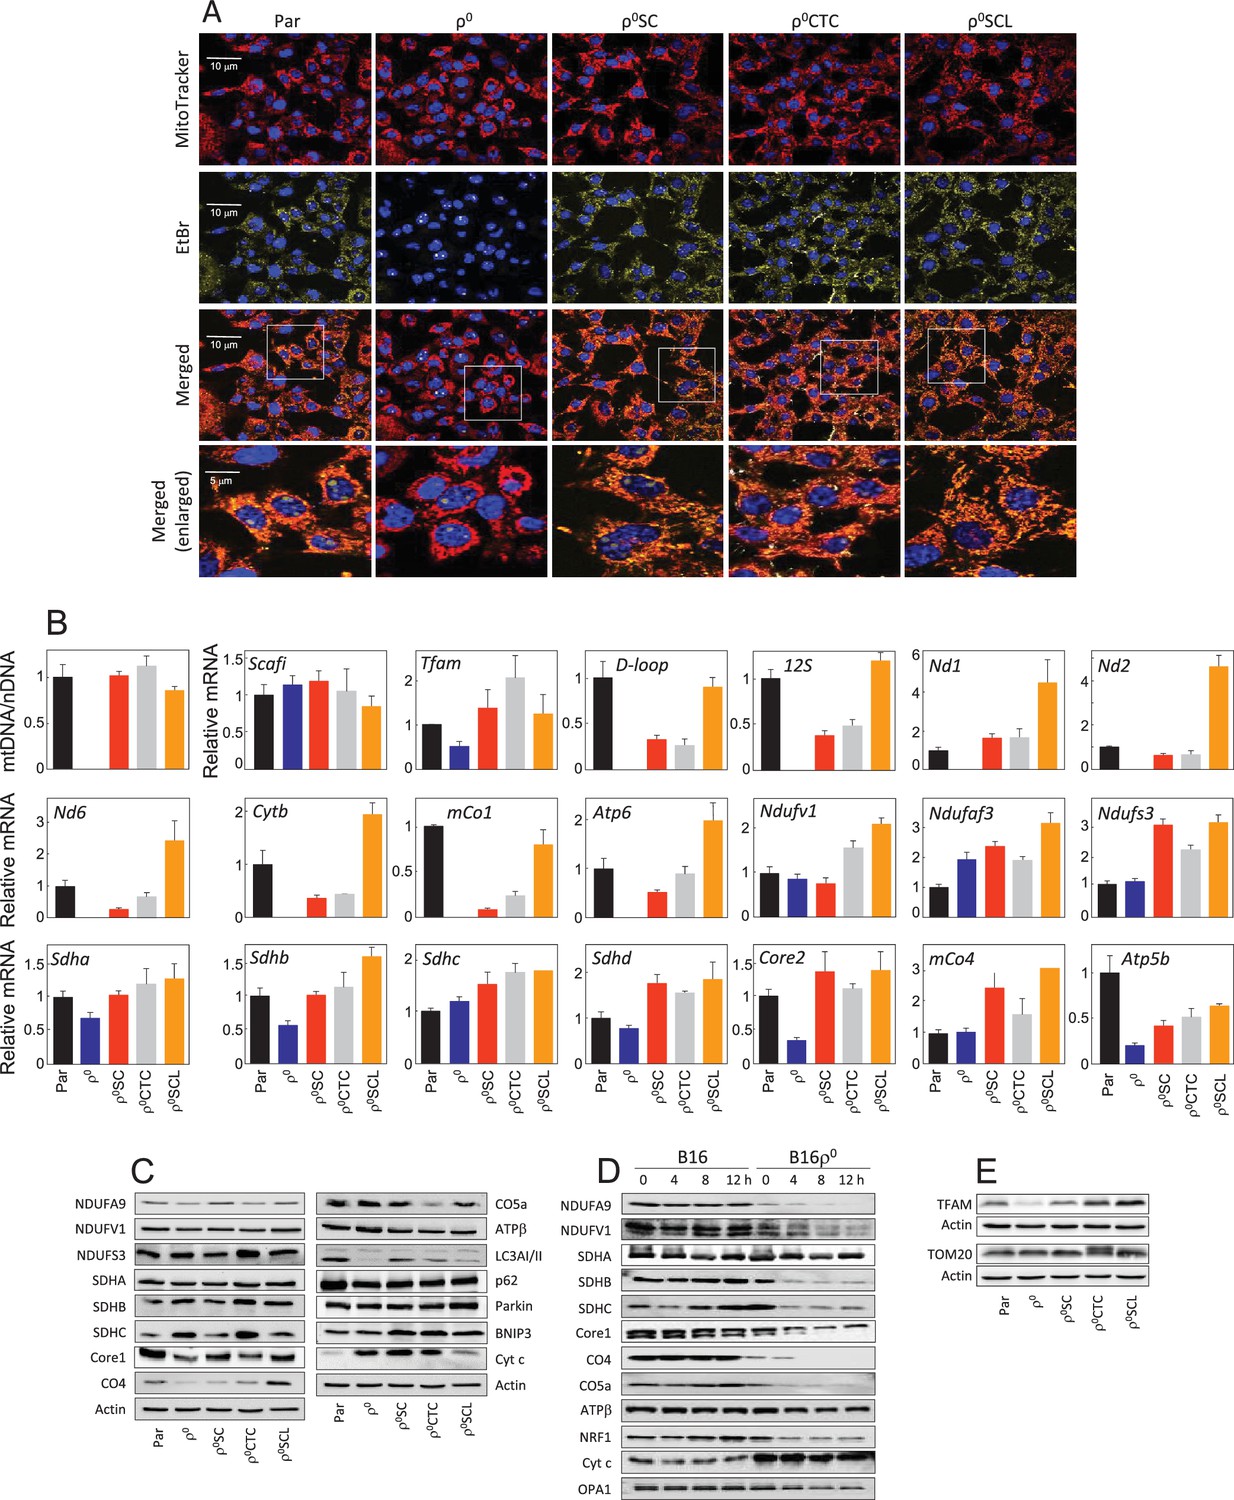
Tumour cells derived from primary tumour have restored mitochondrial function.
(A) B16, B16ρ0, B16ρ0SC, B16ρ0CTC and B16ρ0SCL cells were stained with MitoTracker Red for mitochondria, EtBr for mtDNA and Hoechst 33342 for nuclei. (B) B16 sub-lines were probed using real-time (RT)PCR for expression of mtDNA and selected genes encoded by nDNA and mtDNA. The data are mean values ± S.D. derived from three individual experiments. (C) B16 sub-lines were subjected to SDS-PAGE followed by WB using various IgGs. (D) Control cells and cycloheximide-treated cells (5 µM, time as shown in the figure) were separated by SDS-PAGE and subjected to IgGs for selected mitochondrial proteins. (E) B16 sublines were subjected to SDS-PAGE followed by WB using anti-TFAM and anti-Tom20 IgG. Data shown are representative of three independent experiments.
Appendix 1—figure 3
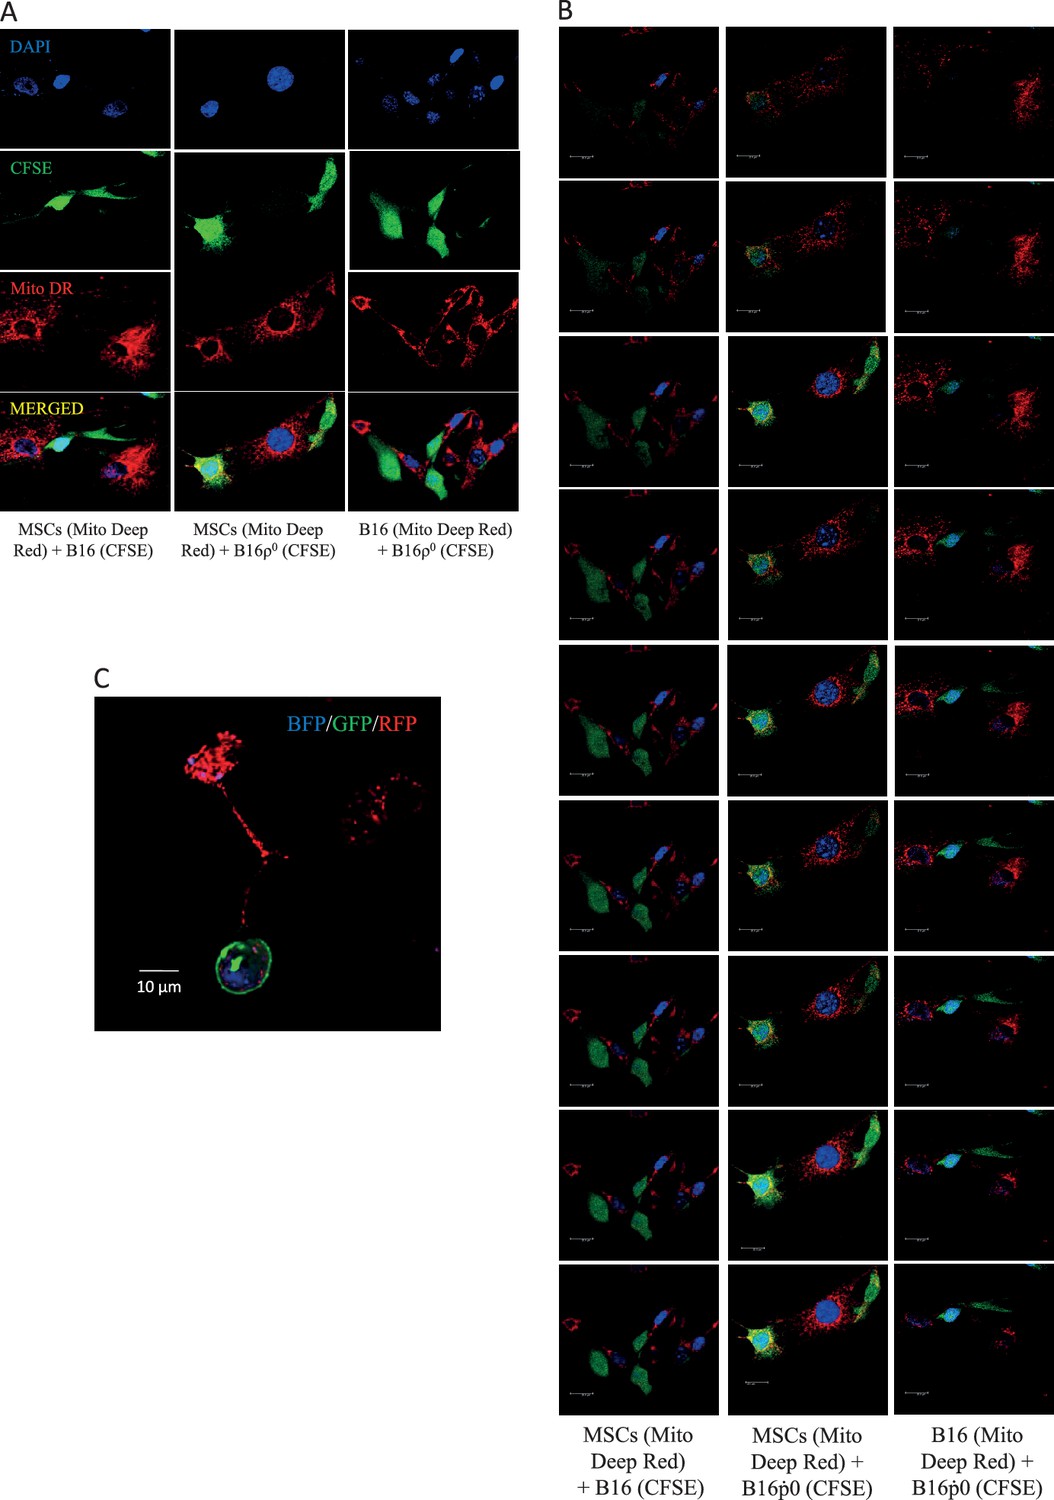
The efficiency of mitochondrial transfer during pair-wise co-culture of MSC, B16 and B16ρ0 was assessed by confocal imaging after 24 hr co-culture in vitro.
The donor mitochondria were labelled with MitoTracker Deep Red, a mitochondria targeted stain (red), while putative recipient cells were stained with cytoplasmic stain, CFSE (green), and the nucleus was stained with DAPI (blue). Cells were stained 2 hr prior to co-culture. Panel A shows representative images with separate colour channels for each co-culture pair, as labelled. Panel B shows Z stacks for the composite images. Panel C documents mitochondrial transfer from MSCs isolated from C57BL/6Nsu9-DsRed2 mice with DsRed mitochondria co-cultured with ρ0 cells labelled with nBFP and pmGFP.
Author response image 1

CFSE labeled B16 cells were co-cultured with mitoDR labeled MSC for 24 h.
In identical experiments the B16 cells were pretreated with rotenone to induce mitochondrial dysfunction. Double positive cells were counted by FACS and also visualized on microscopy. Rotenone pre-treatment of B16 led to greater mitochondrial transfer and increase in double positive cells from about 2% to 7%. The geometric mean intensity of double positive cells also in-creased suggesting greater transfer.
Tables
Appendix 1—table 1
Primer and probe sequences used in sc/ddPCR. *Capital letters indicate LNA bases; polymorphism is shown in gray.
| m_tRNA_Fw | gtcacaattctatctctagg |
|---|---|
| m_tRNA_Rv | ggttgaagaaggtagatg |
| m_tRNA_8A_FAM (host mouse) | taattagtTtAaAaAaAaTtAaTgattt |
| m_tRNA_9A_HEX (parental B16) | taattagtTtAaAaAaAaAtTaAtgattt |
-
*Polymorphism of the mtDNA tRNAArg locus of C57 mice and B16 cells has been published (Bayona-Bafaluy et al., 2003; Tan et al., 2015).
Download links
A two-part list of links to download the article, or parts of the article, in various formats.
Downloads (link to download the article as PDF)
Open citations (links to open the citations from this article in various online reference manager services)
Cite this article (links to download the citations from this article in formats compatible with various reference manager tools)
Horizontal transfer of whole mitochondria restores tumorigenic potential in mitochondrial DNA-deficient cancer cells
eLife 6:e22187.
https://doi.org/10.7554/eLife.22187


