Oxidative stress induces stem cell proliferation via TRPA1/RyR-mediated Ca2+ signaling in the Drosophila midgut
- Harvard Medical School, United States
- University of California Santa Barbara, United States
- University of California, Santa Barbara, United States
- Howard Hughes Medical Institute, Harvard Medical School, United States
Figures
Figure 1 with 3 supplements
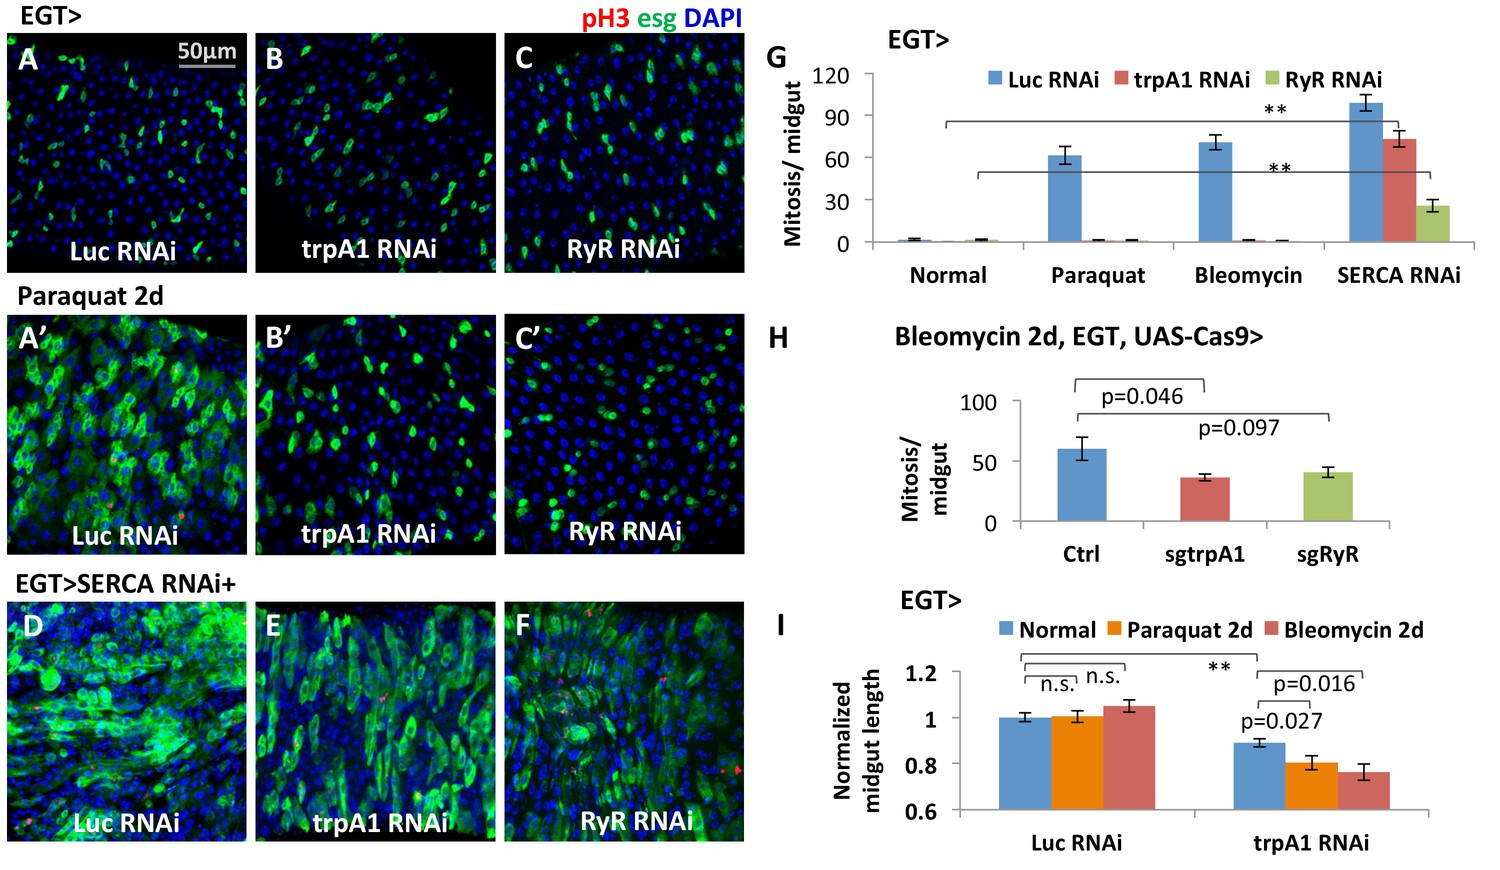
The calcium channels TRPA1 and RyR are required for damage-induced ISC proliferation.
(A–C) Midguts overexpressing Luc RNAi, trpA1 RNAi or RyR RNAi in ISCs using EGT (esgGal4 UAS-GFP tubGal80ts) for 6d, were fed the oxidant agent paraquat for the last 2d (A’–C’) or co-expressed with SERCA RNAi (D–F). Midguts are stained for the mitosis marker phosphohistone H3 (pH3). Luc RNAi is used as control. ts stands for temperature sensitive tubGal80ts that allows for temporal control of genetic manipulation. GFP is used to report the expression pattern of esgGal4. (G) Quantification of mitosis (pH3+ cell number) of midguts expressing Luc RNAi, trpA1 RNAi or RyR RNAi in ISCs under normal condition, 2 mM paraquat feeding, 25 µg/ml bleomycin feeding, or co-expression with SERCA RNAi. N > 5 midguts are quantified per genotype per treatment. Data are represented as mean ± SEM. Double asterisks indicate a p value of less than 0.01. (H) Mitosis quantification of midguts with constitutive expression of sgRNA targeting trpA1 or RyR, and targeted Cas9 expression in ISCs for 7d (bleomycin feeding for the last 2d). Flies with the same genetic background but only empty insertional landing site are used as the control for sgRNA. Data are represented as mean ± SEM. Note that we generally observed that CRISPR/Cas9-mediated knockout in vivo is not working as efficiently as RNAi, probably because not all DNA damages by CRISPR/Cas9 result in frame-shift mutations. N > 6 midguts are analyzed per genotype. Data are represented as mean ± SEM. (I) Length quantification of midguts expressing Luc RNAi (control) or trpA1 RNAi for 7d, with the last 2d feeding on normal food, paraquat, or bleomycin. The average midgut length of control flies feeding on normal food is used for normalization. N > 5 midguts are analyzed per genotype per treatment. Data are represented as mean ± SEM.
-
Figure 1—source data 1
Complete results for Figure 1G–I, Figure 1—figure supplement 1E, Figure 1—figure supplement 3A–B.
- https://doi.org/10.7554/eLife.22441.003
Figure 1—figure supplement 1
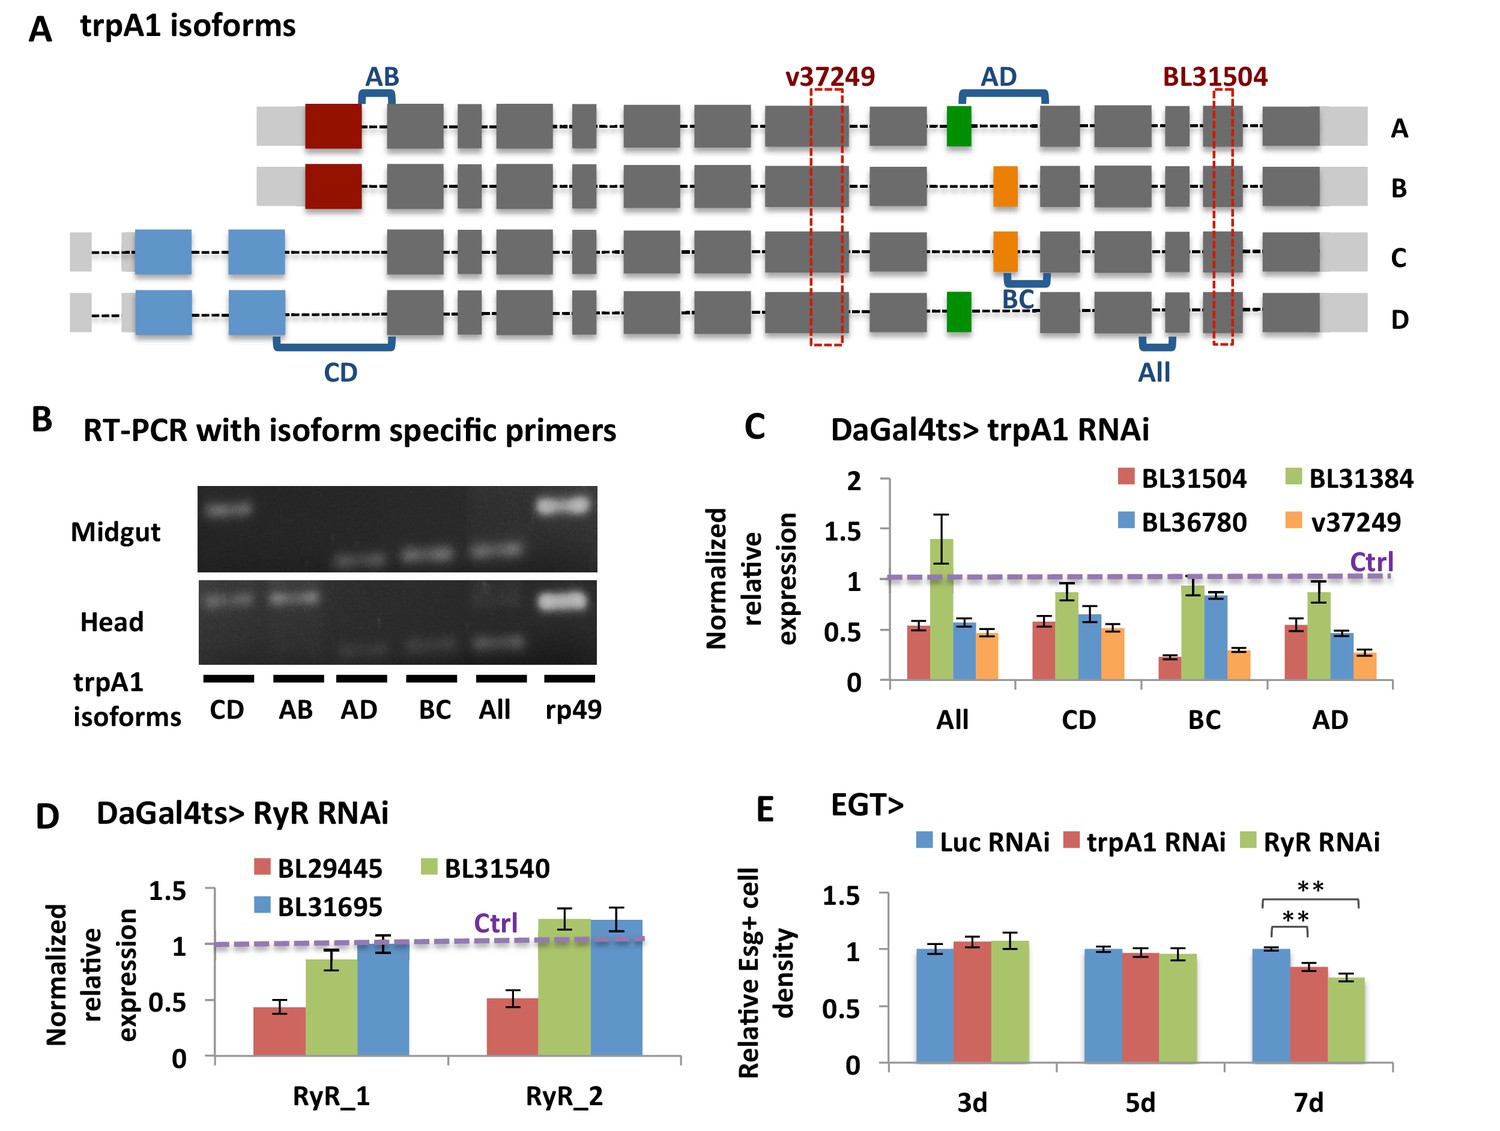
Validation of knockdown efficiency for trpA1 RNAi and RyR RNAi lines.
(A) Cartoon depicting the four characterized trpA1 isoforms. The target regions of trpA1 RNAi lines used in this study are shown in dashed rectangles. The regions amplified with isoform-specific primers are shown in square brackets. (B) Primers spanning exons for specific splicing events are used in RT-PCR to distinguish trpA1 isoform expression in fly midguts and heads. (C) RT-qPCR analysis of mRNAs from midguts expressing different lines of trpA1 RNAi ubiquitously with inducible DaGal4ts for 5d, with primers designed for different types of trpA1 isoforms. GAPDH and rp49 are reference genes for normalization. To determine RNAi knockdown efficiency, the ratio of normalized trpA1 expression to corresponding control groups expressing either Luc RNAi (for BL lines) or carrying an empty insertional landing site (v60100 for v37249) is calculated. The data are presented as mean ± SEM for three technical replicates. We repeated the experiments (two biological replicates) and observed consistent results. (D) RT-qPCR measurement of midguts ubiquitously expressing Luc RNAi or RyR RNAi for 5d, with two different sets of primers designed for all RyR isoforms. GAPDH and rp49 are used for normalization. The data are presented as mean ± SEM for three technical replicates. We repeated the experiments (two biological replicates) and observed consistent results. (E) Quantification of relative esg+ cell density in the posterior midgut region. esg+ cell number is divided by the imaged area size for density calculation. N > 5 midguts per genotype per time point are analyzed. Data are represented as mean ± SEM.
Figure 1—figure supplement 2
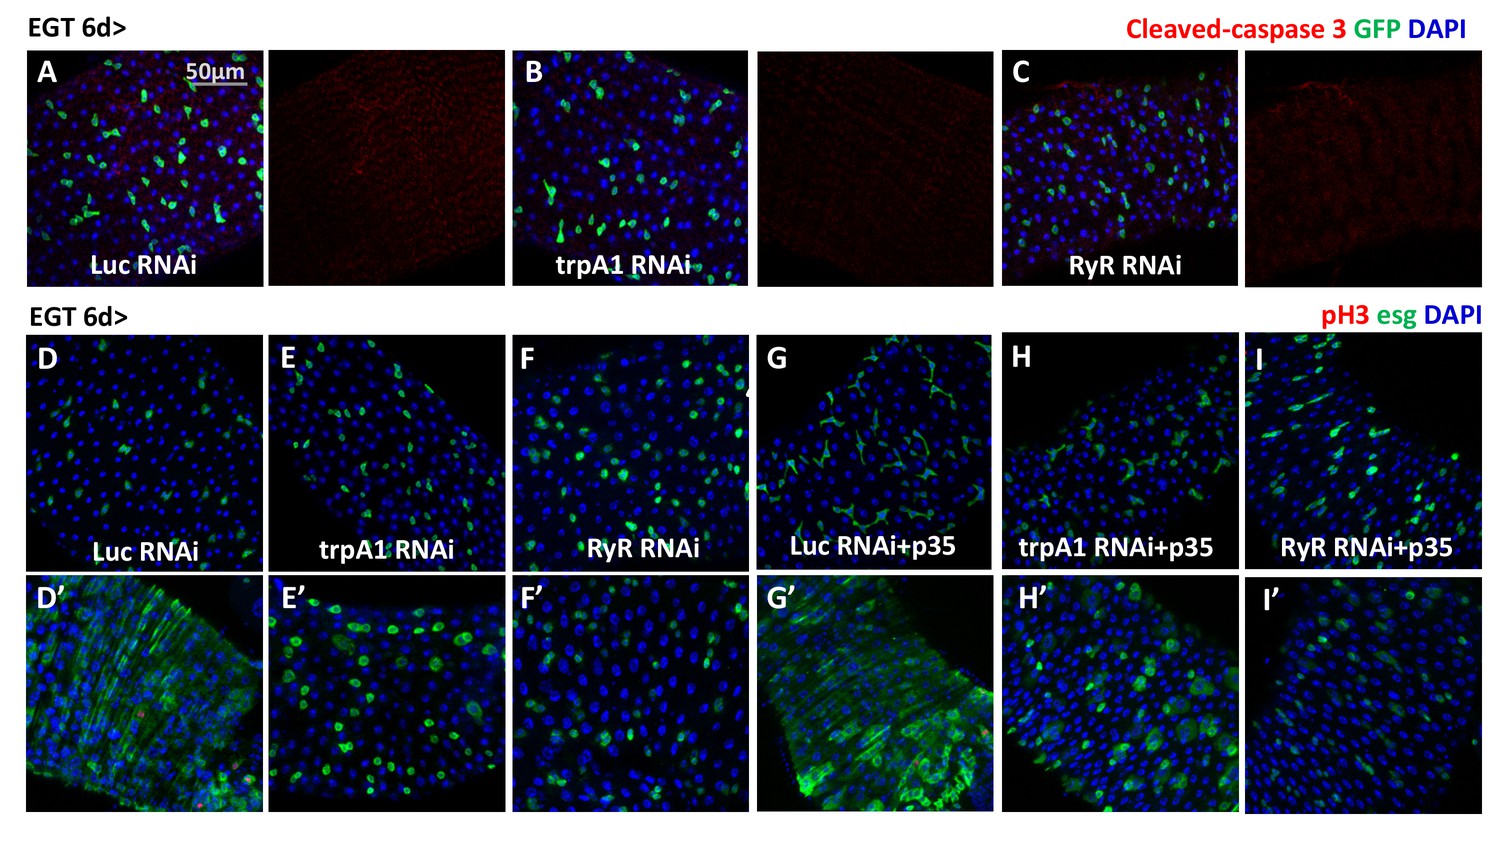
trpA1 RNAi and RyR RNAi do not cause ISC apoptosis.
(A–C) Immunostaining of midguts expressing Luc RNAi, trpA1 RNAi or RyR RNAi in ISCs for apoptosis marker cleaved-caspase 3. The channels of cleaved-caspase 3 signal are shown to the right of the merged images. No signal can be detected except some background staining in the trachea and muscle. (D–F) Midguts expressing Luc RNAi, trpA1 RNAi or RyR RNAi in ISCs with the last 2d feeding 2 mM paraquat (D’–F’), are stained for mitosis marker pH3. (G–I) Midguts expressing anti-apoptosis protein p35, together with Luc RNAi, trpA1 RNAi or RyR RNAi in ISCs with the last 2d feeding 2 mM paraquat (G’–I’), are stained for mitosis marker pH3.
Figure 1—figure supplement 3
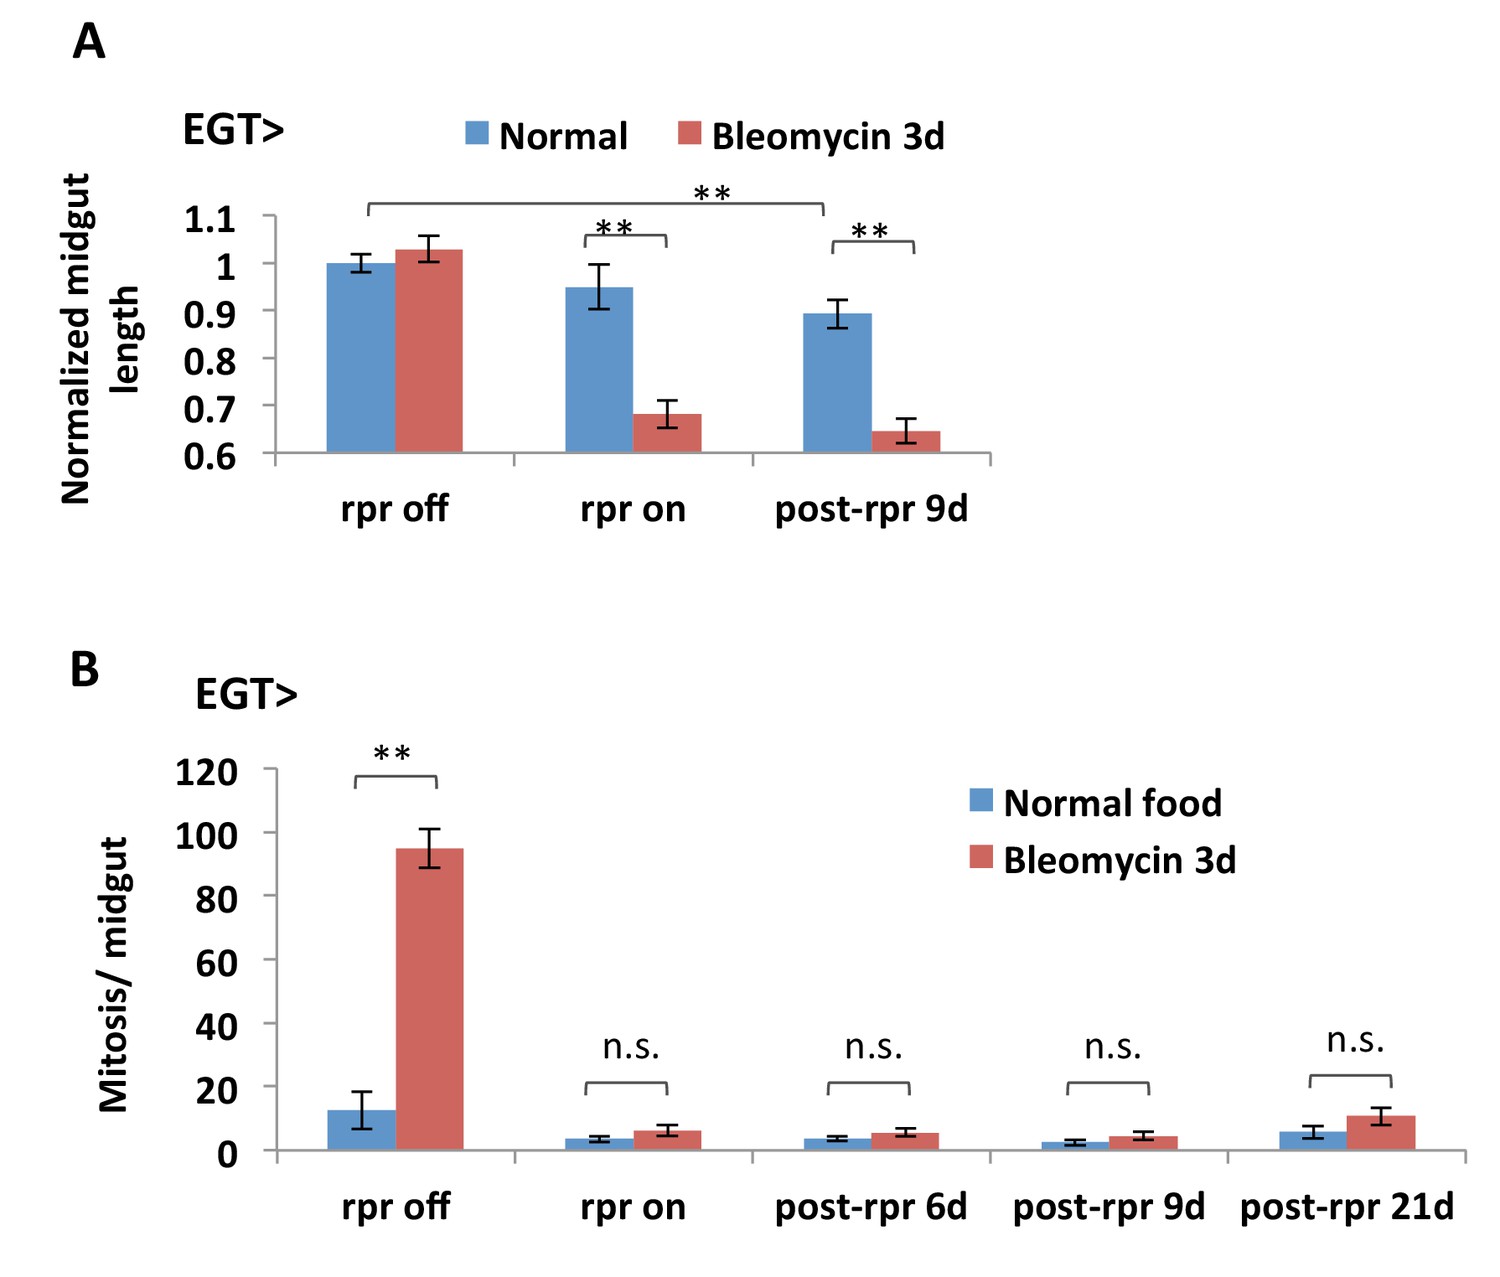
ISC depletion results in midgut shortening.
(A) Length quantification of midguts with inducible expression of rpr in ISCs. In the ‘rpr off’ group, the flies are kept at 18°C to prevent Gal4 activity and rpr expression; in the ‘rpr on’ group, rpr expression is induced at 29°C for 4d and turned off at 18°C for 3d feeding normal food or bleomycin; in the ‘post-rpr’ group, after 4d expression of rpr, the flies are placed back at 18°C for specified days before bleomycin treatment. N > 6 midguts are analyzed per genotype per treatment. Data are represented as mean ± SEM. (B) Mitosis quantification of midguts with inducible expression of rpr in ISCs. Mitosis activity in the midgut cannot recover after depletion of the esg+ cell population by 4d rpr expression, N > 7 midguts are analyzed per genotype per treatment. Data are represented as mean ± SEM.
Figure 2 with 1 supplement

TRPA1 and RyR are required for ISC self-renewal but not differentiation.
(A–C, A’–C’) MARCM clones deficient for TRPA1 or RyR are analyzed along with their corresponding control genotypes (A for A’, B for B’, C for C’) 10d after clone induction. Cell numbers per clone for MARCM clones expressing trpA1 RNAi, or lacking both wild-type RyR alleles, are quantified in (J). Randomly picked N = 35 clones from the posterior regions of five guts per genotype are analyzed. Data are represented as mean ± SEM. (D–F) ISC marker Dl-lacZ stainings of midguts expressing Luc RNAi, trpA1 RNAi or RyR RNAi for 5d in ISCs. The relative Dl+ cell density in the posterior midgut region is quantified in (K). Dl+ cell number is divided by the imaged area size for density calculation. N > 5 midguts per genotype are analyzed. Data are represented as mean ± SEM. (G–I) Immunostaining of midguts expressing Luc RNAi, trpA1 RNAi or RyR RNAi for 5d in ISCs for Notch activity reporter Su(H)GbeGFP and EE marker Prospero (pros). The relative Su(H)Gbe+ cell density in the posterior midgut region is quantified in (L). Su(H)Gbe+ cell number is divided by the imaged area size for density calculation. N > 4 midguts per genotype are analyzed. Data are represented as mean ± SEM. (M) Quantificatioin of EE density in the posterior midgut region for midguts expressing Luc RNAi, trpA1 RNAi or RyR RNAi in ISCs for 3d, 5d, and 7d. For each time point, EE density is normalized to the average value of midguts expressing Luc RNAi. N > 4 midguts per genotype are analyzed. Data are represented as mean ± SEM.
-
Figure 2—source data 1
Complete results for Figure 2J–M.
- https://doi.org/10.7554/eLife.22441.008
Figure 2—figure supplement 1
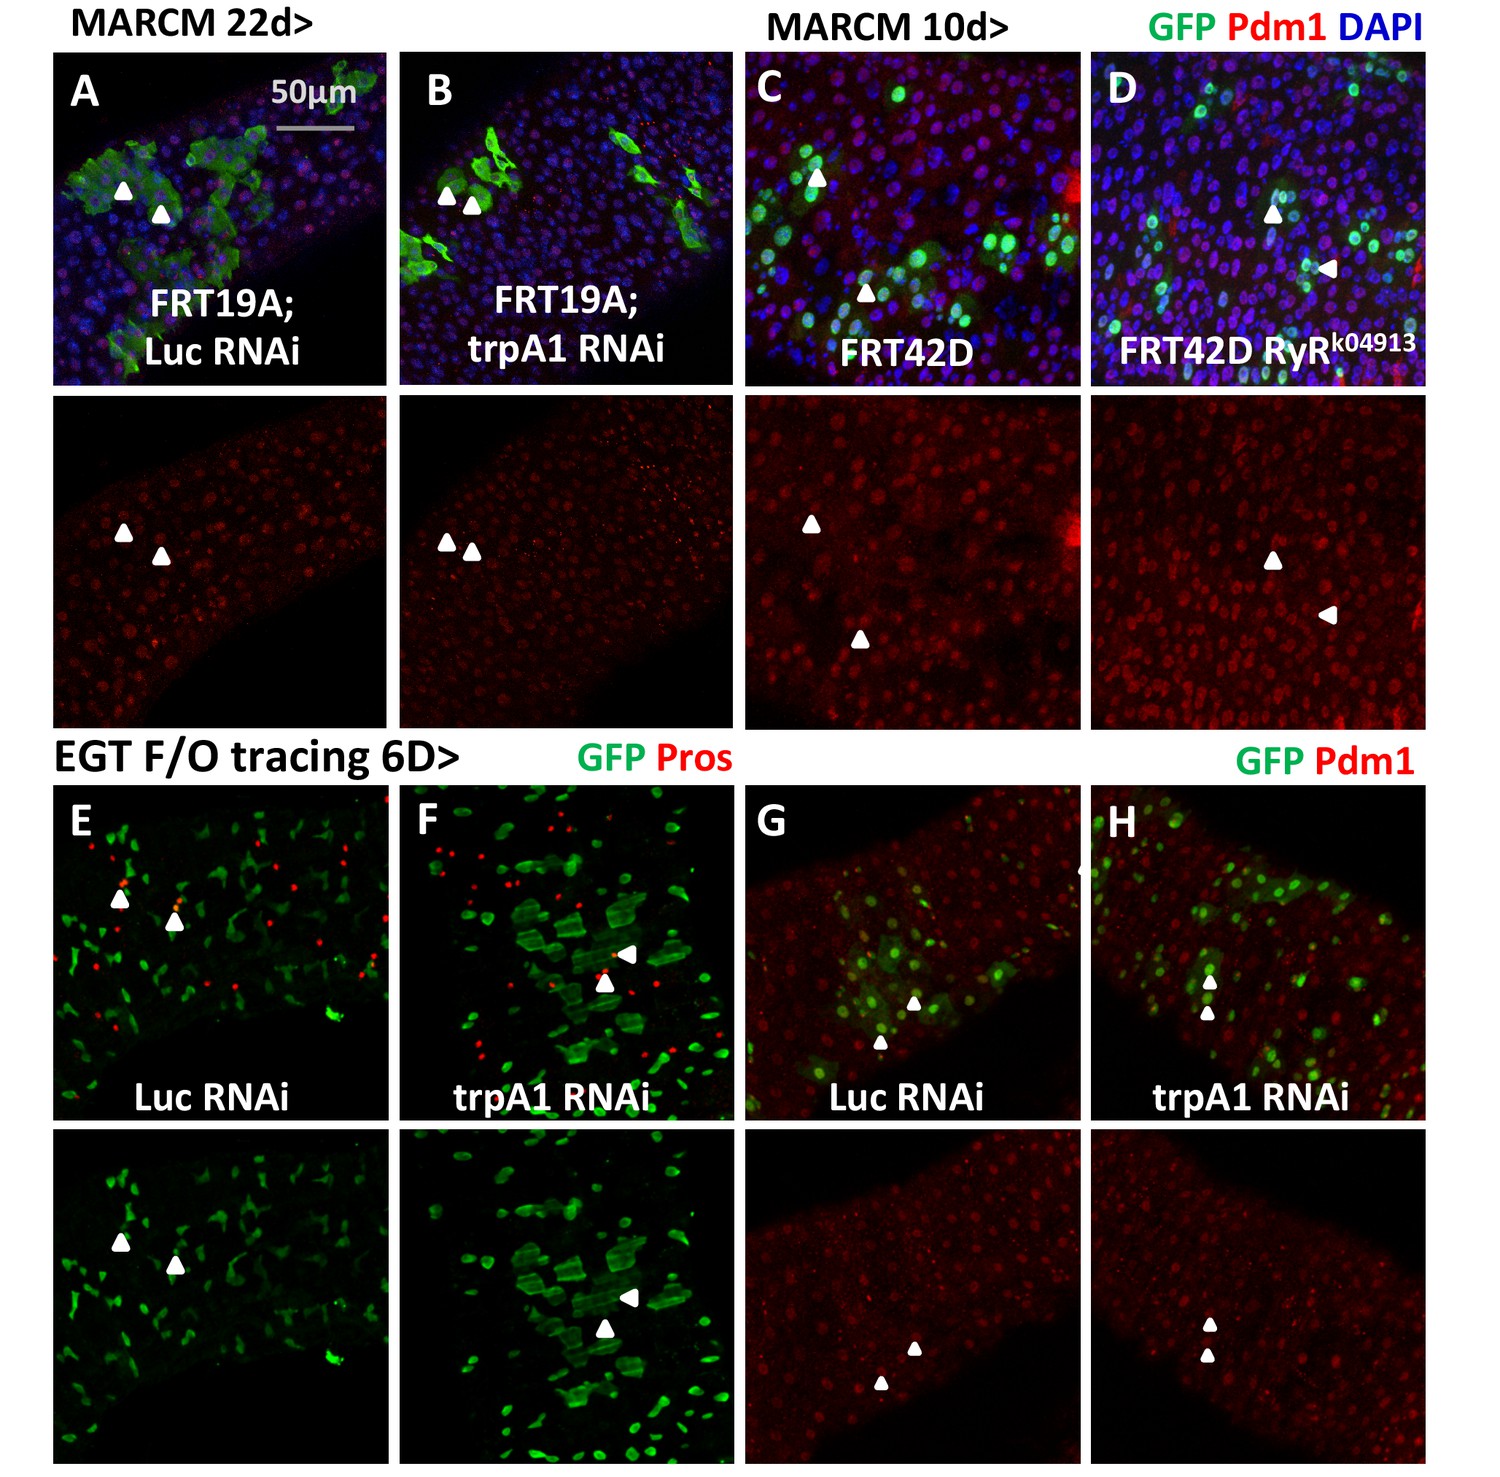
Lineage-tracing experiments provide evidence that TRPA1 or RyR-deficient ISCs can differentiate.
(A–B) MARCM clones expressing Luc RNAi or trpA1 RNAi for 22d are examined for their survival and stained with anti-Pdm1 antibody to examine EC differentiation. Arrowheads highlight examples of ECs generated from ISCs expressing Luc RNAi or trpA1 RNAi. (C–D) MARCM clones that are homozygous RyR mutant are stained with anti-Pdm1 antibody. Arrowheads highlight examples of ECs in the MARCM clones that are Pdm1+. (E–F) Immunostaining of midguts expressing Luc RNAi or trpA1 RNAi in the ISC lineage (labeled by GFP) for EE marker, Pros. Arrowheads highlight examples of EEs generated by ISCs during the 6d period of tracing. (G–H) Immunostaining of midguts expressing Luc RNAi or trpA1 RNAi in the ISC lineage (labeled by GFP) for EC marker, Pdm1. Arrowheads highlight examples of ECs generated by ISCs during the 6d period of tracing.
Figure 3 with 2 supplements
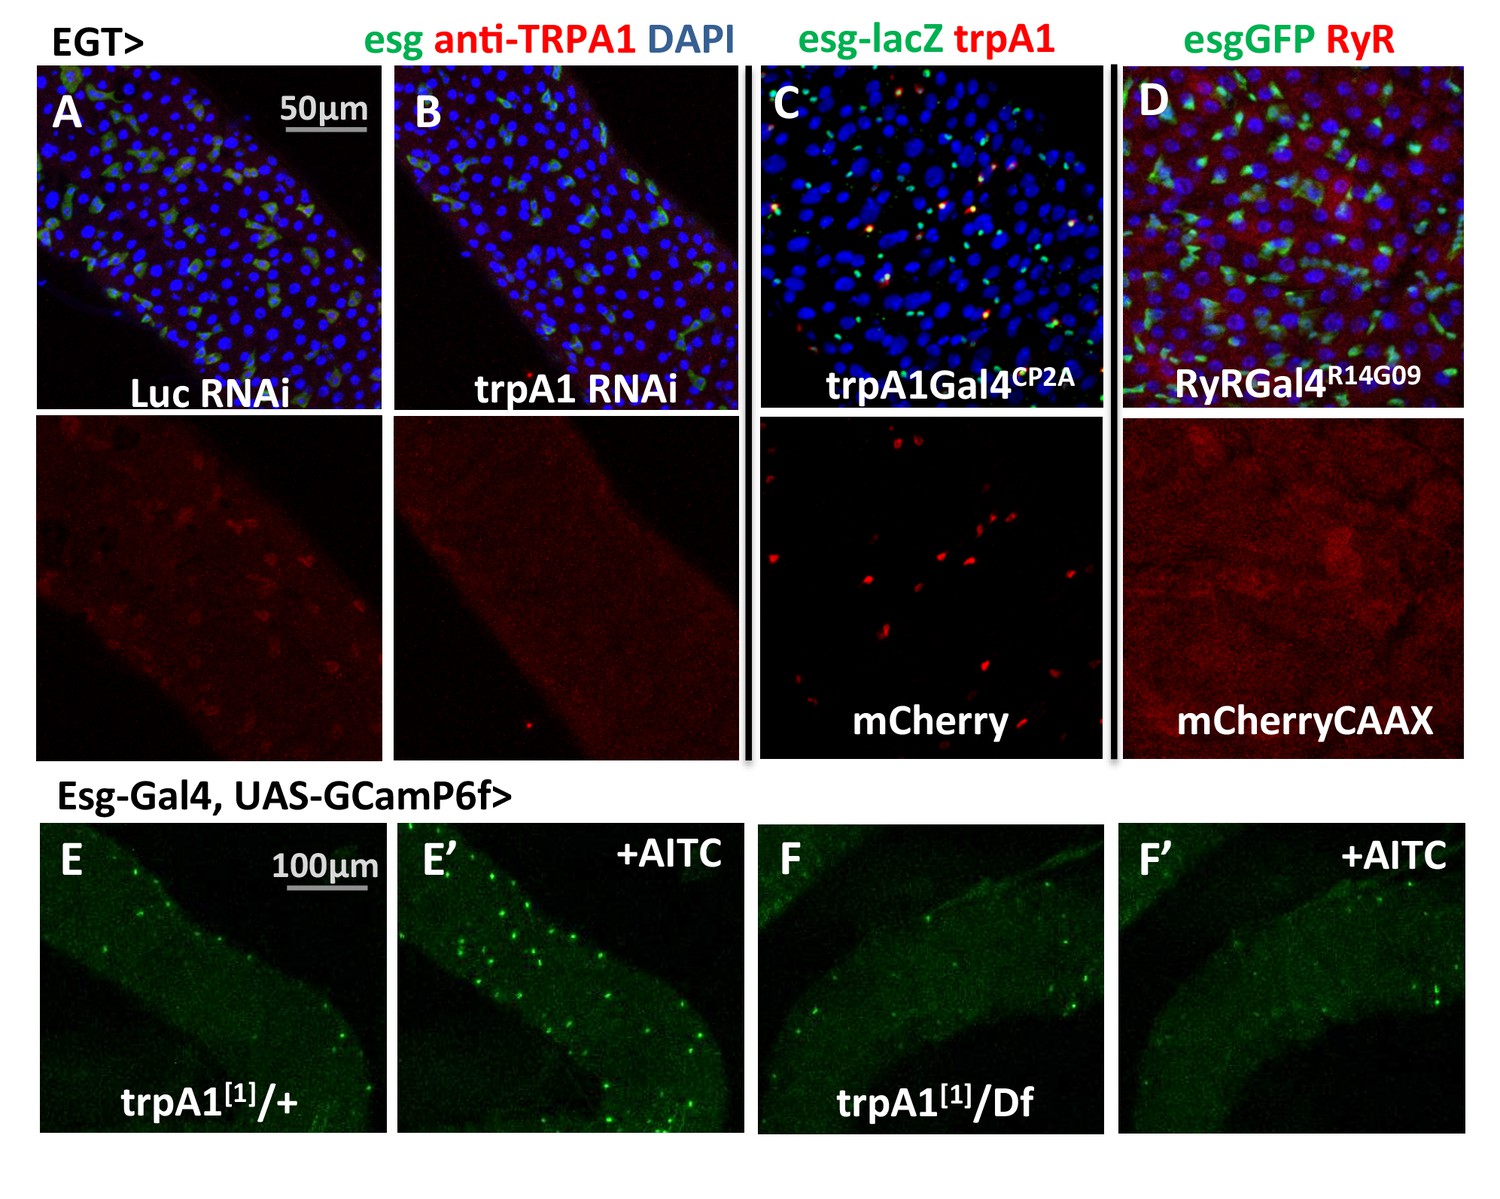
trpA1 and RyR expression in the midgut.
(A–B) Anti-TRPA1 immunostaining of midguts expressing Luc RNAi or trpA1 RNAi in ISCs. The channel of anti-TRPA1 signal is shown below the merged image. Note that anti-TRPA1 staining has high background signal. While we could detect TRPA1 expression in the ISCs, we could not exclude the possibility that it is also expressed in other cell types. (C) trpA1Gal4CP2A-driven expression of mCherry is co-stained with ISC marker esglacZ. (D) RyRGal4R14G09 (enhancer region of RyR locus) driven expression of membrane-localized CAAX-mCherry is co-stained with ISC marker esgGFP. (E–F) Imaging midguts missing one or both alleles of wild-type trpA1 with GCaMP6f expression in ISCs. The same guts are imaged again after exposure to 0.015% AITC in the imaging buffer for 5 min (E’–F’). The images are acquired on a Keyence microscope.
-
Figure 3—source data 1
Complete results for Figure 3—figure supplement 2B.
- https://doi.org/10.7554/eLife.22441.011
Figure 3—figure supplement 1

The knock-in design of trpA1Gal4CP2A.
By CRISPR/Cas9-induced homologous recombination, Gal4 is inserted into the shared C terminal of trpA1 isoforms right before the stop codon. The knock-in could result in bi-cistronic transcripts expressing both TRPA1 and Gal4.
Figure 3—figure supplement 2
Additional evidence for trpA1 expression and function in ISCs.
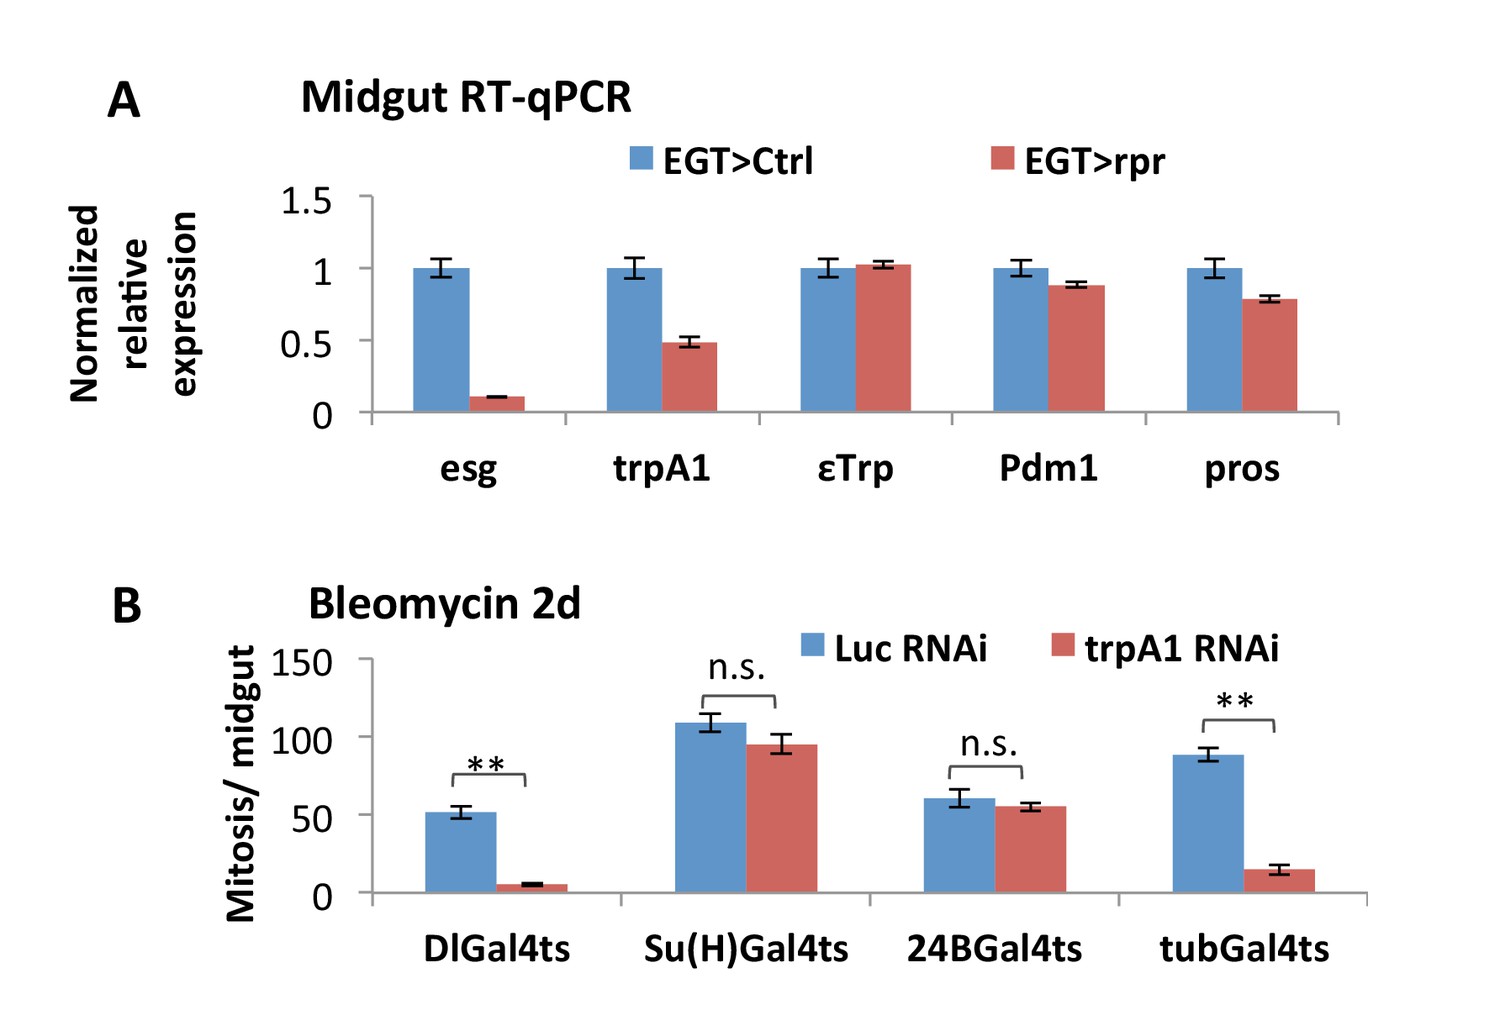
(A) RT-qPCR measurement of midguts expressing the cell death gene rpr in ISCs for 4d for the expression of esg, trpA1 (using primers for CD isoforms), EC marker ε-Trpsin (εTrp), Pdm1, or pros. GAPDH and rp49 are used for normalization. The data are presented as mean ± SEM for three technical replicates. We repeated the experiments (two biological replicates) and observed consistent results. (B) Mitosis quantification of midguts expressing Luc RNAi or trpA1 RNAi in self-renewing ISCs (DlGal4ts), differentiating ISCs or enteroblasts (Su(H)Gal4ts), muscles (24BGal4ts), or ubiquitously (tubGal4ts) for 9d, with last 2d feeding bleomycin. DlGal4ts and Su(H)Gal4ts are used to drive gene expression in ISCs and enteroblasts, respectively (Zeng et al., 2010). Data are represented as mean ± SEM.
Figure 4 with 1 supplement
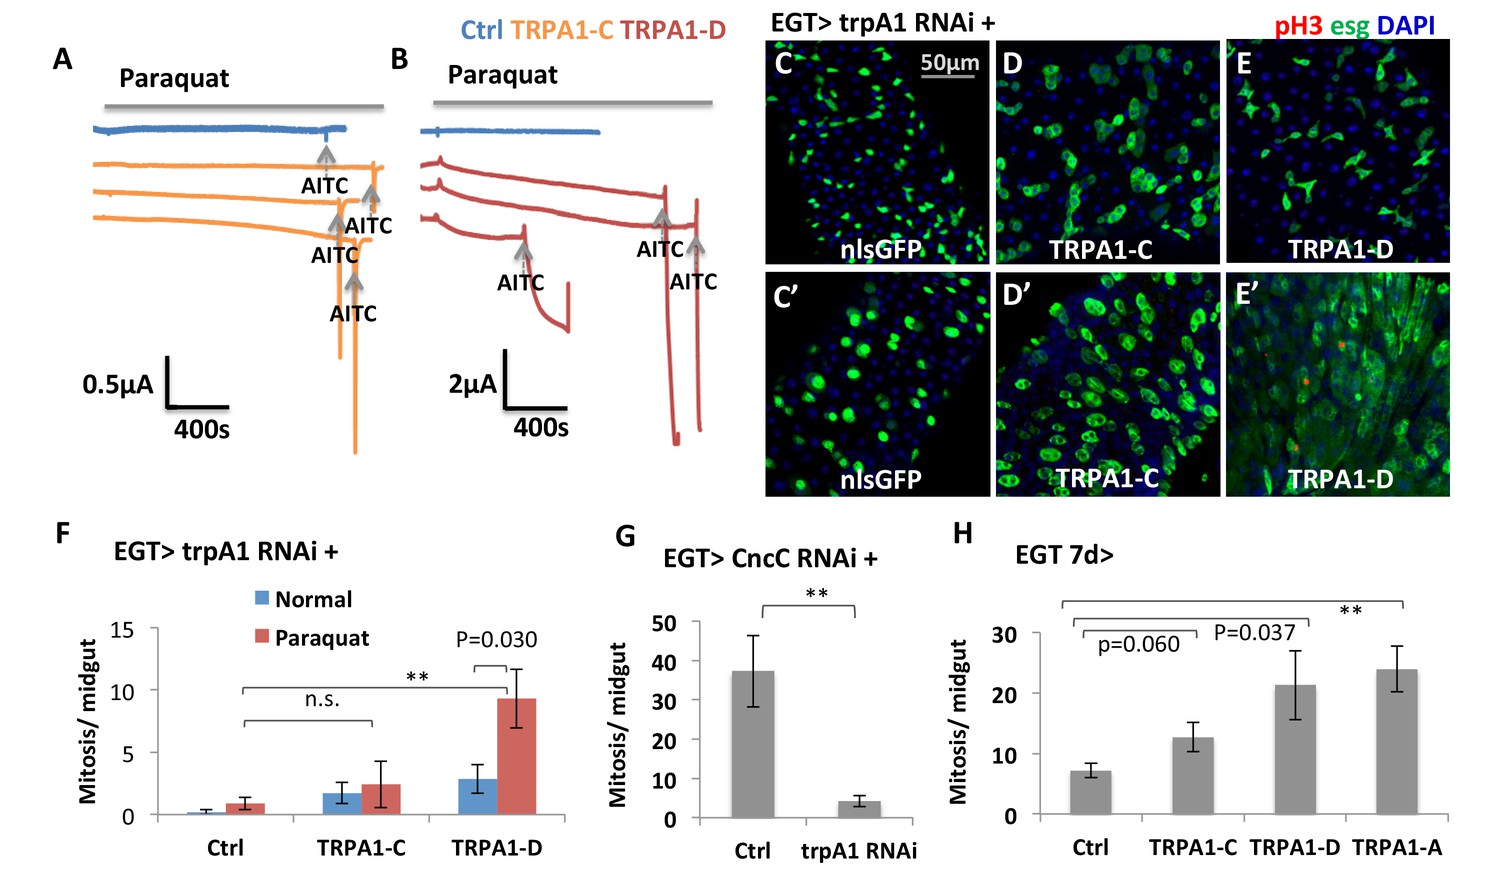
TRPA1 can respond to oxidant agent and its activation stimulates ISC activity.
(A–B) Oocyte clamp measurement of TRPA1-C or TRPA1-D channel activities in response to paraquat. The same amounts of mRNAs for TRPA1-C or TRPA1-D were injected into Xenopus oocytes. 4 mM paraquat is present in the buffer during the period marked with the gray line on the top. Near the end of the experiment, the TRPA1 agonist AITC was added as a positive control (indicated with arrowhead). 2 mM and 10 mM paraquat were also tested and gave consistent results. (C–E) Midguts, expressing trpA1 RNAi alone, or together with TRPA1-C or TRPA1-D in the ISCs for 7d, with the last 2d feeding paraquat (C’–E’), are stained for the mitosis marker pH3. Nucleus-localized GFP (nlsGFP) is used as the control for transgenic expression. We have also tested UAS-ultraGFP (Yang and Tower, 2009) that consists of multiple copies of UAS-2xEGFP as control and obtained the same results as UAS-nlsGFP with regard to stem cell activity (except that ultraGFP reporter is much brighter than nlsGFP). (F) Mitosis quantification of midguts expressing trpA1 RNAi together with TRPA1-C or TRPA1-D under normal and paraquat-feeding conditions. N > 4 midguts per genotype per treatment are analyzed for quantification. UAS-ultraGFP is used as the control for transgenic expression. Data are represented as mean ± SEM. Note that TRPA1-C or TRPA1-D are still targeted by trpA1 RNAi, which might limit their capacity to rescue trpA1 RNAi. (G) Mitosis quantification of midguts expressing CncC RNAi alone, or together with trpA1 RNAi in the ISCs for 7d. N > 7 midguts are analyzed for each genotype. Data are represented as mean ± SEM. (J) Mitosis quantification of midguts overexpressing TRPA1-C, TRPA1-D, or TRPA1-A in ISCs for 7d. N > 5 midguts per genotype are analyzed. Data are represented as mean ± SEM.
-
Figure 4—source data 1
Complete results for Figure 4F–H.
- https://doi.org/10.7554/eLife.22441.015
Figure 4—figure supplement 1
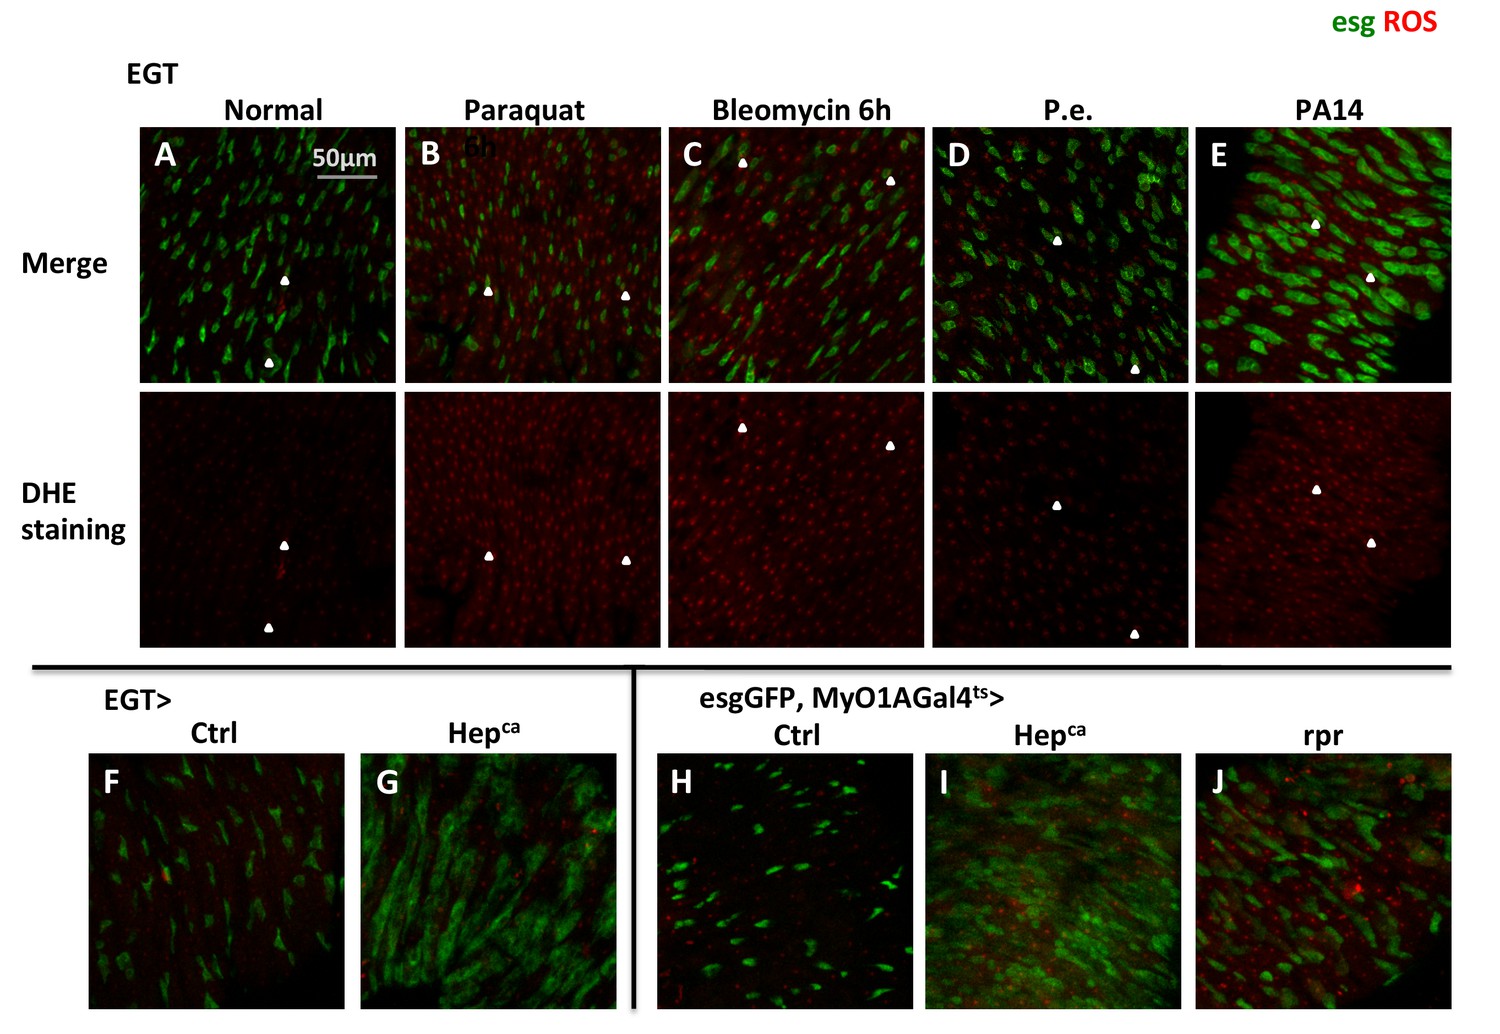
Elevated ROS is a common stress signal in various midgut damage conditions.
(A–E) Dihydro-ethidium (DHE) stainings of live midguts expressing GFP in ISCs for 3d from flies fed with normal food, food containing 2 mM paraquat, 25 µg/ml bleomycin for 6 hr, pathogens Pseudomonas entomophila (P.e.), or Pseudomonas aeruginosa (PA14) for 18 hr. DHE signal channel is shown below the merged image. The control group for Pseudomonas infection, using Bacteria-free LB media, is not shown in the figure because the midgut DHE staining looks the same as flies fed with normal food. Arrowheads highlight examples of stem cells that have high ROS concentration. (F–G) DHE staining of midguts overexpressing active JNKK (Drosophila Hepca) for 1d in ISCs with EGT. (H–J) DHE staining of midguts overexpressing Hepca or cell death gene reaper (rpr) for 2d in ECs with MyO1AGal4ts. esgGFP labels the ISCs.
Figure 5 with 2 supplements
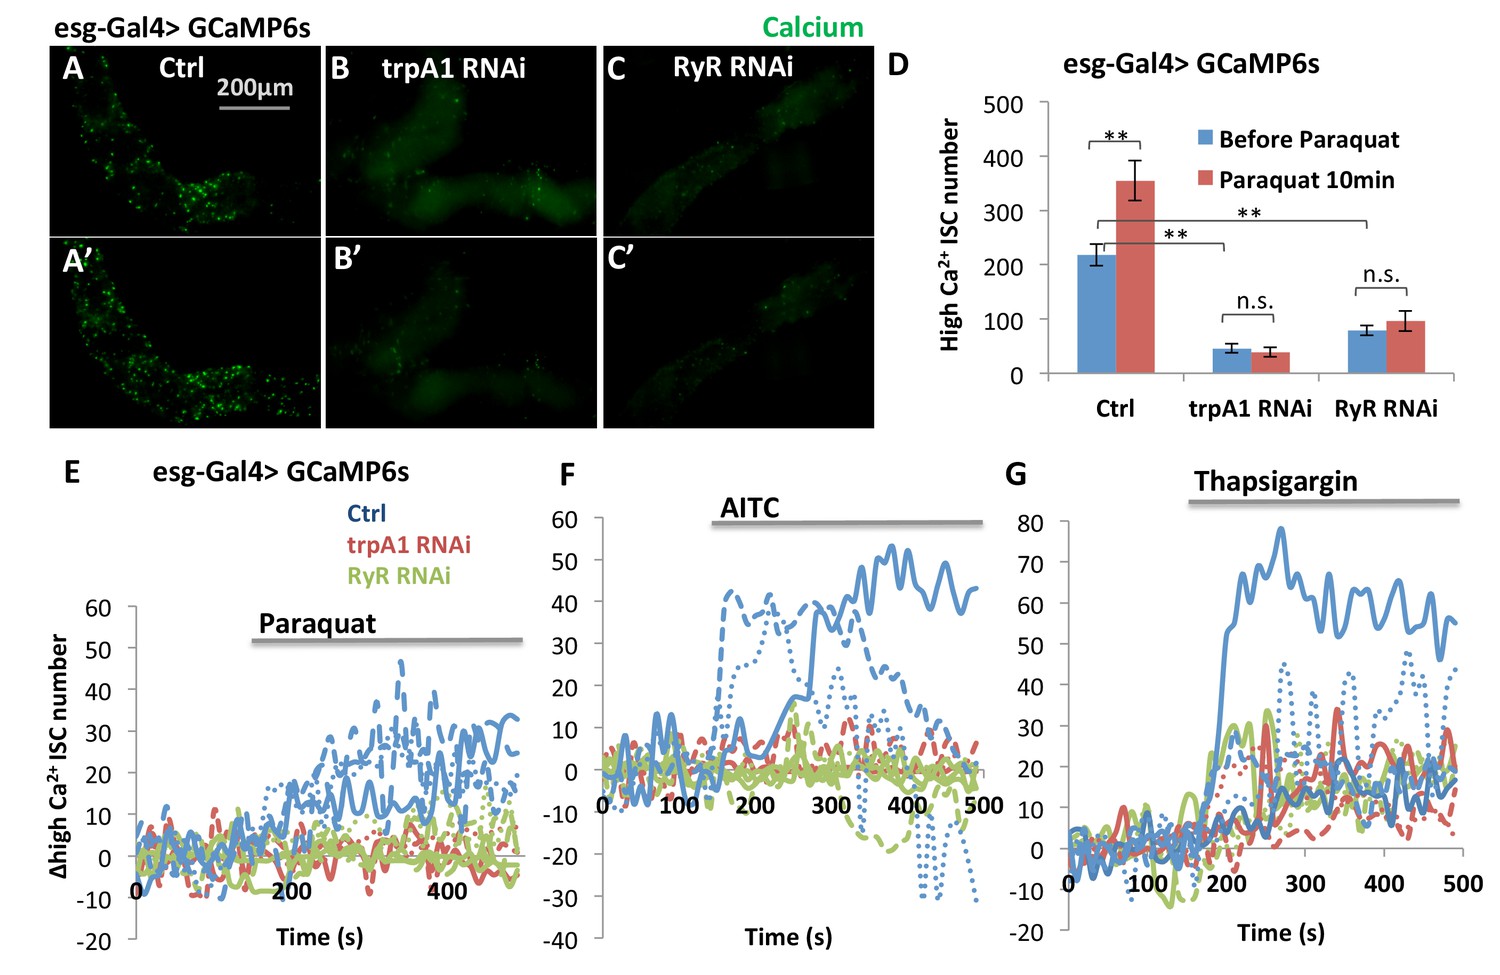
TRPA1 and RyR are required for ROS-mediated Ca2+ increases in ISCs.
(A–C) Imaging of midguts expressing the GCaMP6s reporter alone or together with trpA1 RNAi or RyR RNAi in ISCs. The same guts are imaged again after exposure to 4 mM paraquat in the imaging buffer for 10 min (A’–C’). The images are acquired on a Keyence microscope. (D) Quantification of high Ca2+ (GFP+) stem cells within the posterior midgut region. N > 5 midguts are analyzed for each genotype. Data are represented as mean ± SEM. (E–G) Numeric kinetics of high Ca2+ stem cells in midguts expressing trpA1 RNAi or RyR RNAi in ISCs. Wild-type midguts expressing GCaMP6s alone serve as control. Time-lapse confocal imaging is used for the analysis (see Supplementary Movies). The average number of high Ca2+ stem cells before drug treatment is set as the basal level of 0 for individual imaging experiments. Final concentration of 4 mM paraquat (E), 0.03% AITC (F), 4 µM thapsigargin (G) are added at 150 s. At least three replicates of each genotypes/treatments are shown in the figure, with different colors labeling different genotypes.
-
Figure 5—source data 1
Results for Figure 5D, Figure 5—figure supplement 1D–E, Figure 5—figure supplement 2F.
- https://doi.org/10.7554/eLife.22441.018
Figure 5—figure supplement 1

The total number of ISCs expressing esgGal4>GCamP6s reporter is not significantly reduced by trpA1 RNAi or RyR RNAi.
(A–C) Anti-GFP staining of midguts expressing GCamP6s alone, or together with trpA1 RNAi or RyR RNAi in ISCs detects GCamP6s expression. The images are acquired on a confocal microscope. The relative density of GCamP6s+ (driven by esgGal4) cells, imaged on a Keyence microscope covering most of the posterior midgut region, is quantified in (D) while the total number of GCamP6s+ cells in the posterior midgut region is quantified in (E). N > 8 midguts are analyzed for each genotype. Data are represented as mean ± SEM.
Figure 5—figure supplement 2
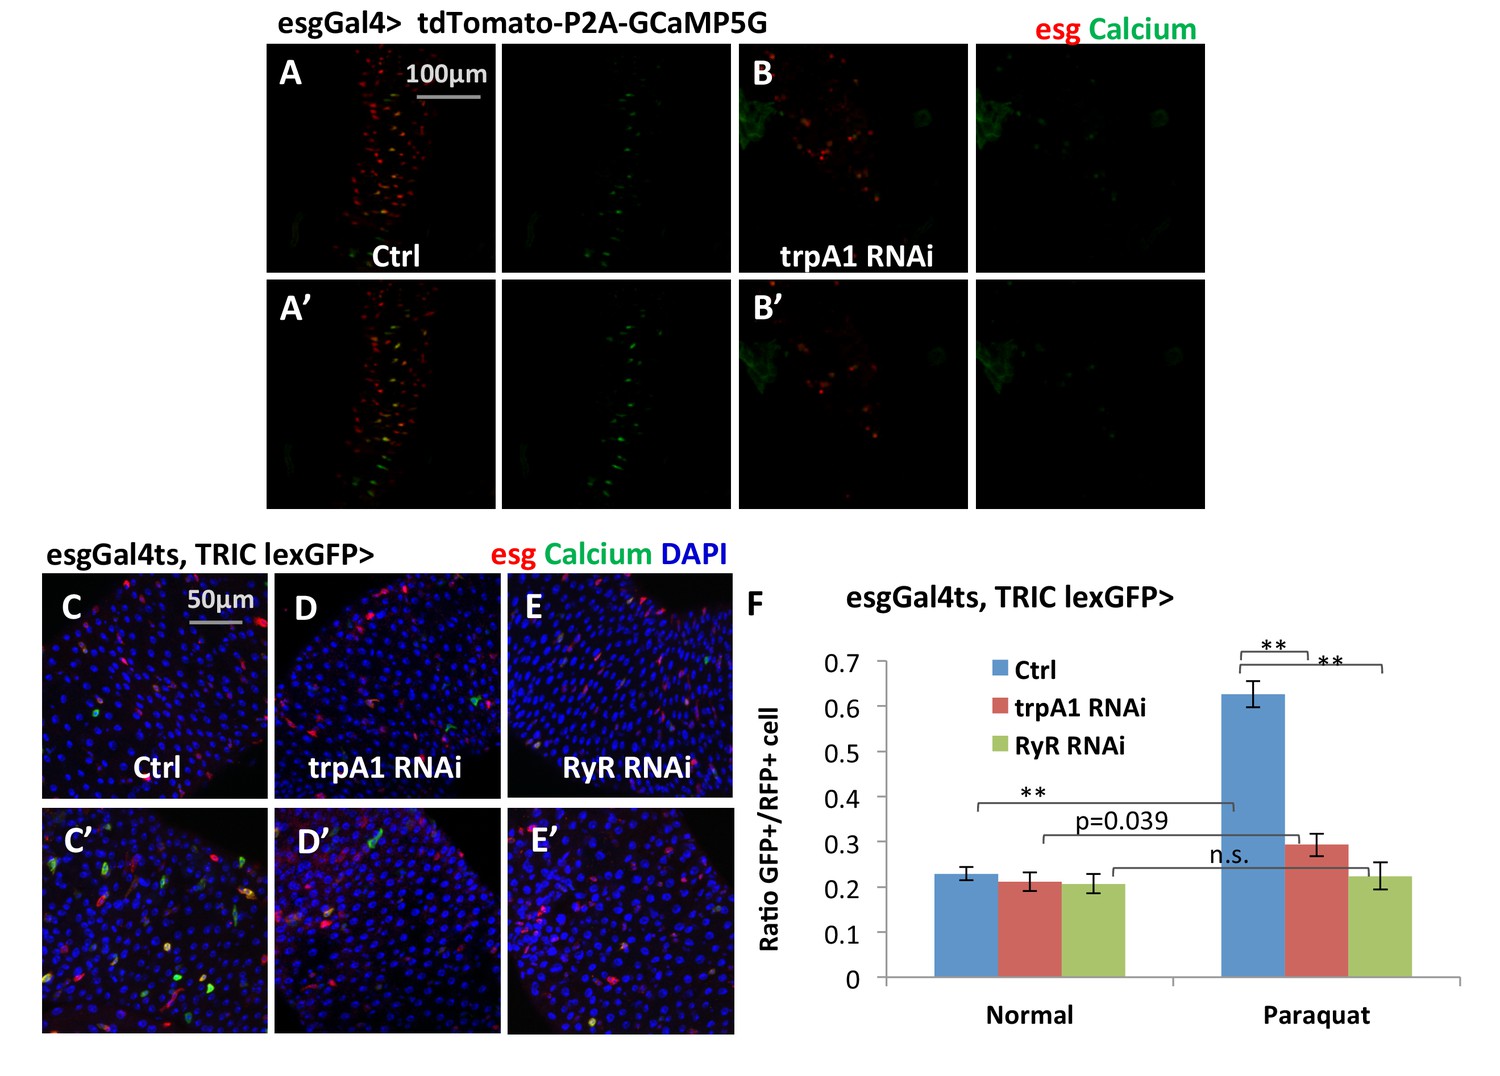
Additional reporters showing that TRPA1 and RyR are required for ROS-mediated Ca2+ increases in ISCs.
(A–B) Confocal calcium imaging of midguts that express bi-cistronic UAS-tdTomato-P2A-GCaMP5G reporter alone or together with trpA1 RNAi in ISCs with exposure to 2 mM paraquat for 5 min (A’–B’). The bi-cistronic reporter consists of tdTomato that labels all cells expressing the reporter, and GCaMP5G whose GFP signal intensity reflects intracellular calcium concentration (Daniels et al., 2014). (C–E) Midguts expressing the TRIC lexGFP calcium reporter alone or together with trpA1 RNAi or RyR RNAi in ISCs for 6d, with the last 1d feeding 2 mM paraquat (C’–E’) are stained to examine stem cell Ca2+ concentration in vivo. The conventional UAS-RFP reporter is used to label all stem cells. (F) Quantification of high Ca2+ stem cells (GFP+) ratio to all stem cells (RFP+) for midguts in experiments (C–E). N = 16, 10, six images are analyzed for the genotypes of control, trpA1 RNAi, and RyR RNAi (half feeding normally, half feeding paraquat for 1d). Data are represented as mean ± SEM.
Figure 6 with 2 supplements
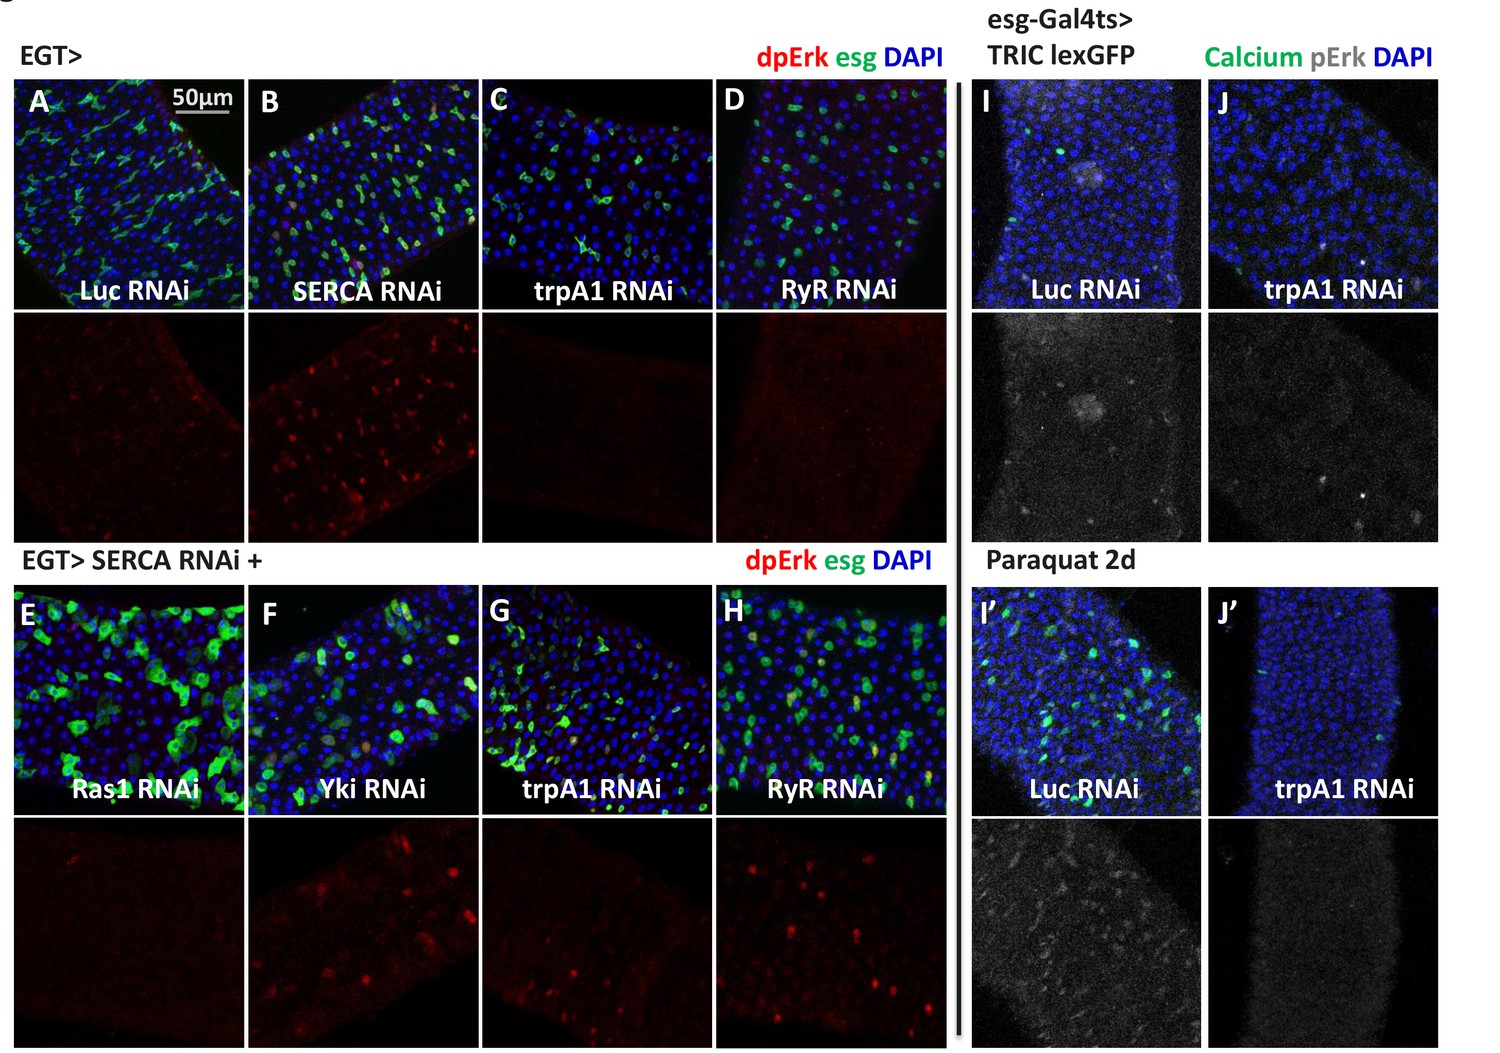
High cytosolic Ca2+ is necessary and sufficient to activate Ras/MAPK in ISCs.
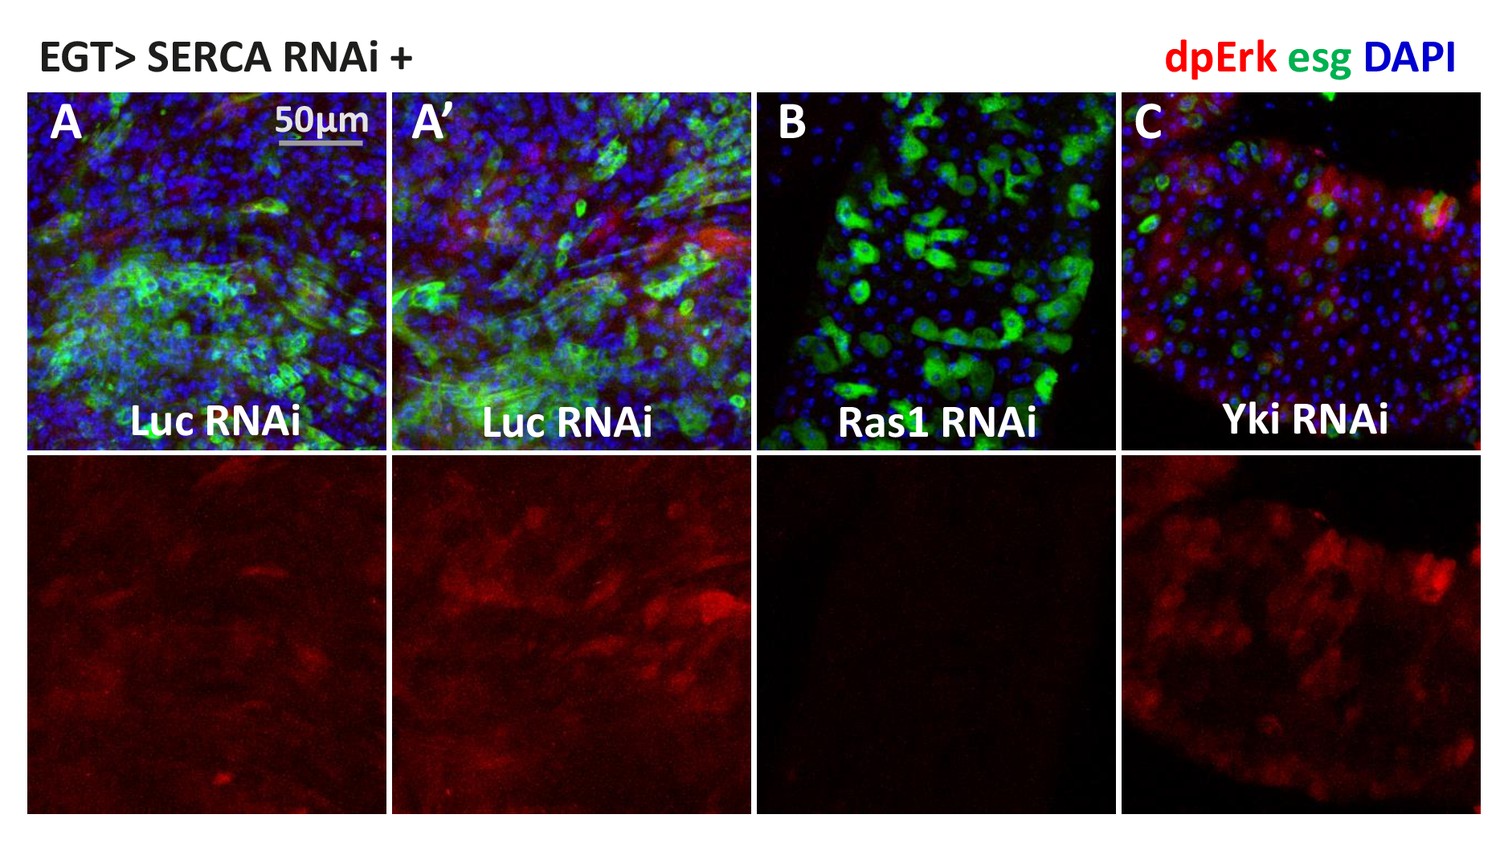
(A–D) Midguts expressing Luc RNAi, SERCA RNAi, trpA1 RNAi, or RyR RNAi in ISCs for 2-3d are stained for the Ras/MAPK activity marker dpErk. The channel of dpErk signal is shown below the merged image. Note trpA1 RNAi group was imaged on a different date, but alongside Luc RNAi which exhibited the same level of pErk signal as the control group presented in A. (E–H) Midguts expressing SERCA RNAi together with Ras1 RNAi, Yki RNAi, trpA1 RNAi, or RyR RNAi in ISCs for 3d are stained for dpErk. The channel of dpErk signal is shown below the merged image. Note trpA1 RNAi group in G was imaged on a different date together with C. (I–J) Midguts expressing the TRIC lexGFP reporter of intracellular calcium concentration and Luc RNAi or trpA1 RNAi Luc in ISCs for 5d, with the last 2d feeding paraquat (I’–J’), are stained for dpErk. The channel of dpErk signal is shown to the right of the merged image. The TRIC lexGFP reporter consists of lexop-GFP, and two split modules of lexA whose assembly is dependent on intracellular calcium concentration.
-
Figure 6—source data 1
Complete results for Figure 6—figure supplement 2H–I.
- https://doi.org/10.7554/eLife.22441.028
Figure 6—figure supplement 1
Prolonged induction of high cytosolic Ca2+ in ISCs results in a nonspecific and variable pattern of Ras/MAPK activation.
(A–C) Midguts expressing SERCA RNAi together with Luc RNAi, Ras1 RNAi, or Yki RNAi in ISCs for 5d are stained for dpErk. The channel of dpErk signal is shown below the merged image. A and A’ are biological replicates of the same genotype showing examples of variation. Although pErk induction is still detectable in some ISCs, the signal intensity varies among different ISCs and different midguts.
Figure 6—figure supplement 2
Src might be a mechanism by which cytosolic Ca2+ can activate Ras/MAPK in ISCs.
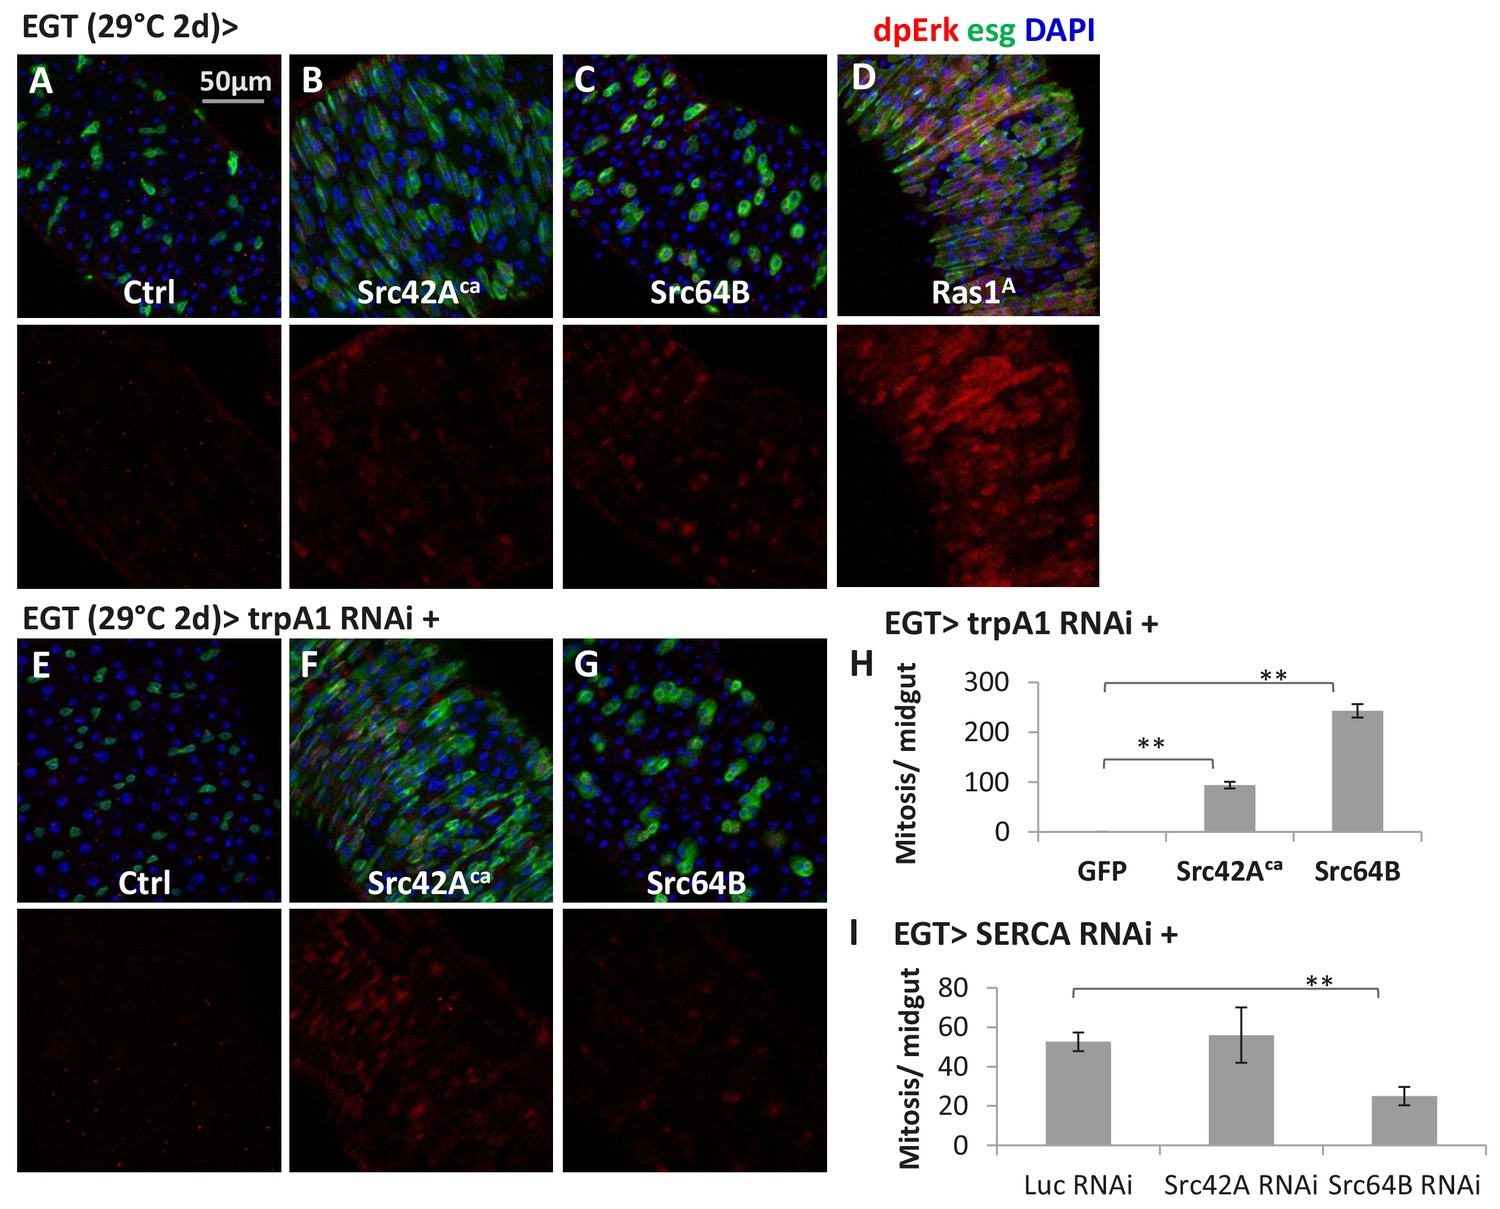
(A–D) Midguts expressing the constitutive active form of Src42A (Src42Aca), Src64B, or Ras1A in ISCs for 2d are stained for the Ras/MAPK activity marker dpErk. The channel of dpErk signal is shown below the merged image. w- genetic background is used as the control for transgenic expression. (E–G) Midguts expressing trpA1 RNAi alone or together with Src42Aca/ Src64B in ISCs for 2d are stained for dpErk. The channel of dpErk signal is shown below the merged image. (H) Mitosis quantification of midguts expressing trpA1 RNAi with GFP, Src42Aca, or Src64B in ISCs for 3d. N > 5 midguts are analyzed for each genotype. Data are represented as mean ± SEM. (I) Mitosis quantification of midguts expressing SERCA RNAi with Luc RNAi, Src42A RNAi, or Src64B RNAi in ISCs for 4d. N > 4 midguts are analyzed for each genotype. Data are represented as mean ± SEM.
Figure 7 with 3 supplements

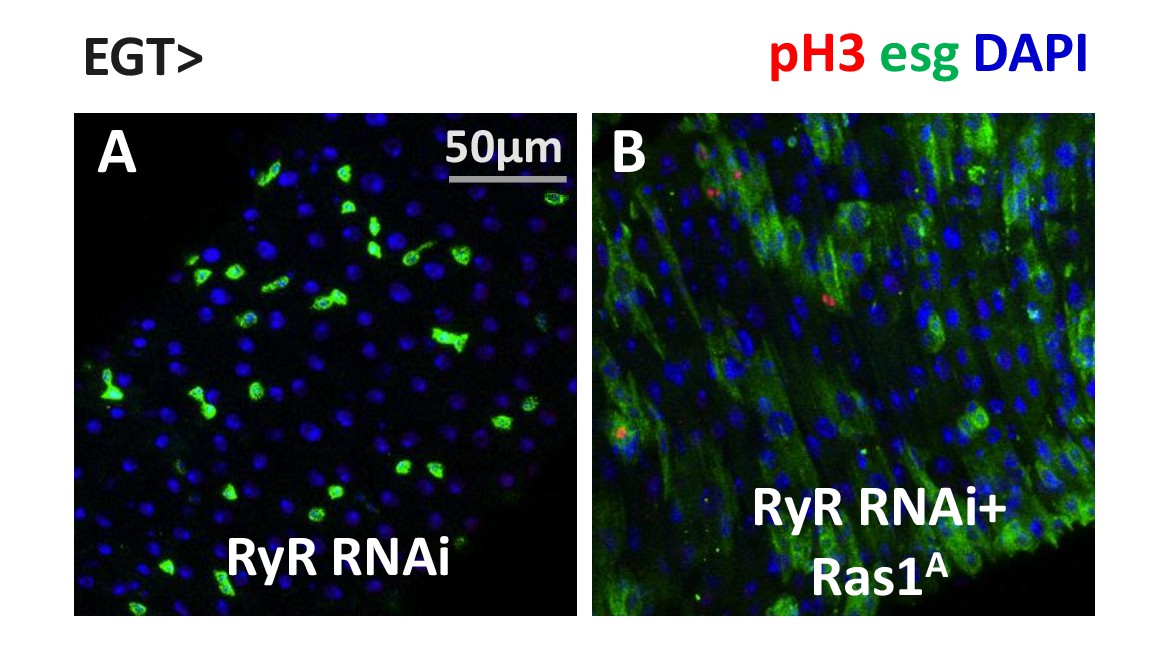
Ras/MAPK activity, not CanA/CRTC/CrebB, is sufficient for ISC proliferation in the absence of TRPA1.
(A–E) Midguts over-expressing calcium responsive signaling molecules such as active Ras1 (Ras1A), constitutively active Calcineurin A1 (CanA1ca), CREB-regulated transcription coactivator (CRTC), or active form of Creb (Crebact) in ISCs for 5d are stained for the mitosis marker pH3. The expansion of esg>GFP signal by CanA1ca is reduced by trpA1 RNAi, although not quite down to the wild-type level. This could be due to the different kinetics of two reagents, as CanA1ca may take effect sooner than trpA1 RNAi. (A’–E’) Midguts expressing trpA1 RNAi together with calcium-responsive signaling molecules in ISCs for 5d are stained for the mitosis marker pH3. (F) Mitosis quantification of midguts expressing GFP, Ras/ Raf, RTK ligands Spi/ Pvf1, CanA1ca, CRTC, Crebact, alone or together with trpA1 RNAi for genetic epistasis analysis. N > 5 midguts are analyzed for each genotype. Data are represented as mean ± SEM. Although it has been reported that pvf1 overexpression can increase ISC population (Bond and Foley, 2012), we could barely detect mitotic effect of Pvf1 in young adult flies.
-
Figure 7—source data 1
Complete results for Figure 7F, Figure 7—figure supplement 1F–G.
- https://doi.org/10.7554/eLife.22441.032
Figure 7—figure supplement 1
Ras/MAPK activity, but not CanA1/CrebB, is required for ISC proliferation induced by calcium influx.
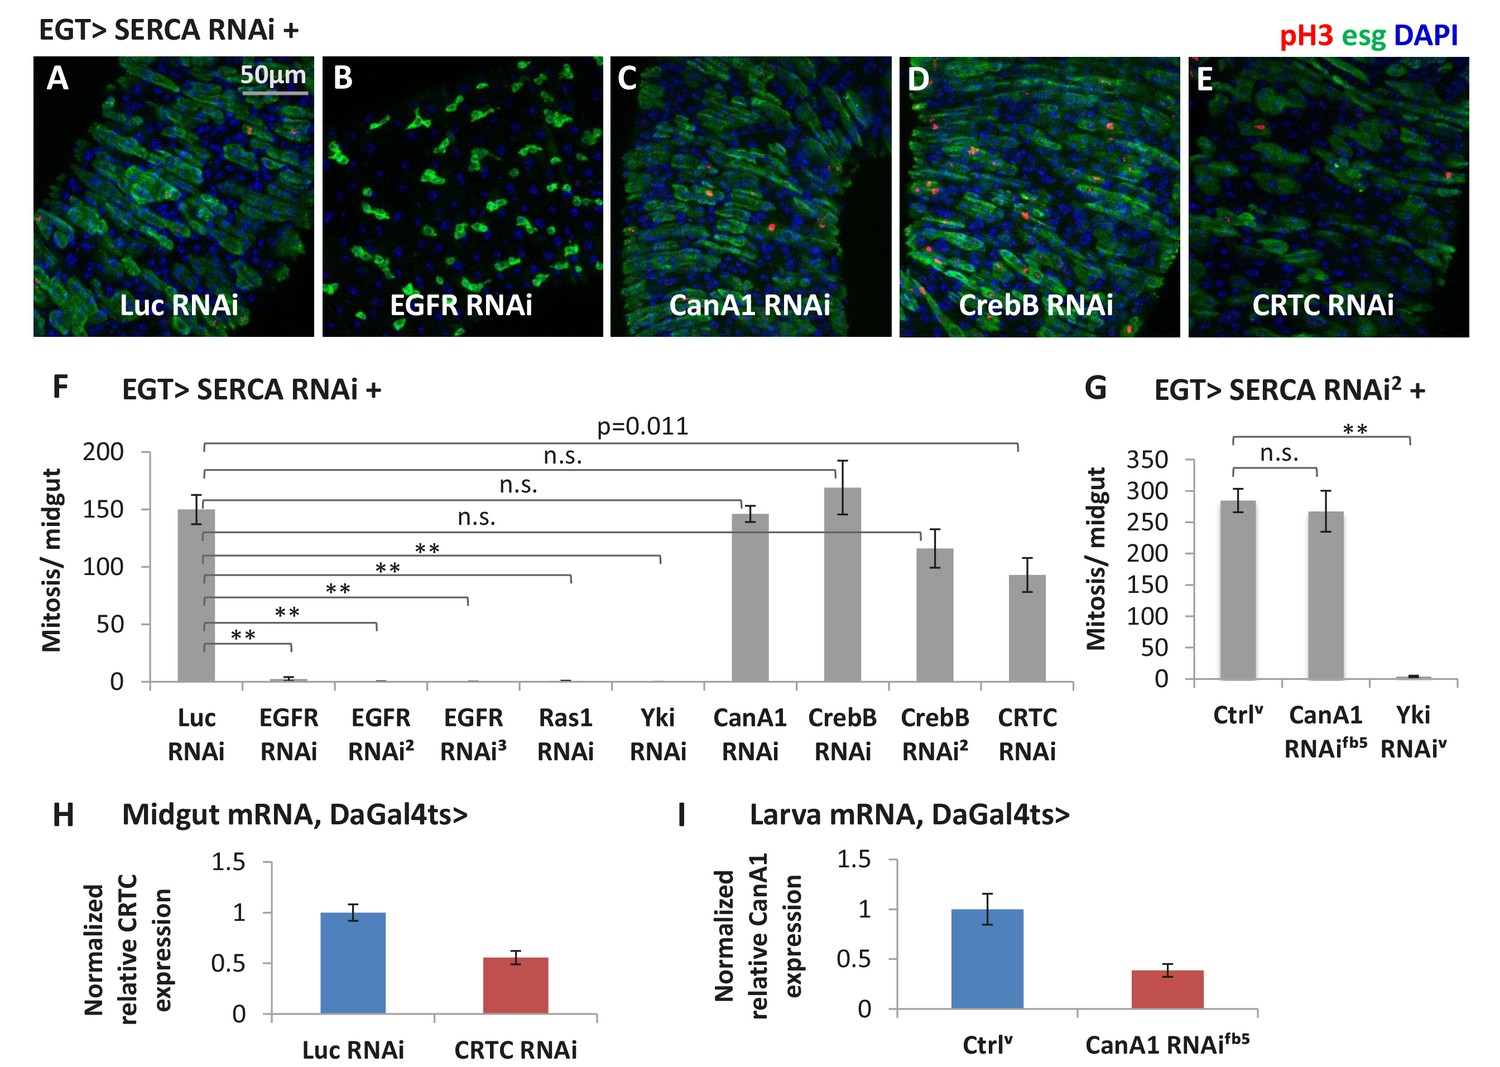
(A–E) Midguts expressing SERCA RNAi together with Luc RNAi, EGFR RNAi, CanA1 RNAi, CrebB RNAi, or CRTC RNAi in ISCs for 3d are stained for mitosis marker pH3. (F) Mitosis quantification of midguts expressing SERCA RNAi together with Luc RNAi, EGFR RNAi (three different lines), Ras1 RNAi, Yki RNAi, CanA1 RNAi, CrebB RNAi (two different lines), or CRTC RNAi in ISCs for 5d. N > 7 midguts are analyzed for each genotype. Data are represented as mean ± SEM. (G) Mitosis quantification of midguts expressing SERCA RNAi2 alone, or together with CanA1 RNAifb5, or Yki RNAiv in ISCs for 5d. N > 5 midguts are analyzed for each genotype. Data are represented as mean ± SEM. For CanA1 RNAi line ‘fb5’, flies with a similar w- genetic background carrying an empty insertional landing site (v60100) are used as the control (Ctrlv). (H) RT-qPCR measurement of CRTC expression in midguts ubiquitously expressing Luc RNAi or CRTC RNAi for 5d. GAPDH and rp49 are used for normalization. The data are presented as mean ± SEM for three technical replicates. (I) RT-qPCR measurement of CanA1 RNAi fb5 knockdown efficiency. L3 larvae expressing RNAi for 2 days are used for better quantification because midgut CanA1 expression is barely detectable. GAPDH and rp49 are used for normalization. The data are presented as mean ± SEM for three technical replicates.
Figure 7—figure supplement 2
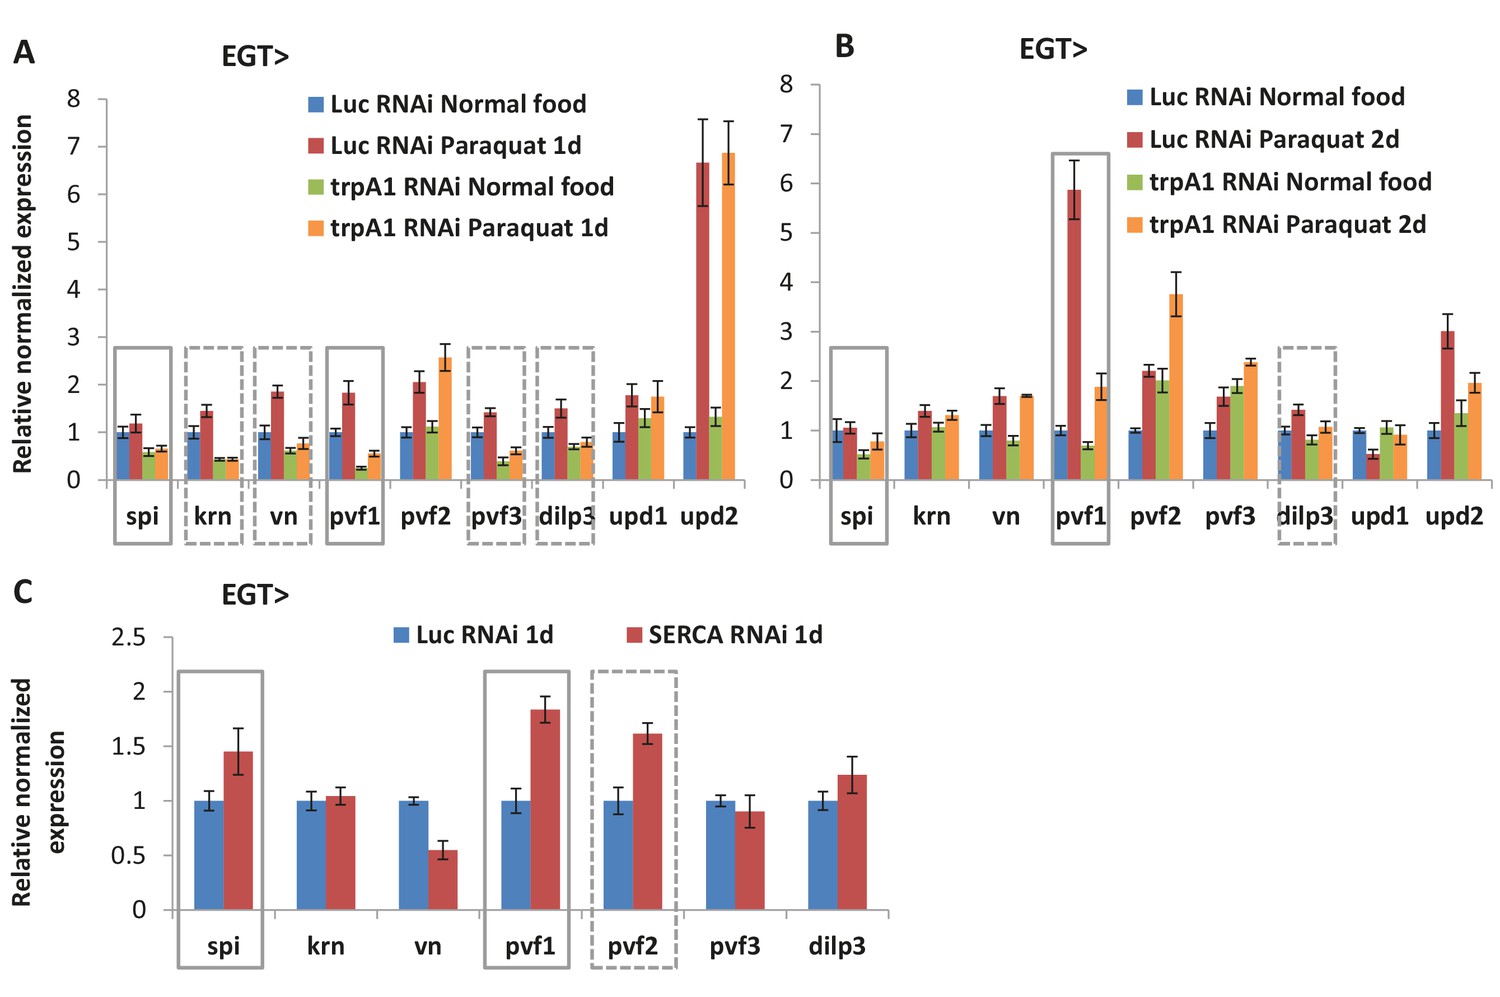
Ligands for receptor tyrosine kinases (RTKs) are affected by cytosolic Ca2+ signaling.
(A) RT-qPCR measurement of midguts expressing Luc RNAi or trpA1 RNAi in ISCs for 6d, with the last day feeding on normal food or paraquat. rp49 is used for normalization. The data are presented as mean ± SEM for three technical replicates. While expression of JAK/ Stat pathway ligands upd1 and upd2 remains unaffected, multiple RTK ligands (spi, krn, vn, pvf1, pvf3, dilp3, highlighted by gray square boxes) are down-regulated by trpA1 RNAi. (B) RT-qPCR measurement of midguts expressing Luc RNAi or trpA1 RNAi in ISCs for 9d, with the last 2d feeding on normal food or paraquat. rp49 is used for normalization. The data are presented as mean ± SEM for three technical replicates. Note that only spi, pvf1, and dilp3 are consistently down-regulated in trpA1 RNAi groups in both (A) and (B). Different trends of krn, vn, and pvf3 expression observed in (B) compared to (A) might suggest a delay, rather than reduction of these ligands by trpA1 RNAi. (C) RT-qPCR measurement of midguts expressing Luc RNAi or SERCA RNAi in ISCs for 1d. Such early time point is chosen empirically to allow for efficient knockdown and avoid confounding effects of signaling pathway cross-activation at later stages of ISC proliferation. rp49 is used for normalization. The data are presented as mean ± SEM for three technical replicates.
Figure 7—figure supplement 3
Ras/MAPK activity is sufficient for ISC proliferation in the absence of RyR.
(A–B) Midguts, expressing RyR RNAi alone, or together with SERCA RNAi in ISCs for 5d, are stained for mitosis marker pH3.
Figure 8

Connection between ROS, intracellular calcium, and stem cell activity.
(A) Under tissue homeostasis conditions, basal levels of ROS and other unidentified stimuli can activate TRPA1 and RyR channels at low levels to allow low levels of cytosolic Ca2+, autocrine EGFR ligand Spi, and Ras/MAPK activity required for stem cell self-renewal and minimal level of proliferation. Solid arrows indicate mechanisms that are either well-characterized (green) or demonstrated in this study; dashed arrows indicate unclear mechanisms inferred from literature or this study. (B) Under various tissue damage conditions, ROS levels dramatically increase and activate TRPA1, especially the D isoform. RyR channel can be activated either directly by ROS or by the initial Ca2+ influx through TRPA1, allowing further calcium release from the ER to the cytosol. High levels of cytosolic Ca2+ activate Ras/MAPK signaling via Src, and further amplify Ras/MAPK signaling via autocrine Spi-EGFR signaling. High EGFR-Ras/MAPK activity triggers ISC proliferation.
Author response image 1

Videos
Video 1
Calcium imaging of ISCs in response to paraquat.
Midguts expressing GCaMP6s reporter in ISCs are dissected and imaged in adult hemolymph-like (AHL) buffer. Z-stack images were acquired with 10 s interval. A maximal intensity z-projection was shown in the movie. A final concentration of 4 mM oxidant agent paraquat was added at 150 s (the 15th frame of the movie).
Video 2
Calcium imaging of ISCs expressing trpA1 RNAi in response to paraquat.
Midguts expressing GCaMP6s reporter together with trpA1 RNAi in ISCs were dissected and imaged in AHL buffer. Z-stack images were acquired with 10 s interval. A maximal intensity z-projection was shown in the movie. A final concentration of 4 mM oxidant agent paraquat was added at 150 s (the 15th frame of the movie).
Video 3
Calcium imaging of ISCs expressing RyR RNAi in response to paraquat.
Midguts expressing GCaMP6s reporter together with RyR RNAi in ISCs were dissected and imaged in AHL buffer. Z-stack images were acquired with 10 s interval. A maximal intensity z-projection was shown in the movie. A final concentration of 4 mM oxidant agent paraquat was added at 150 s (the 15th frame of the movie).
Video 4
Calcium imaging of ISCs in response to AITC.
Midguts expressing GCaMP6s reporter in ISCs are dissected and imaged in AHL buffer. Z-stack images were acquired with 10 s interval. A maximal intensity z-projection was shown in the movie. A final concentration of 0.03% TRPA1 agonist AITC was added at 150 s (the 15th frame of the movie).
Video 5
Calcium imaging of ISCs expressing trpA1 RNAi in response to AITC.
Midguts expressing GCaMP6s reporter together with trpA1 RNAi in ISCs were dissected and imaged in AHL buffer. Z-stack images were acquired with 10 s interval. A maximal intensity z-projection was shown in the movie. A final concentration of 0.03% TRPA1 agonist AITC was added at 150 s (the 15th frame of the movie).
Video 6
Calcium imaging of ISCs expressing RyR RNAi in response to AITC.
Midguts expressing GCaMP6s reporter together with RyR RNAi in ISCs were dissected and imaged in AHL buffer. Z-stack images were acquired with 10 s interval. A maximal intensity z-projection was shown in the movie. A final concentration of 0.03% TRPA1 agonist AITC was added at 150 s (the 15th frame of the movie).
Additional files
-
Supplementary file 1
List of Drosophila genotypes used in each figure.
- https://doi.org/10.7554/eLife.22441.037
Download links
A two-part list of links to download the article, or parts of the article, in various formats.
Downloads (link to download the article as PDF)
Open citations (links to open the citations from this article in various online reference manager services)
Cite this article (links to download the citations from this article in formats compatible with various reference manager tools)
Oxidative stress induces stem cell proliferation via TRPA1/RyR-mediated Ca2+ signaling in the Drosophila midgut
eLife 6:e22441.
https://doi.org/10.7554/eLife.22441


